regional core waiver update · 2015-10-14 · regional core waiver update october 2015 federal and...
TRANSCRIPT
REGIONAL CORE WAIVER UPDATE
October 2015 Federal and State Education Programs (FSEP) Office of Government Relations (OGR) Office of Data and Accountability (ODA) Parent, Community and Student Services (PCSS) Multilingual and Multicultural Education Department (MMED)
1
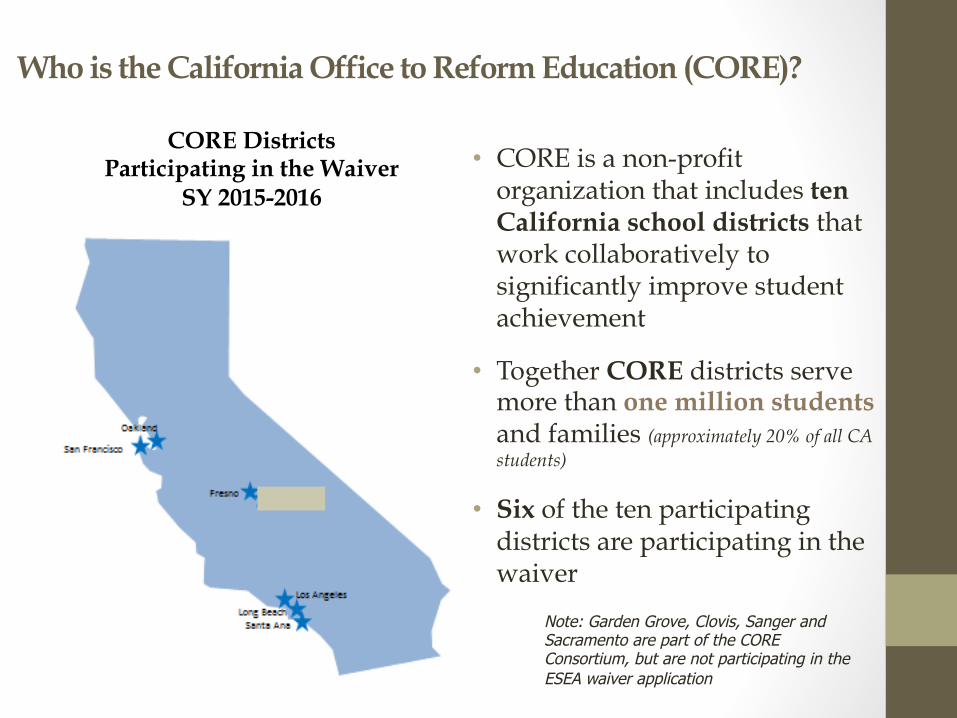
Who is the California Office to Reform Education (CORE)?
• CORE is a non-profit organization that includes ten California school districts that work collaboratively to significantly improve student achievement
• Together CORE districts serve more than one million students and families (approximately 20% of all CA students)
• Six of the ten participating districts are participating in the waiver
Note: Garden Grove, Clovis, Sanger and Sacramento are part of the CORE Consortium, but are not participating in the ESEA waiver application
CORE Districts Participating in the Waiver
SY 2015-2016
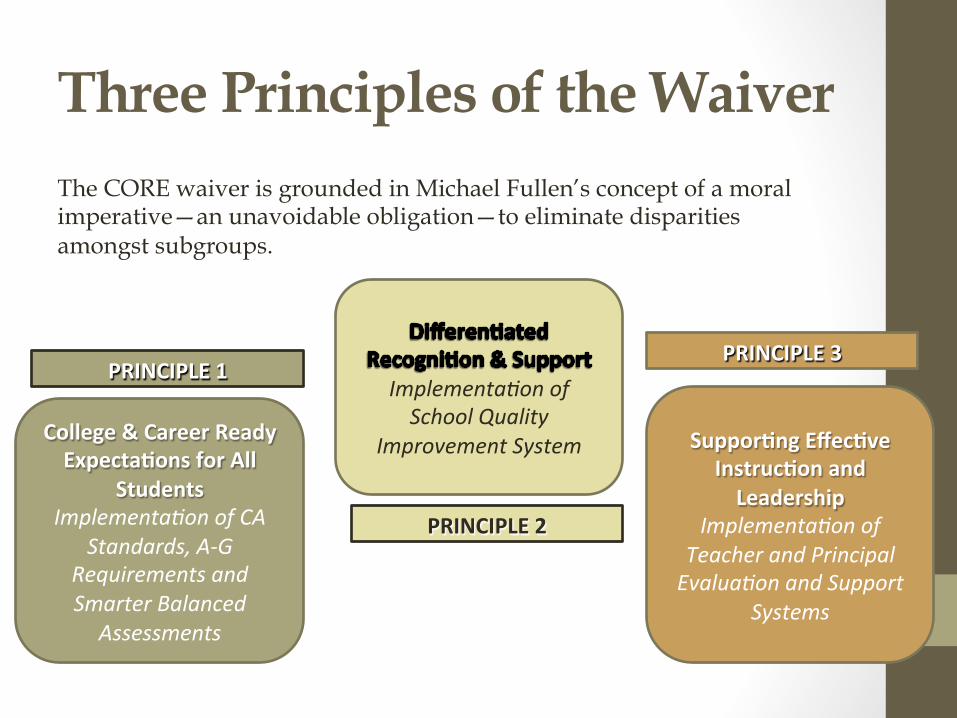
Three Principles of the Waiver The CORE waiver is grounded in Michael Fullen’s concept of a moral imperative—an unavoidable obligation—to eliminate disparities amongst subgroups.
College & Career Ready Expecta2ons for All
Students Implementa)on of CA
Standards, A-‐G Requirements and Smarter Balanced
Assessments
Implementa)on of School Quality
Improvement System Suppor2ng Effec2ve Instruc2on and Leadership
Implementa)on of Teacher and Principal Evalua)on and Support
Systems
PRINCIPLE 1
PRINCIPLE 2
PRINCIPLE 3
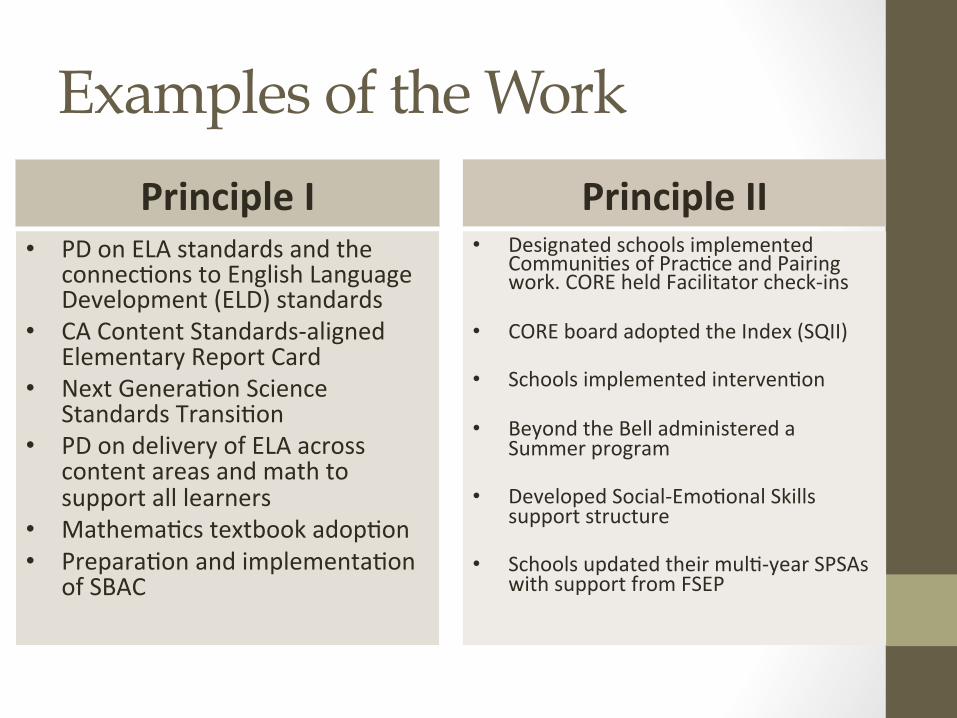
Examples of the Work
Principle I • PD on ELA standards and the
connec1ons to English Language Development (ELD) standards
• CA Content Standards-‐aligned Elementary Report Card
• Next Genera1on Science Standards Transi1on
• PD on delivery of ELA across content areas and math to support all learners
• Mathema1cs textbook adop1on • Prepara1on and implementa1on
of SBAC
Principle II • Designated schools implemented
Communi1es of Prac1ce and Pairing work. CORE held Facilitator check-‐ins
• CORE board adopted the Index (SQII)
• Schools implemented interven1on
• Beyond the Bell administered a Summer program
• Developed Social-‐Emo1onal Skills support structure
• Schools updated their mul1-‐year SPSAs with support from FSEP

Examples of the Work Principle III
• More than 6,000 teachers were evaluated in 2014-‐15
• 99% of principals previously trained are cer1fied to observe teaching prac1ce
• 100% of returning directors are trained and cer1fied to observe principal prac1ce
• More than 350 principals have been iden1fied to par1cipate in EDSSL (for-‐stakes implementa1on) 2015-‐16
• Teachers evaluated using EDST will receive a final overall evalua1on based on three levels
• Principals evaluated using EDSSL will receive a final overall evalua1on based on four levels
General • CORE applied to USED for waiver
renewal in January, and was approved for 1 year as of September 27, 2015.
• Key amendments were approved, including no new designa1ons for this year (all designa1ons will carry forward from last year)
Differentiated Recognition & Support
Implementation of School Quality Improvement System

Differentiated Recognition & Support 2015-16 School Designations (based on data up to 2012-13)
Title I Schools (708) Priority (28)
Low-‐Performing or SIG Cohort 2 Schools
Focus (72) Achievement Gaps
Support* (22)
Collabora1ve Partner (19)
Reward (42) High-‐Performing/High Progress
Other Title I (527) *Support Schools are those that did not meet the API growth or graduation target and are in the bottom 30% - <721.
INTERVENTION
School Pairing
Possible Pairing
School Driven
CoP
CoP
Possible Pairing
ALL SCHOOL LEVELS
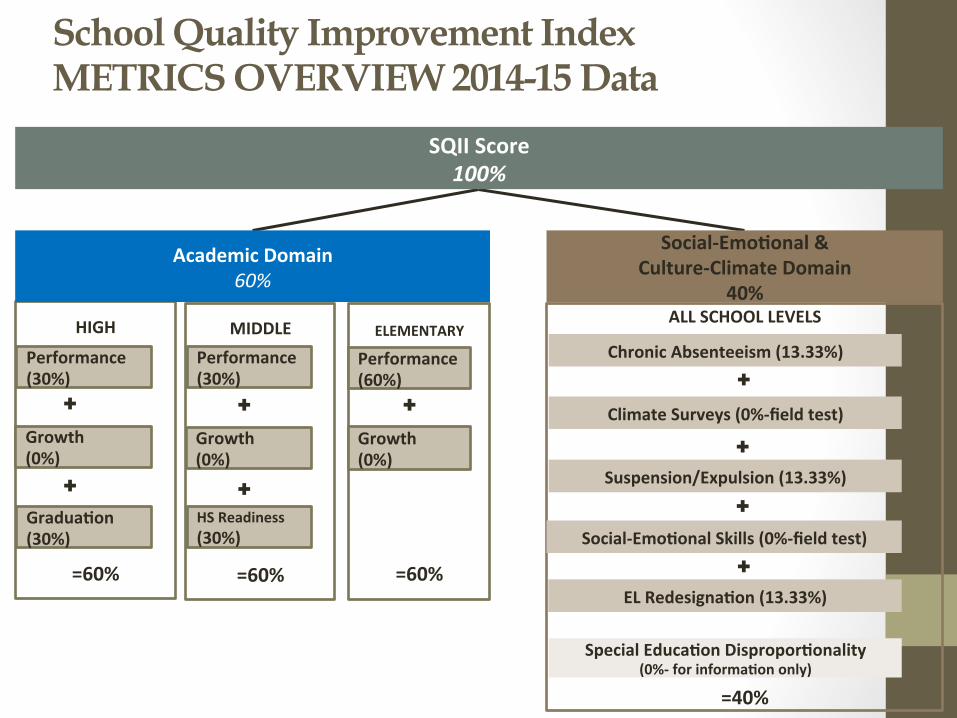
=40%
HIGH
=60%
Social-‐Emo2onal & Culture-‐Climate Domain
40%
Performance (30%)
SQII Score 100%
Chronic Absenteeism (13.33%)
Academic Domain 60%
Climate Surveys (0%-‐field test)
Suspension/Expulsion (13.33%)
Social-‐Emo2onal Skills (0%-‐field test)
EL Redesigna2on (13.33%)
Special Educa2on Dispropor2onality (0%-‐ for informa2on only)
Growth (0%)
Gradua2on (30%)
MIDDLE
=60%
Performance (30%)
Growth (0%)
HS Readiness (30%)
ELEMENTARY
=60%
Performance (60%)
Growth (0%)
School Quality Improvement Index METRICS OVERVIEW 2014-15 Data

ALL SCHOOL LEVELS
=40%
HIGH
=60%
Social-‐Emo2onal & Culture-‐Climate Domain
40%
Performance (20%)
SQII Score 100%
Chronic Absenteeism (8%)
Academic Domain 60%
Climate Surveys (8%)
Suspension/Expulsion (8%)
Social-‐Emo2onal Skills (8%)
EL Redesigna2on (8%)
Special Educa2on Dispropor2onality (0%-‐ for informa2on only)
Growth (20%)
Gradua2on (20%)
MIDDLE
=60%
Performance (20%)
Growth (20%)
HS Readiness (20%)
ELEMENTARY
=60%
Performance (30%)
Growth (30%)
School Quality Improvement Index METRICS OVERVIEW 2015-‐16 + beyond
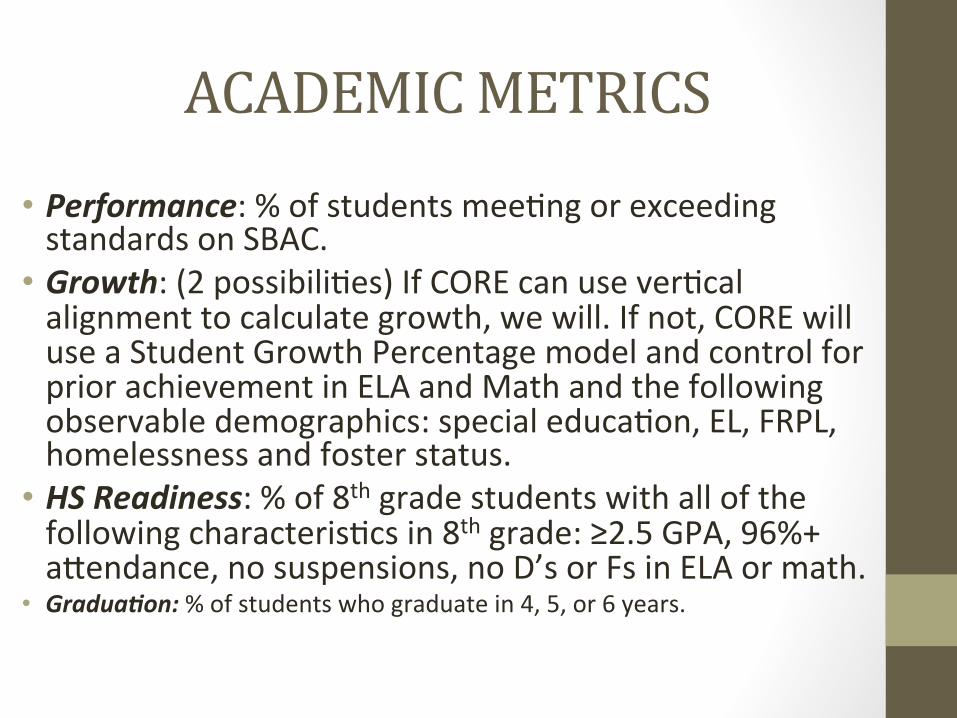
ACADEMIC METRICS
• Performance: % of students mee1ng or exceeding standards on SBAC. • Growth: (2 possibili1es) If CORE can use ver1cal alignment to calculate growth, we will. If not, CORE will use a Student Growth Percentage model and control for prior achievement in ELA and Math and the following observable demographics: special educa1on, EL, FRPL, homelessness and foster status. • HS Readiness: % of 8th grade students with all of the following characteris1cs in 8th grade: ≥2.5 GPA, 96%+ aeendance, no suspensions, no D’s or Fs in ELA or math.
• Gradua9on: % of students who graduate in 4, 5, or 6 years.

SEL and Culture/Climate Metrics
• Chronic Absentee: % of students with ≤90% aeendance. • Suspensions: % of students with a suspension or expulsion. • Climate Surveys: (under development) Score based on parent, staff and student surveys rela1ng to academic environment, sense of belonging, discipline, and social-‐emo1onal security. Is integrated in School Experience Survey.
• Social-‐Emo9onal Skills (under development) Score based on student surveys rela1ng to Growth Mindset, Self Efficacy, Self Management and Social Awareness. Is integrated in School Experience Survey.
• EL Redesigna9on: % of students who reclassified and never became, or are no longer LTELs (i.e. RFEP/RFEP+LTEL)

Ac9vity: Inspect the School Quality Improvement Index (SQII) report card
Materials: Each par1cipant should have a copy of the 5-‐page Index report card. Step 1: Work silently on your own. • What ques1ons do you have or do you an1cipate your schools will have?
Step 2: Partner work • Seek out a partner in the room and discuss your ques1ons. • What remaining ques1ons do you have amer your discussion?

The Report Card: Section by Section
• School-‐wide Results (p. 1-‐2) • Subgroup Results (p. 3-‐4) • Overall Index Score and break-‐down by metric (p. 5)

Demographics and key informa1on about the school are included at the top of the page.
Results for ‘All students’ are
displayed for each of the metrics.

The first 3 columns display results for 2014 and 2015 and
the change between those
years.
For SBAC, we do not have 2014
results.

Performance thresholds for Index levels were set
using mul1ple years of baseline data for all CORE schools.
Levels 1-‐3 are low/below average
Levels 4-‐7 are about average;
Levels 8-‐10 are above average/high.
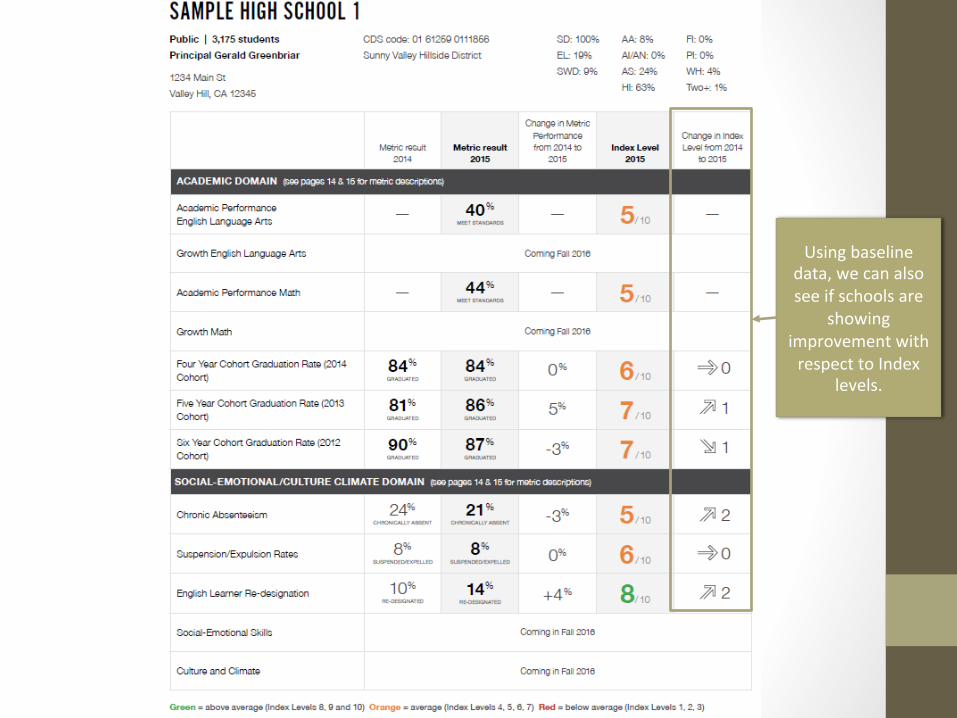
Using baseline data, we can also see if schools are
showing improvement with respect to Index
levels.

These 3 columns show us what
kind of improvement is
needed to advance 1, 2 or 3 Index levels.
We include the 2015 Index Level and
metric result as a reminder.

This page displays results for each
subgroup.
Note: For the racial/ethnic subgroup
category, the Index only factors in the performance of the lowest performing
group.
We include the all students group as a benchmark

This page provides results for each racial/ethnic subgroup.
Remember: we only use the results for the
lowest performing racial/ethnic
subgroup in the Index.

The overall Index Score is at the top
of the page.
Note: The Index score for span schools will be based on a
weighted average of their Index results for each school
type.

ALL SCHOOL LEVELS
=40%
HIGH
=60%
Social-‐Emo2onal & Culture-‐Climate Domain
40%
Performance (30%)
SQII Score 100%
Chronic Absenteeism (13.33%)
Academic Domain 60%
Climate Surveys (0%-‐field test)
Suspension/Expulsion (13.33%)
Social-‐Emo2onal Skills (0%-‐field test)
EL Redesigna2on (13.33%)
Special Educa2on Dispropor2onality (0%-‐ for informa2on only)
Growth (0%)
Gradua2on (30%)
MIDDLE
=60%
Performance (30%)
Growth (0%)
HS Readiness (30%)
ELEMENTARY
=60%
Performance (60%)
Growth (0%)
School Quality Improvement Index METRICS OVERVIEW 2014-‐15 Data

Points earned are calculated by taking:
Index Level x Weight x 10

Longer Version of the Report Includes: • Current school designa1ons and the reason for the designa1on.
• Status against prospec1ve designa1on criteria in Fall 2016. • Defini1ons, descrip1ons and informa1on about performance thresholds.
• For up addi1onal informa1on about the report card, including details about calcula1ons, subgroups, etc., see CORE’s technical guide at: hep://bit.ly/indextechguide2015.

Activity: Inspire impactful change at your schools
• How can the available data/outcomes be utilized as a catalyst for change?
• How can you steer the conversation away from getting into the weeds of how scores were calculated and back to the primary focus of identifying instructional priorities and developing a plan?
• For those who have a strong need to dive deeply into an
understanding of the data, what can we provide as a resource?

School Quality Improvement Report Cards
• Why is CORE releasing report cards this fall? • The USED requires a reporting mechanism as part of the ESEA Waiver. • Though the 2014-15 Index will not affect current designations, the 2015-16
Index and metrics will. • As a resource for plan-writing.
• Which schools will get one? • Reports will be available for all schools not just Title I schools.
• What will be made available to schools ? • CORE is producing a short 5-page version and a longer 15-page version.
• What is included in the 5-page report? • School-wide results on each of the metrics. • Subgroup results on each of the metrics. • The school’s overall index score with metric-by-metric breakdowns.

School Quality Improvement Report Cards
• When will the reports be available? • Preliminary reports will be available late
October. • Reports are released to the public early
December.
• Where will I find them? • Released publicly on CORE website after
preview period, but we will also post them on LAUSD.net.

LCFF: New State Funding Formula
New funding results in new accountability for targeted youth
What do we already know about the Local Control Funding Formula (LCFF)?
What is the LCAP?
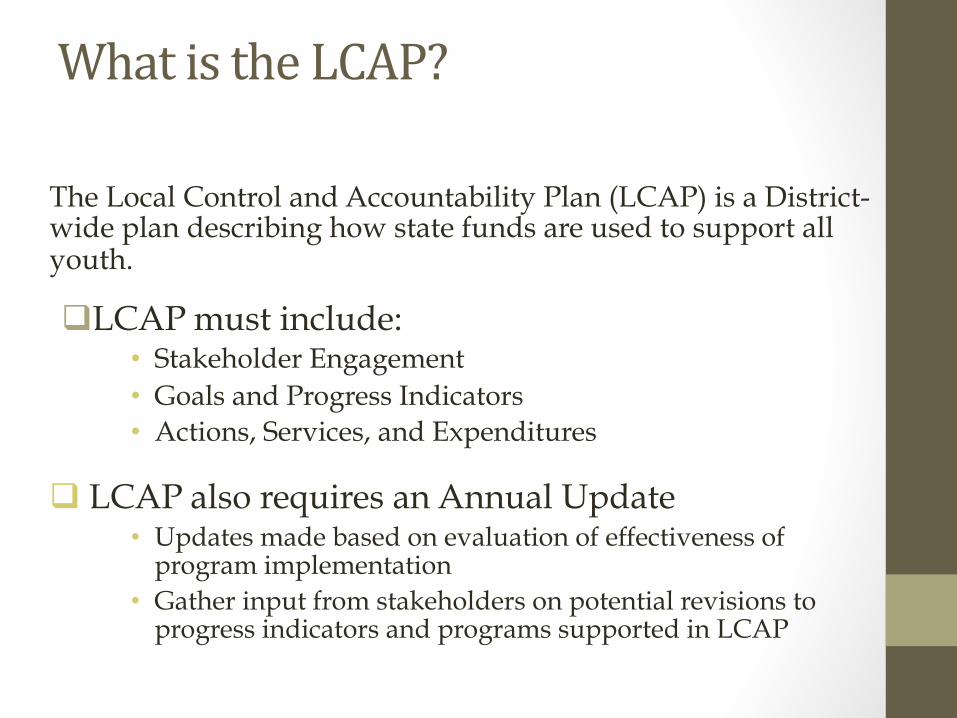
The Local Control and Accountability Plan (LCAP) is a District-wide plan describing how state funds are used to support all youth.
q LCAP must include: • Stakeholder Engagement • Goals and Progress Indicators • Actions, Services, and Expenditures
q LCAP also requires an Annual Update • Updates made based on evaluation of effectiveness of
program implementation • Gather input from stakeholders on potential revisions to
progress indicators and programs supported in LCAP
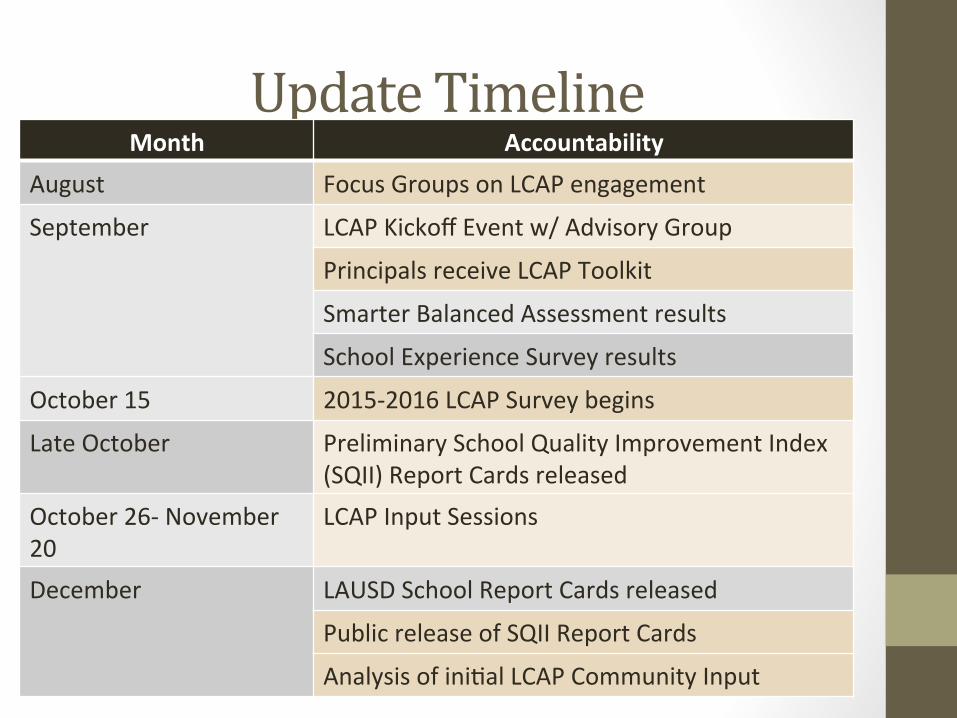
Update Timeline Month Accountability
August Focus Groups on LCAP engagement
September LCAP Kickoff Event w/ Advisory Group
Principals receive LCAP Toolkit
Smarter Balanced Assessment results
School Experience Survey results
October 15 2015-‐2016 LCAP Survey begins
Late October Preliminary School Quality Improvement Index (SQII) Report Cards released
October 26-‐ November 20
LCAP Input Sessions
December LAUSD School Report Cards released
Public release of SQII Report Cards
Analysis of ini1al LCAP Community Input

Update Timeline Month Accountability
December-‐January Principals host School Report Card conversa1ons January-‐February LCAP community recommenda1ons shared with
District leadership and community February Budget development begins
2015-‐16 School Experience Survey administered March LCAP budget update events April Official PAC and DELAC comment period on LCAP May Superintendent responds to PAC-‐DELAC comments June 14 & 21 Public Hearings at LAUSD Board of Educa1on June 30 Deadline for LCAP adop1on
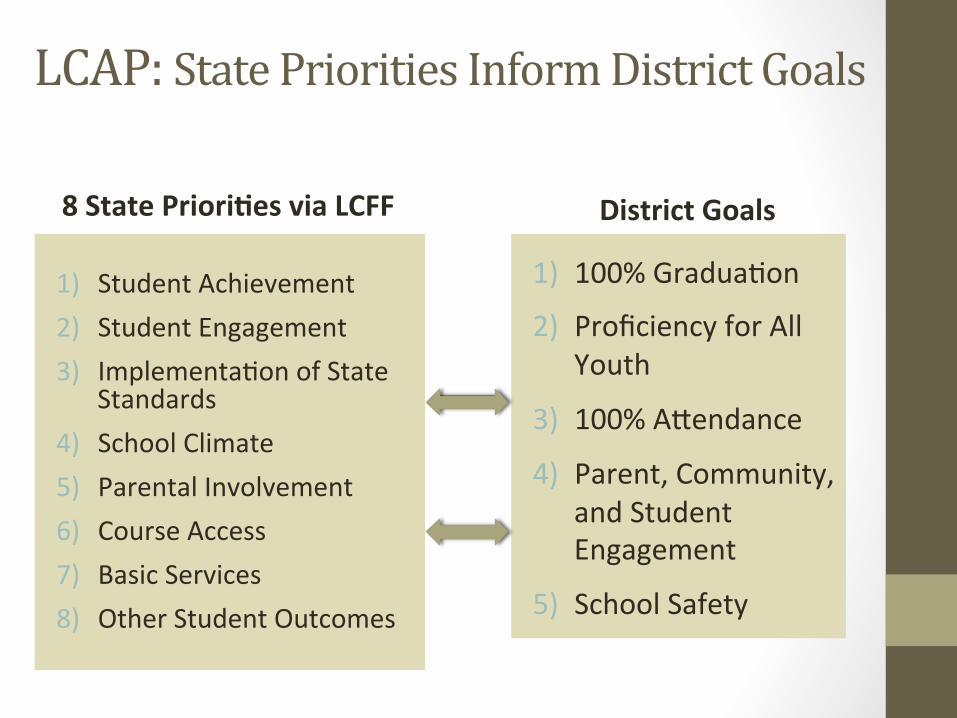
LCAP: State Priorities Inform District Goals
1) 100% Gradua1on 2) Proficiency for All
Youth
3) 100% Aeendance 4) Parent, Community,
and Student Engagement
5) School Safety
1) Student Achievement 2) Student Engagement 3) Implementa1on of State
Standards 4) School Climate 5) Parental Involvement 6) Course Access 7) Basic Services 8) Other Student Outcomes
8 State Priori2es via LCFF District Goals

LCAP Metrics Student Achievement
Student Suspensions
Student Expulsions
School Climate Surveys
English Learner Reclassifica2on
Special Educa2on Dispropor2onality
Aaendance
SQI Index Metrics Student Achievement
Student Suspensions
Student Expulsions
School Climate Surveys
English Learner Reclassifica2on
Special Educa2on Dispropor2onality
Aaendance
Shared Accountability
Metrics
Alignment between LCAP and SQII

Interconnectedness of the LCAP and SQII
34

Index Rollout: Group Planning
Questions for discussion: 1. Which school stakeholders need to know this information?
2. What will you share? 3. How will you inform stakeholder groups? 4. What challenges might you encounter? 5. What support can various District offices provide?