regional education indicators project
TRANSCRIPT


Regional Education Indicators Project
SUMMIT OF THE AMERICAS
EDUCATIONAL PANORAMA 2010:remaining challenges

2
CREDITs
Report prepared for the Summit of the Americas Regional Education Indicators Project – PRIE.
General coordination: Secretariat of Public Education (SEP), Mexico Minister Alonso Lujambio Irazábal, Secretary Lic. Francisco Ciscomani Freane, Head of Policy Evaluation and Planning Unit Ana María Aceves Estrada, General Director of Policy Assessment Ambassador Mario Chacón Carrillo, General Director of International Relations
Technical coordination: Regional Bureau of Education for Latin America and the Caribbean of the United Nations Educational, Scientific and Cultural Organization (OREALC UNESCO/Santiago) with the collaboration of the UNESCO Institute for Statistics (UIS) in Montreal. Technical workgroup:
Atilio Pizarro, Head of the Planning, Management, Monitoring and Evaluation Section, OREALC/UNESCO Santiago Juan Cruz Perusia, Regional Advisor of the UIS for Latin America and the Caribbean, OREALC/UNESCO Santiago Iván Castro de Almeida, Consultant, OREALC UNESCO/Santiago Anne-Marie Lacasse, Assistant Programme Specialist for Educational Statistics, UIS, OREALC/UNESCO Santiago Anton Körner, Consultant, OREALC UNESCO/Santiago Susana Pascual, Consultant OREALC UNESCO/Santiago Marcela Copetta. Administrative assistant, OREALC UNESCO/Santiago
Steering Committee: Mexico: Ana María Aceves Estrada, Director General of Policy Assessment, Secretariat of Public Education (SEP) Trinidad & Tobago: Lenor Baptiste-Simmons, Director for Educational Planning (a.i.), Ministry of Science, Technology and
Higher Education El Salvador: Ricardo Cruz, Statistics Unit, Ministry of Education Colombia: Javier Torres Paez, Director General of the Advisory Bureau for Planning and Finance Argentina: Marcela Jáuregui, Coordinator of the Information and Evaluation Unit for Quality in Education, DINIECE, Science
and Technology for the Nation, Ministry of Education Leonore Yaffee García, Director of the Department of Education and Culture of the Organization of American States – OAS.
Special collaboration by: Ecuador: María Verónica Falconi, Undersecretary of Institutional Development, Ministry of Education. Paraguay: Dalila Zarza, Director for Educational Statistics, Ministry of Education and Culture Suriname: Prya Hirasing, Director for Research and Planning, Ministry of Education
English translation: Anton Körner and Christine Stein.Editorial revision: Rip KellerDesign and layout: Marcela Veas
Those conducting the project are responsible for the contents of this report. The opinions expressed herein are not necessarily those of the Secretariat of Public Education of Mexico or of UNESCO, and therefore neither these institutions nor of any of the organizations supporting the project are responsible for the views expressed here.
The place names used in this publication do not imply any position in regard to the legal status of the countries, cities, territories, or areas cited, nor of their authorities, boundaries, or limits.
© UNESCO and Secretaría de Educación Pública de MéxicoISBN: 00-00-000

�
This publication is available on-line at http://www.prie.oas.org and http://www.unesco.cl and may be quoted provided that the source is duly cited.
The Regional Education Indicators Project of the Summit of the Americas (PRIE) exists thanks to contributions from the Secretariat of Public Education (SEP) of Mexico, the Organization of American States (OAS), and UNESCO through its Institute for Statistics (UIS) and its Regional Bureau of Education for Latin America and the Caribbean (OREALC/UNESCO, Santiago)
August 2010


�
TAbLE Of CONTENTs
PREFACE . . . . . . . . . . . . . . . . . . . . . . . . . . . . . . . . . . . . . . . . . . . . . . . . . . . . . . . . . . . . . . . . . . . . . . . . . . . .11
INTRODUCTION . . . . . . . . . . . . . . . . . . . . . . . . . . . . . . . . . . . . . . . . . . . . . . . . . . . . . . . . . . . . . . . . . . . . . . .13
ExECUTIVE SUMMARY . . . . . . . . . . . . . . . . . . . . . . . . . . . . . . . . . . . . . . . . . . . . . . . . . . . . . . . . . . . . . . . . .15
1 STATISTICS, DATA ANALYSIS AND DECISION MAKING . . . . . . . . . . . . . . . . . . . . . . . . . . . . . . . . . . .19
2 DEMOGRAPHIC, ECONOMIC AND SOCIAL CONTExT IN THE AMERICAS . . . . . . . . . . . . . . . . . . . . . .21
3 PROGRESS TOwARD THE GOALS . . . . . . . . . . . . . . . . . . . . . . . . . . . . . . . . . . . . . . . . . . . . . . . . . . . . .25
3.1 Goal 1: Universal access to and enrolment in quality primary education . . . . . . . . . . . . . . . . . . . . . . .253.1.1 Access to primary education and repetition of first grade . . . . . . . . . . . . . . . . . . . . . . . . . . . . .253.1.2 Completion of primary education . . . . . . . . . . . . . . . . . . . . . . . . . . . . . . . . . . . . . . . . . . . . . . . .303.1.3 Parity in primary education . . . . . . . . . . . . . . . . . . . . . . . . . . . . . . . . . . . . . . . . . . . . . . . . . . . . .313.1.4 Achievements in primary education – the SERCE Study . . . . . . . . . . . . . . . . . . . . . . . . . . . . . . .36
3.2 Goal 2: Access of at least 75% of young people to quality secondary education with increasing completion rates . . . . . . . . . . . . . . . . . . . . . . . . . . . . . . . . . . . . . . . . . . . . . . . . . . . . . . . . . . . . . . . . .423.2.1 Access to secondary education . . . . . . . . . . . . . . . . . . . . . . . . . . . . . . . . . . . . . . . . . . . . . . . . . .433.2.2 Completion of lower secondary education (ISCED 2) . . . . . . . . . . . . . . . . . . . . . . . . . . . . . . . . .443.2.3 Parity in lower secondary education (ISCED 2) . . . . . . . . . . . . . . . . . . . . . . . . . . . . . . . . . . . . . .463.2.4 Completion of upper secondary education (ISCED 3) . . . . . . . . . . . . . . . . . . . . . . . . . . . . . . . . .493.2.5 Parity in the completion of upper secondary education (ISCED 3) . . . . . . . . . . . . . . . . . . . . . . .503.2.6 Achievements in secondary education – the PISA Study . . . . . . . . . . . . . . . . . . . . . . . . . . . . . .54
3.3 Goal 3: Offering lifelong educational opportunities to the general population . . . . . . . . . . . . . . . . . .573.3.1 Access to tertiary education . . . . . . . . . . . . . . . . . . . . . . . . . . . . . . . . . . . . . . . . . . . . . . . . . . . .583.3.2 Educational attainment of the population . . . . . . . . . . . . . . . . . . . . . . . . . . . . . . . . . . . . . . . . . .593.3.3 Literacy in Latin America and the Caribbean . . . . . . . . . . . . . . . . . . . . . . . . . . . . . . . . . . . . . . .60
4 EARLY CHILDHOOD CARE AND EDUCATION (ECCE) . . . . . . . . . . . . . . . . . . . . . . . . . . . . . . . . . . . . . . .63
4.1 The concept of ECCE . . . . . . . . . . . . . . . . . . . . . . . . . . . . . . . . . . . . . . . . . . . . . . . . . . . . . . . . . . . . . . .634.2 ECCE in the international framework . . . . . . . . . . . . . . . . . . . . . . . . . . . . . . . . . . . . . . . . . . . . . . . . . .644.3 Information systems and ECCE . . . . . . . . . . . . . . . . . . . . . . . . . . . . . . . . . . . . . . . . . . . . . . . . . . . . . . .654.4 The state of pre-primary education . . . . . . . . . . . . . . . . . . . . . . . . . . . . . . . . . . . . . . . . . . . . . . . . . . . .654.5 ECCE programmes and policies . . . . . . . . . . . . . . . . . . . . . . . . . . . . . . . . . . . . . . . . . . . . . . . . . . . . . . .68
5 OTHER FACTORS RELATED TO PROGRESS IN EDUCATION . . . . . . . . . . . . . . . . . . . . . . . . . . . . . . . . . .71
5.1 Investing in education . . . . . . . . . . . . . . . . . . . . . . . . . . . . . . . . . . . . . . . . . . . . . . . . . . . . . . . . . . . . . .715.2 Education and the economic crisis . . . . . . . . . . . . . . . . . . . . . . . . . . . . . . . . . . . . . . . . . . . . . . . . . . . .72
�
5.3 Pupil/teacher ratios . . . . . . . . . . . . . . . . . . . . . . . . . . . . . . . . . . . . . . . . . . . . . . . . . . . . . . . . . . . . . . .735.4 Teacher training . . . . . . . . . . . . . . . . . . . . . . . . . . . . . . . . . . . . . . . . . . . . . . . . . . . . . . . . . . . . . . . . . .74
6 CONCLUSIONS . . . . . . . . . . . . . . . . . . . . . . . . . . . . . . . . . . . . . . . . . . . . . . . . . . . . . . . . . . . . . . . . . . .77
REFERENCES . . . . . . . . . . . . . . . . . . . . . . . . . . . . . . . . . . . . . . . . . . . . . . . . . . . . . . . . . . . . . . . . . . . . . . . . .81
APPENDICES . . . . . . . . . . . . . . . . . . . . . . . . . . . . . . . . . . . . . . . . . . . . . . . . . . . . . . . . . . . . . . . . . . . . . . . . .83
A Country profiles . . . . . . . . . . . . . . . . . . . . . . . . . . . . . . . . . . . . . . . . . . . . . . . . . . . . . . . . . . . . . . . . . . .83B Reader’s guide . . . . . . . . . . . . . . . . . . . . . . . . . . . . . . . . . . . . . . . . . . . . . . . . . . . . . . . . . . . . . . . . . .101C SERCE proficiency levels . . . . . . . . . . . . . . . . . . . . . . . . . . . . . . . . . . . . . . . . . . . . . . . . . . . . . . . . . .105D PISA proficiency levels . . . . . . . . . . . . . . . . . . . . . . . . . . . . . . . . . . . . . . . . . . . . . . . . . . . . . . . . . . . .111E Data tables . . . . . . . . . . . . . . . . . . . . . . . . . . . . . . . . . . . . . . . . . . . . . . . . . . . . . . . . . . . . . . . . . . . . .115
LiST of GrAphS, TAbLeS And boxeS
GRAPHS AND TABLES
Graph 2.1 Human development index and GDP per capita. 2007. . . . . . . . . . . . . . . . . . . . . . . . . . . . . .22Graph 2.2 Potential demand for primary and lower secondary education and GDP per capita. 2007. .22Graph 2.3 Potential demand for upper secondary education and GDP per capita. 2007. . . . . . . . . . . .23Graph 3.1.1 Net intake rates in primary education. 2008. . . . . . . . . . . . . . . . . . . . . . . . . . . . . . . . . . . . .26Graph 3.1.2 Evolution of adjusted net enrolment rates in primary education. 2000-2008. . . . . . . . . . . .27Graph 3.1.3 Variation of adjusted net enrolment rates in primary education. 2000-2008. . . . . . . . . . . . .27Graph 3.1.4 Percentage of repeaters in the first grade of primary education. 2008. . . . . . . . . . . . . . . . .29Graph 3.1.5 Primary completion rate (ISCED 1). Comparison between three age groups. 2008. . . . . . . .30Graph 3.1.6 Primary completion rate (ISCED 1). 2008. Variation between different age groups.
Group I: Pop. 25-29; Group III: Pop. 15-19 . . . . . . . . . . . . . . . . . . . . . . . . . . . . . . . . . . . . . . .31Graph 3.1.7 Gender parity index. Completion ISCED 1. 2008. . . . . . . . . . . . . . . . . . . . . . . . . . . . . . . . . .33Table 3.1.8 Gender parity index. Completion ISCED 1 by age groups. 2008. . . . . . . . . . . . . . . . . . . . . . .33Graph 3.1.9 Rural/urban parity index. Completion ISCED 1. 2008. . . . . . . . . . . . . . . . . . . . . . . . . . . . . . .34Table 3.1.10 Rural/urban parity index. Completion ISCED 1 by age groups. 2008. . . . . . . . . . . . . . . . . . .34Graph 3.1.11 Lowest quintile/highest quintile parity index. Completion ISCED 1. 2008. . . . . . . . . . . . . . .35Table 3.1.12 Lowest quintile/highest quintile parity index. Completion ISCED 1 by age groups. 2008. . .35Graph 3.1.13 Indigenous/non-indigenous parity index. Completion ISCED 1. 2008. . . . . . . . . . . . . . . . . .36Table 3.1.14 Indigenous/non-indigenous parity index. Completion ISCED 1 by age groups. 2008. . . . . . .36Table 3.1.15 Factors strongly associated with learning achievements. . . . . . . . . . . . . . . . . . . . . . . . . . .37Graph 3.1.16 Percentage of students by proficiency levels in language. 3rd grade. 2006. . . . . . . . . . . . .39Graph 3.1.17 Percentage of students by proficiency levels in language. 6th grade. 2006. . . . . . . . . . . . .40Graph 3.1.18 Percentage of students by proficiency levels in mathematics. 3rd grade. 2006. . . . . . . . . .40Graph 3.1.19 Percentage of students by proficiency levels in mathematics. 6th grade. 2006. . . . . . . . . .41Graph 3.1.20 Percentage of students by proficiency levels in science. 6th grade. 2006. . . . . . . . . . . . . . .42Graph 3.2.1 Evolution in the net enrolment rates in secondary education. 2000-2008. . . . . . . . . . . . . .43Graph 3.2.2 Variation in the net enrolment rates in secondary education. 2000-2008. . . . . . . . . . . . . .43Graph 3.2.3 Lower secondary completion rate (ISCED 2). Comparison between three age
groups. 2008. . . . . . . . . . . . . . . . . . . . . . . . . . . . . . . . . . . . . . . . . . . . . . . . . . . . . . . . . . . . .45Graph 3.2.4 Lower secondary completion rate (ISCED 2). 2008. Variation between different
age groups. Group I: Pop. 30-34; Group III: Pop 20-24. . . . . . . . . . . . . . . . . . . . . . . . . . . . .45Graph 3.2.5 Gender parity index. Completion ISCED 2. 2008. . . . . . . . . . . . . . . . . . . . . . . . . . . . . . . . . .46Table 3.2.6 Gender parity index. Completion ISCED 2 by age groups. 2008. . . . . . . . . . . . . . . . . . . . . . .47

�
Graph 3.2.7 Rural/urban parity index. Completion ISCED 2. 2008. . . . . . . . . . . . . . . . . . . . . . . . . . . . . . .47Table 3.2.8 Rural/urban parity index. Completion ISCED 2 by age groups. 2008. . . . . . . . . . . . . . . . . . .47Graph 3.2.9 Lowest quintile/highest quintile parity index. Completion ISCED 2. 2008. . . . . . . . . . . . . . .48Table 3.2.10 Lowest quintile/highest quintile parity index. Completion ISCED 2 by age groups. 2008. . .48Graph 3.2.11 Indigenous/non-indigenous parity index. Completion ISCED 2. 2008. . . . . . . . . . . . . . . . . .48Table 3.2.12 Indigenous/non-indigenous parity index. Completion ISCED 2 by age groups. 2008. . . . . . .49Graph 3.2.13 Upper secondary completion rate (ISCED 3). Comparison between three
age groups. 2008. . . . . . . . . . . . . . . . . . . . . . . . . . . . . . . . . . . . . . . . . . . . . . . . . . . . . . . . . .49Graph 3.2.14 Upper secondary completion rate (ISCED 3). 2008. Variation between different
age groups. Group I: Pop. 30-34; Group III: Pop. 20-24. . . . . . . . . . . . . . . . . . . . . . . . . . . .50Graph 3.2.15 Gender parity index. Completion ISCED 3. 2008. . . . . . . . . . . . . . . . . . . . . . . . . . . . . . . . . .51Table 3.2.16 Gender parity index. Completion ISCED 3 by age groups. 2008. . . . . . . . . . . . . . . . . . . . . . .51Graph 3.2.17 Rural/urban parity index. Completion ISCED 3. 2008. . . . . . . . . . . . . . . . . . . . . . . . . . . . . . .52Table 3.2.18 Rural/urban parity index. Completion ISCED 3 by age groups. 2008. . . . . . . . . . . . . . . . . . .52Graph 3.2.19 Lowest quintile/highest quintile parity index. Completion ISCED 3. 2008. . . . . . . . . . . . . . .53Table 3.2.20 Lowest quintile/highest quintile parity index. Completion ISCED 3 by age groups. 2008. . .53Graph 3.2.21 Indigenous/non-indigenous parity index. Completion ISCED 3. 2008. . . . . . . . . . . . . . . . . .54Table 3.2.22 Indigenous/non-indigenous parity index. Completion ISCED 3 by age groups. 2008. . . . . . .54Graph 3.2.23 Percentage of 15 year old students by proficiency levels in language. 2006. . . . . . . . . . . . .55Graph 3.2.24 Percentage of 15 year old students by proficiency levels in mathematics. 2006 . . . . . . . . .56Graph 3.2.25 Percentage of 15 year old students by proficiency levels in science. 2006. . . . . . . . . . . . . .56Graph 3.3.1 Number of students in tertiary education per 100 000 inhabitants.
Evolution year 2000-2008. . . . . . . . . . . . . . . . . . . . . . . . . . . . . . . . . . . . . . . . . . . . . . . . . . . .58Graph 3.3.2 Highest educational attainment. Population 25 and older. . . . . . . . . . . . . . . . . . . . . . . . . .59Graph 3.3.3 Literacy rates. Comparison between youth and adult population. 2008. . . . . . . . . . . . . . . .61Graph 3.3.4 Gender parity index of literacy rates. Comparison between youth and
adult population. 2008 . . . . . . . . . . . . . . . . . . . . . . . . . . . . . . . . . . . . . . . . . . . . . . . . . . . . .61Graph 4.1 Evolution of the net enrolment rates in pre-primary education. 2000 - 2008. . . . . . . . . . . . .66Graph 4.2 School attendance, children one year younger than the official entrance age for
primary by gender. 2008. . . . . . . . . . . . . . . . . . . . . . . . . . . . . . . . . . . . . . . . . . . . . . . . . . . . .66Graph 4.3 School attendance, children one year younger than the official entrance age for
primary, by income quintile. 2008. . . . . . . . . . . . . . . . . . . . . . . . . . . . . . . . . . . . . . . . . . . . .67Graph 4.4 School attendance, children one year younger than the official entrance age for
primary by geographic area. 2008. . . . . . . . . . . . . . . . . . . . . . . . . . . . . . . . . . . . . . . . . . . . .67Graph 4.5 Trained teachers in pre-primary education. 2008. . . . . . . . . . . . . . . . . . . . . . . . . . . . . . . . . .68Graph 5.1 Public expenditure per pupil on primary education as percentage of GDP
per capita. 2008. . . . . . . . . . . . . . . . . . . . . . . . . . . . . . . . . . . . . . . . . . . . . . . . . . . . . . . . . . .71Graph 5.2 Public expenditure per pupil on secondary education as percentage of GDP
per capita. 2008. . . . . . . . . . . . . . . . . . . . . . . . . . . . . . . . . . . . . . . . . . . . . . . . . . . . . . . . . . .72Graph 5.3 Annual variation in the GDP per capita in Latin America and Caribbean countries.
2000-2009 . . . . . . . . . . . . . . . . . . . . . . . . . . . . . . . . . . . . . . . . . . . . . . . . . . . . . . . . . . . . . . .73Graph 5.4 Pupil/teacher ratio in primary education. 2008. . . . . . . . . . . . . . . . . . . . . . . . . . . . . . . . . . .74Graph 5.5 Pupil/teacher ratio in secondary education. 2008. . . . . . . . . . . . . . . . . . . . . . . . . . . . . . . . .74Graph 5.6 Percentage of trained teachers in primary education. 2008. . . . . . . . . . . . . . . . . . . . . . . . .75Graph 5.7 Percentage of trained teachers in secondary education. 2008. . . . . . . . . . . . . . . . . . . . . . .75

�
TExT BOxES
Text Box 1 Country average . . . . . . . . . . . . . . . . . . . . . . . . . . . . . . . . . . . . . . . . . . . . . . . . . . . . . . . . . .26Text Box 2 Net enrolment rate . . . . . . . . . . . . . . . . . . . . . . . . . . . . . . . . . . . . . . . . . . . . . . . . . . . . . . . .28Text Box 3 Equity in the completion of education levels: Parity index . . . . . . . . . . . . . . . . . . . . . . . . . .32Text Box 4 Measuring completion rates for education levels . . . . . . . . . . . . . . . . . . . . . . . . . . . . . . . . .44Text Box 5 Lifelong learning . . . . . . . . . . . . . . . . . . . . . . . . . . . . . . . . . . . . . . . . . . . . . . . . . . . . . . . . . .57Text Box 6 International and regional commitments to literacy . . . . . . . . . . . . . . . . . . . . . . . . . . . . . . .60
APPENDICES
TABLES
Table C.1 Description of the proficiency levels of students from the 3rd grade of primary in Reading. SERCE study. . . . . . . . . . . . . . . . . . . . . . . . . . . . . . . . . . . . . . . . . . . . . . . . . . .106
Table C.2 Description of the proficiency levels of students from the 6th grade of primary in Reading. SERCE study. . . . . . . . . . . . . . . . . . . . . . . . . . . . . . . . . . . . . . . . . . . . . . . . . . .107
Table C.3 Description of the proficiency levels of students from the 3rd grade of primary in Mathematics. SERCE study. . . . . . . . . . . . . . . . . . . . . . . . . . . . . . . . . . . . . . . . . . . . . . . . .108
Table C.4 Description of the proficiency levels of students from the 6th grade of primary in Mathematics. SERCE study. . . . . . . . . . . . . . . . . . . . . . . . . . . . . . . . . . . . . . . . . . . . . . . . .109
Table C.5 Description of the proficiency levels of students from the 6th grade of primary in Science. SERCE study. . . . . . . . . . . . . . . . . . . . . . . . . . . . . . . . . . . . . . . . . . . . . . . . . . . . .110
Table D.1 Description of the proficiency levels of students in Reading. PISA study. . . . . . . . . . . . . .111Table D.2 Description of the proficiency levels of students in Mathematics. PISA study. . . . . . . . . .112Table D.3 Description of the proficiency levels of students in Science. PISA study. . . . . . . . . . . . . .113
DATA TABLES
Table E.1.a Primary education / ISCED 1 / Enrolment, new entrants and repeaters. 2008.able E.1.a Primary education / ISCED 1 / Enrolment, new entrants and repeaters. 2008. . . . . . . . . .116Table E.1.b Primary education / ISCED 1 / Conclusion and parity indices. 2008. . . . . . . . . . . . . . . . . .118Table E.2.a Secondary education / ISCED 2-3 / Enrolment. 2008. . . . . . . . . . . . . . . . . . . . . . . . . . . . . .119Table E.2.b Lower secondary education / ISCED 2 / Conclusion and parity indices. 2008. . . . . . . . . . .120Table E.2.c Upper secondary education / ISCED 3 / Conclusion and parity indices. 2008. . . . . . . . . . .121Table E.3 Lifelong learning/Tertiary education, educational attainment and literacy. 2008. . . . . . . .122Table E.4 Pre-primary education and ECCE / ISCED 0 / Enrolment, school attendance
and teachers. 2008. . . . . . . . . . . . . . . . . . . . . . . . . . . . . . . . . . . . . . . . . . . . . . . . . . . . . . . .123Table E.5 Resources for education / ISCED 1-2-3 / expenditure per pupil, teacher-pupil ratio,
trained teachers . . . . . . . . . . . . . . . . . . . . . . . . . . . . . . . . . . . . . . . . . . . . . . . . . . . . . . . . .125

�
COUNTRIEs PARTICIPATINg IN ThE sTUDy
This report covers the 34 countries of the Summit of the Americas, which are listed below with their identifiers (used in graphs and tables).
Country list, alphabetical by identifier:
Ag Antigua and Barbuda hN Honduras
AR Argentina hT Haiti
bb Barbados JM Jamaica
bO Bolivia KN Saint Kitts and Nevis
bR Brazil LC Saint Lucia
bs Bahamas MX Mexico
bZ Belize NI Nicaragua
CA Canada PE Peru
CL Chile PN Panama
CO Colombia Py Paraguay
CR Costa Rica sR Suriname
DM Dominica sV El Salvador
DO Dominican Republic TT Trinidad and Tobago
EC Ecuador Us United States
gD Granada Uy Uruguay
gT Guatemala VC Saint Vincent and the Grenadines
gy Guyana VE Venezuela


11
PREfACE
Since 2000, the Regional Education Indicators Project (PRIE) has been an important mechanism for monitoring countries’ progress toward the Summit of the Americas education goals. It thus fosters ongoing strengthening of the countries’ educational information systems, and wider dissemination and use of information on education. Efforts by PRIE are contributing to an understanding of education and the challenges it faces in Summit of the Americas countries. PRIE provides insight into defining and managing the educational policies needed to move toward the 2010 Summit goals.
we are pleased, in this context, to present Educational Panorama 2010: remaining challenges, which examines progress to date toward the educational goals of the Summit of the Americas.
This publication marks the conclusion of a ten-year phase of PRIE activities. Full of challenges, it has included successful collaboration between national governments and international organizations, and featured a great deal of mutual learning among all the participants.
As the information in Educational Panorama 2010 demonstrates, the Summit of the Americas member countries have made important advances in access to and completion of primary and secondary education, although major differences between countries and social groups remain. Further challenges face the countries in giving their students the opportunity to complete their studies and obtain a quality education that prepares them effectively for life.
we hope that the information provided here will help improve quality and equality in education by contributing to the conception and construction of educational policy proposals and decision-making. Thus, the Educational Panorama is conceived as a contribution to the discussion of the political and policy issues that must be addressed to achieve the goals established in the Summit of the Americas process, as well as to meet the further challenges that await education in the twenty-first century.


1�
INTRODUCTION
PRIE was developed as a contribution to the various long-standing international efforts designed to improve educational databases as a way of supporting the formulation, execution, and assessment of educational policy. Political leadership of the project is provided by Mexico’s Secretariat of Public Education (SEP), and by the General Secretariat of the Organization of American States (OAS). From the beginning, the project has received technical support from UNESCO. This ensures international and regional collaboration through the UNESCO Institute for Statistics (UIS) in Montreal, and the Regional Information System (SIRI) of the Regional Bureau of Education for Latin America and the Caribbean (OREALC) in Santiago, Chile.
The purpose of the present document is to provide an analysis of the available data as a way of assessing progress toward the educational goals established in the Summit of the Americas process.
At the Second Summit of the Americas in Santiago, Chile, the 34 head of states and governments of the Organization of American States (OAS) adopted a plan of action in which education was identified as a regional priority. This led to the eventual approval of a plan of action with the following goals for 2010:
Goal 1: Universal access to and enrolment in quality primary education.
Goal 2: Access of at least 75% of young people to quality secondary education with increasing completion rates.
Goal 3: offering lifelong educational opportunities to the general population.1
The Education Action Plan is designed along nine thematic lines, the second of which (educational indicators and quality evaluation) called for the Regional Education Indicators Project (PRIE) and the Educational Panorama series of publications. The principal PRIE objectives are:
• To construct comparable indicators that accurately reflect the countries’ progress toward the Summit of the Americas goals.
• To strengthen of the information systems of the 34 OAS member countries so that the information generated by them is internationally comparable.
• To provide a prospective view, so that the information produced by the project supports timely and proper decision-making.
with these objectives in mind, PRIE published its first report in 2001. The Educational Panorama of the Americas presented an overview of the state of education in the region at that time. The subsequent report Achieving the Educational Goals (2003) was an initial analysis of progress made by the countries toward the educational
1 Second Summit of the Americas, Santiago (1998) Plan of Action. See: http: www.summit-americas.org

14
goals established at the Summit of the Americas. Two years later, Educational Panorama 2005: progressing toward the goals, defined a minimum set of important up indicators for monitoring. Two years later, Educational Panorama 2007: achievements and challenges was an effort to establish how many countries had advanced toward the goals since the adoption of the Plan of Action.
The present Educational Panorama 2010: remaining challenges concludes follow-up on the 2010 goals set by the Summits, and outlines the most important challenges on the horizon for the region’s educational systems.
This Educational Panorama places special emphasis on performance in education, a factor that previous publications in the series have not examined as exhaustively. For this purpose, it draws on summaries and extracts of the Second Regional Comparative and Explanatory Study (SERCE) coordinated by the Latin American Laboratory for Assessment of the Quality of Education (LLECE), as well as citing findings from the Programme for International Student Assessment (PISA) conducted by the Organisation for Economic Cooperation and Development (OECD), in which six Latin American countries participate.
Since the topic of early childhood has been a constant in official declarations by heads of state and ministers of education of the OAS Member States at the Summits of the Americas, the statistics and analysis appearing in this edition of the Panorama include information on Early Childhood Care and Education (ECCE).
The report begins with an executive summary outlining the study’s most important findings, and calling attention to a few issues relating to statistics, data analysis and decision-making.
The main part of the report examines progress toward the Summit of the Americas education goals, examining advances made in recent years as reflected in available information. This chapter is divided into three parts, one dedicated to each goal.
The report then examines the state of Early Childhood Care and Education (ECCE) in the region, and takes a look at educational investment, education in the context of the economic crisis, student /teacher ratios and teacher training.
A presentation of the study’s major conclusions ends the main text, which is followed by appendices that include a guide to the information sources cited, a description of the definitions and methods used, a number of country educational profiles, and tables with the data used.

1�
EXECUTIVE sUMMARy
In 1998, the heads of state and governments meeting at the Second Summit of the Americas in Santiago, Chile agreed on an Action Plan for Education that sets forth three principal goals to be met by 2010.
The present report presents quantitative data on the state of education in the countries participating in the Summits of the Americas, in order to enhance understanding of achievements and remaining challenges in relation to these goals, as well as some analysis of educational topics that lie beyond the scope of the goals.
This initial executive summary outlines the principal outcomes and conclusions presented of Educational Panorama 2010: remaining challenges.
DEMOgRAPhIC, ECONOMIC AND sOCIAL CONTEXT IN ThE AMERICAs
1 The Summit of the Americas countries with the greatest demand for primary education and lower secondary education – and which hence face the greatest budgetary pressures in connection with this educational level – are generally also the poorest.
2 The demand for upper secondary education varies less from country to country. Nevertheless, countries at a lesser level of development face greater challenges in addressing the potential demand for secondary education.
gOAL 1: UNIVERsAL ACCEss TO AND ENROLMENT IN qUALITy PRIMARy EDUCATION
3 The net enrolment rate, which shows what proportion of children enter primary school at the theoretically appropriate age, averaged 71.1% in the countries in 2008. (The averages cited in this document are unweighted averages of the several countries’ national figures, as explained in Text Box 1 below.) Thus, timely entry to primary school is still a less regular occurrence than desirable.
4 The countries have shown relatively high net enrolment, averaging around 93%. However, there has been virtually no advance in this rate over the last 8 years.
5 Repetition of first grade is still high, averaging 9% in the countries. Repetition rates are a reflection of inefficient educational spending, which impedes improvement in education. Apart from the question of cause, debate continues on whether repetition is pedagogically useful at all – whether it helps to improve poor performance in school, or in fact increases the likelihood of dropout.
1�
6 with regard to completion of primary school, it should be stressed that countries with low rates of schooling in older generations have shown significant increases recently. The average completion rate among the countries has increased by 4.6% over the last ten years, as measured by comparing an older population (25- to 29-year-olds) with a younger age group (15-19). In 2008, the average for the region’s countries was 90.1%. However, there are major differences between the countries in this respect. Thus, meeting Goal I remains a major challenge for many of the countries.
7 The completion of primary education is still distributed unequally not only between countries, but between different social groups within countries, disadvantaged groups having lower completion rates. Despite movement toward greater parity, the situation remains unbalanced, putting inhabitants of rural areas, low-income populations and members of ethnic groups at a disadvantage.
8 Performance at the primary level is low. The SERCE2 study shows that an average over countries of 38% of third grade students (as throughout this document, this figure is an unweighted average of country rates) not meeting minimum reading comprehension standards. At the sixth-grade level, 23.4% of students fall short of minimum standards.
9 Performance in mathematics is no more encouraging, with a country average of 51.8% of third graders unable to solve basic problems in addition, subtraction and multiplication, and 20% of sixth graders unable to use the four basic mathematical operations strategically when provided with explicit information.
10 Similar calculations show 48.2% of students at the sixth-grade level failing to meet minimum standards in science.
gOAL 2: ACCEss Of AT LEAsT ��% Of yOUNg PEOPLE TO qUALITy sECONDARy EDUCATION wITh INCREAsINg COMPLETION RATEs
11 According to available information, net enrolment in secondary education increased 10.1% on average by countries between 2000 and 2008. Although there is a clear upward trend in access to secondary education, only 8 out of 21 countries have met the Goal 2 target of 75% access.
12 Of the region’s young people between 20 and 24, a country average of 71% have completed lower secondary education, while 51.8% have completed upper secondary school. However, only three countries have attained the 75% rate called for by Goal 2.
13 It is noteworthy, however, that those countries whose older generations have lower secondary school completion rates show very significant increases among the younger, reflecting progress over the above-mentioned period.
14 Completion of secondary education is even less evenly distributed among certain social groups than is completion of primary education. Completion rates for inhabitants of rural areas, poorer social sectors and members of ethnic groups are very low. Gender disparities are also of note: they generally favour women, who have traditionally been at a disadvantage in this respect.
15 The PISA study, which measures the achievements of 15 year old students in six of the region’s countries (Argentina, Brazil, Chile, Colombia, Mexico and Uruguay), found an average over countries of 48.9% of students to be below basic reading levels.
2 SERCE is the Second Regional Comparative and Explanatory Study undertaken in 2006 by The Latin American Laboratory for Assessment of the Quality of Education (LLECE), with the participation of 16 Latin American countries.

1�
16 In mathematics, according to PISA, an average of 61% of students are incapable of using elementary algorithms, formulas, procedures and conventions.
17 In science, an average of 51.7% of students fail to meet the most basic standards, since they are unable to give plausible explanations of common situations, or to draw conclusions based on simple investigations.
gOAL �: OffERINg LIfELONg EDUCATIONAL OPPORTUNITy TO ThE gENERAL POPULATION
18 Enrolment rates in tertiary education increased significantly between 2000 and 2008 in most of the countries.
19 Important improvements in literacy can be seen in the region’s younger generation. This positive trend in countries where older generations are less literate merits special emphasis. Overall, the literacy rate in the region rose 6.1%, as measured by the difference between older (24+) and younger (15-24) age range. The trend to gender parity in literacy in the younger age group is also a noteworthy positive development.
EARLy ChILDhOOD CARE AND EDUCATION (ECCE)
20 Net enrolment rates in pre-primary education reflect a consolidation of Early Childhood Care and Education (ECCE) offerings in the region. Average net enrolment was 58.2% in 2008. This is particularly important, considering that pre-primary attendance is positively correlated with progress in primary school, as well as progress to other educational levels and school performance in general.
21 Major disparities of pre-primary enrolment rates persist between countries, however, as well as between socioeconomic groups and different geographical locations.
22 Many countries still lack sufficient numbers of qualified pre-primary teachers.
23 A broader concept of ECCE would be an important major development. Such a concept would take more than pre-primary education into account, attempting to construct a comprehensive model that addresses physical, psychological and educational development from birth until matriculation in primary school.
sPENDINg ON EDUCATION
24 Per student spending on primary education as a percentage of per capita gross domestic product (GDP) varies widely from country to country. In 2008, percentages in the region ranged from 7% to 27.7%, while the average country rate was 13.8%. Only four countries spent over 20%.
25 In secondary education, per student spending as a percentage of GDP ranges from 4.5% to 26.4%, with a regional average of 14.6%. Five of 21 countries with available data spend over 20%.
26 The financial and economic crisis could have a negative impact on educational systems in Latin America and the Caribbean.

1�
TEAChERs
27 The student/teacher ratio at the primary level ranges from 15.5 to 33.3, with a country average of 21.9 for the region. At the secondary level, it ranges from 10.2 to 28.6, with an average of 17.6.
28 Country figures for 2007 show an average of 74.9% of primary school teachers in the region meeting official national requirements and being certified to teach at the that level. Here again, disparities between countries are high (national figures ranging from 36.4% to 100%).
29 At the secondary level, an average of 64.8% of teachers are duly certified (national figures range from 35.3% to 90.6%).

1�
1. sTATIsTICs, DATA ANALysIs AND DECIsION MAKINg
Improving the link between statistical information and decision-making remains a significant challenge in educational management. It is important to bring statistical information more fully into policy-making and take better advantage of it, so that the information produced is not only used by international organisations and researchers but also informs national policy.3
The use of data for decision-making in educational management is one element of a broad and complex set of interactions, which may be described in a word as the link between the policy world and the world of technical expertise. The criteria employed in these different spheres reflect the specific functions that they serve, but also reflect the different training and professional profiles typical of these environments. Although such differences do not necessarily lead to contradictory views, they can make it harder for those managing a system to put statistical information to use effectively.4
The policy-making process must highlight the initial importance of identifying a priority educational goal. Once the goal is defined, information must be used to understand as much as possible about the processes that shape (or impede) progress toward the goal. This requires previous thought about indicators. The indicators chosen must relate to the challenges involved in each phase of improving the services of an educational system. Certain indicators, such as net and gross schooling rates, have proved very useful for monitoring expansion of coverage, which for decades was the region’s greatest challenge. However, progress brings new challenges, and indicators must be found that reflect these in the clearest, most reliable way. In other words, the region’s educational systems are currently at a key juncture, and it is of the utmost importance to have appropriate indicators for monitoring progress in the coming years. There are no absolute indicators. An indicator has value only in relation to specified goals and as a way of understanding attempts to reach them.
Most of the region’s countries have made good progress in designing reliable statistical systems that provide timely information. Standardised mechanisms for collecting and processing information are in place, often with modern technological support that facilitates use of the information. However, in many cases the very abundance of information makes it difficult to discern which information can in fact help to understand a process or situation. Frequently, the overwhelming amount of information makes it impossible for a reader who is not a statistician to find what he or she is looking for. To prevent this, the data relevant to the situation at issue should be selected, and then an analysis provided to give the data meaning.
This transformation of data into information is a necessary first step in maximizing its usefulness. It makes it possible to develop a picture of problems such as grade repetition in the early years of primary school, and to
3 PRIE (2009), Agenda del VII Taller Regional en Estadísticas Educativas, Cancún, Mexico, 9-11 December 2009.
4 Asociación Civil Educación para Todos (2009), Uso de la información educativa aplicada a las decisiones y gestión de los sistemas educativos, prepared for the Seventh Regional workshop on Educational Statistics of the Regional Education Indicators Project (PRIE), Mexico, December 2009.

20
throw light on mechanisms active in school systems that were not contemplated when regulations were made. This transformation of data into information does not by itself generate answers, but it does help to identify the questions that must be asked in order to understand the phenomenon that is to be reshaped. It also helps to clear away beliefs that have gained acceptance simply through repetition. Thus, it is an opportunity for demystification, and calls for reassessing assumptions that have persisted without being re-examined in the light of additional data. It is vital at this stage to avoid drawing premature conclusions. Too often, explanations of a phenomenon are attempted before all the information that may throw light on it are in hand.
The next step in processing data calls for transforming the information into knowledge. This requires further information – not necessarily quantitative – to interpret the facts. Regulations, programme execution and pedagogical proposals, among other things, may be useful here. This stage calls for multidisciplinary interaction to enrich understanding of the problem. Among others, teachers, management specialists, statisticians and people with experience in educational systems should be involved. It is important to draw on the greatest possible breadth of views in order to ferret out innovative alternatives that go beyond traditional indicators, in order to avoid compromise or consensus solutions that sidestep important questions or contradictions, and in order to avoid drawing immediate conclusions or constructing explanations based immediately on empirical data, since this risks throwing a subjective pall over the interpretation of the facts. During this stage, analysis must be enriched by considering the viewpoints of specialists other than statisticians. Approached in this way, data can provide qualitative perspectives that help define the situation being studied. This process also throws our data’s limitations into relief, pointing to possible needs for supplementary data collection mechanisms for specific purposes. In short, as specialists in the development of social indicators agree, educational indicators – even the best system of indicators imaginable – can never replace thorough programme assessment backed by in-depth expert analysis.5
For good results, the relationship between an educational system’s policy management and the information that supports it must be one of continuous exchange. Sometimes the use of information is so limited and sporadic (as, for example, when it is limited to documentation to support proposals or justify decisions already taken) that it can hardly enlighten. Interpretation then is absent, and the information at hand fails to yield the knowledge needed. This leads to managers’ demanding new data rather than making the effort required to extract value from the data already available. Meanwhile, those responsible for gathering statistical information feel that their work is not being used effectively, and they are under such pressure that their ability to judge what specific information is really needed suffers. Data-management dynamics thus need to be improved, and this requires activities designed to foster a closer relationship between data producers and users.
5 See Shavelson, Richard J. et al. (1991), ERIC Clearinghouse on Tests Measurement and Evaluation Washington DC. What Are Educational Indicators and Indicator Systems?, ERIC/TM Digest.
21
2. DEMOgRAPhIC, ECONOMIC AND sOCIAL CONTEXT IN ThE AMERICAs
Before turning to an examination of progress toward educational goals, it is important to sketch national demographic, social and economic conditions in the region, since changes in these areas can affect educational results either positively or negatively.
This type of data is used to estimate future demand for primary and secondary education – a factor that plays a central role as governments design and plan educational policy.
while per capita GDP measures relative wealth, the Human Development Index (HDI) is a broader measure of wellbeing (health and education). The wealthiest countries do not invariably have the highest HDIs. The populations of less wealthy countries sometimes have higher life expectancies at birth and better schooling rates. For example, the United States has the region’s highest per capita GDP, but Canada ranks first in human development (respective HDIs of 0.95 and 0.97).
Other countries considered to have high levels of human development (HDI > 0.80) are Barbados (0.90), Chile (0.88), Argentina (0.87), Uruguay (0.87), Bahamas (0.86), Costa Rica (0.85), Mexico (0.85), Trinidad and Tobago (0.84), Panama (0.84), Antigua and Barbuda (0.87), Saint Kitts and Nevis (0.84), Venezuela (0.83), Saint Lucia (0.82), Brazil (0.81), Ecuador (0.81), Dominica (0.81), Peru (0.81), Colombia (0.81) and Granada (0.81).
The remaining Latin American and Caribbean countries are in the midrange (HDIs between 0.5 and 0.79): Belize (0.77), Jamaica (0.77), Suriname (0.77), Dominican Republic (0.78), Saint Vincent and the Grenadines (0.77), Paraguay (0.76), El Salvador (0.75), Guyana (0.73), Bolivia (0.73), Honduras (0.73), Nicaragua (0.70), Guatemala (0.70) and Haiti (0.53). None of the region’s countries is regarded as having a low level of human development (HDI < 0.49).
Graph 2.1 shows each country’s GDP per capita and Human Development Index. There tends to be a general correlation between HDI and per capita GDP – logically enough, since GDP is an element of the HDI. However, factors other than wealth also influence the HDI. For example, Surinam, Peru, Dominica and Ecuador are ranked in that order in per capita GDP, but the broader perspective of the HDI places them in precisely the reverse order.
Besides these important questions of wealth and wellbeing, it is crucial to consider demographic factors, since these contribute to an understanding of future educational demand.
Graph 2.2 shows potential demand for primary and lower secondary education in the region. The indicator used here reflects the percentage of the population between the ages of 5 and 14 that was eligible to be enrolled in school at each of these levels in 2008. The potential demand from this population implies potential needs at these two educational levels, and affects the challenges that countries will face in attempting to universalise at least primary education.

22
In Guatemala and Honduras, over 25% of the population is between the ages of five and 14. In contrast, less than 15% of the inhabitants of Trinidad and Tobago, the United States, Barbados and Canada fall in this age group.
0
5,000
10,000
15,000
20,000
25,000
30,000
35,000
40,000
45,000
50,000
US CA TT BS AG BB KN MX CL AR VE PN UY CR LC BR CO DM PE SR VC EC GD BZ DO JM SV GT PY BO HN GY NI HT-
3.00
6.00
9.00
12.00
15.00
18.00
21.00
24.00
27.00
30.00
Per capita GDP Potential demand for primary education
Source: Human Development Report, 2009 and population estimates of the United Nations Department of Economic and Social Affairs Population Division (UNPD) 2008 revision. . See data annex for values and explanatory notes.
Graph 2.2. potential demand for primary and lower secondary education and Gdp per capita. 2007.
0
5,000
10,000
15,000
20,000
25,000
30,000
35,000
40,000
45,000
50,000
US CA TT BS AG BB KN MX CL AR VE PN UY CR LC BR CO DM PE SR VC EC GD BZ DO JM SV GT PY BO HN GY NI HT0.50
0.55
0.60
0.65
0.70
0.75
0.80
0.85
0.90
0.95
1.00
Per capita GDP Human Development Index
Graph 2.1. human development index and Gdp per capita. 2007.
Source: Human Development Report, 2009. See data annex for values and explanatory notes.

2�
Countries with greater demand for primary and lower secondary education confront greater budgetary pressure in relation to these levels than do countries with less demand – at least in theory. This is a particularly complex issue for the region, because the countries with the greatest demand for these two levels of education are precisely those with the lowest per capita GDPs. In other words, the countries facing the greatest educational challenges in terms of guaranteeing access and successful completion of at least primary school to a larger percentage of their populations have lower levels of economic development. Salient cases are Guatemala, Honduras, Nicaragua and Haiti.
Graph 2.3 shows potential demand for upper secondary education in the region – i.e., the number of young people in the age range appropriate for this level of education (15-19) as a percentage of the total population, in relation to the country’s per capita GDP.
Graph 2.3. potential demand for upper secondary education and Gdp per capita. 2007.
Source: Human Development Report, 2009 and population estimates of the United Nations Department of Economic and Social Affairs Population Division (UNPD) 2008 revision. . See data annex for values and explanatory notes.
In contrast to the situation at the primary and lower secondary levels, the potential demand for upper secondary education is relatively even throughout the region, ranging from 7.3% to 11.1%. The fact remains, though, that preparing educational systems for their potential upper secondary demand will be a hefty challenge for countries with lower per capita GDPs.
-
3.00
6.00
9.00
12.00
15.00
18.00
21.00
24.00
27.00
30.00
0
5,000
10,000
15,000
20,000
25,000
30,000
35,000
40,000
45,000
50,000
US CA TT BS AG BB KN MX CL AR VE PN UY CR LC BR CO DM PE SR VC EC GD BZ DO JM SV GT PY BO HN GY NI HT
Per capita GDP Potential demand fo secondary education

2�
�. PROgREss TOwARD ThE gOALs
This section presents a preliminary analysis, along with existing data for a series of indicators that reflect progress toward the goals that the Summit of the Americas countries are committed to reaching by 2010.
�.1. gOAL 1: UNIVERsAL ACCEss TO AND ENROLMENT IN qUALITy PRIMARy EDUCATION
Primary education is essential for lifelong learning. It is certainly the door to education in general, and thus an essential factor in human development. Ensuring universal access to minimum levels of education significantly increases countries’ potential for development in every sense.
As a result, access to and enrolment in quality education are widely considered to be not only needs but a human right.6 The decision to guarantee that all school-age children have access to and are enrolled in primary school is indicative of the effort that the region’s countries have made in recent years to achieve universal primary education.
This first Summit of the Americas goal is also an element in the worldwide goals established as a part of the Education for All initiative,7 and in the United Nations Millennium Declaration,8 although the Americas deadline is closer (2010 as opposed to 2015) and reflects the overall importance of primary education.
To characterise the progress that the Summit of the Americas countries have made toward this goal, this section is divided into four parts. The first deals with progress toward universal access and enrolment at the primary level. The second reviews progress in successful completion of primary school. The third part analyses potential problems of disparity in achieving this goal. The final section presents student’s achievments in primary education based on the SERCE study.
�.1.1 Access to primary education and repetition of first grade
The net intake rate in the first grade is a way of measuring access to primary education and the extent of timely entry into school. It represents the number of children entering primary school during a given year at what is theoretically the appropriate age, as a percentage of the total number of children of that age.
6 See, for example: UNESCO/OREALC (2007a). Quality Education for All: A Human Rights Issue. Discussion document on educational policy in the context of the Second Intergovernmental Meeting of the Regional Education Project for Latin America and the Caribbean (EPT/OREALC), February 2008, UNESCO/OREALC.
7 Documents related to the world Conference on Education for All held in Jomtien, Thailand in 1990 can be found at http://www.unesco.org/educación/efa/index.shtml
8 See the UN Millennium Declaration, http://www.un.or/millennium/declaration/ares552e.htm
2�
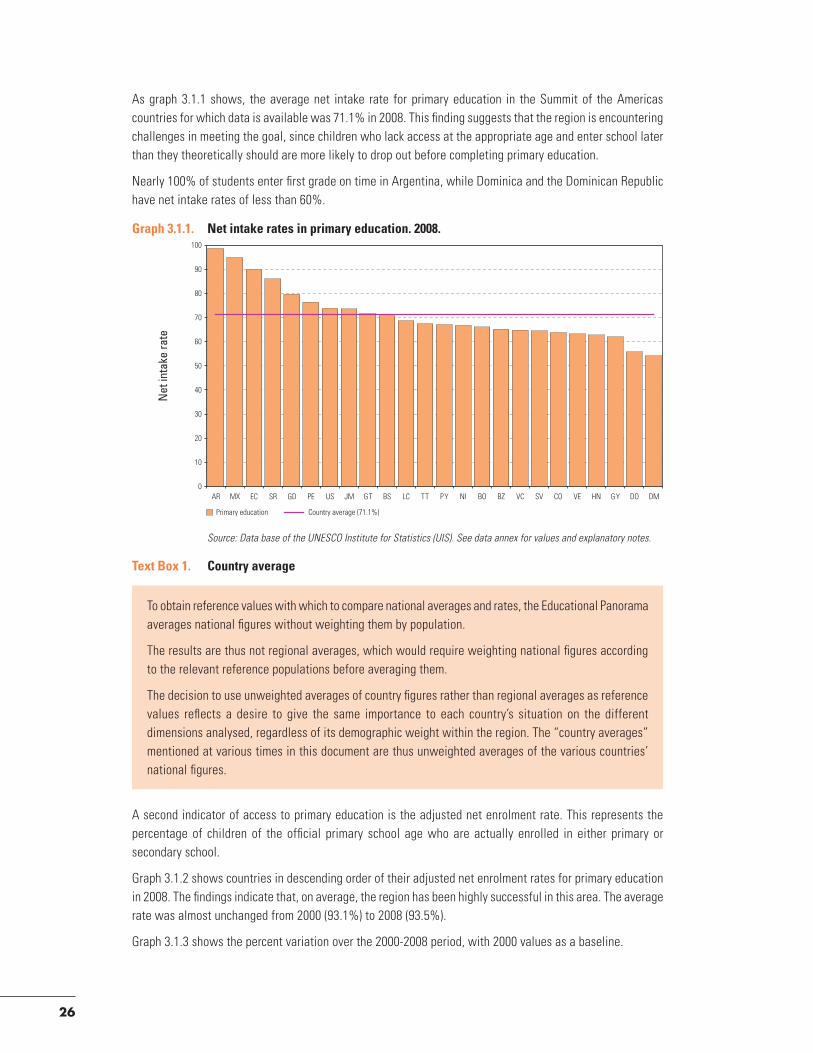
As graph 3.1.1 shows, the average net intake rate for primary education in the Summit of the Americas countries for which data is available was 71.1% in 2008. This finding suggests that the region is encountering challenges in meeting the goal, since children who lack access at the appropriate age and enter school later than they theoretically should are more likely to drop out before completing primary education.
Nearly 100% of students enter first grade on time in Argentina, while Dominica and the Dominican Republic have net intake rates of less than 60%.
Text box 1. Country average
To obtain reference values with which to compare national averages and rates, the Educational Panorama averages national figures without weighting them by population.
The results are thus not regional averages, which would require weighting national figures according to the relevant reference populations before averaging them.
The decision to use unweighted averages of country figures rather than regional averages as reference values reflects a desire to give the same importance to each country’s situation on the different dimensions analysed, regardless of its demographic weight within the region. The “country averages” mentioned at various times in this document are thus unweighted averages of the various countries’ national figures.
A second indicator of access to primary education is the adjusted net enrolment rate. This represents the percentage of children of the official primary school age who are actually enrolled in either primary or secondary school.
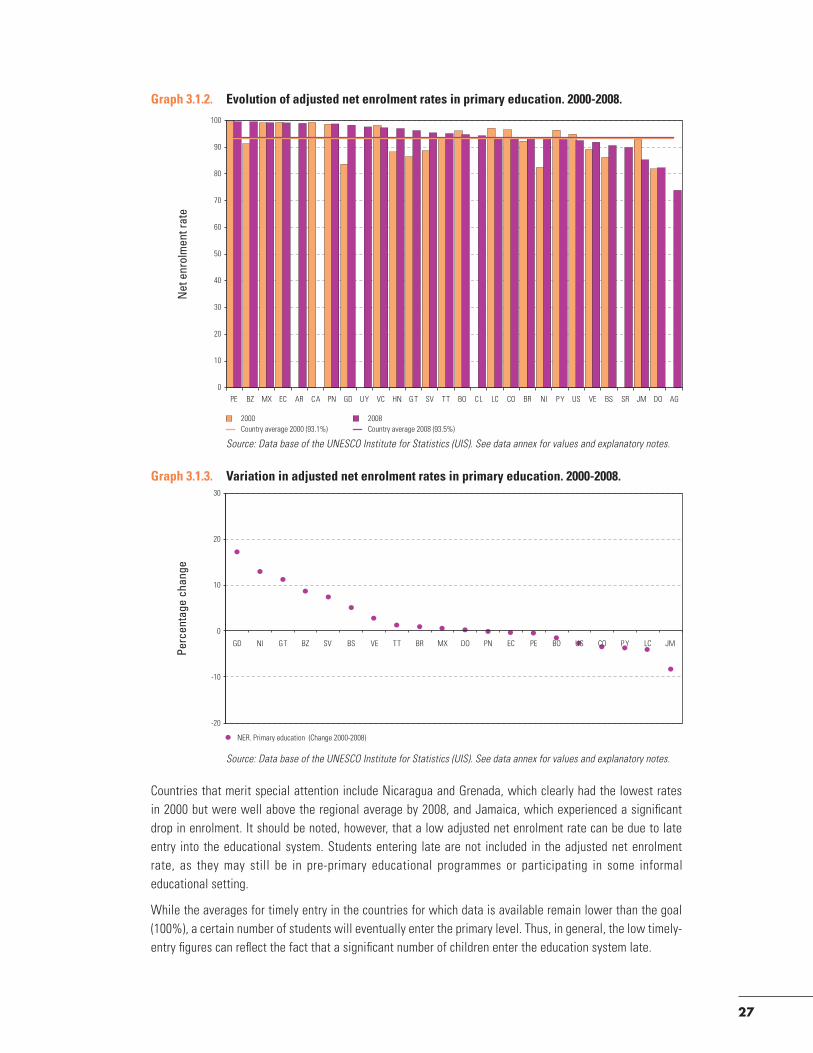
Graph 3.1.2 shows countries in descending order of their adjusted net enrolment rates for primary education in 2008. The findings indicate that, on average, the region has been highly successful in this area. The average rate was almost unchanged from 2000 (93.1%) to 2008 (93.5%).
Graph 3.1.3 shows the percent variation over the 2000-2008 period, with 2000 values as a baseline.
Source: Data base of the UNESCO Institute for Statistics (UIS). See data annex for values and explanatory notes.
Graph 3.1.1. net intake rates in primary education. 2008.
0
10
20
30
40
50
60
70
80
90
100
AR MX EC SR GD PE US JM GT BS LC TT PY NI BO BZ VC SV CO VE HN GY DO DM
Primary education Country average (71.1%)
2�
Countries that merit special attention include Nicaragua and Grenada, which clearly had the lowest rates in 2000 but were well above the regional average by 2008, and Jamaica, which experienced a significant drop in enrolment. It should be noted, however, that a low adjusted net enrolment rate can be due to late entry into the educational system. Students entering late are not included in the adjusted net enrolment rate, as they may still be in pre-primary educational programmes or participating in some informal educational setting.
while the averages for timely entry in the countries for which data is available remain lower than the goal (100%), a certain number of students will eventually enter the primary level. Thus, in general, the low timely-entry figures can reflect the fact that a significant number of children enter the education system late.
Graph 3.1.2. evolution of adjusted net enrolment rates in primary education. 2000-2008.
Source: Data base of the UNESCO Institute for Statistics (UIS). See data annex for values and explanatory notes.
0
10
20
30
40
50
60
70
80
90
100
PE BZ MX EC AR CA PN GD UY VC HN GT SV TT BO C L LC CO BR NI P Y US VE BS SR JM DO AG
2000Country average 2000 (93.1%)
2008Country average 2008 (93.5%)
Source: Data base of the UNESCO Institute for Statistics (UIS). See data annex for values and explanatory notes.
Graph 3.1.3. Variation in adjusted net enrolment rates in primary education. 2000-2008.30
20
10
0
-10
-20
NER. Primary education (Change 2000-2008)
JMLCGD NI GT BZ SV BS VE TT BR MX DO PN EC PE PYCOUSBO

2�
However, several countries with low net intake and enrolment rates do not show an increase in attendance over time. This is a key issue in efforts to reach the goal of universal access to primary school.
Text box 2. net enrolment rate
Net enrolment rate (NER) is the number of children in the official age group for a given level of school as a percentage of the total corresponding school-age population. It is used as an indicator of access to pre-primary and secondary education.
The present publication uses adjusted net enrolment rate to monitor access to primary education. This represents primary-school students enrolled in the primary level who are in the official primary-school age, plus children in that age range who are already in secondary school, as a percentage of the total population of primary-school age.
The Educational Panorama is not alone among United Nation reports in using adjusted net enrolment rates to assess progress toward the universalisation of primary education in the world. Documents such as the Education for All Monitoring Report and the Millennium Development Goals Report are other examples.
interpreting the ner
A high NER denotes a high level of coverage in the official school-age population. Its theoretical maximum value is 100%. Rising trends can be considered evidence of improved coverage at specified educational levels. Comparing NER with GER (gross enrolment rate) provides the incidence of under-aged and over-aged enrolment. If the NER is below 100%, then its complement (the distance from 100%) provides a measure of the proportion of children not enrolled at the specified educational level. However, since some of the children or young people may be enrolled at other levels, this difference should in no way be considered as a measure of the percentage of students not enrolled in the system. To measure progress toward universal primary education, for example, adjusted primary NER is calculated based on the percentage of children in the official primary-school age range who are enrolled in either primary or secondary school.
Difficulties may arise when calculating an NER that approaches 100%, however, if:
1. the reference date for entry to primary school does not coincide with the birth dates of the entire cohort eligible to enrol at this educational level;
2. a significant portion of the population starts primary school earlier than the prescribed age, and consequently finishes earlier as well;
3. there is an increase in the entrance age to primary education, but the duration of schooling remains unchanged.
Source: UNESCO/UIS (2009a), Education Indicators, technical guidelines, UNESCO/UIS, Montreal.
Once students are enrolled in the system, it is important to ensure that they remain there and progress. One negative factor in this respect is grade repetition. In this connection, it is important to note that educational research shows that a child’s likelihood of completing primary school and advancing to further educational levels is affected by grade repetition. Students who repeat grades experience increasing pressure to assume other responsibilities, and this leads to an increasing probability of their dropping out of school.9
9 For more on this issue, see UNESCO (2007b), The State of Education in Latin America and the Caribbean: Guaranteeing Quality Education for All, a regional report, reviewing and assessing progress toward education for all within the framework of the Regional Education Project (EFA/PRELAC), UNESCO/OREALC, Santiago, Chile.

2�
Graph 3.1.4 shows the percentage of children who repeat first grade in each country. The average for the countries for which information was available is 9%. It would appear that countries face challenges in ascertaining what defects in the system are behind this phenomenon, since its extent calls for more than simply analysing individual cases.
Evidence is needed to address this problem. The SERCE study10 is relevant here. Its findings show, for instance, that pre-primary education enhances achievement in school.
A more extreme strategy would be to put policies in place that do away with the practice of holding first graders back.11 The 2009 EPT Monitoring Report12 notes that grade repetition may be a source of disparities in performance. However, it is important to realize that, in some contexts, declarations of principle may not be sufficient to affect institutional culture, especially when teachers’ performance is a function of knowledge and representative patterns that are integrated with daily school dynamics. Educational policy must affect these factors with strategies that shape pedagogical practice so as to foster advancement through the grades on a regular basis, protecting and supporting students’ academic careers. In the absence of such measures, declarations of principle are unlikely to produce the desired results.13
Despite its importance, this indicator must be considered with caution, because while it can reflect a system’s efficiency, it also can be influenced by the particular policies and educational models implemented. Some countries have automatic grade promotion policies, while others promote students on the basis of age. In many cases, the relation between grade repetition and academic performance is somewhat tenuous, since the criteria for evaluating learning vary greatly from one country to another, and even within countries that have
10 UNESCO/LLECE (2008), Los Aprendizajes de los Estudiantes de América Latina y El Caribe. Primer reporte de los resultados del Segundo Estudio Regional Comparativo y Explicativo (SERCE), UNESCO, Santiago, Chile.
11 INEE (2004), La Calidad de la Educación Básica en México, Resultados de la Evaluación Educativa, (Mexico City) noted that repetition is so damaging and affects children to such a degree that excessive age is one of the main reasons that students fail to enter secondary school or drop out.
12 UNESCO (2008), EFA Global Monitoring Report, Overcoming inequality: why governance matters, UNESCO, Paris.
13 Asociación Civil Educación para Todos (2009), op. cit.
Graph 3.1.4. percentage of repeaters in the first grade of primary education. 2008.
Source: Data base of the UNESCO Institute for Statistics (UIS). See data annex for values and explanatory notes.
0
5
10
15
20
25
30
GT BR NI SR CR UY SV HN TT AR PY PN LC VC MX VE CO PE KN AG JM EC DO GD CL BO GY
Repeaters in the first grade of primary Country average (9.0%)

�0
no national criteria governing repetition. Although this may affect the indicator’s international comparability, the percentage of children repeating is an effective direct measure of the waste of resources that occurs when a child enrols in the same grade for two consecutive years.
�.1.2. Completion of primary education
PRIE has proposed that one way to measure completion of primary education is to measure the percentage of adults who have finished grade school. This indicator focuses on the educational performance of individuals whose age qualifies them to have finished primary education. It uses sociodemographic data and reports on the percentages of the population in various age groups that have completed primary school.
The three graphs below present data on completion rates for three age groups (15-19, 20-24 and 25-29). Comparing completion rates for these groups provides information on progress over time.
Graph 3.1.5 shows the youngest group first, since members of this group are candidates for most recently having completed primary school.
For the youngest group (15-19), 7 out of 23 countries have completion rates of over 95%. These are Bahamas, Chile, Argentina, Barbados, Uruguay, Dominica and Mexico.
Thus, the average rate of completion in the 15-to-19 age group is 90.1% in the region. This drops to 88.7% for the 20-24 age group, and to 85.5% for those in the 25-29 range. The figures reveal clear progress in the completion of primary education in the region, although not sufficient to meet Goal I overall in the region. Also, the graph shows major differences between countries in completion rates for primary education.
Despite the shortcomings, it should be stressed that the countries with low primary education completion rates for the oldest group have achieved significant increases: Guatemala 18.8%, Bolivia 18.5%, Honduras 16.1%, Nicaragua 9.6%, Dominican Republic 9.2%, Mexico, 8.2% and El Salvador 7.3%.
Graph 3.1.5. primary completion rate (iSCed 1). Comparison between three age groups. 2008.
Source: Economic Commission for Latin America and the Caribbean (ECLAC), See data annex for values and explanatory notes.
0
10
20
30
40
50
60
70
80
90
100
�� �� �� �� �� �� �� �� �� �� �� �� �� �� �� �� �� �� �� �� �� �� ��
III (Population 15-19) Country average 90.1% II (Population 20-24) Country average 88.7% I (Population 25-29) Country average 85.5%

�1
Finally, Graph 3.1.6 places the countries in descending order according to the percent variation in the completion rates over a ten-year period, to show how completion of primary education has evolved in the countries for which data is available.
In short, the data show that the significant expansion of primary education in recent years has resulted in higher rates of primary school completion. This is clear in the findings for the youngest age group as compared with findings for the older. Major advances are evident in particular in countries with low completion rates in the older age group. However, it should be stressed that many countries are still far from meeting Goal I in this respect.
�.1.�. Parity in primary education
Parity rates for gender, area of residence, income, poverty and ethnicity are presented below.
A graph and a table are provided for each of these parameters. The graph gives parity rates for the three age range in each country in order to show how the realities have changed over time. The data are organized by descending age-groups in order to highlight the variation visible in the younger group.
The table presented for each parity rate uses colours to show the current rate for each group, as follows:
• Cases that fall within the area defined by UNESCO as representing relative equality (parity of between 0.95 and 1.05) are shown in green.
• Pink indicates a level of parity in the completion rates of over 1.05, or disparities in the form of higher parity among typically disadvantaged groups (females, students from rural areas, members of low income families and students of ethnic origin).
Graph 3.1.6. primary completion rate (iSCed 1), 2008. Variation between age groups. Group i: 25-29; Group iii: 15-19
Source: Economic Commission for Latin America and the Caribbean (ECLAC) . See data annex for values and explanatory notes.
-5
0
5
10
15
20
25
GT BO HN NI DO MX SV BZ CR PY SR PE CO BR EC VN PN CL UY BS DM AR BB
Primary (ISCED 1)

�2
• Light blue indicates parity in the completion rates below 0.95, representing disparities (lower completion) among typically advantaged groups (males, students from urban areas, members of high-income families and students of non-indigenous origin).
Text box 3. equity in the completion of educational levels: parity index
As important as monitoring progress toward the goals of access, remaining in school and completing primary and secondary education, is ascertaining whether progress has been made in realizing the right to education on an equitable basis for all social groups.
Parity indices are used to analyse equity of educational opportunity. They are calculated by dividing the size of the typically disadvantaged population by the size of the traditionally advantaged group. Thus, parity indices are dichotomous, using one number to compare two sub-populations. They are used for populations that can be divided into two parts, with the ultimate goal of making the two sub-populations homogeneous in terms of the parameter at issue.
interpreting parity indices
when the value of a parity index is close to unity (between 0.95 and 1.05), parity is present, i.e., the situation is close to being equal for the two sub-populations, and equity is present in the joint population. However, values further from unity represent situations in which the two groups are relatively advantaged/disadvantaged.
A parity index below 0.95 reflects a situation in which the population represented by the numerator is disadvantaged, while the population represented by the denominator is advantaged. An index above 1.05 shows the reverse. Normally, the numerator is used to represent the traditionally disadvantaged group.
Realizing the universal right to education – i.e., ensuring that the benefits of education (access to schooling, remaining in school, and progress through and completion of primary and secondary education) are spread evenly across a society – fundamentally requires achieving gender (female/male) parity, residential (rural/urban) parity, socioeconomic (lower/higher income quintile) parity and ethnic (indigenous/non-indigenous) parity.
Source: PRIE (2009-b), Methodology for building and use. OAS, SEP (Mexico).
a) Gender parity
The graphs below present data on gender parity. As explained above, an index of 1.05 indicates that the female population enjoys a comparative advantage, while a value below 0.95 indicates that the male population is advantaged.
On average, gender parity is within the established margins in most countries, ranging from 0.83 to 1.09 in the oldest age group (average: 0.99) and from 0.86 to 1.15 for the youngest group (average: 1.02).
Countries with low levels of gender parity in the oldest age group show improvement in the younger population. This is the case in Bolivia, El Salvador, Peru and Venezuela. It should be noted that gender parity has not improved in Guatemala or Nicaragua.

��
Table 3.1.8. Gender parity index. Completion iSCed 1 by age groups. 2008.
AR BS BB BZ BO BR CL CO CR DM DO EC SV GT HN Mx NI PN PY PE SR UY VE
25-23 Index = 0,.95
20-24 0,95 Index > 1.05
15-19 Index > = 1.05
Source: Economic Commission for Latin America and the Caribbean (ECLAC). See data annex for values and explanatory notes.
b) residential parity
The following graphs present rural/urban parity data. Values above 1.05 indicate an advantage for rural inhabitants, while values below 0.95 indicate an advantage for urban dwellers.
Rural-urban parity ranges from 0.62 to 1.0 in the 15-19 age range, and from 0.45 to 0.98 in the 25-29 group. It is important to note that all of the region’s countries show progress if the oldest of these age groups (averaging 0.75) is compared with the youngest (averaging 0.86). Bolivia and Guatemala advanced most, with respective differences of 0.3 and 0.21 between parity in the 15-19 age range and the 25-29 range.
In spite of the improvements, the difference in primary completion rates for rural and urban areas continues to be significant. Only Chile and Ecuador show residential parity for the youngest age group.
Graph 3.1.7. Gender parity index. Completion iSCed 1. 2008.
Source: Economic Commission for Latin America and the Caribbean (ECLAC. See data annex for values and explanatory notes.
1
0
GTBOSVPEPYBZMXSRARBSCLECBBCRPNUYCODMBRHNVEDONI
Pop. 15-19 yrs (Country average 1.02) Pop. 20-24 yrs (Country average 1.01) Pop. 25-29 yrs (Country average 0.99)
�4
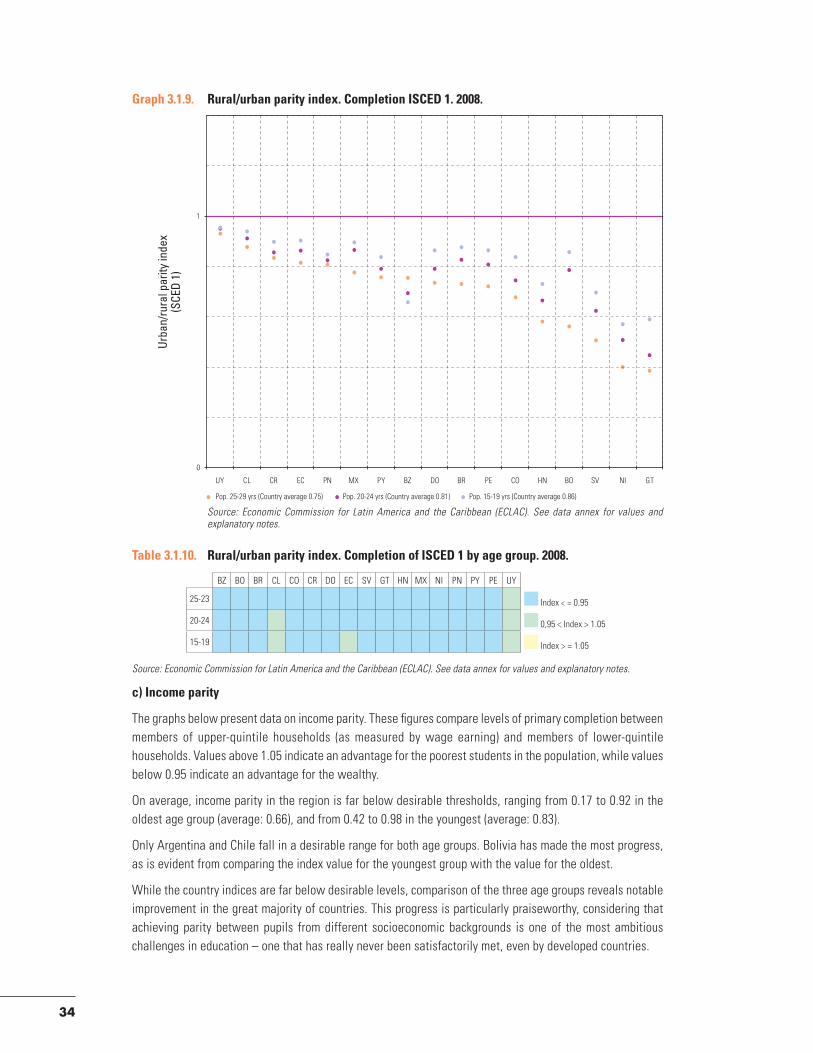
c) income parity
The graphs below present data on income parity. These figures compare levels of primary completion between members of upper-quintile households (as measured by wage earning) and members of lower-quintile households. Values above 1.05 indicate an advantage for the poorest students in the population, while values below 0.95 indicate an advantage for the wealthy.
On average, income parity in the region is far below desirable thresholds, ranging from 0.17 to 0.92 in the oldest age group (average: 0.66), and from 0.42 to 0.98 in the youngest (average: 0.83).
Only Argentina and Chile fall in a desirable range for both age groups. Bolivia has made the most progress, as is evident from comparing the index value for the youngest group with the value for the oldest.
while the country indices are far below desirable levels, comparison of the three age groups reveals notable improvement in the great majority of countries. This progress is particularly praiseworthy, considering that achieving parity between pupils from different socioeconomic backgrounds is one of the most ambitious challenges in education – one that has really never been satisfactorily met, even by developed countries.
Graph 3.1.9. rural/urban parity index. Completion iSCed 1. 2008.
Source: Economic Commission for Latin America and the Caribbean (ECLAC). See data annex for values and explanatory notes.
1
0
Pop. 25-29 yrs (Country average 0.75) Pop. 20-24 yrs (Country average 0.81) Pop. 15-19 yrs (Country average 0.86)
GTNISVBOHNCOPEBRDOBZPYMXPNECCRCLUY
Table 3.1.10. rural/urban parity index. Completion of iSCed 1 by age group. 2008.
BZ BO BR CL CO CR DO EC SV GT HN Mx NI PN PY PE UY
25-23 Index = 0.95
20-24 0,95 Index > 1.05
15-19 Index > = 1.05
Source: Economic Commission for Latin America and the Caribbean (ECLAC). See data annex for values and explanatory notes.

��
d) ethnic parity
The graphs below present data on indigenous/non-indigenous parity. Values above 1.05 indicate an advantage for the indigenous population, while values below 0.95 indicate an advantage for the non-indigenous population.
Few countries collect disaggregated educational information by ethnicity, so this indicator can be calculated only for a limited number of nations. Indigenous/non-indigenous parity indices for successful completion of primary school range from 0.7 to 0.81 in the 15-19 age group, and from 0.52 to 1.03 in the 25-29 group.
Chile and Brazil are the only countries that have achieved ethnic parity with respect to the completion of primary school for the three age groups in question. The ethnic parity indices of Guatemala and Panama have improved over the past 10 years, with parity increasing between the oldest and youngest groups – from 0.52 to 0.70 in Guatemala, and from 0.63 to 0.75 in Panama.
Source: Economic Commission for Latin America and the Caribbean (ECLAC). See data annex for values and explanatory notes.
Graph 3.1.11. Lowest quintile/highest quintile parity index. Completion of iSCed 1. 2008.
1
0
Pop. 25-29 yrs (Country average 0.66) Pop. 20-24 yrs (Country average 0.74) Pop. 15-19 yrs (Country average 0.83)
CL AR UY VE EC DO PN BR CR CO PE MX PY BO SV HN NI GT
Table 3.1.12. Lowest quintile/highest quintile parity index. Completion of iSCed 1 by age group. 2008.
AR BO BR CL CO CR DO EC SV GT HN Mx NI PN PY PE UY VE
25-23 Index = 0.95
20-24 0,95 Index > 1.05
15-19 Index > = 1.05
Source: Economic Commission for Latin America and the Caribbean (ECLAC). See data annex for values and explanatory notes.

��
Nicaragua shows a decrease in ethnic parity with respect to the completion of primary education. The index of 1.03 for the oldest age group falls to 0.89 for the middle group and 0.81 for the youngest. This is of particular note, since it represents a regression in spite of all efforts to the contrary.
Table 3.1.14. indigenous/non-indigenous parity index. Completion iSCed 1 by age groups. 2008.
BO BR CL EC GT NI PN PY
25-23 Index = 0.95
20-24 0,95 Index > 1.05
15-19 Index > = 1.05
Source: Economic Commission for Latin America and the Caribbean (ECLAC). See data annex for values and explanatory notes.
�.1.4. Achievements in primary education – the sERCE study
The region’s countries have made substantial efforts to improve access and rates of remaining in primary and secondary school. However, ensuring that children develop knowledge and abilities that allow them to impart meaning to the information they absorb, and that help them handle the challenges of modern society, is just important as giving them access to school and making sure that they finish their education. Thus, the Summit of the Americas goals stress the importance of providing quality primary and secondary education, as well as increasing access and ensuring completion.
The term “quality education” has been defined in various ways, depending on the type of citizen and society that a country wishes to create. According to OREALC/UNESCO Santiago,14 quality education is a fundamental
14 UNESCO/OREALC (2007a), op. cit.
Graph 3.1.13. indigenous/non-indigenous parity index. Completion iSCed 1. 2008.
Source: Economic Commission for Latin America and the Caribbean (ECLAC). See data annex for values and explanatory notes.
1
0
Pop. 25-29 yrs (Country average 0.83) Pop. 20-24 yrs (Country average 0.86) Pop. 15-19 yrs (Country average 0.88)
GTPNPYBOECCLBRNI

��
right and by definition must have relevance (meaning), pertinence (practical value), parity, efficiency and effectiveness. As a human right and a public good, education gives people the means to exercise their other human rights. Quality education allows individuals to develop themselves fully and to continue learning throughout their lives.
Quality in education, then, means moving toward a broader understanding of education, one not limited to academic performance on standardized tests. Though observing test performance is important in designing effective educational policies and practices, it is not a sufficient tool for dealing with the complex challenges confronting the region’s educational systems.
a) factors associated with learning achievement
Educational and social realities today have reshaped our understanding of what quality education is, as well as the very concept of education and approaches to evaluating it. It was in this context, in late 2002, that the Latin American Laboratory for the Assessment of Quality Education (LLECE) member states undertook the Second Regional Comparative and Explanatory Study (Segundo Estudio Regional Comparativo y Explicativo, or SERCE). The aim of SERCE is to generate valid and reliable data on what primary students are learning and on what role their performance should play in discussing and using this data for educational action and policy-making so as to improve and strengthen public education in the participating countries.15
SERCE provides a preliminary look at the main variables that explain student performance in the region. It is based on the analytical context-input-process-product model, which holds that schools, resources and learning are mediated by the social context surrounding them.
The model provides for an overall analysis of factors that have strong explanatory value in relation to student achievement, pointing to significant relationships between factors and achievement. A plus sign (+) indicates that a factor is positively correlated with achievement, and a minus sign (-) the opposite (Table 3.1.5).
Table 3.1.15. factors strongly associated with learning achievements.
Variable �rd grade Reading
�rd grade Mathematics
�th grade Reading
�th grade Mathematics
�th grade science
School level
rural school + +
Urban private school + + +
principal with teaching degree -
principal’s years of experience -
number of student computers per grade + +
number of books in school library + + + + +
infrastructure + + + +
Services + + + + +
School’s socioeconomic level + + + + +
School climate + + + + +
Classroom level
Teacher has a teaching degree -
Teacher’s years of experience + + + +
female teacher
Additional teaching work -
15 UNESCO/LLECE (2008), op. cit.

��
Variable �rd grade Reading
�rd grade Mathematics
�th grade Reading
�th grade Mathematics
�th grade science
Teacher satisfaction +
Level of student
female student + - + - -
indigenous origin - - - - -
Child labour - - - - -
previous years of schooling + + + + +
Student’s social class + + + + +
Climate among students + + + + +
Source: UNESCO/LLECE, Primer Reporte SERCE: Los aprendizajes de los estudiantes de América Latina y el Caribe, 2008.
Overall analysis of school factors shows that school climate, infrastructure, services and the availability of books in the library are consistently positively related to achievement in almost all areas and grades evaluated.
School climate contributes the most to students’ success. Its impact is greatest in sixth-grade reading and science and in third-grade mathematics. This underlines the importance of harmonious, positive human relationships within schools as an essential element of an environment that fosters learning.
Among the classroom variables, only the teacher’s experience has a consistently positive impact on student performance.
Context variables such as average social and cultural class, gender, speaking an indigenous language, prevalence of child labour, number of years of prior schooling and a student’s socioeconomic and cultural level correlate consistently with achievement.
Socioeconomic and cultural level is one of the most important variables explaining achievement.
b) Levels of learning
Although the quality of educational systems cannot be reduced to academic achievement for measuring purposes, levels of learning play a central role in evaluating the quality of education.
The SERCE study16 is a standardized international evaluation of achievement among primary students in 15 Summit of the Americas nations: Argentina, Brazil, Chile, Colombia, Costa Rica, Dominican Republic, Ecuador, El Salvador, Guatemala, Mexico, Nicaragua, Panama, Paraguay, Peru and Uruguay. Approximately 5,000 students, between 140 and 370 classrooms and 200 schools are evaluated for each grade in each country.
The disciplines evaluated are reading, writing and mathematics among third- and sixth-grade students, and science among sixth-graders. The tests take two approaches. The first, which is curricular, focuses on areas of knowledge and processes common to the region’s curricula. The other focuses on life skills as defined by UNESCO, and is based on the notion that what is taught at school must contribute positively to work life beyond the period spent in school.
The paragraphs below present the SERCE findings. They refer to four proficiency levels that reflect what students are capable of doing in each of the areas and grades evaluated. The graphs show proficiency for each country in blue. Dark blue shows the percentage of students at level IV, while light blue shows the percentage of students who have achieved at least level I. The appendix includes descriptions of the proficiency levels and their meaning in each category.
16 For more information, see UNESCO (2008), op. cit.

��
The percentage of students who have reached the highest level of reading comprehension ranges from 0.6% (Dominican Republic) to 18.2% (Costa Rica), while the percentage below the minimum level ranges from 1.5% (Costa Rica) to 31.4% (Dominican Republic). Graph 3.1.16 shows these findings.
On average, 62% of third graders achieve at least level II performance in reading. This means that they are capable of recognising protagonists and character development in linear stories, the purpose of a recipe, the topic of poster or the attributes of an object in a description.
Over 70% of students performed at least at this level in six countries (Costa Rica, Chile, Mexico, Uruguay, Colombia and Argentina).
The percentage of sixth grade students who have reached the highest level of reading comprehension ranges from 1.4% (Dominican Republic) to 34.6% (Cost Rica), while the percentage below the minimum level ranges from 0.2% (Costa Rica) to 4.5% (Ecuador).
Graph 3.1.17 shows these findings. The increase in the percentage of students that have reached level IV in sixth grade, as compared with third grade, is noteworthy (15.4% versus 7.2%).
On average for the countries evaluated, 76.6% of sixth grade students have reached at least level II in language. This means that they are able to understand characters’ intentions and explicit phenomena in a story line, as well as explicit causes in an historical account, and to identify the addressee in a letter.
Over 85% of students have achieved at least that level in five countries (Costa Rica, Chile, Uruguay, Mexico and Colombia).
In third grade mathematics, the percentage of students at the highest level ranges from 0.1% (Dominican Republic) to 19% (Uruguay) and the percentage of those under the minimum level ranges from 2.6% (Costa Rica) to 41.3% (Dominican Republic). Graph 3.1.18 shows these findings.
On average for the countries evaluated, 48.2% of third graders have reached at least level II in mathematics. This means that they can solve simple problems in familiar contexts that involve recognising and using a single basic operation (addition, subtraction or multiplication).
Graph 3.1.16. percentage of students by proficiency levels in language. 3rd grade. 2006.
Source: UNESCO/LLECE, Primer Reporte SERCE: Los aprendizajes de los estudiantes de América Latina y el Caribe, 2008.
0%
10%
20%
30%
40%
50%
60%
70%
80%
90%
100%
CR CL MX UY CO AR BR PY SV PN PE EC GT NI DO
Level < 1 Level I Level II Level III Level IV

40
Over 70% of the students have reached at least this level in four countries (Costa Rica, Uruguay, Chile and Mexico).
Graph 3.1.18. percentage of students by proficiency levels in mathematics. 3rd grade. 2006.
Source: UNESCO/LLECE, Primer Reporte SERCE: Los aprendizajes de los estudiantes de América Latina y el Caribe, 2008.
The percentage of sixth grade students who have reached the highest level of performance in mathematics ranges from 0.2% (Dominican Republic) to 32.3% (Uruguay), while the percentage of those under the minimum level ranges from 0.1% (Costa Rica) to 5.7% (Dominican Republic). Graph 3.1.19 shows these findings. Notably the countries on average have increased the percentage of third grade students who have reached level IV (from 8% to 9.3%).
0%
10%
20%
30%
40%
50%
60%
70%
80%
90%
100%
UY MX CL CR BR AR PY CO PE EC SV PN GT NI DO
Level < 1 Level I Level II Level III Level IV
0%
10%
20%
30%
40%
50%
60%
70%
80%
90%
100%
CR UY CL MX BR AR CO PN SV PE PY EC NI GT DO
Level < 1 Level I Level II Level III Level IV
Source: UNESCO/LLECE, Primer Reporte SERCE: Los aprendizajes de los estudiantes de América Latina y el Caribe, 2008.
Graph 3.1.17. percentage of students by proficiency levels in language. 6th grade. 2006.

41
On average for the countries evaluated, 79.9% of sixth grade students have reached at least level II in mathematics. This means that they can solve problems that require simple strategies based on explicit relevant information, and involving one or two of the four basic operations.
Over 85% students have reached at least that level in six countries (Costa Rica, Uruguay, Mexico, Chile, Argentina and Colombia).
Graph 3.1.19. percentage of students by proficiency levels in mathematics. 6th grade. 2006.
Source: UNESCO/LLECE, Primer Reporte SERCE: Los aprendizajes de los estudiantes de América Latina y el Caribe, 2008.
Only eight of the Summit of the Americas countries participated in evaluation in the sciences: Argentina, Colombia, the Dominican Republic, El Salvador, Panama, Paraguay, Peru and Uruguay. This test is used only for sixth grade. The percentage of students who have reached the highest level ranges from 0% (Dominican Republic) to 3.1% (Uruguay), while the percentage of students under the minimum level ranges from 1.7% (Uruguay) to 14.3% (Dominican Republic). Graph 6.7 shows these findings.
On average for the countries evaluated, 1% of sixth-graders have reached level IV in the sciences, and 51.8% have reached at least level II. This means that they understand the characteristics of living beings (animals and plants), including their diversity and classification, can identify large groups, are familiar with the solar system and of the flow of energy in ecosystems, and grasp simple physical and chemical changes, behaviour and characteristics.
In two countries, at least 65% of students have reached this level (Uruguay and Colombia).
Based on findings regarding the 15 Summit of the Americas countries that participated in the reading and mathematics studies, and the eight that did so in science, and the level achieved by the majority of students, the averages for each category and grade are as follows: third-grade language, 35.9% at level II; sixth-grade language, 37.2% at level II; third-grade mathematics, 39.1% at level I; sixth-grade mathematics, 42.4% at level II; and sixth-grade science, 42% at level I.
Finally, as regards the improvement noted above between third grade and sixth grade, it is important to note that on average in the countries participating in the study, there was a 23% increase in the percentage of students reaching at least level II in reading (from 62% in the third grade to 76.6% in sixth) and a 65.6%
0%
10%
20%
30%
40%
50%
60%
70%
80%
90%
100%
UY MX CR CL AR PE BR CO PY EC SV PN GT NI DO
Level < 1 Level I Level II Level III Level IV

42
increase in the average percentage of students reaching at least level II in mathematics (from 48.2% in third grade to 79.9% in sixth).
�.2. gOAL 2: ACCEss Of AT LEAsT ��% Of yOUNg PEOPLE TO qUALITy sECONDARy EDUCATION wITh INCREAsINg COMPLETION RATEs
Successful completion of primary education is merely the foundation for lifetime learning and cannot alone guarantee opportunities for human development.
According to ECLAC (1997),17 completing at least 12 years of schooling – the time required to complete secondary education in most of the region’s countries – constitutes the minimum educational capital for wellbeing. This is because that amount of schooling is associated with a more than 80% probability of securing a job with an income that provides an adequate standard of living.18 Secondary education is thus the key to work opportunities and to increasing the probability of remaining above the poverty line.
Increasing access to quality secondary education in the region, and thus to more complex skills and knowledge, ultimately means access to better and more productive jobs for many young people. It also means more individual opportunity and a greater likelihood that the region’s countries will be successful in economic and human development.
Like the previous section, this section is divided into three parts. It begins by describing the progress that has been made toward universal access and keeping students in secondary school, and then turns to the question of successful completion of lower and upper secondary school (ISCED 2 and 3). Finally, it analyses potential problems of parity in fulfilling this goal on the two levels of secondary education.
17 ECLAC (1997), Social Panorama of Latin America, 1997, ECLAC, Santiago, Chile.
18 This concept involves an “educational threshold”. Operationally, one can measure the threshold necessary for staying out of poverty, which is currently 12 years of formal education. See ECLAC (2000), Social Panorama of Latin America 1999-2000, Santiago, Chile.
Level < 1 Level I Level II Level III Level IV
0%
10%
20%
30%
40%
50%
60%
70%
80%
90%
100%
UY AR CO PY PN SV PE DO BR CL CR EC GT MX NI
Graph 3.1.20. percentage of students by proficiency levels in science. 6th grade. 2006.
Source: UNESCO/LLECE, Primer Reporte SERCE: Los aprendizajes de los estudiantes de América Latina y el Caribe, 2008.

4�
�.2.1. Access to secondary education
The net enrolment rate (NER) in secondary education is an indicator of access to this level of education. It measures the relative participation of children who are of official secondary-school age. The secondary education NER includes both secondary levels (ISCED 2 and 3).
Graph 3.2.1 ranks the countries from highest to lowest secondary NER as of school year 2008, showing recent levels in the region ranging from 39.9% (Guatemala) to 90.3% (St. Vincent and the Grenadines) and averaging 70.7%.
The average increase in net secondary enrolment between 2000 and 2008 in the region was 10.1%.
Graph 3.2.1. evolution in the net enrolment rates in secondary education. 2000-2008.
Source: Data base of the UNESCO Institute for Statistics (UIS). See data annex for values and explanatory notes.
0
10
20
30
40
50
60
70
80
90
100
VC GD US BS C L LC AR KN BR JM PE TT CO MX BO VE UY PN SR BZ EC DO P Y SV NI G T DM
2000 2008Country average 2000 (60.6%) Country average 2008 (70.7%)
Graph 3.2.2. Variation in the net enrolment rates in secondary education. 2000-2008.
Source: Data base of the UNESCO Institute for Statistics (UIS). See data annex for values and explanatory notes.
-30
-20
-10
0
10
20
30
40
50
60
70
G T DO VE VC NI LC EC MX CO BS SV PE BR BZ TT PN BO US AR SR JM
NER. Secondary education (Change 2000-2008)

44
Graph 3.2.2 shows variation in the indicator during that period from a 2000 baseline. The greatest increases took place in Guatemala (48.5%) and the Dominican Republic (47.2%).
There was a rising trend in access to secondary education in the 26 countries for which information was available (with only one country showing a minimal downward trend). Furthermore, the fact that in 2008 eight out of 21 countries had secondary net enrolment rates of over 75% (as opposed to three countries in 2000) shows that progress is being made toward the goal of access to secondary education in the Summit of the Americas countries. Much work remains to be done, however.
�.2.2. Completion of lower secondary education (IsCED 2)
A second condition required to reach Goal II is an increase in the percentage of students finishing secondary school.
The section below provides an analysis of completion rates for the two levels of secondary education, starting with the lower level (ISCED 2). Three graphs present information for various age groups (20-24, 25-29 and 30-34), showing changing rates over time.
Text box 4. Measuring completion rates for educational levels
The completion rates for primary and secondary education cited here represent the percentage of the population who have completed primary (or secondary) education as a percentage of the total population in the relevant age group.
The reliability of this indicator is based on the fact that the information needed to calculate it derives from a single information source. Temporal analysis can be carried out by using different waves or years of household surveys, or by comparing the data on different age groups from the same information source.
interpreting completion rates
This indicator presents, in a simple and direct way, a clear overlook of the completion level for primary education by showing what proportion of the population has had the opportunity, given their age, to complete this level of education. It represents a very useful tool to analyse the educational situation since it allows knowing the relative volume of the population that has completed the primary education in the recent past.
Although this indicator is an appropriate way of determining educational levels in the population, it has limitations in that it produces findings based entirely on past efforts to reach the objective, and does not take account of current developments in an educational system. Also, since household surveys may or may not exist in a given country, and may or may not be of regular periodicity, the indicator cannot necessary be followed over time.
Source: PRIE (2009-b), Methodology for Building and Use. OAS, SEP (Mexico) and UNESCO.
Graph 3.2.3 shows completion rates in the youngest age group in comparison with the older groups.
Lower secondary completion rates for the three age groups are as follows: 71% on average for the 20-24 age range, declining to 65.3% for the 25-29 age range and 59.7% for the 30-34 group.
For the oldest group, only 3 out of 22 countries in the region have completion rates above 75%. In the youngest group, 10 countries have already reached Goal II.
while the above figures are not very high, the significant increases in countries with lower completion rates for this level in the youngest age group are noteworthy.

4�
Graph 3.2.4 presents the countries in descending order of percent variation (over a ten-year period), providing a general view of the situation in the countries for which information was available.
Graph 3.2.4. Lower secondary completion rate (iSCed 2). 2008. Variation between different age groups. Group i: pop. 30-34; Group iii: pop. 20-24.
Source: Economic Commission for Latin America and the Caribbean (ECLAC). See data annex for values and explanatory notes.
The countries with the greatest variation between the different age groups are: Dominica 80.6%, Honduras 50.9%, Paraguay 40.0%, Dominican Republic 30.2%, Nicaragua 29.8%, Bolivia 26.7% and Costa Rica 25.7%.
Graph 3.2.3. Lower secondary completion rate (iSCed 2). Comparison between three age groups. 2008.
Source: Economic Commission for Latin America and the Caribbean (ECLAC). See data annex for values and explanatory notes.
0
10
20
30
40
50
60
70
80
90
100
BB BS CL BO PE AR DO BR MX PN VE UY CO EC PY DM SR CR SV NI HN GT
III (Pop. 20-24) II (Pop. 25-29) I (Pop. 30-34) Country average 59.7%Country average 65.3%Country average 71.0%
-20
0
20
40
60
80
100
DM HN PY DO NI BO CR EC BR GT MX CO PE SV PN VN AR UY CL SR BB BS
Lower secondary (ISCED 2)
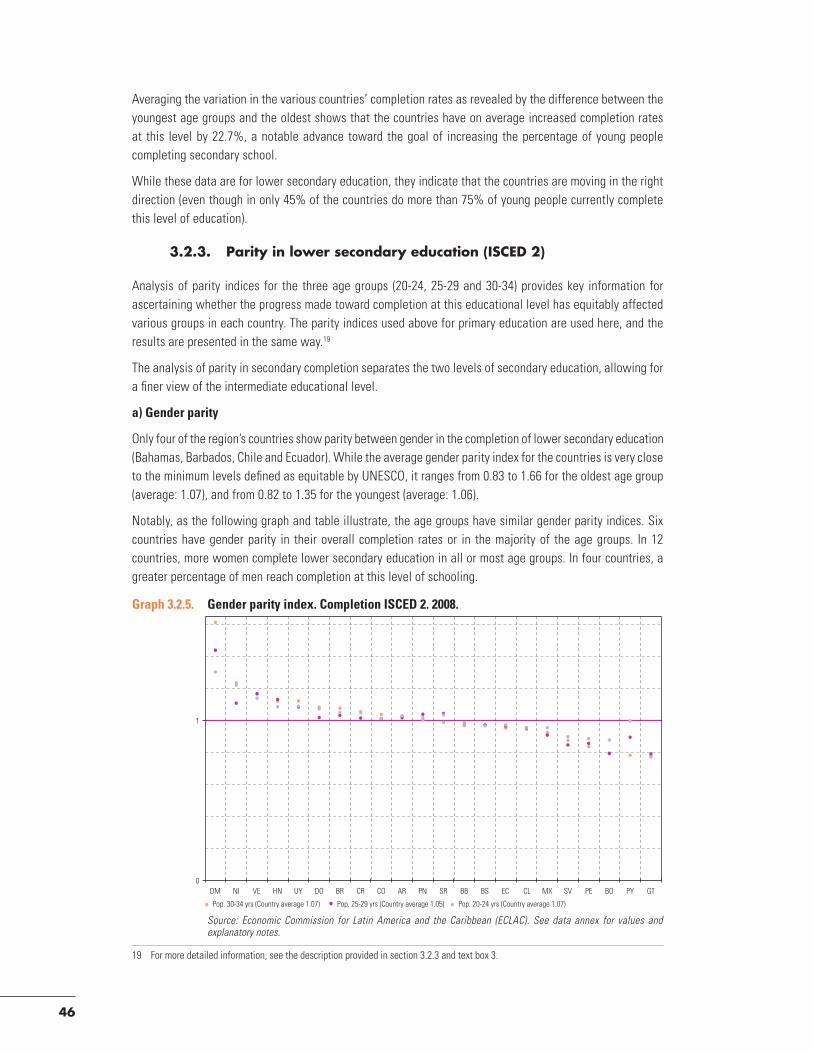
4�
Averaging the variation in the various countries’ completion rates as revealed by the difference between the youngest age groups and the oldest shows that the countries have on average increased completion rates at this level by 22.7%, a notable advance toward the goal of increasing the percentage of young people completing secondary school.
while these data are for lower secondary education, they indicate that the countries are moving in the right direction (even though in only 45% of the countries do more than 75% of young people currently complete this level of education).
�.2.�. Parity in lower secondary education (IsCED 2)
Analysis of parity indices for the three age groups (20-24, 25-29 and 30-34) provides key information for ascertaining whether the progress made toward completion at this educational level has equitably affected various groups in each country. The parity indices used above for primary education are used here, and the results are presented in the same way.19
The analysis of parity in secondary completion separates the two levels of secondary education, allowing for a finer view of the intermediate educational level.
a) Gender parity
Only four of the region’s countries show parity between gender in the completion of lower secondary education (Bahamas, Barbados, Chile and Ecuador). while the average gender parity index for the countries is very close to the minimum levels defined as equitable by UNESCO, it ranges from 0.83 to 1.66 for the oldest age group (average: 1.07), and from 0.82 to 1.35 for the youngest (average: 1.06).
Notably, as the following graph and table illustrate, the age groups have similar gender parity indices. Six countries have gender parity in their overall completion rates or in the majority of the age groups. In 12 countries, more women complete lower secondary education in all or most age groups. In four countries, a greater percentage of men reach completion at this level of schooling.
19 For more detailed information, see the description provided in section 3.2.3 and text box 3.
Graph 3.2.5. Gender parity index. Completion iSCed 2. 2008.
Source: Economic Commission for Latin America and the Caribbean (ECLAC). See data annex for values and explanatory notes.
Pop. 30-34 yrs (Country average 1.07) Pop. 25-29 yrs (Country average 1.05) Pop. 20-24 yrs (Country average 1.07)
0
1
DM NI VE HN UY DO BR CR CO AR PN SR BB BS EC CL MX SV PE BO PY GT

4�
Table 3.2.6. Gender parity index iSCed 2 by age group. 2008.
AR BS BB BZ BO BR CL CO CR DM DO EC SV GT HN Mx NI PN PY PE SR UY VE
30-34 Index = 0.95
25-29 0,95 Index > 1.05
20-24 Index > = 1.05
Source: Economic Commission for Latin America and the Caribbean (ECLAC). See data annex for values and explanatory notes.
b) residential parity
The rural-urban parity rate for the completion of lower secondary education ranges from 0.36 to 0.91 for the 20-24 year-old population and from 0.19 to 0.79 for the 30-34 group. Although this remains far from desirable levels, progress is visible in all of the region’s countries between the two extreme generations. (The average of the countries’ indices is 0.43 for the oldest group and 0.60 for the youngest.) However, no country can point to parity in any of these age groups.
Table 3.2.8. rural/urban parity index. Completion iSCed 2 by age groups. 2008.
BZ BO BR CL CO CR DO EC SV GT HN Mx NI PN PY PE UY Sin datos
30-34 Index = 0.95
25-29 0,95 Index > 1.05
20-24 Index > = 1.05
Source: Economic Commission for Latin America and the Caribbean (ECLAC). See data annex for values and explanatory notes.
c) income parity
Income parity is also far below desirable levels on average, ranging from 0.01 to 0.07 for the oldest group (average for the countries: 0.31), and from 0.06 to 0.91 for the youngest (average: 0.47). No country shows income parity for any of the groups analysed.
Graph 3.2.7. rural/urban parity index. Completion iSCed 2. 2008.
Source: Economic Commission for Latin America and the Caribbean (ECLAC). See data annex for values and explanatory notes.
0
1
CL DO MX UY CR PN PY PE BO BR EC SV CO NI GT HN
Pop. 30-34 yrs (Country average 0.43) Pop. 25-29 yrs (Country average 0.49) Pop. 20-24 yrs (Country average 0.60)

4�
Graph 3.2.9. Lowest quintile/highest quintile parity index. Completion of iSCed 2. 2008.
Source: Economic Commission for Latin America and the Caribbean (ECLAC). See data annex for values and explanatory notes.
Table 3.2.10. Lowest quintile/highest quintile parity index. Completion iSCed 2 by age group, 2008.
AR BO BR CL CO CR DO EC SV GT HN Mx NI PN PY PE UY VE
30-34 Index = 0.95
25-29 0,95 Index > 1.05
20-24 Index > = 1.05
Source: Economic Commission for Latin America and the Caribbean (ECLAC). See data annex for values and explanatory notes.
d) ethnic parity
Pop. 30-34 yrs (Country average 0.31) Pop. 25-29 yrs (Country average 0.35) Pop. 20-24 yrs (Country average 0.47)
0
1
CL DO VE AR UY MX PE BR BO CO EC PN PY CR SV NI HN GT
Pop. 30-34 yrs (Country average 0.61) Pop. 25-29 yrs (Country average 0.68) Pop. 20-24 yrs (Country average 0.71)
0
1
BR CL NI BO EC PY GT PN
Graph 3.2.11. indigenous/non-indigenous parity index. Completion of iSCed 2. 2008.
Source: Economic Commission for Latin America and the Caribbean (ECLAC). See data annex for values and explanatory notes.

4�
The parity indices for Indigenous versus non-indigenous individuals in regard to completion of lower secondary education range from 0.45 to 0.95 for the 20-24 population (regional average: 0.71) and from 0.17 to 0.92 for the 30-34 group (regional average: 0.61).
Chile and Nicaragua are the only countries to have achieved ethnic parity in the completion of lower secondary education in any of the groups studied (20-24 for Chile and 25-29 for Nicaragua). Paraguay and Panama show the highest levels of disparity for the oldest age group, though these are also the two countries showing the greatest progress toward ethnic parity for the younger groups (0.37 to 0.57, and 0.17 to 0.45, respectively).
Table 3.2.12. indigenous/non-indigenous parity index. Completion iSCed 2 by age group, 2008
BO BR CL EC GT NI PN PY
30-34 Index = 0.95
25-29 0,95 Index > 1.05
20-24 Index > = 1.05
Source: Economic Commission for Latin America and the Caribbean (ECLAC). See data annex for values and explanatory notes.
�.2.4. Completion of upper secondary education (IsCED �)
The following information shows upper secondary education completion rates, in effect indicating whether Goal II has been reached or not. This information also presented in three graphs, and provides data for three age groups (20-24, 25-29 and 30-34).
Graph 3.2.13 is organized to show completion levels in youngest group (those who most recently were of the age appropriate to this level of education) in comparison with the older group (Group III).
Graph 3.2.13. Upper secondary education completion rate (iSCed 3). Comparison between three age groups. 2008.
Source: Economic Commission for Latin America and the Caribbean (ECLAC). See data annex for values and explanatory notes.
Finally, Graph 3.2.14 presents the countries in descending order of percent variation in the rate (over a ten-year period), providing a general overview of secondary completion in the countries for which data was available.
0
10
20
30
40
50
60
70
80
90
100
BB BS CL PE AR BO VE PN EC BR DO PY MX CR BZ UY SV NI CO HN GT DM SR
III (Pop. 20-24) Country average 51.8% II (Pop. 25-29) Country average 48.0% I (Pop. 30-34) Country average 42.6%

�0
Graph 3.2.14. Upper secondary school completion rate (iSCed 3). 2008. Variation between three age groups. Group i: 30-34; Group iii: 20-24.
Source: Economic Commission for Latin America and the Caribbean (ECLAC). See data annex for values and explanatory notes.
Secondary school completion rates for the three age groups are as follows: 50.2% for the 20-24 age range, 46.7% for the 25-29 group and 41.3% for the 30-34 age range.
In Barbados, Bahamas and Chile (8.7% of the countries), the completion rate is 75% in the oldest group, and 13% in the youngest.
The countries with the lowest completion rates for the youngest group have made significant progress among the youngest members of their populations, and their current figures are as follows: Dominica 69.3%, Dominican Republic 53.5%, Honduras 42.5%, Mexico 41.7%, Paraguay 38.9%, Nicaragua 35.6% and Surinam 29.7%.
Averaging the various countries’ difference between their youngest- and oldest-group completion rates shows that on average the countries have increased completion rates at this educational level by 25.7% (even more than the 22.7% increase in the first cycle).
Finally, calculating the average for the countries where data are available, 71% of young people between the ages of 20 and 24 have completed lower secondary education, and 50% have completed upper secondary as well. Thus, while much work remains, the significant difference between the youngest and oldest groups suggests that completion rates are gradually increasing over time. In other words, the findings point to inter-generational progress in completion of secondary school around the region.
�.2.�. Parity in the completion of upper secondary education (IsCED �)
Following the organization of the section on parity above, the information below on parity in the completion of secondary education within certain social groups is presented for three age range (20-24, 25-29 and 30-34). The parity indices used will be familiar from the section on primary education above, and the data are presented in the same way.20
20 For more detailed information, see the description provided in section 3.2.3 and text box 3.
-20
0
20
40
60
80
100
DM DO HN MX PY NI SR BO EC BZ CL BR PE AR CR CO VN PN UY GT SV BB BS
Upper secondary (ISCED 3)

�1
a) Gender parity
Gender parity in completion of secondary school varies widely among the countries. Only five (Barbados, Chile, El Salvador, Mexico and Peru) show parity in the youngest age group. The average gender parity rate among the countries is barely within the threshold for equitability as defined by UNESCO, at 1.1 for the three age groups in the aggregate. However, it ranges from 0.9 to 1.4 in the oldest group and from 0.88 to 1.55 in the youngest.
Graph 3.2.15, which shows gender parity by country and age group, indicates that there are three countries whose completion rates are gender-equitable overall or in most of the age groups analysed. In three, more men finish upper secondary school than women, and in 14 more women complete this educational level in all or most of the age groups.
Graph 3..2.15. Gender parity index. Completion of iSCed 3. 2008.
Source: Economic Commission for Latin America and the Caribbean (ECLAC). See data annex for values and explanatory notes.
Table 3.2.16. Gender parity index. Completion of iSCed 3 by age group. 2008.
AR BO BR CL CO CR DO EC SV GT HN Mx NI PN PY PE UY VE
25-23 Index = 0.95
20-24 0,95 Index > 1.05
15-19 Index > = 1.05
Source: Economic Commission for Latin America and the Caribbean (ECLAC). See data annex for values and explanatory notes.
This situation of inequity to the disadvantage of the male population in the region is distinctive. The high level of gender parity in access to and completion of primary education is striking. However, the situation at the secondary level in most of the region’s countries is to the disadvantage of the traditionally advantaged group.
Pop. 30-34 yrs (Country average 1.08) Pop. 25-29 yrs (Country average 1.10) Pop. 20-24 yrs (Country average 1.15)
0
1
UY VE DO CR BR NI HN CO AR PN DM BS BB SV EC MX CL GT SR BZ PY PE BO

�2
b) residential parity
The urban-rural parity index ranges from 0.23 to 0.74 for the 20-24 age range, and from 0.1 to 0.5 for the 30-34. Though these are far from reaching desirable thresholds, every country in the region has made progress between the older and younger groups. (The index’s average value is 0.33 for the oldest group and 0.46 for the youngest).
Graph 3.2.17. rural/urban parity index. Completion iSCed 3. 2008.
Source: Economic Commission for Latin America and the Caribbean (ECLAC). See data annex for values and explanatory notes.
Table 3.2.18. rural/urban parity index. Completion iSCed 3 by age group. 2008.
AR BO BR CL CO CR DO EC SV GT HN Mx NI PN PY PE UY VE
25-23 Index = 0.95
20-24 0,95 Index > 1.05
15-19 Index > = 1.05
Source: Economic Commission for Latin America and the Caribbean (ECLAC). See data annex for values and explanatory notes.
c) income parity
On average, the income parity indices are well below desirable ranges, falling between 0.0 and 0.4 for the oldest group, and between 0.1 and 0.6 for the youngest group (respective averages for the two groups in the region’s countries being 0.16 and 0.28). No country shows income parity for the groups analysed, and only Argentina and Bolivia show increases of over 0.2 in their index between the oldest and youngest groups.
0
1
Pop. 30-34 yrs (Country average 0.32) Pop. 25-29 yrs (Country average 0.36) Pop. 20-24 yrs (Country average 0.44)
DO CL CR MX BZ PN UY PY PE BO BR EC SV NI HN GT CO
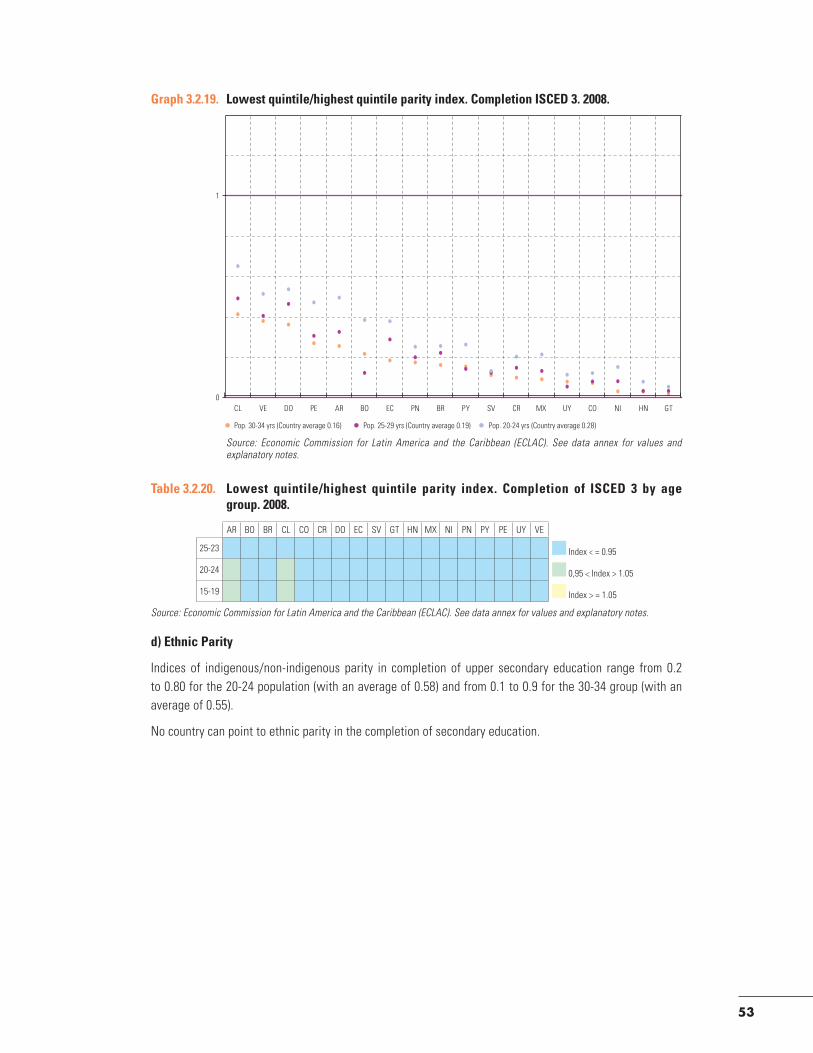
��
Graph 3.2.19. Lowest quintile/highest quintile parity index. Completion iSCed 3. 2008.
Source: Economic Commission for Latin America and the Caribbean (ECLAC). See data annex for values and explanatory notes.
Table 3.2.20. Lowest quintile/highest quintile parity index. Completion of iSCed 3 by age group. 2008.
AR BO BR CL CO CR DO EC SV GT HN Mx NI PN PY PE UY VE
25-23 Index = 0.95
20-24 0,95 Index > 1.05
15-19 Index > = 1.05
Source: Economic Commission for Latin America and the Caribbean (ECLAC). See data annex for values and explanatory notes.
d) ethnic parity
Indices of indigenous/non-indigenous parity in completion of upper secondary education range from 0.2 to 0.80 for the 20-24 population (with an average of 0.58) and from 0.1 to 0.9 for the 30-34 group (with an average of 0.55).
No country can point to ethnic parity in the completion of secondary education.
Pop. 30-34 yrs (Country average 0.16) Pop. 25-29 yrs (Country average 0.19) Pop. 20-24 yrs (Country average 0.28)
0
1
CL VE DO PE AR BO EC PN BR PY SV CR MX UY CO NI HN GT

�4
Graph 3.2.21. indigenous/non-indigenous parity index. Completion iSCed 3. 2008.
Source: Economic Commission for Latin America and the Caribbean (ECLAC). See data annex for values and explanatory notes.
Table 3.2.22 indigenous/non-indigenous parity index. Completion iSCed 3 by age group. 2008.
AR BO BR CL CO CR DO EC SV GT HN Mx NI PN PY PE UY VE
25-23 Index = 0.95
20-24 0,95 Index > 1.05
15-19 Index > = 1.05
Source: Economic Commission for Latin America and the Caribbean (ECLAC). See data annex for values and explanatory notes.
�.2.�. Achievements in secondary education – the PIsA study
After implementing national assessment systems, several Latin American countries joined regional and international assessment programmes. Six Latin American countries (Argentina, Brazil, Chile, Colombia, Mexico and Uruguay) have participated in the 2006 Programme for International Student Assessment (PISA) study, which evaluated the reading skills and mathematical and scientific literacy of 15-year-olds without regard to their grade in school. Despite the non-correlation with grade level, the study provides a snapshot of students’ performance at the secondary level, since most individuals in this age range are enrolled in lower secondary education.
The six countries mentioned, along with Spain and Portugal, constitute the Ibero-American PISA Group (GIP), which was created in 2005 to foster cooperation, discussion and mutual assistance among Ibero-American countries participating in PISA. The idea was to contribute to decisions on the study’s technical and educational policies, as well as enriching PISA’s scientific studies. The ultimate aim was to ensure that PISA’s approach – its purposes, decision making and analysis –reflects sensitivity to the region’s particular circumstances and educational interests.21
21 OECD (2009), Iberoamerica en PISA 2006, Informe Regional, Santillán, Spain.
0
1
BR NI BO CL EC PY GT PN
Pop. 30-34 yrs (Country average 0.55) Pop. 25-29 yrs (Country average 0.59) Pop. 20-24 yrs (Country average 0.58)

��
PISA studies a cross-section of 15-year-old students from each participating country, federal state, region or community, drawing on a minimum of 4,500 students and 150 educational institutions per country, and 50 institutions per state, region or community.
The following material outlines some of the PISA findings regarding the participating Latin American countries.
In reading skills, a mere average over countries of 1.6% of the students evaluated were at the top proficiency level, and 48.9% were not even at level 2. These students are not capable of identifying the main idea of a text, or of understanding relationships within it. Nor can they make comparisons or connections between a text and outside knowledge, or draw on personal experience and attitudes for that purpose.
within this scenario, Chile turns in the best performance: 32.1% of its students are at levels 3 and 4, while 3.5% place at the highest level.
Graph 3.2.23. percentage of 15 year old students by proficiency levels in reading. 2006.
Source: Organization for Economic Co-operation and Development (OECD), data from the PISA study, 2006. See data annex for values and explanatory notes.
Findings on mathematical skills are worse yet, with 61% of students below level 2. This means that they do not know how to interpret and recognise situations in contexts where no more than direct inference is required, that they cannot extract relevant information from a single source or make use of a single mode of representation and that they are unable to use algorithms, formulas, procedures or elementary mathematical conventions. On average, only 16.2% place at levels 3 and 4, and a mere 1.3% above that.
Uruguay shows the best performance, as 26.5% of its students are at levels 3 and 4, while 3.2% are at a level defined as proficient.
In science skills, 51.7% of students are at level >1 or 1. In other words, their scientific knowledge is not sufficient to suggest possible explanations in familiar contexts or conclusions based on simple research. Nor are they capable of direct reasoning, of literal interpretation of findings from a scientific inquiry or of technological problem solving. Only 0.8% of students are at the highest levels.
Level >1 and 1 Level 2 Level 3 and 4 Level 5 and 6
0%
10%
20%
30%
40%
50%
60%
70%
80%
90%
100%
CL UY MX CO BR AR

��
Here, again, Chile performs well, with 28.5% of its students reaching levels 3 and 4, and 1.9% levels 5 and 6.
Graph 3.2.25. percentage of 15 year old students by proficiency levels in science. 2006.
Source: Organization for Economic Co-operation and Development (OECD), data from the PISA study, 2006. See data annex for values and explanatory notes.
The PISA study reconfirms that the distribution of knowledge in school children tends to reflect the inequalities of the income distribution.
Countering this, there is a somewhat proportional relationship between learning outcomes as measured by the PISA study and the amount per student that the countries in the study invest. However, countries that spend similar amounts per pupil show unequal levels of knowledge. Thus, the correlation between
Graph 3.2.24. percentage of 15 year old students by proficiency levels in mathematics. 2006.
Source: Organization for Economic Co-operation and Development (OECD), data from the PISA study, 2006. See data annex for values and explanatory notes.
0%
10%
20%
30%
40%
50%
60%
70%
80%
90%
100%
UY CL MX AR CO BR
Level >1 and 1 Level 2 Level 3 and 4 Level 5 and 6
0%
10%
20%
30%
40%
50%
60%
70%
80%
90%
100%
CL UY MX AR CO BR
Level >1 and 1 Level 2 Level 3 and 4 Level 5 and 6

��
investment and learning is strong, but not absolute. The measures that countries undertake to optimise the use of their available resources must be recognised as an important factor as well. Most Latin American countries suffer not only from a lack of resources but also from rather ineffective management and use of their resources.
�.�. gOAL �: OffERINg LIfELONg EDUCATIONAL OPPORTUNITIEs TO ThE gENERAL POPULATION
The concept of lifelong learning dates from the 1960s, when it emerged as a response to the lack of opportunity affecting people who lacked the benefits of formal education during childhood or youth. At the global level, UNESCO played a key role in promoting discussions of lifelong learning, lending strong impetus to the idea that it should be a universal phenomenon and one pursued throughout life. The world Declaration on Education for All issued in Jomtiem in 1990 describes education as beginning at birth and continuing throughout one’s lifetime.22
Lifelong learning is an essential element of human development. It can take different forms in formal and non-formal institutions, including various types of education, such as adult literacy, essential practical skills, occupational skills and basic education for children who have not attended school. The goal is to make equal opportunity for learning a priority.
Text box 5. Lifelong learning
The UNESCO International Commission on Education for the Twenty-first Century maintains that the concept of lifelong learning is the key that opens the door to the new millennium. This concept transcends the traditional distinction between initial and continuing education. It is related to another frequently propounded concept, that of the learning society, which sees opportunities for learning and fulfilling one’s potential in everything.
In its new incarnation, continuing education is seen as going far beyond what it has been, particularly in the developing countries, where it has basically consisted of skills upgrading, refreshers, retraining, and courses on career change and promotion for adults. In a broader interpretation, it could open up learning opportunities for all, and for many different purposes, giving people a second or third chance, responding to their desire for knowledge and beauty or their desire to surpass themselves, or broadening and deepening strictly vocational forms of training, including practical training.
Along the same line, PRELAC (the Regional Education Project for Latin America and the Caribbean) sees lifelong learning as reaching far beyond “training” – as offering multiple and varied educational opportunities that serve different purposes: providing access to and complementing studies at different educational levels (including the tertiary), paving the way for different possibilities and modes of entry and re-entry m, helping to build skills, providing work-related technical training, facilitating career change and promotion, and increasing links between education and the work world. Promoting lifelong learning also means facilitating a variety of lifetime learning trajectories and opportunities, and building bridges between them – helping individuals to create their own educational projects in pursuit of personal and professional enrichment.
22 world Conference on Education for All (1990), Jomtiem, Thailand, World Declaration on Education for All: Meeting Basic Learning Needs, UNESCO.

��
The Organisation of Economic Co-operation and Development (OECD) lays particular stress on the benefits of lifelong learning in the occupational sphere, claiming that it improves productivity and earning. In the twenty-first century, lifelong learning is being promoted by organizations with a socioeconomic focus. The changing nature of work as a result of globalization and rapid technological evolution makes it important to update and modify essential practical skills on an ongoing basis. There is evidence that educational achievements contribute to participation in the work force, and that there is a positive relationship between educational achievements and economic growth (OECD, 2004).
Sources: UNESCO (1996), Learning: the treasure within. Report to UNESCO by the International Commission on Education for the Twenty-first Century, UNESCO Publishing, Paris.
PRELAC (Regional Educational Project for Latin America and the Caribbean) (2002), Follow-Up Model, UNESCO, Santiago, Chile.
OECD (2004), Lifelong learning. Policy Brief, OECD, Paris
As text box 5 highlights, the concept of lifelong education is a broad one. Since indicators and detailed methodologies directly related to this concept are still lacking, the present publication concentrates on a few key topics, such as access to tertiary education, educational achievement in the 25+ population, and literacy in Latin America and the Caribbean.
�.�.1. Access to tertiary education
Guaranteeing lifelong learning opportunities depends on the existence of educational offerings that take account of different alternatives and recognise multiple paths of personal and professional development, as well different ways of exercising citizenship.23 Facilitating access to tertiary education is a key to giving people opportunities for autonomy throughout life, and to providing them with the capacity for lifelong education.
23 PRIE (2009b), op. cit.
Graph 3.3.1. number of students in tertiary education per 100 000 inhabitants. evolution year 2000-2008.
Source: Data base of the UNESCO Institute for Statistics (UIS). See data annex for values and explanatory notes.
0
1000
2000
3000
4000
5000
6000
7000
US AR UY CL PN EC BO PE CO BR PY MX JM SV LC HN GT BZ GY
Total enrolment per 100 000 inhabitants, 2000 Total enrolment per 100 000 inhabitants, 2008

��
As evidence on access to tertiary education, the following graph shows changes over the 2000-2008 period in the number of students in tertiary education per 100,000 inhabitants. The data include students enrolled in tertiary education abroad.
A comparison of enrolment rates in 2000 and in 2008 reveals a significant increase in access to tertiary education in most countries for which information is available. Uruguay’s progress is particularly noteworthy. It has increased the number of students in tertiary education by over 2000 per 100,000 inhabitants. Chile, Brazil and Paraguay increased their enrolments by between 1,400 and 1,600 students per 100,000 in this period.
The United States, Argentina and Uruguay show the highest numbers of students enrolled in tertiary education as of 2008.
�.�.2. Educational attainment in the population
Another aspect of lifelong learning has to do with the competencies and basic knowledge provided by basic education. There were important advances in the region in enrolment and completion at all educational levels, although universal completion of primary education is still nonexistent, and secondary education coverage remains low in many countries. This shortcoming points to the importance that basic education during childhood has for later life (in adolescence and adulthood).
An important indicator for monitoring this aspect of lifelong learning is the educational attainment of the population. Achieving a certain amount of years in school provides a level of education that ensures basic competencies and the earning opportunities associated with them.24
Graph 3.3.2 presents the highest level highest educational attainment in the population of 25 years and older, as a percentage of the total population of the countries.
24 V Summit of the Americas (2009), op. cit.
Graph 3.3.2. highest educational attainment. population 25 years and older.
Source: Data base of the UNESCO Institute for Statistics (UIS). See data annex for values and explanatory notes.
0
5
10
15
20
25
30
35
40
45
50
55
60
65
70
75
80
85
90
95
100
BS BB UY AR CR PN VE PE MX CO BR PY BO SV
No schooling or incomplete primary ISCED 1 level ISCED 2 level ISCED 3-4 level ISCED 5-6 level

�0
�.�.�. Literacy in Latin America and the Caribbean
Other important indicators of progress toward this goal are the literacy rates of the young population and the adult population, which reflect the achievements of primary education and literacy programmes. Analysis of these indicators paves the way for policies and organizational efforts to provide adult literacy programmes and quality primary education.
Text box 6. international and regional commitments to literacy
The world Declaration on Education for All issued in Jomtien in 1990 and ratified in Dakar in 2002 enriched the concept of lifelong learning by defining literacy as a basic channel for learning that allows people to develop knowledge and skills for full participation in society. The concept thus relates to notions of citizenship, cultural identity, socioeconomic development, human rights, parity, and the need to create, sustain and develop “contexts of literacy”.
The Fifth Summit of the Americas, which was held in Port of Spain in March of 2009, underscored the importance of literacy, as the following reflects: “Recognising that education is a lifelong process that promotes social inclusion and democratic citizenship and allows people to contribute fully to the development of society, we give high priority to improving and expanding literacy, basic knowledge of mathematics and science, and access to tertiary, vocational and adult education.”
Thus, this declaration, among other things, recognises the importance of adult literacy in ensuring access to lifelong learning.
World Conference on Education for All (1990), Jomtiem, Thailand, World Declaration on Education for All: Meeting Basic Learning Needs, UNESCO.
World Education Forum (2000), Dakar, Senegal, The Dakar Framework for Action, UNESCO, Paris.
Fifth Summit of the Americas (2009), Port of Spain, Trinidad and Tobago, Declaration of Commitment of Port of Spain, OAS.
In recent years, emphasis has also been put on the impact of illiteracy beyond its social costs. For example, a pilot study by ECLAC and UNESCO claims that the impact of illiteracy on the quality of the workforce, as well as on productivity and labour intake, is high enough that the fight against it may be considered an economic priority.25
Graph 3.3.3 shows major improvement in literacy in the young population. Especially remarkable is the variation in those countries whose adult populations are less literate.
when the ratio of the literacy rate in the relatively young population (15-24) to the literacy rate in the entire adult population (defined as 15+) is greater than 1, the young are more literate than the adults. The country average for the region is 1.06, showing the progress that has been made. The region shows a consistent increase, given the comparative literacy rates of young people and adult populations, the average difference between which is 6.1%.
Graph 3.3.4 shows gender parity indices for literacy rates in the young population and the adult population. As in the cases discussed above, values greater than 1 indicate that the female population is at an advantage, while values less than 1 indicate that the male population is at an advantage.
25 See: ECLAC/UNESCO (2010), Impacto social y económico del analfabetismo: modelo de análisis y estudio piloto, project document by Martínez, R. and Fernández, A., ECLAC, Santiago, Chile.

�1
As can be seen, gender parity in literacy is quite high in the region, especially among the young. The country average gender parity for literacy is 0.98 in the adult population and 1.01 in the young population.
Bolivia, Ecuador, El Salvador and Peru have inequities, with the male population at an advantage in the adult population, but all of countries mentioned show parity in the young population. Jamaica stands out for the persisting advantage enjoyed by its female population.
0
10
20
30
40
50
60
70
80
90
100
BO AR TT CL UY VE PY MX CR CO BR PE PN SV DO EC SR JM HN NI GT1.0
1.0
1.0
1.1
1.1
1.1
1.1
1.1
1.2
1.2
1.2
Adult population (15 years and older) Youth population (15 to 24 yrs old) Ratio (youth LR)/(adult LR)Country average. Adult (90.3%)Country average. Youth (96.4%)
Graph 3.3.3. Literacy rates. Comparison between youth and adult population. 2008.
Source: Data base of the UNESCO Institute for Statistics (UIS). See data annex for values and explanatory notes.
Source: Data base of the UNESCO Institute for Statistics (UIS). See data annex for values and explanatory notes.
Graph 3.3.4. Gender parity index of literacy rates. Comparison between youth and adult population. 2008.
0.0
0.2
0.4
0.6
0.8
1.0
1.2
JM NI HN BR DO CO CR SV UY VE AR CL EC MX PN PY TT BO PE SR GT
GPI youth pop. (15 - 24 years old) GPI adult pop. (15 years or more)
�2
It should be stressed that literacy rates based on people’s statements that they are unable to read or write are a good way to measure people’s perceptions of their own abilities, but do not provide information on what people actually know or are capable of when dealing with written material.26
Some countries’ literacy definitions and criteria differ from the international standards outlined above. Some countries do not distinguish between persons without any schooling and the “illiterate”, while others change their definitions from one census to another. Methods used to identify literate persons may also differ from one census to another.
Moreover, perceptual measurements such as literacy rates are one-dimensional. Thus, if a person answers “yes” to a question in a census or survey, it is assumed that this answer is valid for all three dimensions of the person’s literacy (reading, writing and the use of numbers), which is not necessarily the case. The relative development of the three dimensions can vary from one person to another. Yes/no questions do not measure reading, writing and numerical proficiencies as accurately as does a continuum.
Thus, it has been considered important to develop specific tests to measure proficiency in reading, writing and number use. The main aim here is to provide a picture (not available today) of the level at which people are able to carry out certain reading, writing and numerical tasks presented in written form.
In 2003, the UNESCO Institute for Statistics (UIS) launched a pilot initiative to measure reading and numerical proficiencies globally, the Literacy Assessment and Monitoring Programme (LAMP). The programme included a dimension not present in previous international efforts, which were concerned with reading skills (components of reading). LAMP will give decision makers and programme designers not only information on the profile of their populations and the distribution of skills therein, but also reliable information about background knowledge that can be used to design programmes that increase reading, writing and numerical proficiencies.
LAMP was tested in eight countries in various world regions between 2006 and 2010, including two Latin American countries, El Salvador and Paraguay. The countries where the pilot was conducted are ready to proceed with implementing the main LAMP survey, which is to be take place in October of 2010. In the Caribbean, Jamaica is now working on implementation.
The Salvadoran and Paraguayan experiences with LAMP are of crucial importance in inducing other Latin American countries to undertake similar initiatives. UIS has created a regional expert group that can provide technical assistance to countries that wish to implement LAMP.
26 See: UNESCO/UIS (2009a), La nueva generación de estadísticas sobre competencias en alfabetismo: Implementación del Programa de Evaluación y Monitoreo de la Alfabetización (LAMP), Technical Document No. 1., UNESCO/UIS, Montreal; as well as: UNESCO/UIS (2009b), Education Indicators. Technical Guidelines. UNESCO/UIS, Montreal.

��
4. EARLy ChILDhOOD CARE AND EDUCATION (ECCE)
The right to education, in the broadest sense, is the right to quality instruction starting at birth and continuing throughout life – instruction that gives individuals capacities for full development, learning and participation. There is a great deal of evidence of the enormous short- and long-term benefits of quality care and education for individual and societal development. Investing in early childhood care and education (ECCE) programmes is the natural starting point for human development policies and programmes.27
Evidence and studies on various aspects of child development over the past few years (cultural, psychological, economic, educational, neuroscientific and others)28 have established the importance of early development, care and education that begins before birth and includes comprehensive action covering all the dimensions of development, with quality education playing a crucial role.29
Comprehensive care in the first years of life lays the groundwork for later educational development and learning achievements, and contributes to reducing inequalities. Thus, ECCE from a very early age can have extremely important consequences, including decreased grade repetition, dropout, aggression and violence. It also improves socialization in general, fostering broad participation in national development in the broadest sense.
4.1. ThE CONCEPT Of ECCE
There is a wide range of activities for young children in the region that are not synonymous with early childhood care. These include programmes of early stimulation, early education, child education, preschool or pre-primary school, training for nursery school teachers, etc.30
Early stimulation programmes generally focus on the first two years of life, and thus do not cover the entire period from birth to the beginning of primary school. Objections have also been voiced to the term “early” on the grounds that it has connotations that limit the concept of the preschooler’s right to education, and because it can impede development of a comprehensive concept of early childhood education.
27 Van der Gaag, J. (2000), From Child Development to Human Development in From Early Child Development to Human Development, Young, M. E., ed., world Bank, washington, D.C.
28 See, for example, publications by neuroscientists such as Fraser Mustard, economists such as Amartya Sen and James Heckman, educators such as María Victoria Peralta and Maribel Córmack, pediatricians like Mary Eming Young of the world Bank, and psychologists such as Sara Victoria Alvarado of CINDE, Colombia.
29 Fujimoto, Gaby (2009), La educación inicial hoy: desarrollo integral de la primera infancia, presented at the author’s appearance before the legislature of the Autonomous City of Buenos Aires.
30 we follow the OAS (1998) document La atención integral de la primera infancia en América Latina: ejes centrales y los desafíos para el siglo XXI, written by M. Victoria Peralta E. and Gaby Fujimoto.

�4
Describing programmes as “early” stimulation or education implies that they precede the actually appropriate moment for such activity. This is clearly not in tune with the notion of lifelong education, in which people engage in a continuous learning process that spans all the stages of life.
Similarly, the concepts of preschool and pre-primary education, which are among the most frequently invoked, have limitations in that they identify the child and educational level as being ‘pre-something’ or as “preparation” for primary education. In fact, this stage of learning has an identity and value of its own, as the influence that it has on children’s development and wellbeing abundantly demonstrates.
“Initial education” and “nursery school” would be the most appropriate terms for the education provided to children through age six. They connote timely and appropriate educational processes put in motion in accord with the needs, interests and characteristics of the child, and designed to promote meaningful learning that will contribute to comprehensive development. Such processes are based on an understanding of the child as a person engaged in continuous human improvement.
“Nursery school” programmes are thus comprehensive efforts in relation to basic aspects of life (affection, feeding, health, protection, etc.), organised to encourage safe and appropriate growth and development.
The concept of comprehensive care is broader. It denotes the ensemble of coordinated actions designed to satisfy both the essentials for preserving life (food, hygiene, clothing, etc.) and the essentials for human development and learning as shaped by the child’s characteristics, needs, and interests (both ongoing and transitory). The protection of children’s rights is also an aspect of comprehensive care.
4.2. ECCE IN ThE INTERNATIONAL fRAMEwORK
ECCE has been mentioned regularly in the official statements of the Heads of State and ministers of education of the OAS member states from the perspective of children’s right to quality comprehensive care.31
In particular, the Fifth Meeting of Ministers of Education in Cartagena de Indias, Colombia (2007) approved a hemispheric commitment to early childhood education, as well as lines of action. Their conclusions led to defining a set of actions that included designing, implementing and disseminating a regional strategy for indicators of initial childhood education that would generate comparative quantitative and qualitative data on the progress of member states in efforts to strengthen the capacities of educational sectors and other actors responsible for ECCE. The strategy is to be based on and developed through collaboration with existing regional or international efforts.
The Hemispheric Commitment to Early Childhood is based on General Comment No. 7. Implementing Child Rights in Early Childhood, a 2006 document of the Committee on the Rights of the Child (CRC). It recognises young children as entitled to all the rights enshrined in the Convention, and early childhood as an essential period for the realization of these rights. It argues that education starts before the child is born and should last throughout life.
The Fifth Summit of the Americas, held in 2009 in Port of Spain, Trinidad and Tobago, reaffirms the earlier commitments to educational care in early childhood. It established:
31 Important landmarks in this connection include the declarations of the world Conference on Education for All in Jomtien, Thailand (1990), the Resolution on the Promotion and Protection of At-Risk Children and Young People, approved by the OAS member states (1991), the regular sessions of the OAS Inter-American Council for Education, Science and Culture (1991-1995), the Miami Summit (1994), the Chile Summit (1998), the world Forum for Education for All (Dakar 2000), the Québec Summit (2001), the ministerial meetings held in the framework of CIDI (2001), the Second Meeting of Ministers of Education of CIDI in Punta del Este, Uruguay, (2001), and the Fourth Ministerial Meeting in Scarborough, Trinidad and Tobago (2005).

��
“[that] equal access to education is a human right and that quality education is essential, a public good and a priority. Therefore, we will continue promoting access to quality education for all. we also recognise that improving access to and the quality of early childhood education is a key factor in achieving universal primary education by 2015. Recognising that investing in quality care and education from birth through the early years of primary education improves learning, social, health and employment outcomes, we take note of the Hemispheric Commitment to Early Childhood Education adopted by the Ministers of Education in 2007. we call upon the Ministers of Education to increase efforts to measure educational progress in the Americas by the year 2010, both within our individual countries and through multilateral initiatives such as the Regional Educational Indicators Project (PRIE).”32
4.�. INfORMATION sysTEMs AND ECCE
The capacity of information systems to generate relevant data for the formulation and implementation of ECCE policies is still very low.
One of the challenges today is to create systems for monitoring and evaluating comprehensive care policies and programmes, particularly for children under three. Such systems can be a source of useful data for evaluating policy impact and programme improvement, and for monitoring transition processes.
Information and statistical systems that produce general statistics rather than disaggregated data have significant shortcomings. In many cases, data are based entirely on statistics from government and other sectors. This is an obstacle to decision-making and policy follow-up and monitoring. In addition, qualitatively speaking, the data are insufficient to throw light on how processes unfold or to reveal specificities and diversities within different population groups.
Thus, establishing a context for the production of these statistics requires first making the nature of the relevant programmes explicit, and then developing data collection strategies that can track the progress of the Summit member states.
Moreover, there is a need for integrated actions and information systems that take account of both the formal educational system and non-conventional and informal modes of education, since childcare during the first few years of life takes place mainly within families or communities.
Because of these limitations, international statistics provide information primarily on the formal education offered in schools for children over age three, which most countries consider “pre-primary” education or “preschool”.
4.4 ThE sTATE Of PRE-PRIMARy EDUCATION
Pre-primary enrolment in the region has gradually increased over the last few years. However, the numbers reflect a need for greater efforts. Average net enrolment in countries for which information was available was 46.8% in 2000 and 58.2% in 2008, representing an increase of around 12%. At least nine countries have rates lower than 40% and only five have rates above 80%.
One of the goals of ECCE is to give all children access to these programmes and the opportunity to continue moving toward higher educational levels. In this connection, one indicator that tracks the transition from ECCE programmes to primary school is the percentage of children who attend an educational programme at the age immediately preceding the age that a country’s legislation establishes for entering primary school. Information for this indicator is obtained from on-site household surveys, and is collected by ECLAC. The advantage of the indicator is that it gives us a view of parity in the education offered in countries for which data are available.
32 Fifth Summit of the Americas (2009), op. cit.

��
Graph 4.2. School attendance, children one year younger than the official entrance age for primary, by gender. 2008.
Source: Data base of the UNESCO Institute for Statistics (UIS). See data annex for values and explanatory notes.
There are marked differences in the region, as some countries have attendance rates over 90% (e.g., Guatemala, Uruguay, Mexico, Brazil, Venezuela and Argentina), while, at the other end of the spectrum, Honduras has rates of less than 50%.
Analysing the indicators in relation to family income reveals inequalities not only between countries but within each, as Graph 4.3 below shows.
Graph 4.1. evolution of the net enrolment rates in pre-primary education. 2000- 2008.
Source: Data base of the UNESCO Institute for Statistics (UIS). See data annex for values and explanatory notes.
0
10
20
30
40
50
60
70
80
90
100
MX GD JM EC SR UY G Y AR AG TT DM PE CA PN US NI VE C L LC SV BR CO BO BZ P Y DO G T HN BS
2000 2008Country average 2000 (46.8%) Country average 2008 (58.2%)
0
10
20
30
40
50
60
70
80
90
100
�� �� �� �� �� �� �� �� �� �� �� �� �� �� �� �� ��
Total Male Female

��
Graph 4.3. School attendance, children one year younger than the official entrance age for primary, by income quintile. 2008.
Source: Data base of the UNESCO Institute for Statistics (UIS). See data annex for values and explanatory notes.
There are significant gaps between the highest and the lowest quintiles in all of the countries for which data is available. The gaps are especially evident in Paraguay, Honduras, and El Salvador. On the other hand, Guatemala and Uruguay not only have very high rates of attendance, but also a high level of parity between the two economic extremes.
These findings highlight the importance of ECCE programmes for effectively reducing the gap – which tends to increase at higher educational levels, especially in secondary school, as is clear from the secondary completion rates presented in this report.
0
10
20
30
40
50
60
70
80
90
100
GT BR UY VE SV MX EC PN CR AR CO CL DO PY HN PE BO
Highest quintile Lowest quintile
Graph 4.4. School attendance, children one year younger than the official entrance age for primary, by geographic area. 2008.
Source: Data base of the UNESCO Institute for Statistics (UIS). See data annex for values and explanatory notes.
0
10
20
30
40
50
60
70
80
90
100
GT UY MX BR EC CL PN CO SV CR DO PE PY BO HN
Urban Rural

��
Another problem with access that this indicator points to is the disadvantaged situation of rural populations, although, as Graph 4.4 shows, this phenomenon is less extreme.
The greatest rural-urban disparities in attendance before the primary school level are in Paraguay, Chile, Peru, El Salvador and Colombia. Guatemala again has a high degree of parity between the two populations.
The region still lacks qualified teachers. Standards have been developed to define qualifications for teaching at this level, but as Graph 4.5 shows, there are few countries where all teachers working at this level are certified.
Graph 4.5. Trained teachers in pre-primary education. 2008.
Source: Data base of the UNESCO Institute for Statistics (UIS). See data annex for values and explanatory notes.
Colombia and Suriname are outstanding cases. Here, all teachers working in pre-primary education are certified.
4.�. ECCE PROgRAMMEs AND POLICIEs
In 2007, the OAS organized a symposium to discuss the state of the art in ECCE, focusing on children under three.33 Data were gathered from participating countries regarding policies and programmes for children in this age group, and findings were presented by hemispheric subregion, describing ECCE policies, curricula and programmes, evaluation activity, monitoring of policy and research, training, financing, intersectoral coordination and the transition to primary education.
Research has shown that most of the member states have policies centring on children between the ages of four and six. Regulations, policies and resources for the under-three population are very limited. The responsibility that governments have assumed vis-à-vis this age group to date remains far from sufficient.
The member states consider expanding coverage a priority, with a focus on parity and social inclusion. However, little attention has been paid to the cultural specificities of the family and the child, and there is scant interest in designing specific programmes to include children with special educational needs.
33 SEDI/DEC/OAS(2007), Understanding the State of the Art in Early Childhood Education and Care: the first three years of life, OAS, washington D.C.
0
10
20
30
40
50
60
70
80
90
100
CO SR SV VE BO DO DM CR EC JM HN VC LC GY BB GD KN PN NI AG TT AI BZ
Trained teachers, pre-primary level

��
Most of the countries treat these programmes as a sectoral matter, rather than through intersectoral programmes that address children’s needs comprehensively. The frameworks of programmes and services for the under-three emphasize care over education.
All of the countries have declared an intention to improve the quality of health services, care, education and parity for children under the age of three. However, resources, orientations and criteria do not take these populations into account, or address the personal, socioeconomic, ethnic and cultural specificities of the families involved. In most Caribbean nations, for example, policies relating to young children focus on the health sector.


�1
�. OThER fACTORs RELATED TO PROgREss IN EDUCATION
There is irrefutable evidence that public investment has a marked effect on the quality of educational services. The absence of the most basic school resources, such as physical facilities and text books, has a strong impact on student performance.34 Two other factors that affect the quality of education at the primary and secondary level are the student/teacher ratio and teachers’ cognitive skills.
�.1. INVEsTINg IN EDUCATION
Graph 5.1 shows average per-student spending on primary education as a percentage of per capita national income, or GDP. By looking at public spending per student in relation to GDP, this indicator allows us to make comparisons among countries with significant differences, and to analyse what each spends on its students in relation to its available resources. For example, a less wealthy country may allocate a much greater percentage of its resources to education, thus making a greater effort in this area than a wealthier one.
34 Hanushek, E. and wobmann, L. (2007), The Role of Education Quality in Economic Growth, Research Policy working Paper 4122, world Bank. Also published as: Calidad de la Educación y crecimiento económico, Documento No. 39, PREAL.
Graph 5.1. public expenditure per pupil on primary education as percentage of Gdp per capita. 2008.
Source: Data base of the UNESCO Institute for Statistics (UIS). See data annex for values and explanatory notes.
0
4
8
12
16
20
24
28
32
36
40
BB VC US DM JM BR GY BZ BO MX AR CO CL GT NI VE SV UY PN DO PE
Primary education Country average. Primary (13.9%)

�2
In the Summit of the Americas member states, per-student spending on primary education as a percentage of per capita GDP varies greatly. In 2008, the figures ranged from 7% in Peru to 27.7% in Barbados, with a country average of 13.8%. Four countries have per capita primary education spending in excess of 20% of per capita GDP, namely, Barbados, Saint Vincent and the Grenadines, the United States and the Dominican Republic.
As Graph 5.2 reflects, per student spending on secondary education as a percentage of per capita GDP ranges from 4.5% in Nicaragua to 26.4% in Saint Vincent and the Grenadines, with a country average of 15%. Five of the 21 countries for which data are available spend over 20% of per capita GDP for this purpose: Saint Vincent and the Grenadines, Barbados, the United States, Belize, Jamaica and Argentina.
Graph 5.2. public expenditure per pupil on secondary education as percentage of Gdp per capita. 2008.
Source: Data base of the UNESCO Institute for Statistics (UIS). See data annex for values and explanatory notes.
�.2. EDUCATION AND ThE ECONOMIC CRIsIs
The recent financial and economic crisis has affected the region. The Preliminary Overview of the Economies of Latin America and the Caribbean, 2009, published by the Economic Commission for Latin America and the Caribbean (ECLAC), estimates that after six years of growth in the region, there was a 1.8% decline in GDP and a 2.9% reduction in per capita GDP in 2009. Graph 5.4 juxtaposes 2000 GDPs with estimates for 2009.
One effect of this interruption in economic growth was a drop in labour demand. The study estimates an 8.3% rise in the regional unemployment rate, as well as deteriorating job quality.35
Although the region’s economic recovery began in the second half of 2009, the economic crisis continues to have an impact through lack of foreign investment, a drop in demand for exports, heavy reductions in raw materials prices and significant deterioration in the associated terms of trade, a reduction in remittances and a decline in tourism. Although not all of the region’s economies are equally exposed to the effects of the crisis, the slowdown in regional development will have a negative social impact on all of the countries.
35 ECLAC (2009), Preliminary Overview of the Economies of Latin America and the Carribean,Preliminary Overview of the Economies of Latin America and the Carribean,, 2009, ECLAC, Santiago, Chile.
0
4
8
12
16
20
24
28
32
36
40
BB US BZ AR JM DM GY CO BO MX CL BR UY PN SV PE VE DO GT NI
Secondary education Country average. Secondary (14.0%)

��
In particular, the rise in unemployment and a shift toward informal employment will be a negative factor for many households.
The financial crisis could thus have important repercussions in education. Though the countries’ policies and announcements are encouraging in that they reflect no intention of reducing public spending on education, shrinking GDPs and economic slowdown will inevitably bring pressure to cut spending and public and private investment in education in all the countries. On the international cooperation front, resources for education in developing countries may also be cut. All of this could have a variety of consequences, affecting school construction and repair, equipment and materials supplies, teachers’ salaries, and the number of scholarships given to outstanding or poorer students. It also may lead companies to withdraw their support for educational development projects and the like.36
�.�. sTUDENT/TEAChER RATIOs
The student/teacher ratio – the number of students per teacher – reflects the availability of teaching services and teachers’ work loads.
Among the Summit of the Americas countries for which data is available, Barbados has the lowest student/teacher ratio at the primary level (13.5) and Honduras the highest (33.3). The country average for the region is 21.9. Only two countries show ratios over 30.
Graph 5.5 shows the secondary school student/teacher ratio in the countries for which data were available, which ranges from 10.2 (Venezuela) to 28.6 (Nicaragua). On average, the countries have student/teacher ratios of 17.6.
36 UNESCO (2009), Modelo de Sistema de Alerta Temprana en Educación, Informe final.
Graph 5.3. Annual variation in the Gdp per capita in Latin America and Caribbean countries. 2000-2009.
Source: Economic Commission for Latin America and the Caribbean (ECLAC), Statistical yearbook for Latin America and the Caribbean, 2009. See data annex for values and explanatory notes.
- 10,0
- 5,0
0,0
5,0
10,0
15,0
BO DO PN HT UY GY PE AR BR CO EC BZ TT DM GT CR NI CL VE SV VC HN JM PY BB LC BS MX GD KN AG
2000 2009

�4
�.4. TEAChER TRAININg REqUIREMENTs
There is consensus among the region’s countries regarding the importance of teachers’ qualifications in the context of the education reforms that several of them have introduced. As a result, governments have made and continue to make significant investments in both initial and in-service training for teachers.
Graph 5.6 shows the proportion of teachers who meet national training requirements for primary education. As of 2008, the percentages ranged from 36.4% to 100% in the countries for which information was available. In three countries, over 90% of teachers were certified (Colombia, El Salvador and Panama), while fewer than 50% were certified in two (Belize and Honduras).
0
5
10
15
20
25
30
35
40
45
NI SV CO DO CL EC GY JM VC BR BO PE MX BZ GT GD LC CR PN BB US DM SR UY TT AR BS KN VE
Secondary education Country average. Secondary (17.6)
Graph 5.5. pupil/teacher ratio in secondary education. 2008.
Source: Data base of the UNESCO Institute for Statistics (UIS). See data annex for values and explanatory notes.
0
5
10
15
20
25
30
35
40
45
HN SV GT CO NI MX JM GY CL PN BO BR BZ GD PE AG LC DO CR EC TT VC DM AR VE KN SR UY BS US BB
Primary education Country average. Primary (21.7)
Graph 5.4. pupil/teacher ratio in primary education. 2008.
Source: Data base of the UNESCO Institute for Statistics (UIS). See data annex for values and explanatory notes.

��
Graph 5.6. percentage of trained teachers in primary education. 2008.
Source: Data base of the UNESCO Institute for Statistics (UIS). See data annex for values and explanatory notes.
Graph 5.7 shows the percentage of teachers that meet national training requirements for secondary school. It ranges from 29.3% to 96.8%, with a country average of 64.8% for 2008.
Five countries stand out with over 85% of secondary teachers meeting training requirements (Colombia, Panama, El Salvador, Bahamas and the Dominican Republic) while, in another four, fewer than 50% meet requirements (Saint Kitts and Nevis, Belize and Granada).
Graph 5.7. percentage of trained teachers in secondary education. 2008.
Source: Data base of the UNESCO Institute for Statistics (UIS). See data annex for values and explanatory notes.
The two graphs above show that, overall, a lower percentage of secondary school teachers meet training requirements.
0
10
20
30
40
50
60
70
80
90
100
CO SV PN DO LC TT CR BS VE VC EC GD NI AG KN BB DM GY BZ HN
Primary education Country average. Primary (74.6%)
0
10
20
30
40
50
60
70
80
90
100
CO PN SV BS DO CR VE EC NI BB LC VC GY KN BZ DM GD
Secondary education Country average. Secondary (64.4%)


��
�. CONCLUsIONs
The Educational Panorama 2010 provides a description of the state of education in the countries participating in the Summits of the Americas in relation to the goals that the countries have adopted for 2010. The study used a basic set of internationally comparable indicators that had been discussed previously by the participants in the project. The evidence produced makes it is possible to identify salient aspects of progress toward the three goals, considering the contexts in which the educational systems exist, their success in keeping students in school, completion rates for primary and secondary school, and levels of educational achievement, as well as equality in pre-primary, primary and secondary education.
ThE REgION’s DEMOgRAPhIC, ECONOMIC AND sOCIAL CONTEXT
In general terms, it can be said that the poorest countries have the youngest populations. Thus, the countries facing the greatest challenges in terms of access to and completion of primary and secondary school for large portions of their populations are still the ones with the lowest levels of human development and per capita GDP.
Nevertheless, countries with low levels of resources and challenging conditions advance with notable celerity in some cases, and improve their position for confronting the educational challenges of the three Summit of the Americas goals. Poor countries often have higher proportions of students entering primary school at an age other than the officially sanctioned one, lower enrolment rates in pre-primary, primary, secondary and tertiary education, and lower rates of completion in primary and secondary education. However, some of these countries have made significant progress toward various of the Summit goals. Granada, Nicaragua and Guatemala are cases in point. Despite unfavourable circumstances, they have made major advances in net enrolment rates in primary education, achieving levels above 90%. In this connection, it would be fruitful to ask what circumstances, and what administrative and educational changes, are behind the positive trends in these countries.
ACCEss TO AND COMPLETION Of ThE DIffERENT EDUCATIONAL LEVELs
Early childhood care and education do not play a role in the Summit of the Americas goals. However, there is an ever-increasing awareness of the importance of this educational level, most recently manifested in the Hemispheric Commitment to Early Childhood Education approved at the Fifth Meeting of Ministers of Education convened by the OAS and held in Cartagena de Indias, Colombia in 2007. The consensus was reaffirmed in the Fifth Summit of the Americas in Port of Spain, Trinidad and Tobago in 2009.
As UNESCO has stated, education is a lifelong undertaking that must begin at birth. Thus, the concept of early childhood care and education must extend beyond education as it has been understood, and be seen in

��
relation to health and social assistance, among other issues. The issue of early childhood care and education is especially important because of its influence on success in primary school.
Though the country average net enrolment rate in pre-primary education increased by 11.4% between 2000 and 2008, it was still only 58.2% by the end of that period.
A large proportion of children of primary school age enrol in first grade at some point. Indeed, 14 out of 27 countries have primary school enrolment rates of 95% or more. Nevertheless, it is noteworthy that between 2000 and 2008 the country average increased by only 0.4%, leaving the situation virtually unchanged for eight years.
The net intake rate for entering first grade at what is theoretically the appropriate age according to national standards is still a matter of great concern, since these rates are still very low in the majority of the region’s countries.
Another persisting problem is repetition of primary school grades. This is a major issue, since grade repetition is associated with dropping out of school. Repetition and dropout are complex problems related not only to the economic conditions of children and their families, but to the quality of the education provided. Solutions to these problems must therefore take all of their dimensions into account, not simply reflect a desire for the efficiency that comes with moving students from grade to grade regularly. More forceful and holistic public policies are still very necessary to address this issue.
These problems aside, a significant number of countries are close to the objective of universal completion of primary school and to meeting the first of the Summit goals. In seven out of 23 countries the proportion of 15- to 19-year-olds who have completed primary education is above 95%, while another nine countries have rates above 90%. Nevertheless, the problem of primary school completion remains a weighty one in the region, as some countries still have completion rates below 80% in the youngest age groups whose members should have already graduated from this educational level.
During the time period analysed here, some countries made progress in completion of primary education between generations. Guatemala, Bolivia and Honduras are examples. Despite the difficulties that they face, these countries have made successful efforts to increase completion of primary school in their youngest population.
The majority of the Summit of the Americas countries made very significant progress in access to secondary education in the period analysed. Eleven countries in the region have reached the goal of 75% access to secondary education in the youngest group examined, and six countries still have enrolment rates of less than 60%. Meanwhile, the country average increased nearly 10%.
As in primary education, the countries with low rates are those facing more social demands as a result of demographic growth and dependency rates, as well as high proportions of rural populations and relatively low levels of human and economic development. However, Guatemala, which has the lowest secondary access rates, here again leads the region in progress made over the time period under examination.
Only three countries (Bahamas, Barbados and Chile) reached the target of 75% completion of primary education in the youngest age group, while five countries remain under 30%. Nevertheless, all the countries made progress in secondary completion rates, even if some did not advance satisfactorily.
The third goal of the Summit of the Americas raises the issue of extending opportunities for lifelong education. This requires placing priority on equal opportunity for learning. Therefore, our analysis of access and completion rates already to some extent provides a look at the state of educational opportunity in the countries.
Illiteracy (though still difficult to measure in more detail and in a way that goes beyond yes/no dimensions) is an obstacle to lifelong learning for many adults. Nevertheless, it is noteworthy that in all the countries studied,

��
the proportion of illiterates is smaller in the younger population. The expansion of primary and secondary education in recent decades has brought illiteracy rates down.
Comparing enrolment rates between 2000 and 2008 reveals a significant increase in access to tertiary education in the majority of the countries. Countries such as Brazil, Chile, Paraguay and Uruguay, in particular, increased the numbers of people studying at this educational level significantly during the period of time in question.
EqUAL ACCEss AND COMPLETION Of sChOOL
It is also important to know whether progress toward making the right to education a reality has been equitable across social groups.
Most of the region’s countries have reached gender parity with regard to access and completion of pre-primary and primary schooling, and with regard to literacy rates, especially in the younger population. Nevertheless, it must be stressed that secondary school completion rates show an increasing tendency to favour girls over boys.
All of the region’s countries have improved their primary education as regards parity in terms of areas of residence, income levels and ethnicity. Nevertheless, inequalities between certain social groups continue to pose a challenge for the region. Chile is the only country where the youngest age group enjoys rural/urban, ethnic/non-ethnic and low-income/high income equity in primary education. However, no country has reached parity as regards completion of secondary education. Here, there are still major discrepancies in all age groups between these population groups.
In pre-primary education, too, there are important differences between populations at different socioeconomic levels and in different geographic areas (rural versus urban).
Many of the region’s countries have high levels of economic inequality. Thus, it is no surprise that there are major disparities in the completion of primary and secondary education in the Americas as a function of income differentials. Balance between socioeconomic groups in the younger age range is better than in older age range, but the gaps remain high.
sChOLAsTIC AChIEVEMENT
Besides measuring countries’ general progress in access to and completion of different educational levels, it is important to analyse the scholastic achievements that educational systems produce in their students.
Achievement levels in primary education in the counties examined are still very low. The SERCE study shows that 38% of third-graders in the region are still unable to recognise the purpose of a recipe or the topic of a poster. Furthermore, a country average of 23.4% of sixth-graders have not reached a level where they can identify the addressee of a letter.
Findings in mathematics are no more encouraging. Taking the country average, we see 51.8% of third-graders unable to solve simple problems based on a single addition, subtraction or multiplication operation, and 26% of sixth-graders incapable of using the four basic operations strategically based on explicit information.
As a country average, 48.2% of sixth-graders do not meet minimum standards in science – for example, by correctly classifying animals or plants, or demonstrating an understanding of the solar system.
The findings are no better for students of secondary school age. The PISA study shows that in reading comprehension, a country average of 48.9% of the region’s 15-year-old students are incapable of identifying the main idea in a text or of understanding relationships within it. Nor do they have the ability to make

�0
comparisons or connections between a text and outside knowledge, or to draw on personal experience and attitudes in this context.
Country averages in mathematical skills show 61% of students unable to interpret and recognise situations in contexts that require no more than direct inference, to extract relevant information from a single source, to make use of a single mode of representation, or to use algorithms, formulas, or basic mathematical procedures or conventions.
In science, 51.7% of students are unable to provide possible explanations in familiar contexts, to draw conclusions based on simple investigations, to employ direct reasoning, to make literal interpretations of findings from a scientific inquiry, or to engage in technological problem solving.
OThER IMPORTANT IssUEs: EDUCATIONAL fUNDINg AND TEAChERs
The country average of per student spending at the primary education level as a percentage of per capita GDP in the Summit of the Americas countries in 2008 was 13.8%, but national rates vary enormously. Three countries, Barbados, Saint Vincent and the Grenadines and the Dominican Republic, made major efforts despite fiscal constraints, spending over 20%.
As regards spending on secondary education, the country average of per student spending as a percentage of per capita GDP was 15%. Spending exceeded 20% in four of the 21 Latin American and Caribbean countries for which data was available: Saint Vincent and the Grenadines, Barbados, Belize and Argentina.
Though high levels of spending on education are not always directly associated with improved quality, these indicators do show the effort that the region’s countries are making to provide quality education. One must hope that the current financial and economic crisis will not negatively affect future investment in the countries’ educational systems.
Country student/teacher ratios, which reflect the availability of teaching services as well as teachers’ workloads, averaged 21.9 in primary education in 2008. The ratio at the secondary level was 17.6.
In the same year, a country average of 74.9% of teachers in the region had completed the national training required to teach at the primary level, while the rate for the secondary level was 64.8%.
Qualified pre-primary teachers are still lacking.
AVAILAbILITy Of sTATIsTICAL INfORMATION fOR MONITORINg REgIONAL AND INTERNATIONAL AgREEMENTs
There have been major advances in the availability of information relating to educational objectives in the region. However, major challenges remain for generating detailed information in fundamental areas such as teachers, educational spending and scholastic achievement, among others.
Providing information compatible with international standards to ensure regional comparability is still a priority for joint efforts in the framework of existing initiatives in the region. The support provided by PRIE in developing and consolidating international educational statistics is very significant in this connection.
It is of the greatest importance that the countries take action to ensure that their information systems and educational statistics be increasingly compatible with internationally, regionally and nationally defined needs.

�1
REfERENCEs
Asociación Civil educación para Todos (2009). Uso de la información educativa aplicada a las decisiones y gestión de los sistemas educativos, prepared for the Seventh Regional workshop on Educational Statistics of the Regional Education Indicators Project (PRIE), Mexico, December 2009.
Committee on the rights of the Child (CrC) (2006), General Comment No. 7. Implementing Child Rights in Early Childhood. Geneva.
eCLAC. 1997. Social Panorama of Latin America, 1997. Santiago, Chile, ECLAC.
eCLAC. 2000. Social Panorama of Latin America 1999-2000. Santiago, Chile, ECLAC.
eCLAC, 2007. La inversión educativa en América Latina y el Caribe. Las demandas de financiamiento y asignación de recursos. Santiago, Chile, ECLAC.
eCLAC. 2009. Preliminary Overview of the Economies of Latin America and the Caribbean, 2009. Santiago, Chile, ECLAC.
eCLAC. 2010. Statistical yearbook for Latin America and the Caribbean, 2009. Santiago, Chile, ECLAC.
eCLAC/UneSCo. 2010. Impacto social y económico del analfabetismo: modelo de análisis y estudio piloto, project document by Martínez, R. and Fernández, A. Santiago, Chile, ECLAC.
fujimoto, Gaby. 2009. La educación inicial hoy: desarrollo integral de la primera infancia, presented at the author’s appearance before the legislature of the Autonomous City of Buenos Aires.
hanushek, e. and Wobmann, L. 2007. The Role of Education Quality in Economic Growth, Research Policy working Paper 4122, world Bank. Also published as: Calidad de la Educación y crecimiento económico, PREAL Document No. 39.
inee. 2004. La Calidad de la Educación Básica en México, Resultados de la Evaluación Educativa. Mexico City.
fifth Meeting of Ministers of education. 2007. Hemispheric Commitment to Early Childhood Education, Cartagena de Indias, Colombia.
oeCd. 2004. Lifelong learning. Policy Brief. Paris, OECD.
oeCd. 2009. Iberoamérica en PISA 2006, Informe Regional. Santillán, Spain.
peralta e., M. Victoria and fujimoto Gómez, Gaby. 1998. La atención integral de la primera infancia en América Latina: ejes centrales y los desafíos para el siglo XXI. washington, OAS.
piSA. 2006. Assessing scientific, reading and mathematical literacy: A framework for PISA 2006. OECD.

�2
preLAC. 2002. Follow-Up Model. Santiago, Chile, UNESCO.
prie. 2009a. Agenda of the Seventh Regional Workshop on Educational Statistics, Cancún, Mexico.
prie. 2009b. Methodology for building and use. OAS, SEP (Mexico) and UNESCO.
Sedi/deC/oAS. 2007. Understanding the State of Art in Early Childhood Education and Care: The First Three Years of Life. washington, OAS.
Shavelson, richard J. et al. (1991. ERIC Clearinghouse on Tests Measurement and Evaluation Washington DC. What Are Educational Indicators and Indicator Systems?, ERIC/TM Digest.
Second Summit of the Americas. 1998. Action Plan. Santiago, Chile, OAS.
fifth Summit of the Americas. 2009, Port of Spain, Trinidad and Tobago. Declaration of Commitment of Port of Spain. OAS.
UiS. 2009a. Education Indicators. Technical Guidelines. Montreal, UIS.
UiS. 2009-b. La nueva generación de estadísticas sobre competencias en alfabetismo: Implementación del Programa de Evaluación y Monitoreo de la Alfabetización (LAMP). Technical Document No. 1. Montreal, UIS.
Un, Millennium Goals. www.un.or/millennium/declaration/ares552e.htm
UneSCo. 1996. Learning: the treasure within. Report to UNESCO by the International Commission on Education for the Twenty-first Century. Paris, UNESCO.
UneSCo. 2008. EFA Global Monitoring Report, 2009, Overcoming inequality: why governance matters. Paris, UNESCO.
UneSCo. 2010. EFA Global Monitoring Report, 2010, Reaching the marginalized. Paris, UNESCO.
UneSCo-oreALC. 2009. Modelo de Sistema de Alerta Temprana en Educación, Informe final.
UneSCo-oreALC. 2007a. Quality Education for All: A Human Rights Issue. Discussion document on educational policy in the context of the Second Intergovernmental Meeting of the Regional Education Project for Latin America and the Caribbean (EPT/OREALC), February 2008. UNESCO-OREALC.
UneSCo-oreALC. 2007b. The State of Education in Latin America and the Caribbean: Guaranteeing Quality Education for All. A regional report reviewing and assessing progress toward education for all within the framework of the Regional Education Project (EFA/PRELAC). Santiago, Chile, UNESCO-OREALC.
UneSCo-oreALC/LLeCe. 2008. Los Aprendizajes de los Estudiantes de América Latina y El Caribe. Primer reporte de los resultados del Segundo Estudio Regional Comparativo y Explicativo (SERCE). Santiago, Chile.
Van der Gaag, J. 2000. From Child Development to Human Development. From Early Child Development to Human Development. Young, M. E., ed. washington, world Bank.
World Conference on education for All. 1990. Jomtiem, Thailand, World Declaration on Education for All: Meeting Basic Learning Needs. Paris, UNESCO. Available online at http://www.unesco.org/educación/efa/index.shtml
World education forum. 2000, Dakar, Senegal. The Dakar Framework for Action. Paris, UNESCO.

83
APPENDICES
A. COUNTRYPROFILES

84
INDICATOR(Number of cases)- Regional +
Average- Regional +
Average
HDI (34)
DEMOG GROWTH (2002-2015) (34)
% URBANIZATION (34)
DEMOGRAPHIC DEPENDENCY (34)
POTENTIAL DEMAND (PRIMARY - 5 a 14 years) (34)
POTENTIAL DEMAND (SECONDARY - 15 a 19 years) (34)
GDP PER CAPITA (USD PPP) (34)
GINI COEFICIENT (18)
PREPRIMARY NET ENROLLMENT RATE (26)
GPI PREPRIMARY NET ENROLLMENT RATE (26)
PRIMARY NET INTAKE RATE (25)
GPI PRIMARY NET INTAKE RATE (28)
PRIMARY NET ENROLLMENT RATE (29)
GPI PRIMARY NET ENROLLMENT RATE (29)
SURVIVAL RATE TO LAST GRADE (PRIMARY) (24)
% 1st GRADE REPEATERS (PRIMARY) (27)
SECONDARY NET ENROLLMENT RATE (26)
GPI SECONDARY NET ENROLLMENT RATE (26)
PUBLIC EXPENDIT EDUCATION AS % GDP (24)
PUBLIC EXPEND EDUCATION AS % TOTAL PUBLIC EXPEND (21)
PUPIL/TEACHER (PRIMARY) (31)
PUPIL/TEACHER (SECONDARY) (29)
% TRAINED TEACHERS (PRIMARY) (21)
% TRAINED TEACHERS (SECONDARY) (17)
COMPLETION PRIMARY (15 - 19 years) (23)
GPI COMPLETION PRIMARY (15 - 19 years) (23)
U/R PI COMPLETION PRIMARY (15 - 19 years) (17)
QSUP/QINF PI COMPLETION PRIMARY (15 - 19 years) (18)
NORG/ORG PI COMPLETION PRIMARY (15 - 19 years) (8)
COMPLETION SECONDARY (20 - 24 years) (23)
GPI COMPLETION SECONDARY (20 - 24 years) (23)
U/R PI COMPLETION SECONDARY (20 - 24 years) (16)
U/R PI COMPLETION SECONDARY (20 - 24 years) (18)
NORG/ORG PI COMPLETION SECONDARY (20 - 24 years) (8)
ADULT LITERACY (22)
GPI ADULT LITERACY (22)
YOUTH LITERACY (21)
GPI YOUTH LITERACY (21)
BASICINFORMATION
Territory (in thousands km2) 0.44
Population (in thousands) 87
Urbanization (%) 30.3
Population aged 5 to 14 years (%) 18.8
Population aged 15 to 19 years (%) 8.2
GDP per capita (in US dollars PPP) 16 210
Years of compulsory education 12
Adult literacy rate (Pop 15 years and over) …
Youth literacy rate (Pop 15 to 24 years) …
Net enrolment rate in primary education 74.0
Net enrolment rate in secondary education …
Human Development Index (HDI) 0.830
(AG)ANTIGUAANDBARBUDA
(AR)ARGENTINA
BASICINFORMATION
Territory (in thousands km2) 2 767
Population (in thousands) 39 883
Urbanization (%) 93.2
Population aged 5 to 14 years (%) 17.3
Population aged 15 to 19 years (%) 8.6
GDP per capita (in US dollars PPP) 12 990
Years of compulsory education 10
Adult literacy rate (Pop 15 years and over) 97.7
Youth literacy rate (Pop 15 to 24 years) 99.1
Net enrolment rate in primary education 99.1
Net enrolment rate in secondary education 79.4
Human Development Index (HDI) 0.860

85
INDICATOR(Number of cases)- Regional +
Average- Regional +
Average
HDI (34)
DEMOG GROWTH (2002-2015) (34)
% URBANIZATION (34)
DEMOGRAPHIC DEPENDENCY (34)
POTENTIAL DEMAND (PRIMARY - 5 a 14 años) (34)
POTENTIAL DEMAND (SECONDARY - 15 a 19 YEARS) (34)
GDP PER CAPITA (USD PPP) (34)
GINI COEFICIENT (18)
PREPRIMARY NET ENROLLMENT RATE (26)
GPI PREPRIMARY NET ENROLLMENT RATE (26)
PRIMARY NET INTAKE RATE (25)
GPI PRIMARY NET INTAKE RATE (28)
PRIMARY NET ENROLLMENT RATE (29)
GPI PRIMARY NET ENROLLMENT RATE (29)
SURVIVAL RATE TO LAST GRADE (PRIMARY) (24)
% 1st GRADE REPEATERS (PRIMARY) (27)
SECONDARY NET ENROLLMENT RATE (26)
GPI SECONDARY NET ENROLLMENT RATE (26)
PUBLIC EXPENDIT EDUCATION AS % GDP (24)
PUBLIC EXPEND EDUCATION AS % TOTAL PUBLIC EXPEND (21)
PUPIL/TEACHER (PRIMARY) (31)
PUPIL/TEACHER (SECONDARY) (29)
% TRAINED TEACHERS (PRIMARY) (21)
% TRAINED TEACHERS (SECONDARY) (17)
COMPLETION PRIMARY (15 - 19 years) (23)
GPI COMPLETION PRIMARY (15 - 19 years) (23)
U/R PI COMPLETION PRIMARY (15 - 19 years) (17)
QSUP/QINF PI COMPLETION PRIMARY (15 - 19 years) (18)
NORG/ORG PI COMPLETION PRIMARY (15 - 19 years) (8)
COMPLETION SECONDARY (20 - 24 years) (23)
GPI COMPLETION SECONDARY (20 - 24 years) (23)
U/R PI COMPLETION SECONDARY (20 - 24 years) (16)
U/R PI COMPLETION SECONDARY (20 - 24 years) (18)
NORG/ORG PI COMPLETION SECONDARY (20 - 24 years) (8)
ADULT LITERACY (22)
GPI ADULT LITERACY (22)
YOUTH LITERACY (21)
GPI YOUTH LITERACY (21)
BASICINFORMATION
Territory (in thousands km2) 0.43
Population (in thousands) 255
Urbanization (%) 44.5
Population aged 5 to 14 years (%) 12.5
Population aged 15 to 19 years (%) 7.1
GDP per capita (in US dollars PPP) 15 000
Years of compulsory education 11
Adult literacy rate (Pop 15 years and over) …
Youth literacy rate (Pop 15 to 24 years) …
Net enrolment rate in primary education …
Net enrolment rate in secondary education …
Human Development Index (HDI) 0.889
(BB)BARBADOS (BO)BOLIVIA
BASICINFORMATION
Territory (in thousands km2) 1 099
Population (in thousands) 9 694
Urbanization (%) 66.4
Population aged 5 to 14 years (%) 24.1
Population aged 15 to 19 years (%) 10.6
GDP per capita (in US dollars PPP) 4 140
Years of compulsory education 8
Adult literacy rate (Pop 15 years and over) 90.7
Youth literacy rate (Pop 15 to 24 years) 99.4
Net enrolment rate in primary education 95
Net enrolment rate in secondary education 69.9
Human Development Index (HDI) 0.723

86
INDICATOR(Number of cases)- Regional +
Average- Regional +
Average
HDI (34)
DEMOG GROWTH (2002-2015) (34)
% URBANIZATION (34)
DEMOGRAPHIC DEPENDENCY (34)
POTENTIAL DEMAND (PRIMARY - 5 a 14 years) (34)
POTENTIAL DEMAND (SECONDARY - 15 a 19 years) (34)
GDP PER CAPITA (USD PPP) (34)
GINI COEFICIENT (18)
PREPRIMARY NET ENROLLMENT RATE (26)
GPI PREPRIMARY NET ENROLLMENT RATE (26)
PRIMARY NET INTAKE RATE (25)
GPI PRIMARY NET INTAKE RATE (28)
PRIMARY NET ENROLLMENT RATE (29)
GPI PRIMARY NET ENROLLMENT RATE (29)
SURVIVAL RATE TO LAST GRADE (PRIMARY) (24)
% 1st GRADE REPEATERS (PRIMARY) (27)
SECONDARY NET ENROLLMENT RATE (26)
GPI SECONDARY NET ENROLLMENT RATE (26)
PUBLIC EXPENDIT EDUCATION AS % GDP (24)
PUBLIC EXPEND EDUCATION AS % TOTAL PUBLIC EXPEND (21)
PUPIL/TEACHER (PRIMARY) (31)
PUPIL/TEACHER (SECONDARY) (29)
% TRAINED TEACHERS (PRIMARY) (21)
% TRAINED TEACHERS (SECONDARY) (17)
COMPLETION PRIMARY (15 - 19 years) (23)
GPI COMPLETION PRIMARY (15 - 19 years) (23)
U/R PI COMPLETION PRIMARY (15 - 19 years) (17)
QSUP/QINF PI COMPLETION PRIMARY (15 - 19 years) (18)
NORG/ORG PI COMPLETION PRIMARY (15 - 19 years) (8)
COMPLETION SECONDARY (20 - 24 years) (23)
GPI COMPLETION SECONDARY (20 - 24 years) (23)
U/R PI COMPLETION SECONDARY (20 - 24 years) (16)
U/R PI COMPLETION SECONDARY (20 - 24 years) (18)
NORG/ORG PI COMPLETION SECONDARY (20 - 24 years) (8)
ADULT LITERACY (22)
GPI ADULT LITERACY (22)
YOUTH LITERACY (21)
GPI YOUTH LITERACY (21)
(BR)BRAZIL
BASICINFORMATION
Territory (in thousands km2) 8 512
Population (in thousands) 19 1972
Urbanization (%) 85.0
Population aged 5 to 14 years (%) 17.9
Population aged 15 to 19 years (%) 8.8
GDP per capita (in US dollars PPP) 9 370
Years of compulsory education 8
Adult literacy rate (Pop 15 years and over) 90.0
Youth literacy rate (Pop 15 to 24 years) 97.8
Net enrolment rate in primary education 93.5
Net enrolment rate in secondary education 77.0
Human Development Index (HDI) 0.807
(BS)BAHAMAS
BASICINFORMATION
Territory (in thousands km2) 13.9
Population (in thousands) 338
Urbanization (%) 84.1
Population aged 5 to 14 years (%) 18.3
Population aged 15 to 19 years (%) 8.7
GDP per capita (in US dollars PPP) 28 300
Years of compulsory education 12
Adult literacy rate (Pop 15 years and over) …
Youth literacy rate (Pop 15 to 24 years) …
Net enrolment rate in primary education 90.8
Net enrolment rate in secondary education 86.1
Human Development Index (HDI) 0.854

87
INDICATOR(Number of cases)- Regional +
Average- Regional +
Average
HDI (34)
DEMOG GROWTH (2002-2015) (34)
% URBANIZATION (34)
DEMOGRAPHIC DEPENDENCY (34)
POTENTIAL DEMAND (PRIMARY - 5 a 14 años) (34)
POTENTIAL DEMAND (SECONDARY - 15 a 19 YEARS) (34)
GDP PER CAPITA (USD PPP) (34)
GINI COEFICIENT (18)
PREPRIMARY NET ENROLLMENT RATE (26)
GPI PREPRIMARY NET ENROLLMENT RATE (26)
PRIMARY NET INTAKE RATE (25)
GPI PRIMARY NET INTAKE RATE (28)
PRIMARY NET ENROLLMENT RATE (29)
GPI PRIMARY NET ENROLLMENT RATE (29)
SURVIVAL RATE TO LAST GRADE (PRIMARY) (24)
% 1st GRADE REPEATERS (PRIMARY) (27)
SECONDARY NET ENROLLMENT RATE (26)
GPI SECONDARY NET ENROLLMENT RATE (26)
PUBLIC EXPENDIT EDUCATION AS % GDP (24)
PUBLIC EXPEND EDUCATION AS % TOTAL PUBLIC EXPEND (21)
PUPIL/TEACHER (PRIMARY) (31)
PUPIL/TEACHER (SECONDARY) (29)
% TRAINED TEACHERS (PRIMARY) (21)
% TRAINED TEACHERS (SECONDARY) (17)
COMPLETION PRIMARY (15 - 19 years) (23)
GPI COMPLETION PRIMARY (15 - 19 years) (23)
U/R PI COMPLETION PRIMARY (15 - 19 years) (17)
QSUP/QINF PI COMPLETION PRIMARY (15 - 19 years) (18)
NORG/ORG PI COMPLETION PRIMARY (15 - 19 years) (8)
COMPLETION SECONDARY (20 - 24 years) (23)
GPI COMPLETION SECONDARY (20 - 24 years) (23)
U/R PI COMPLETION SECONDARY (20 - 24 years) (16)
U/R PI COMPLETION SECONDARY (20 - 24 years) (18)
NORG/ORG PI COMPLETION SECONDARY (20 - 24 years) (8)
ADULT LITERACY (22)
GPI ADULT LITERACY (22)
YOUTH LITERACY (21)
GPI YOUTH LITERACY (21)
(BZ)BELIZE
BASICINFORMATION
Territory (in thousands km2) 23.0
Population (in thousands) 322
Urbanization (%) 52.3
Population aged 5 to 14 years (%) 24.1
Population aged 15 to 19 years (%) 10.6
GDP per capita (in US dollars PPP) 6 030
Years of compulsory education 10
Adult literacy rate (Pop 15 years and over) …
Youth literacy rate (Pop 15 to 24 years) …
Net enrolment rate in primary education 99.7
Net enrolment rate in secondary education 63.4
Human Development Index (HDI) 0.771
(CA)CANADA
BASICINFORMATION
Territory (in thousands km2) 9 985
Population (in thousands) 33 311
Urbanization (%) 80.0
Population aged 5 to 14 years (%) 11.8
Population aged 15 to 19 years (%) 6.7
GDP per capita (in US dollars PPP) 35 310
Years of compulsory education 11
Adult literacy rate (Pop 15 years and over) …
Youth literacy rate (Pop 15 to 24 years) …
Net enrolment rate in primary education …
Net enrolment rate in secondary education …
Human Development Index (HDI) 0.967

88
INDICATOR(Number of cases)- Regional +
Average- Regional +
Average
HDI (34)
DEMOG GROWTH (2002-2015) (34)
% URBANIZATION (34)
DEMOGRAPHIC DEPENDENCY (34)
POTENTIAL DEMAND (PRIMARY - 5 a 14 years) (34)
POTENTIAL DEMAND (SECONDARY - 15 a 19 years) (34)
GDP PER CAPITA (USD PPP) (34)
GINI COEFICIENT (18)
PREPRIMARY NET ENROLLMENT RATE (26)
GPI PREPRIMARY NET ENROLLMENT RATE (26)
PRIMARY NET INTAKE RATE (25)
GPI PRIMARY NET INTAKE RATE (28)
PRIMARY NET ENROLLMENT RATE (29)
GPI PRIMARY NET ENROLLMENT RATE (29)
SURVIVAL RATE TO LAST GRADE (PRIMARY) (24)
% 1st GRADE REPEATERS (PRIMARY) (27)
SECONDARY NET ENROLLMENT RATE (26)
GPI SECONDARY NET ENROLLMENT RATE (26)
PUBLIC EXPENDIT EDUCATION AS % GDP (24)
PUBLIC EXPEND EDUCATION AS % TOTAL PUBLIC EXPEND (21)
PUPIL/TEACHER (PRIMARY) (31)
PUPIL/TEACHER (SECONDARY) (29)
% TRAINED TEACHERS (PRIMARY) (21)
% TRAINED TEACHERS (SECONDARY) (17)
COMPLETION PRIMARY (15 - 19 years) (23)
GPI COMPLETION PRIMARY (15 - 19 years) (23)
U/R PI COMPLETION PRIMARY (15 - 19 years) (17)
QSUP/QINF PI COMPLETION PRIMARY (15 - 19 years) (18)
NORG/ORG PI COMPLETION PRIMARY (15 - 19 years) (8)
COMPLETION SECONDARY (20 - 24 years) (23)
GPI COMPLETION SECONDARY (20 - 24 years) (23)
U/R PI COMPLETION SECONDARY (20 - 24 years) (16)
U/R PI COMPLETION SECONDARY (20 - 24 years) (18)
NORG/ORG PI COMPLETION SECONDARY (20 - 24 years) (8)
ADULT LITERACY (22)
GPI ADULT LITERACY (22)
YOUTH LITERACY (21)
GPI YOUTH LITERACY (21)
BASICINFORMATION
Territory (in thousands km2) 757
Population (in thousands) 16 808
Urbanization (%) 87.5
Population aged 5 to 14 years (%) 16.3
Population aged 15 to 19 years (%) 9.0
GDP per capita (in US dollars PPP) 12 590
Years of compulsory education 12
Adult literacy rate (Pop 15 years and over) 98.6
Youth literacy rate (Pop 15 to 24 years) 99.2
Net enrolment rate in primary education 94.4
Net enrolment rate in secondary education 85.3
Human Development Index (HDI) 0.874
(CL)CHILE (CO)COLOMBIA
BASICINFORMATION
Territory (in thousands km2) 1 139
Population (in thousands) 45 012
Urbanization (%) 78.5
Population aged 5 to 14 years (%) 19.8
Population aged 15 to 19 years (%) 9.6
GDP per capita (in US dollars PPP) 6 640
Years of compulsory education 10
Adult literacy rate (Pop 15 years and over) 93.4
Youth literacy rate (Pop 15 to 24 years) 98.0
Net enrolment rate in primary education 93.5
Net enrolment rate in secondary education 71.2
Human Development Index (HDI) 0.787
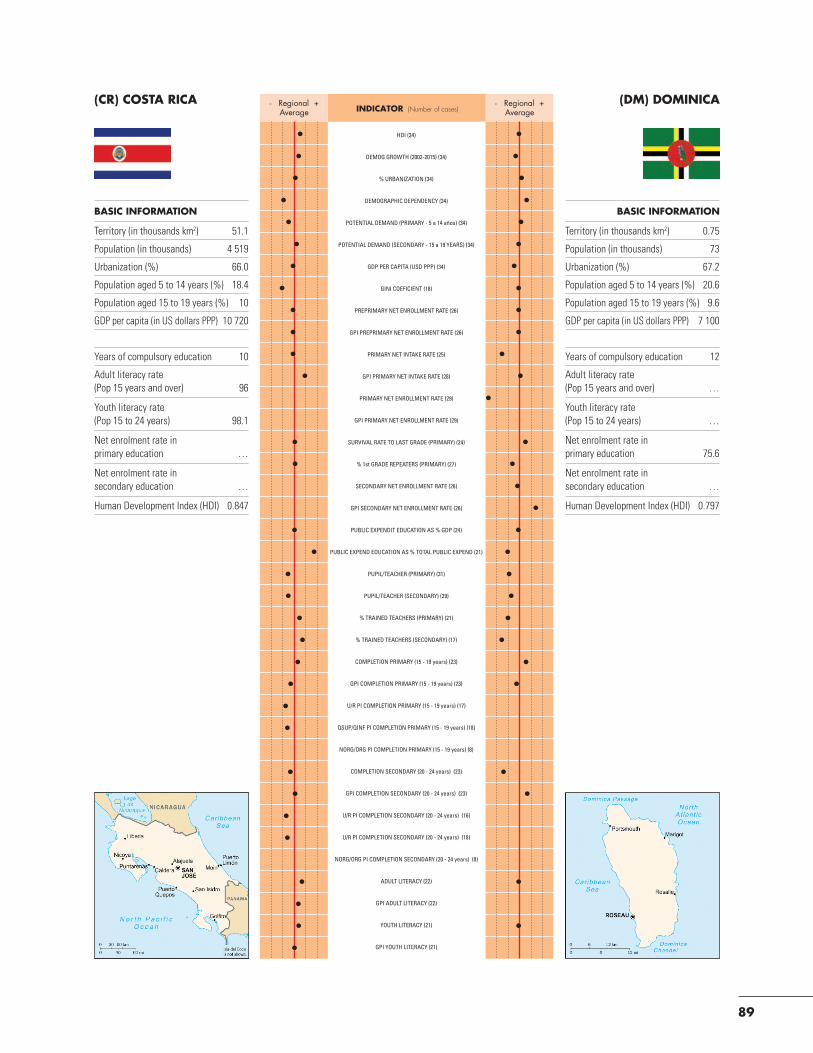
89
INDICATOR(Number of cases)- Regional +
Average- Regional +
Average
HDI (34)
DEMOG GROWTH (2002-2015) (34)
% URBANIZATION (34)
DEMOGRAPHIC DEPENDENCY (34)
POTENTIAL DEMAND (PRIMARY - 5 a 14 años) (34)
POTENTIAL DEMAND (SECONDARY - 15 a 19 YEARS) (34)
GDP PER CAPITA (USD PPP) (34)
GINI COEFICIENT (18)
PREPRIMARY NET ENROLLMENT RATE (26)
GPI PREPRIMARY NET ENROLLMENT RATE (26)
PRIMARY NET INTAKE RATE (25)
GPI PRIMARY NET INTAKE RATE (28)
PRIMARY NET ENROLLMENT RATE (29)
GPI PRIMARY NET ENROLLMENT RATE (29)
SURVIVAL RATE TO LAST GRADE (PRIMARY) (24)
% 1st GRADE REPEATERS (PRIMARY) (27)
SECONDARY NET ENROLLMENT RATE (26)
GPI SECONDARY NET ENROLLMENT RATE (26)
PUBLIC EXPENDIT EDUCATION AS % GDP (24)
PUBLIC EXPEND EDUCATION AS % TOTAL PUBLIC EXPEND (21)
PUPIL/TEACHER (PRIMARY) (31)
PUPIL/TEACHER (SECONDARY) (29)
% TRAINED TEACHERS (PRIMARY) (21)
% TRAINED TEACHERS (SECONDARY) (17)
COMPLETION PRIMARY (15 - 19 years) (23)
GPI COMPLETION PRIMARY (15 - 19 years) (23)
U/R PI COMPLETION PRIMARY (15 - 19 years) (17)
QSUP/QINF PI COMPLETION PRIMARY (15 - 19 years) (18)
NORG/ORG PI COMPLETION PRIMARY (15 - 19 years) (8)
COMPLETION SECONDARY (20 - 24 years) (23)
GPI COMPLETION SECONDARY (20 - 24 years) (23)
U/R PI COMPLETION SECONDARY (20 - 24 years) (16)
U/R PI COMPLETION SECONDARY (20 - 24 years) (18)
NORG/ORG PI COMPLETION SECONDARY (20 - 24 years) (8)
ADULT LITERACY (22)
GPI ADULT LITERACY (22)
YOUTH LITERACY (21)
GPI YOUTH LITERACY (21)
(CR)COSTARICA
BASICINFORMATION
Territory (in thousands km2) 51.1
Population (in thousands) 4 519
Urbanization (%) 66.0
Population aged 5 to 14 years (%) 18.4
Population aged 15 to 19 years (%) 10
GDP per capita (in US dollars PPP) 10 720
Years of compulsory education 10
Adult literacy rate (Pop 15 years and over) 96
Youth literacy rate (Pop 15 to 24 years) 98.1
Net enrolment rate in primary education …
Net enrolment rate in secondary education …
Human Development Index (HDI) 0.847
(DM)DOMINICA
BASICINFORMATION
Territory (in thousands km2) 0.75
Population (in thousands) 73
Urbanization (%) 67.2
Population aged 5 to 14 years (%) 20.6
Population aged 15 to 19 years (%) 9.6
GDP per capita (in US dollars PPP) 7 100
Years of compulsory education 12
Adult literacy rate (Pop 15 years and over) …
Youth literacy rate (Pop 15 to 24 years) …
Net enrolment rate in primary education 75.6
Net enrolment rate in secondary education …
Human Development Index (HDI) 0.797

90
INDICATOR(Number of cases)- Regional +
Average- Regional +
Average
HDI (34)
DEMOG GROWTH (2002-2015) (34)
% URBANIZATION (34)
DEMOGRAPHIC DEPENDENCY (34)
POTENTIAL DEMAND (PRIMARY - 5 a 14 years) (34)
POTENTIAL DEMAND (SECONDARY - 15 a 19 years) (34)
GDP PER CAPITA (USD PPP) (34)
GINI COEFICIENT (18)
PREPRIMARY NET ENROLLMENT RATE (26)
GPI PREPRIMARY NET ENROLLMENT RATE (26)
PRIMARY NET INTAKE RATE (25)
GPI PRIMARY NET INTAKE RATE (28)
PRIMARY NET ENROLLMENT RATE (29)
GPI PRIMARY NET ENROLLMENT RATE (29)
SURVIVAL RATE TO LAST GRADE (PRIMARY) (24)
% 1st GRADE REPEATERS (PRIMARY) (27)
SECONDARY NET ENROLLMENT RATE (26)
GPI SECONDARY NET ENROLLMENT RATE (26)
PUBLIC EXPENDIT EDUCATION AS % GDP (24)
PUBLIC EXPEND EDUCATION AS % TOTAL PUBLIC EXPEND (21)
PUPIL/TEACHER (PRIMARY) (31)
PUPIL/TEACHER (SECONDARY) (29)
% TRAINED TEACHERS (PRIMARY) (21)
% TRAINED TEACHERS (SECONDARY) (17)
COMPLETION PRIMARY (15 - 19 years) (23)
GPI COMPLETION PRIMARY (15 - 19 years) (23)
U/R PI COMPLETION PRIMARY (15 - 19 years) (17)
QSUP/QINF PI COMPLETION PRIMARY (15 - 19 years) (18)
NORG/ORG PI COMPLETION PRIMARY (15 - 19 years) (8)
COMPLETION SECONDARY (20 - 24 years) (23)
GPI COMPLETION SECONDARY (20 - 24 years) (23)
U/R PI COMPLETION SECONDARY (20 - 24 years) (16)
U/R PI COMPLETION SECONDARY (20 - 24 years) (18)
NORG/ORG PI COMPLETION SECONDARY (20 - 24 years) (8)
ADULT LITERACY (22)
GPI ADULT LITERACY (22)
YOUTH LITERACY (21)
GPI YOUTH LITERACY (21)
BASICINFORMATION
Territory (in thousands km2) 284
Population (in thousands) 13 481
Urbanization (%) 65.0
Population aged 5 to 14 years (%) 21.3
Population aged 15 to 19 years (%) 10.0
GDP per capita (in US dollars PPP) 7 040
Years of compulsory education 10
Adult literacy rate (Pop 15 years and over) 84.2
Youth literacy rate (Pop 15 to 24 years) 95.4
Net enrolment rate in primary education 99.3
Net enrolment rate in secondary education 59.2
Human Development Index (HDI) 0.807
(EC)ECUADOR(DO)DOMINICANREPUBLIC
BASICINFORMATION
Territory (in thousands km2) 48.7
Population (in thousands) 9 953
Urbanization (%) 68.6
Population aged 5 to 14 years (%) 21.6
Population aged 15 to 19 years (%) 9.6
GDP per capita (in US dollars PPP) 6 350
Years of compulsory education 9
Adult literacy rate (Pop 15 years and over) 88.2
Youth literacy rate (Pop 15 to 24 years) 96
Net enrolment rate in primary education 82.4
Net enrolment rate in secondary education 57.7
Human Development Index (HDI) 0.7688
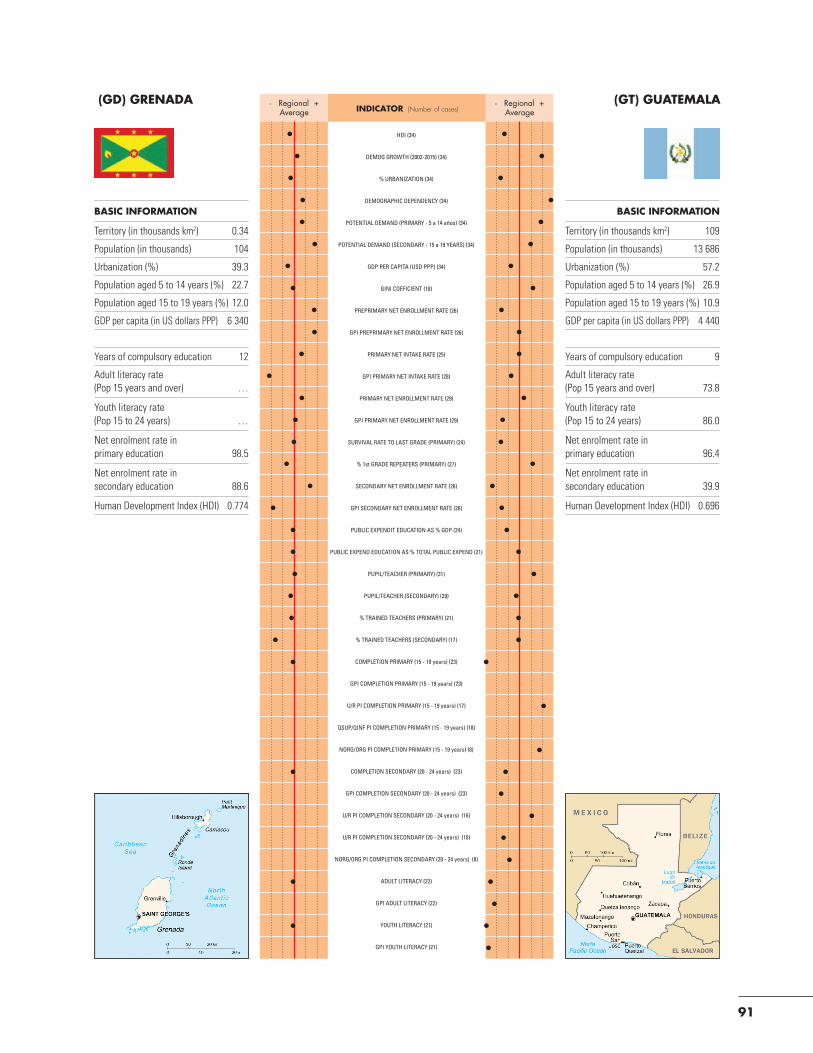
91
INDICATOR(Number of cases)- Regional +
Average- Regional +
Average
HDI (34)
DEMOG GROWTH (2002-2015) (34)
% URBANIZATION (34)
DEMOGRAPHIC DEPENDENCY (34)
POTENTIAL DEMAND (PRIMARY - 5 a 14 años) (34)
POTENTIAL DEMAND (SECONDARY - 15 a 19 YEARS) (34)
GDP PER CAPITA (USD PPP) (34)
GINI COEFICIENT (18)
PREPRIMARY NET ENROLLMENT RATE (26)
GPI PREPRIMARY NET ENROLLMENT RATE (26)
PRIMARY NET INTAKE RATE (25)
GPI PRIMARY NET INTAKE RATE (28)
PRIMARY NET ENROLLMENT RATE (29)
GPI PRIMARY NET ENROLLMENT RATE (29)
SURVIVAL RATE TO LAST GRADE (PRIMARY) (24)
% 1st GRADE REPEATERS (PRIMARY) (27)
SECONDARY NET ENROLLMENT RATE (26)
GPI SECONDARY NET ENROLLMENT RATE (26)
PUBLIC EXPENDIT EDUCATION AS % GDP (24)
PUBLIC EXPEND EDUCATION AS % TOTAL PUBLIC EXPEND (21)
PUPIL/TEACHER (PRIMARY) (31)
PUPIL/TEACHER (SECONDARY) (29)
% TRAINED TEACHERS (PRIMARY) (21)
% TRAINED TEACHERS (SECONDARY) (17)
COMPLETION PRIMARY (15 - 19 years) (23)
GPI COMPLETION PRIMARY (15 - 19 years) (23)
U/R PI COMPLETION PRIMARY (15 - 19 years) (17)
QSUP/QINF PI COMPLETION PRIMARY (15 - 19 years) (18)
NORG/ORG PI COMPLETION PRIMARY (15 - 19 years) (8)
COMPLETION SECONDARY (20 - 24 years) (23)
GPI COMPLETION SECONDARY (20 - 24 years) (23)
U/R PI COMPLETION SECONDARY (20 - 24 years) (16)
U/R PI COMPLETION SECONDARY (20 - 24 years) (18)
NORG/ORG PI COMPLETION SECONDARY (20 - 24 years) (8)
ADULT LITERACY (22)
GPI ADULT LITERACY (22)
YOUTH LITERACY (21)
GPI YOUTH LITERACY (21)
(GD)GRENADA
BASICINFORMATION
Territory (in thousands km2) 0.34
Population (in thousands) 104
Urbanization (%) 39.3
Population aged 5 to 14 years (%) 22.7
Population aged 15 to 19 years (%) 12.0
GDP per capita (in US dollars PPP) 6 340
Years of compulsory education 12
Adult literacy rate (Pop 15 years and over) …
Youth literacy rate (Pop 15 to 24 years) …
Net enrolment rate in primary education 98.5
Net enrolment rate in secondary education 88.6
Human Development Index (HDI) 0.774
(GT)GUATEMALA
BASICINFORMATION
Territory (in thousands km2) 109
Population (in thousands) 13 686
Urbanization (%) 57.2
Population aged 5 to 14 years (%) 26.9
Population aged 15 to 19 years (%) 10.9
GDP per capita (in US dollars PPP) 4 440
Years of compulsory education 9
Adult literacy rate (Pop 15 years and over) 73.8
Youth literacy rate (Pop 15 to 24 years) 86.0
Net enrolment rate in primary education 96.4
Net enrolment rate in secondary education 39.9
Human Development Index (HDI) 0.696
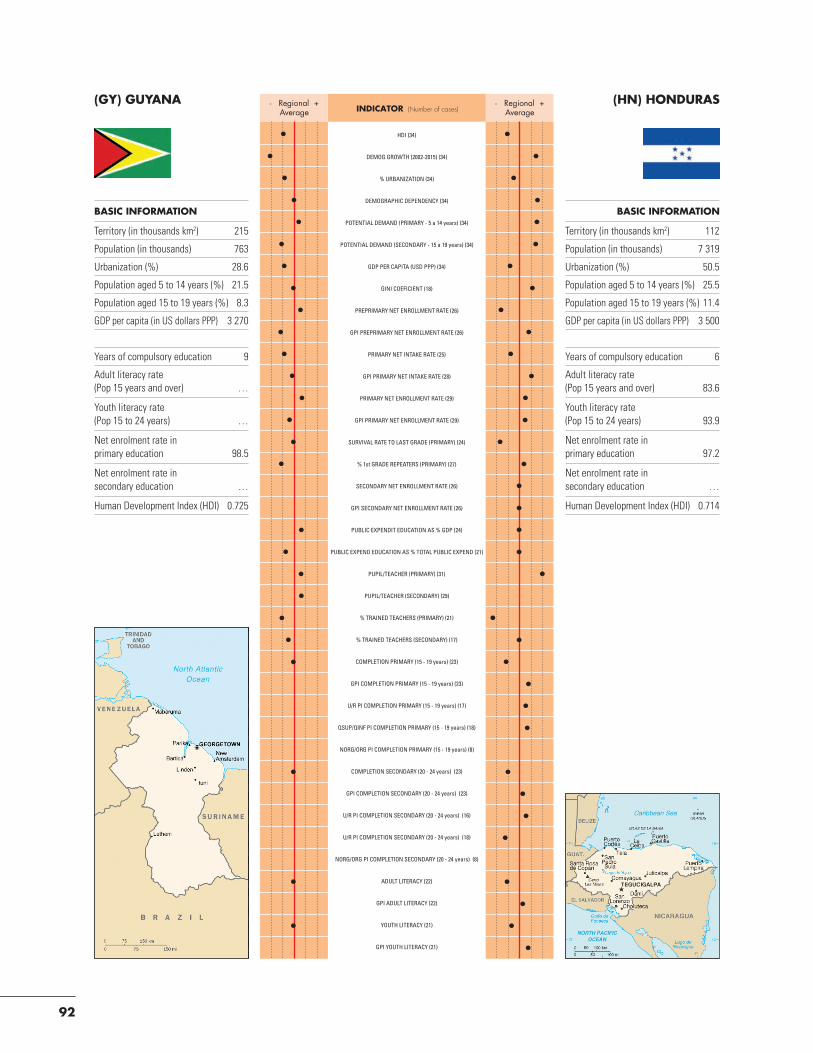
92
INDICATOR(Number of cases)- Regional +
Average- Regional +
Average
HDI (34)
DEMOG GROWTH (2002-2015) (34)
% URBANIZATION (34)
DEMOGRAPHIC DEPENDENCY (34)
POTENTIAL DEMAND (PRIMARY - 5 a 14 years) (34)
POTENTIAL DEMAND (SECONDARY - 15 a 19 years) (34)
GDP PER CAPITA (USD PPP) (34)
GINI COEFICIENT (18)
PREPRIMARY NET ENROLLMENT RATE (26)
GPI PREPRIMARY NET ENROLLMENT RATE (26)
PRIMARY NET INTAKE RATE (25)
GPI PRIMARY NET INTAKE RATE (28)
PRIMARY NET ENROLLMENT RATE (29)
GPI PRIMARY NET ENROLLMENT RATE (29)
SURVIVAL RATE TO LAST GRADE (PRIMARY) (24)
% 1st GRADE REPEATERS (PRIMARY) (27)
SECONDARY NET ENROLLMENT RATE (26)
GPI SECONDARY NET ENROLLMENT RATE (26)
PUBLIC EXPENDIT EDUCATION AS % GDP (24)
PUBLIC EXPEND EDUCATION AS % TOTAL PUBLIC EXPEND (21)
PUPIL/TEACHER (PRIMARY) (31)
PUPIL/TEACHER (SECONDARY) (29)
% TRAINED TEACHERS (PRIMARY) (21)
% TRAINED TEACHERS (SECONDARY) (17)
COMPLETION PRIMARY (15 - 19 years) (23)
GPI COMPLETION PRIMARY (15 - 19 years) (23)
U/R PI COMPLETION PRIMARY (15 - 19 years) (17)
QSUP/QINF PI COMPLETION PRIMARY (15 - 19 years) (18)
NORG/ORG PI COMPLETION PRIMARY (15 - 19 years) (8)
COMPLETION SECONDARY (20 - 24 years) (23)
GPI COMPLETION SECONDARY (20 - 24 years) (23)
U/R PI COMPLETION SECONDARY (20 - 24 years) (16)
U/R PI COMPLETION SECONDARY (20 - 24 years) (18)
NORG/ORG PI COMPLETION SECONDARY (20 - 24 years) (8)
ADULT LITERACY (22)
GPI ADULT LITERACY (22)
YOUTH LITERACY (21)
GPI YOUTH LITERACY (21)
(GY)GUYANA
BASICINFORMATION
Territory (in thousands km2) 215
Population (in thousands) 763
Urbanization (%) 28.6
Population aged 5 to 14 years (%) 21.5
Population aged 15 to 19 years (%) 8.3
GDP per capita (in US dollars PPP) 3 270
Years of compulsory education 9
Adult literacy rate (Pop 15 years and over) …
Youth literacy rate (Pop 15 to 24 years) …
Net enrolment rate in primary education 98.5
Net enrolment rate in secondary education …
Human Development Index (HDI) 0.725
(HN)HONDURAS
BASICINFORMATION
Territory (in thousands km2) 112
Population (in thousands) 7 319
Urbanization (%) 50.5
Population aged 5 to 14 years (%) 25.5
Population aged 15 to 19 years (%) 11.4
GDP per capita (in US dollars PPP) 3 500
Years of compulsory education 6
Adult literacy rate (Pop 15 years and over) 83.6
Youth literacy rate (Pop 15 to 24 years) 93.9
Net enrolment rate in primary education 97.2
Net enrolment rate in secondary education …
Human Development Index (HDI) 0.714

93
INDICATOR(Number of cases)- Regional +
Average- Regional +
Average
HDI (34)
DEMOG GROWTH (2002-2015) (34)
% URBANIZATION (34)
DEMOGRAPHIC DEPENDENCY (34)
POTENTIAL DEMAND (PRIMARY - 5 a 14 años) (34)
POTENTIAL DEMAND (SECONDARY - 15 a 19 YEARS) (34)
GDP PER CAPITA (USD PPP) (34)
GINI COEFICIENT (18)
PREPRIMARY NET ENROLLMENT RATE (26)
GPI PREPRIMARY NET ENROLLMENT RATE (26)
PRIMARY NET INTAKE RATE (25)
GPI PRIMARY NET INTAKE RATE (28)
PRIMARY NET ENROLLMENT RATE (29)
GPI PRIMARY NET ENROLLMENT RATE (29)
SURVIVAL RATE TO LAST GRADE (PRIMARY) (24)
% 1st GRADE REPEATERS (PRIMARY) (27)
SECONDARY NET ENROLLMENT RATE (26)
GPI SECONDARY NET ENROLLMENT RATE (26)
PUBLIC EXPENDIT EDUCATION AS % GDP (24)
PUBLIC EXPEND EDUCATION AS % TOTAL PUBLIC EXPEND (21)
PUPIL/TEACHER (PRIMARY) (31)
PUPIL/TEACHER (SECONDARY) (29)
% TRAINED TEACHERS (PRIMARY) (21)
% TRAINED TEACHERS (SECONDARY) (17)
COMPLETION PRIMARY (15 - 19 years) (23)
GPI COMPLETION PRIMARY (15 - 19 years) (23)
U/R PI COMPLETION PRIMARY (15 - 19 years) (17)
QSUP/QINF PI COMPLETION PRIMARY (15 - 19 years) (18)
NORG/ORG PI COMPLETION PRIMARY (15 - 19 years) (8)
COMPLETION SECONDARY (20 - 24 years) (23)
GPI COMPLETION SECONDARY (20 - 24 years) (23)
U/R PI COMPLETION SECONDARY (20 - 24 years) (16)
U/R PI COMPLETION SECONDARY (20 - 24 years) (18)
NORG/ORG PI COMPLETION SECONDARY (20 - 24 years) (8)
ADULT LITERACY (22)
GPI ADULT LITERACY (22)
YOUTH LITERACY (21)
GPI YOUTH LITERACY (21)
(HT)HAITI
BASICINFORMATION
Territory (in thousands km2) 27.8
Population (in thousands) 9 876
Urbanization (%) 45.3
Population aged 5 to 14 years (%) 24.1
Population aged 15 to 19 years (%) 11.1
GDP per capita (in US dollars PPP) 1 310
Years of compulsory education 6
Adult literacy rate (Pop 15 years and over) …
Youth literacy rate (Pop 15 to 24 years) …
Net enrolment rate in primary education …
Net enrolment rate in secondary education …
Human Development Index (HDI) 0.521
(JM)JAMAICA
BASICINFORMATION
Territory (in thousands km2) 11
Population (in thousands) 2 687
Urbanization (%) 52.0
Population aged 5 to 14 years (%) 20.8
Population aged 15 to 19 years (%) 10.2
GDP per capita (in US dollars PPP) 5 990
Years of compulsory education 6
Adult literacy rate (Pop 15 years and over) 86.0
Youth literacy rate (Pop 15 to 24 years) 95.0
Net enrolment rate in primary education 85.5
Net enrolment rate in secondary education 76.7
Human Development Index (HDI) 0.771

94
INDICATOR(Number of cases)- Regional +
Average- Regional +
Average
HDI (34)
DEMOG GROWTH (2002-2015) (34)
% URBANIZATION (34)
DEMOGRAPHIC DEPENDENCY (34)
POTENTIAL DEMAND (PRIMARY - 5 a 14 years) (34)
POTENTIAL DEMAND (SECONDARY - 15 a 19 years) (34)
GDP PER CAPITA (USD PPP) (34)
GINI COEFICIENT (18)
PREPRIMARY NET ENROLLMENT RATE (26)
GPI PREPRIMARY NET ENROLLMENT RATE (26)
PRIMARY NET INTAKE RATE (25)
GPI PRIMARY NET INTAKE RATE (28)
PRIMARY NET ENROLLMENT RATE (29)
GPI PRIMARY NET ENROLLMENT RATE (29)
SURVIVAL RATE TO LAST GRADE (PRIMARY) (24)
% 1st GRADE REPEATERS (PRIMARY) (27)
SECONDARY NET ENROLLMENT RATE (26)
GPI SECONDARY NET ENROLLMENT RATE (26)
PUBLIC EXPENDIT EDUCATION AS % GDP (24)
PUBLIC EXPEND EDUCATION AS % TOTAL PUBLIC EXPEND (21)
PUPIL/TEACHER (PRIMARY) (31)
PUPIL/TEACHER (SECONDARY) (29)
% TRAINED TEACHERS (PRIMARY) (21)
% TRAINED TEACHERS (SECONDARY) (17)
COMPLETION PRIMARY (15 - 19 years) (23)
GPI COMPLETION PRIMARY (15 - 19 years) (23)
U/R PI COMPLETION PRIMARY (15 - 19 years) (17)
QSUP/QINF PI COMPLETION PRIMARY (15 - 19 years) (18)
NORG/ORG PI COMPLETION PRIMARY (15 - 19 years) (8)
COMPLETION SECONDARY (20 - 24 years) (23)
GPI COMPLETION SECONDARY (20 - 24 years) (23)
U/R PI COMPLETION SECONDARY (20 - 24 years) (16)
U/R PI COMPLETION SECONDARY (20 - 24 years) (18)
NORG/ORG PI COMPLETION SECONDARY (20 - 24 years) (8)
ADULT LITERACY (22)
GPI ADULT LITERACY (22)
YOUTH LITERACY (21)
GPI YOUTH LITERACY (21)
(KN)SAINTKITTSANDNEVIS
BASICINFORMATION
Territory (in thousands km2) 0.26
Population (in thousands) 49
Urbanization (%) 32.4
Population aged 5 to 14 years (%) 20.8
Population aged 15 to 19 years (%) 10.1
GDP per capita (in US dollars PPP) 12 220
Years of compulsory education 12
Adult literacy rate (Pop 15 years and over) …
Youth literacy rate (Pop 15 to 24 years) …
Net enrolment rate in primary education …
Net enrolment rate in secondary education 78.7
Human Development Index (HDI) 0.830
(LC)SAINTLUCIA
BASICINFORMATION
Territory (in thousands km2) 0.62
Population (in thousands) 170
Urbanization (%) 28.0
Population aged 5 to 14 years (%) 17.8
Population aged 15 to 19 years (%) 10.0
GDP per capita (in US dollars PPP) 9 000
Years of compulsory education 11
Adult literacy rate (Pop 15 years and over) …
Youth literacy rate (Pop 15 to 24 years) …
Net enrolment rate in primary education 93.5
Net enrolment rate in secondary education 79.6
Human Development Index (HDI) 0.821

95
INDICATOR(Number of cases)- Regional +
Average- Regional +
Average
HDI (34)
DEMOG GROWTH (2002-2015) (34)
% URBANIZATION (34)
DEMOGRAPHIC DEPENDENCY (34)
POTENTIAL DEMAND (PRIMARY - 5 a 14 años) (34)
POTENTIAL DEMAND (SECONDARY - 15 a 19 YEARS) (34)
GDP PER CAPITA (USD PPP) (34)
GINI COEFICIENT (18)
PREPRIMARY NET ENROLLMENT RATE (26)
GPI PREPRIMARY NET ENROLLMENT RATE (26)
PRIMARY NET INTAKE RATE (25)
GPI PRIMARY NET INTAKE RATE (28)
PRIMARY NET ENROLLMENT RATE (29)
GPI PRIMARY NET ENROLLMENT RATE (29)
SURVIVAL RATE TO LAST GRADE (PRIMARY) (24)
% 1st GRADE REPEATERS (PRIMARY) (27)
SECONDARY NET ENROLLMENT RATE (26)
GPI SECONDARY NET ENROLLMENT RATE (26)
PUBLIC EXPENDIT EDUCATION AS % GDP (24)
PUBLIC EXPEND EDUCATION AS % TOTAL PUBLIC EXPEND (21)
PUPIL/TEACHER (PRIMARY) (31)
PUPIL/TEACHER (SECONDARY) (29)
% TRAINED TEACHERS (PRIMARY) (21)
% TRAINED TEACHERS (SECONDARY) (17)
COMPLETION PRIMARY (15 - 19 years) (23)
GPI COMPLETION PRIMARY (15 - 19 years) (23)
U/R PI COMPLETION PRIMARY (15 - 19 years) (17)
QSUP/QINF PI COMPLETION PRIMARY (15 - 19 years) (18)
NORG/ORG PI COMPLETION PRIMARY (15 - 19 years) (8)
COMPLETION SECONDARY (20 - 24 years) (23)
GPI COMPLETION SECONDARY (20 - 24 years) (23)
U/R PI COMPLETION SECONDARY (20 - 24 years) (16)
U/R PI COMPLETION SECONDARY (20 - 24 years) (18)
NORG/ORG PI COMPLETION SECONDARY (20 - 24 years) (8)
ADULT LITERACY (22)
GPI ADULT LITERACY (22)
YOUTH LITERACY (21)
GPI YOUTH LITERACY (21)
(MX)MEXICO
BASICINFORMATION
Territory (in thousands km2) 1 973
Population (in thousands) 106 350
Urbanization (%) 78.0
Population aged 5 to 14 years (%) 20.0
Population aged 15 to 19 years (%) 9.5
GDP per capita (in US dollars PPP) 12 580
Years of compulsory education 10
Adult literacy rate (Pop 15 years and over) 92.9
Youth literacy rate (Pop 15 to 24 years) 98.4
Net enrolment rate in primary education 99.4
Net enrolment rate in secondary education 70.9
Human Development Index (HDI) 0.842
(NI)NICARAGUA
BASICINFORMATION
Territory (in thousands km2) 129
Population (in thousands) 5 667
Urbanization (%) 58.3
Population aged 5 to 14 years (%) 24.5
Population aged 15 to 19 years (%) 11.5
GDP per capita (in US dollars PPP) 2 420
Years of compulsory education 6
Adult literacy rate (Pop 15 years and over) 78.0
Youth literacy rate (Pop 15 to 24 years) 87.0
Net enrolment rate in primary education 93.4
Net enrolment rate in secondary education 45.2
Human Development Index (HDI) 0.699
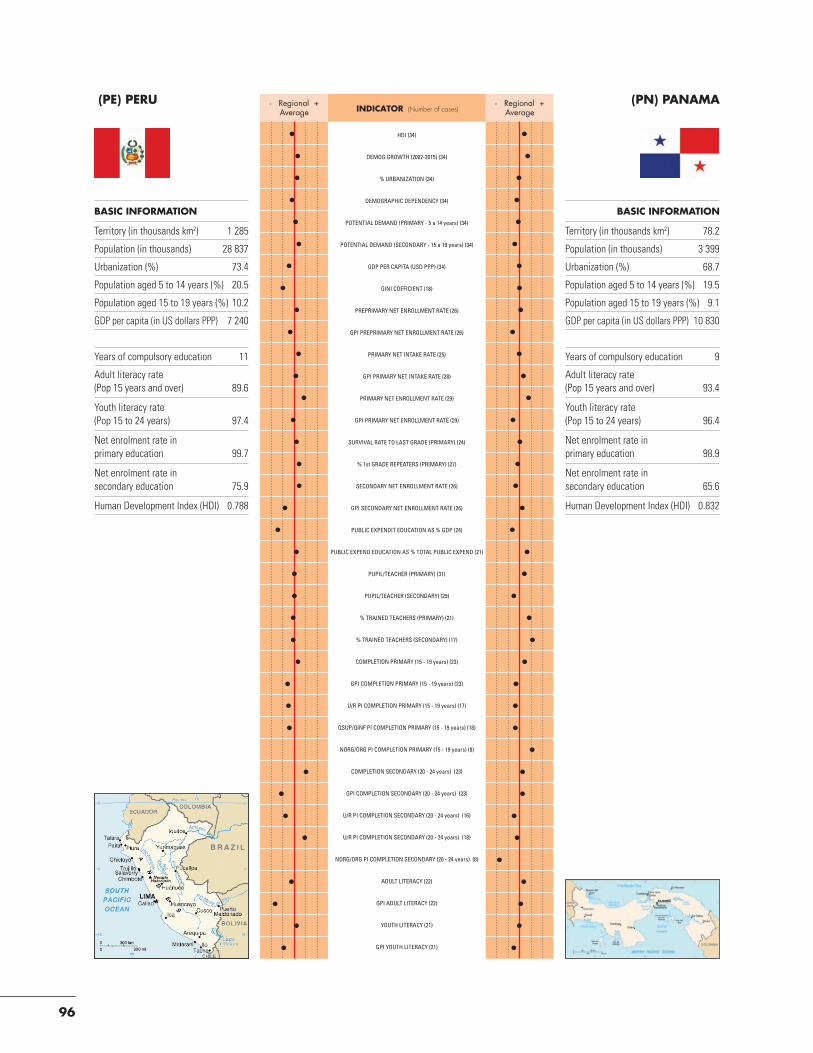
96
INDICATOR(Number of cases)- Regional +
Average- Regional +
Average
HDI (34)
DEMOG GROWTH (2002-2015) (34)
% URBANIZATION (34)
DEMOGRAPHIC DEPENDENCY (34)
POTENTIAL DEMAND (PRIMARY - 5 a 14 years) (34)
POTENTIAL DEMAND (SECONDARY - 15 a 19 years) (34)
GDP PER CAPITA (USD PPP) (34)
GINI COEFICIENT (18)
PREPRIMARY NET ENROLLMENT RATE (26)
GPI PREPRIMARY NET ENROLLMENT RATE (26)
PRIMARY NET INTAKE RATE (25)
GPI PRIMARY NET INTAKE RATE (28)
PRIMARY NET ENROLLMENT RATE (29)
GPI PRIMARY NET ENROLLMENT RATE (29)
SURVIVAL RATE TO LAST GRADE (PRIMARY) (24)
% 1st GRADE REPEATERS (PRIMARY) (27)
SECONDARY NET ENROLLMENT RATE (26)
GPI SECONDARY NET ENROLLMENT RATE (26)
PUBLIC EXPENDIT EDUCATION AS % GDP (24)
PUBLIC EXPEND EDUCATION AS % TOTAL PUBLIC EXPEND (21)
PUPIL/TEACHER (PRIMARY) (31)
PUPIL/TEACHER (SECONDARY) (29)
% TRAINED TEACHERS (PRIMARY) (21)
% TRAINED TEACHERS (SECONDARY) (17)
COMPLETION PRIMARY (15 - 19 years) (23)
GPI COMPLETION PRIMARY (15 - 19 years) (23)
U/R PI COMPLETION PRIMARY (15 - 19 years) (17)
QSUP/QINF PI COMPLETION PRIMARY (15 - 19 years) (18)
NORG/ORG PI COMPLETION PRIMARY (15 - 19 years) (8)
COMPLETION SECONDARY (20 - 24 years) (23)
GPI COMPLETION SECONDARY (20 - 24 years) (23)
U/R PI COMPLETION SECONDARY (20 - 24 years) (16)
U/R PI COMPLETION SECONDARY (20 - 24 years) (18)
NORG/ORG PI COMPLETION SECONDARY (20 - 24 years) (8)
ADULT LITERACY (22)
GPI ADULT LITERACY (22)
YOUTH LITERACY (21)
GPI YOUTH LITERACY (21)
(PE)PERU
BASICINFORMATION
Territory (in thousands km2) 1 285
Population (in thousands) 28 837
Urbanization (%) 73.4
Population aged 5 to 14 years (%) 20.5
Population aged 15 to 19 years (%) 10.2
GDP per capita (in US dollars PPP) 7 240
Years of compulsory education 11
Adult literacy rate (Pop 15 years and over) 89.6
Youth literacy rate (Pop 15 to 24 years) 97.4
Net enrolment rate in primary education 99.7
Net enrolment rate in secondary education 75.9
Human Development Index (HDI) 0.788
(PN)PANAMA
BASICINFORMATION
Territory (in thousands km2) 78.2
Population (in thousands) 3 399
Urbanization (%) 68.7
Population aged 5 to 14 years (%) 19.5
Population aged 15 to 19 years (%) 9.1
GDP per capita (in US dollars PPP) 10 830
Years of compulsory education 9
Adult literacy rate (Pop 15 years and over) 93.4
Youth literacy rate (Pop 15 to 24 years) 96.4
Net enrolment rate in primary education 98.9
Net enrolment rate in secondary education 65.6
Human Development Index (HDI) 0.832

97
INDICATOR(Number of cases)- Regional +
Average- Regional +
Average
HDI (34)
DEMOG GROWTH (2002-2015) (34)
% URBANIZATION (34)
DEMOGRAPHIC DEPENDENCY (34)
POTENTIAL DEMAND (PRIMARY - 5 a 14 años) (34)
POTENTIAL DEMAND (SECONDARY - 15 a 19 YEARS) (34)
GDP PER CAPITA (USD PPP) (34)
GINI COEFICIENT (18)
PREPRIMARY NET ENROLLMENT RATE (26)
GPI PREPRIMARY NET ENROLLMENT RATE (26)
PRIMARY NET INTAKE RATE (25)
GPI PRIMARY NET INTAKE RATE (28)
PRIMARY NET ENROLLMENT RATE (29)
GPI PRIMARY NET ENROLLMENT RATE (29)
SURVIVAL RATE TO LAST GRADE (PRIMARY) (24)
% 1st GRADE REPEATERS (PRIMARY) (27)
SECONDARY NET ENROLLMENT RATE (26)
GPI SECONDARY NET ENROLLMENT RATE (26)
PUBLIC EXPENDIT EDUCATION AS % GDP (24)
PUBLIC EXPEND EDUCATION AS % TOTAL PUBLIC EXPEND (21)
PUPIL/TEACHER (PRIMARY) (31)
PUPIL/TEACHER (SECONDARY) (29)
% TRAINED TEACHERS (PRIMARY) (21)
% TRAINED TEACHERS (SECONDARY) (17)
COMPLETION PRIMARY (15 - 19 years) (23)
GPI COMPLETION PRIMARY (15 - 19 years) (23)
U/R PI COMPLETION PRIMARY (15 - 19 years) (17)
QSUP/QINF PI COMPLETION PRIMARY (15 - 19 years) (18)
NORG/ORG PI COMPLETION PRIMARY (15 - 19 years) (8)
COMPLETION SECONDARY (20 - 24 years) (23)
GPI COMPLETION SECONDARY (20 - 24 years) (23)
U/R PI COMPLETION SECONDARY (20 - 24 years) (16)
U/R PI COMPLETION SECONDARY (20 - 24 years) (18)
NORG/ORG PI COMPLETION SECONDARY (20 - 24 years) (8)
ADULT LITERACY (22)
GPI ADULT LITERACY (22)
YOUTH LITERACY (21)
GPI YOUTH LITERACY (21)
(PY)PARAGUAY
BASICINFORMATION
Territory (in thousands km2) 407
Population (in thousands) 6 238
Urbanization (%) 61.4
Population aged 5 to 14 years (%) 22.9
Population aged 15 to 19 years (%) 10.7
GDP per capita (in US dollars PPP) 4 380
Years of compulsory education 9
Adult literacy rate (Pop 15 years and over) 94.6
Youth literacy rate (Pop 15 to 24 years) 98.8
Net enrolment rate in primary education 90.7
Net enrolment rate in secondary education 58.3
Human Development Index (HDI) 0.752
(SR)SURINAME
BASICINFORMATION
Territory (in thousands km2) 163
Population (in thousands) 515
Urbanization (%) 69.4
Population aged 5 to 14 years (%) 19.5
Population aged 15 to 19 years (%) 9.1
GDP per capita (in US dollars PPP) 7 510
Years of compulsory education 6
Adult literacy rate (Pop 15 years and over) 90.7
Youth literacy rate (Pop 15 to 24 years) 95.3
Net enrolment rate in primary education 90.1
Net enrolment rate in secondary education 64.6
Human Development Index (HDI) 0.770

98
INDICATOR(Number of cases)- Regional +
Average- Regional +
Average
HDI (34)
DEMOG GROWTH (2002-2015) (34)
% URBANIZATION (34)
DEMOGRAPHIC DEPENDENCY (34)
POTENTIAL DEMAND (PRIMARY - 5 a 14 years) (34)
POTENTIAL DEMAND (SECONDARY - 15 a 19 years) (34)
GDP PER CAPITA (USD PPP) (34)
GINI COEFICIENT (18)
PREPRIMARY NET ENROLLMENT RATE (26)
GPI PREPRIMARY NET ENROLLMENT RATE (26)
PRIMARY NET INTAKE RATE (25)
GPI PRIMARY NET INTAKE RATE (28)
PRIMARY NET ENROLLMENT RATE (29)
GPI PRIMARY NET ENROLLMENT RATE (29)
SURVIVAL RATE TO LAST GRADE (PRIMARY) (24)
% 1st GRADE REPEATERS (PRIMARY) (27)
SECONDARY NET ENROLLMENT RATE (26)
GPI SECONDARY NET ENROLLMENT RATE (26)
PUBLIC EXPENDIT EDUCATION AS % GDP (24)
PUBLIC EXPEND EDUCATION AS % TOTAL PUBLIC EXPEND (21)
PUPIL/TEACHER (PRIMARY) (31)
PUPIL/TEACHER (SECONDARY) (29)
% TRAINED TEACHERS (PRIMARY) (21)
% TRAINED TEACHERS (SECONDARY) (17)
COMPLETION PRIMARY (15 - 19 years) (23)
GPI COMPLETION PRIMARY (15 - 19 years) (23)
U/R PI COMPLETION PRIMARY (15 - 19 years) (17)
QSUP/QINF PI COMPLETION PRIMARY (15 - 19 years) (18)
NORG/ORG PI COMPLETION PRIMARY (15 - 19 years) (8)
COMPLETION SECONDARY (20 - 24 years) (23)
GPI COMPLETION SECONDARY (20 - 24 years) (23)
U/R PI COMPLETION SECONDARY (20 - 24 years) (16)
U/R PI COMPLETION SECONDARY (20 - 24 years) (18)
NORG/ORG PI COMPLETION SECONDARY (20 - 24 years) (8)
ADULT LITERACY (22)
GPI ADULT LITERACY (22)
YOUTH LITERACY (21)
GPI YOUTH LITERACY (21)
(TT)TRINIDADANDTOBAGO
BASICINFORMATION
Territory (in thousands km2) 5.1
Population (in thousands) 1 333
Urbanization (%) 13.9
Population aged 5 to 14 years (%) 14.3
Population aged 15 to 19 years (%) 9.5
GDP per capita (in US dollars PPP) 21 690
Years of compulsory education 7
Adult literacy rate (Pop 15 years and over) 98.7
Youth literacy rate (Pop 15 to 24 years) 99.5
Net enrolment rate in primary education 95.3
Net enrolment rate in secondary education 73.9
Human Development Index (HDI) 0.833
(SV)ELSALVADOR
BASICINFORMATION
Territory (in thousands km2) 21
Population (in thousands) 6134
Urbanization (%) 60.3
Population aged 5 to 14 years (%) 22.0
Population aged 15 to 19 years (%) 9.8
GDP per capita (in US dollars PPP) 5 590
Years of compulsory education 9
Adult literacy rate (Pop 15 years and over) 84.0
Youth literacy rate (Pop 15 to 24 years) 96.0
Net enrolment rate in primary education 95.6
Net enrolment rate in secondary education 55.0
Human Development Index (HDI) 0.747

99
INDICATOR(Number of cases)- Regional +
Average- Regional +
Average
HDI (34)
DEMOG GROWTH (2002-2015) (34)
% URBANIZATION (34)
DEMOGRAPHIC DEPENDENCY (34)
POTENTIAL DEMAND (PRIMARY - 5 a 14 años) (34)
POTENTIAL DEMAND (SECONDARY - 15 a 19 YEARS) (34)
GDP PER CAPITA (USD PPP) (34)
GINI COEFICIENT (18)
PREPRIMARY NET ENROLLMENT RATE (26)
GPI PREPRIMARY NET ENROLLMENT RATE (26)
PRIMARY NET INTAKE RATE (25)
GPI PRIMARY NET INTAKE RATE (28)
PRIMARY NET ENROLLMENT RATE (29)
GPI PRIMARY NET ENROLLMENT RATE (29)
SURVIVAL RATE TO LAST GRADE (PRIMARY) (24)
% 1st GRADE REPEATERS (PRIMARY) (27)
SECONDARY NET ENROLLMENT RATE (26)
GPI SECONDARY NET ENROLLMENT RATE (26)
PUBLIC EXPENDIT EDUCATION AS % GDP (24)
PUBLIC EXPEND EDUCATION AS % TOTAL PUBLIC EXPEND (21)
PUPIL/TEACHER (PRIMARY) (31)
PUPIL/TEACHER (SECONDARY) (29)
% TRAINED TEACHERS (PRIMARY) (21)
% TRAINED TEACHERS (SECONDARY) (17)
COMPLETION PRIMARY (15 - 19 years) (23)
GPI COMPLETION PRIMARY (15 - 19 years) (23)
U/R PI COMPLETION PRIMARY (15 - 19 years) (17)
QSUP/QINF PI COMPLETION PRIMARY (15 - 19 years) (18)
NORG/ORG PI COMPLETION PRIMARY (15 - 19 years) (8)
COMPLETION SECONDARY (20 - 24 years) (23)
GPI COMPLETION SECONDARY (20 - 24 years) (23)
U/R PI COMPLETION SECONDARY (20 - 24 years) (16)
U/R PI COMPLETION SECONDARY (20 - 24 years) (18)
NORG/ORG PI COMPLETION SECONDARY (20 - 24 years) (8)
ADULT LITERACY (22)
GPI ADULT LITERACY (22)
YOUTH LITERACY (21)
GPI YOUTH LITERACY (21)
(US)USA
BASICINFORMATION
Territory (in thousands km2) 9 629
Population (in thousands) 304 060
Urbanization (%) 81.0
Population aged 5 to 14 years (%) 13.6
Population aged 15 to 19 years (%) 7.3
GDP per capita (in US dollars PPP) 45 850
Years of compulsory education 12
Adult literacy rate (Pop 15 years and over) …
Youth literacy rate (Pop 15 to 24 years) …
Net enrolment rate in primary education 92.7
Net enrolment rate in secondary education 88.2
Human Development Index (HDI) 0.950
(UY)URUGUAY
BASICINFORMATION
Territory (in thousands km2) 176
Population (in thousands) 3 334
Urbanization (%) 92.41
Population aged 5 to 14 years (%) 15.8
Population aged 15 to 19 years (%) 7.8
GDP per capita (in US dollars PPP) 11 040
Years of compulsory education 10
Adult literacy rate (Pop 15 years and over) 97.9
Youth literacy rate (Pop 15 to 24 years) 98.8
Net enrolment rate in primary education 97.8
Net enrolment rate in secondary education 67.7
Human Development Index (HDI) 0.859
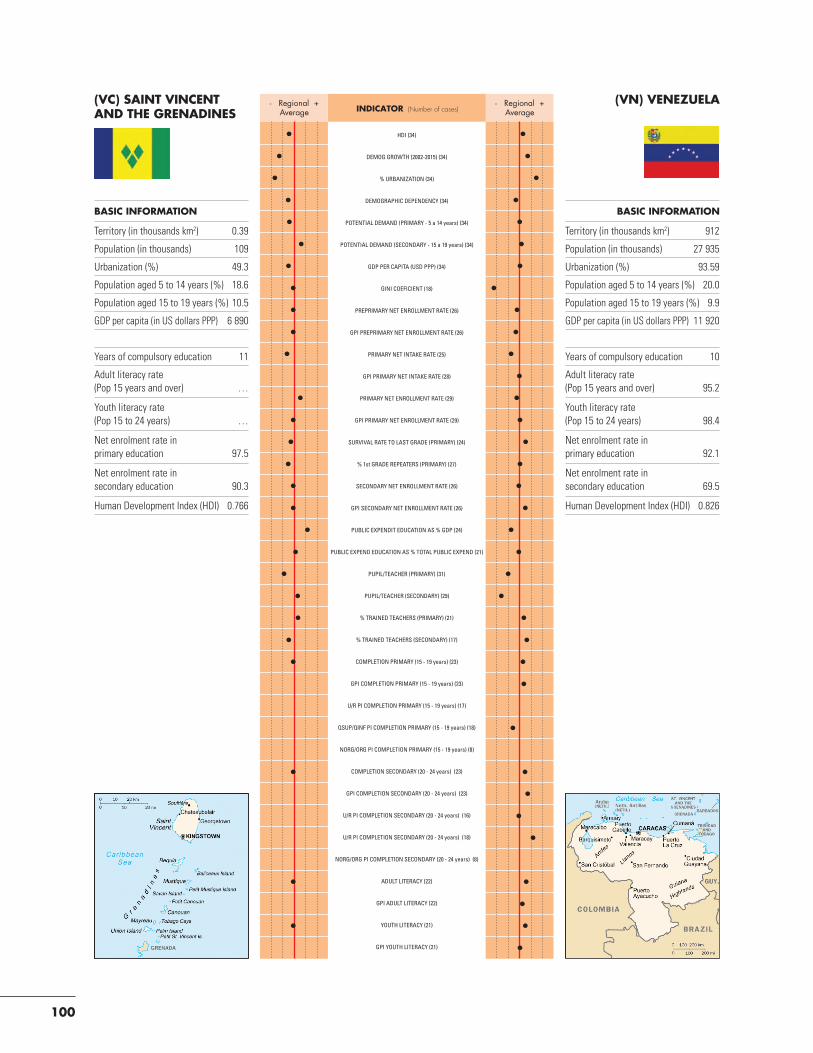
100
INDICATOR(Number of cases)- Regional +
Average- Regional +
Average
HDI (34)
DEMOG GROWTH (2002-2015) (34)
% URBANIZATION (34)
DEMOGRAPHIC DEPENDENCY (34)
POTENTIAL DEMAND (PRIMARY - 5 a 14 years) (34)
POTENTIAL DEMAND (SECONDARY - 15 a 19 years) (34)
GDP PER CAPITA (USD PPP) (34)
GINI COEFICIENT (18)
PREPRIMARY NET ENROLLMENT RATE (26)
GPI PREPRIMARY NET ENROLLMENT RATE (26)
PRIMARY NET INTAKE RATE (25)
GPI PRIMARY NET INTAKE RATE (28)
PRIMARY NET ENROLLMENT RATE (29)
GPI PRIMARY NET ENROLLMENT RATE (29)
SURVIVAL RATE TO LAST GRADE (PRIMARY) (24)
% 1st GRADE REPEATERS (PRIMARY) (27)
SECONDARY NET ENROLLMENT RATE (26)
GPI SECONDARY NET ENROLLMENT RATE (26)
PUBLIC EXPENDIT EDUCATION AS % GDP (24)
PUBLIC EXPEND EDUCATION AS % TOTAL PUBLIC EXPEND (21)
PUPIL/TEACHER (PRIMARY) (31)
PUPIL/TEACHER (SECONDARY) (29)
% TRAINED TEACHERS (PRIMARY) (21)
% TRAINED TEACHERS (SECONDARY) (17)
COMPLETION PRIMARY (15 - 19 years) (23)
GPI COMPLETION PRIMARY (15 - 19 years) (23)
U/R PI COMPLETION PRIMARY (15 - 19 years) (17)
QSUP/QINF PI COMPLETION PRIMARY (15 - 19 years) (18)
NORG/ORG PI COMPLETION PRIMARY (15 - 19 years) (8)
COMPLETION SECONDARY (20 - 24 years) (23)
GPI COMPLETION SECONDARY (20 - 24 years) (23)
U/R PI COMPLETION SECONDARY (20 - 24 years) (16)
U/R PI COMPLETION SECONDARY (20 - 24 years) (18)
NORG/ORG PI COMPLETION SECONDARY (20 - 24 years) (8)
ADULT LITERACY (22)
GPI ADULT LITERACY (22)
YOUTH LITERACY (21)
GPI YOUTH LITERACY (21)
(VN)VENEZUELA
BASICINFORMATION
Territory (in thousands km2) 912
Population (in thousands) 27 935
Urbanization (%) 93.59
Population aged 5 to 14 years (%) 20.0
Population aged 15 to 19 years (%) 9.9
GDP per capita (in US dollars PPP) 11 920
Years of compulsory education 10
Adult literacy rate (Pop 15 years and over) 95.2
Youth literacy rate (Pop 15 to 24 years) 98.4
Net enrolment rate in primary education 92.1
Net enrolment rate in secondary education 69.5
Human Development Index (HDI) 0.826
(VC)SAINTVINCENTANDTHEGRENADINES
BASICINFORMATION
Territory (in thousands km2) 0.39
Population (in thousands) 109
Urbanization (%) 49.3
Population aged 5 to 14 years (%) 18.6
Population aged 15 to 19 years (%) 10.5
GDP per capita (in US dollars PPP) 6 890
Years of compulsory education 11
Adult literacy rate (Pop 15 years and over) …
Youth literacy rate (Pop 15 to 24 years) …
Net enrolment rate in primary education 97.5
Net enrolment rate in secondary education 90.3
Human Development Index (HDI) 0.766

101
B. ReadeR’s guide37
RefeRence peRiod
The reference period for the educational and financial data presented is the academic or fiscal year ending in 2008, or the most recent year available within the 2005-2007 period. Where historical comparisons are presented, the reference period for the data is the academic year ending in 2000 or data that were available for the 2001 or 1999 school year.
Literacy indicators are based on the most recent data available within the 2005-2008 period.
Where a given reference period is spread across two calendar years, the later year is cited. For example, the school year 2007/08 is presented as 2008.
The reference period for data that comes from the Human Development Report 2009 or the EFA Global Monitoring Report 2010 is 2007.
data souRces
a) education
Literacy, finance and enrolment data come from the international database on education maintained by the UNESCO Institute for Statistics (UIS). For more information on the data disseminated by the UIS, please consult the GED reader’s guide at:
http://www.uis.unesco.org/ev.php?URL_ID=5456&URL_DO=DO_TOPIC&URL_SECTION=201
The socioeconomic data used for completion rates and parity indices are from household surveys conducted and processed by the Economic Commission for Latin America and the Caribbean (ECLAC), which observes UNESCO international educational standards.
Some of the results from the Second Regional Comparative and Explicative Study (Spanish acronym: SERCE) are presented.
Other sources used for specific purposes are: The UNDP Human Development Report 2009, the EFA Global Monitoring Report 2010 and the World Bank 2010 World Development Indicators Online Database.
37 ∗ This reader’s guide is presented the same format and, in some cases, contains the same information as the reader’s guide in Global Education Digest 2009, an annual publication of the UNESCO Institute for Statistics (UIS).

102
All the data presented in these publications has been processed according to the International Standard Classification of Education (ISCED 97).
2. population
Population data are based on the United Nations Population Division (UNPD) 2008. Revision, which provides data to the UIS. The UNPD does not provide data by single year of age for countries with total populations of under 100,000. Where UNPD estimates are not available, national data or UIS estimates are used. For more information on UNPD estimates, please visit: http://www.un.org/esa/population/unpop.htm
technical notes
1. international standard classification of education (isced 97)
In order to ensure the feasibility of international comparisons, UNESCO uses the International Standard Classification of Education, ISCED (1997). This classification is used to define the educational levels referred to in this report, since the countries have adapted their educational systems to be compatible with the ISCED 97. The information used to adapt national education systems to the ISCED is provided by the countries in the ISCED questionnaire of the UIS. The purpose of this adaptation of national education systems is to permit statistical reporting to the international database maintained by UIS. The data reporting is done through UIS questionnaires or joint UNESCO-OECD-EUROSTAT (UOE) questionnaires. For more information on ISCED 97, please visit: http://www.uis.unesco.org/ev_en.php?ID=7433_201&ID2=DO_TOPIC
2. education data and indicators
In order to ensure comparability, we have used the indicators and calculation methods of the UIS, following the accepted international standards set forth in the Education Indicators Technical Guidelines. The guide is available online at: http://www.uis.unesco.org/ev.php?ID=5202_201&ID2=DO_TOPIC
We have also drawn on the indicators and calculation methods of the Regional Education Indicators Project (Spanish acronym: PRIE) of the Summit of the Americas. The 2009 guide ‘’Methodology for Building and Use’’ can be accessed online at:
http://portal.oas.org/Portal/Topic/SEDI/Educaci%C3%B3nyCultura/PRIE/Documentos/tabid/1380/language/es-CO/default.aspx
Tables and graphs show the information available for each indicator used. Thus, not all countries appear in all tables and graphs.
The regional averages of the indicators used in this report are simple averages of the values reported in each case.
Bolivia: Caution is advised when interpreting indicators that use household survey data for Bolivia. These data could have significant differences in the numerator in future years, due to changes in the national information system.
3. educational attainment indicators
Educational attainment data are presented by ISCED level. The data presented refer to the percentage of the 25+-year-old population that has completed whatever education level is being shown. These data come from
103
household surveys. As data from sample-based surveys are subject to sampling error, caution is advised when interpreting differences smaller than 5%.
The reference period for these data is the most recent year available. The period varies within the 2000-2007 period for the countries discussed.
4. ethnicity categories
Bolivia: Indigenous includes: Quechua, Aymara, Guarani and other indigenous groups. Non-indigenous includes: Spanish origin, foreigners and other.
Brazil: Indigenous includes: black or mixed race. Non-indigenous includes: white and other.
Chile: Indigenous includes: indigenous population. Non-indigenous includes: non-indigenous population.
Ecuador: Indigenous includes: indigenous population. Non-indigenous includes: white, mestizo, black or other.
Guatemala: Indigenous includes: indigenous population. Non-indigenous includes: non-indigenous population.
Nicaragua: Indigenous includes: Miskito, Mayagna, Sumo. Non-indigenous includes: Spanish, English and other origin.
Panama: Indigenous includes: indigenous population. Non-indigenous includes: non-indigenous population..
Paraguay: Indigenous includes: exclusively Guarani-speaking. Non-indigenous includes: Spanish-speaking, Guarani/Spanish bilingual and speakers of other languages.


105
c. pRoficiency levels in the seRce study 38
This appendix provides descriptions of the proficiency levels used in each category and at each level evaluated in the SERCE study.
c.1. Reading pRoficiency levels
Based on a combination of psychometric, empirical, discipline-specific and pedagogical criteria, four levels of proficiency were established for each grade level at which reading was evaluated. Each involves a set of tasks that allow evaluators to identify groups of students with similar performance. The tasks selected are based on the level of cognitive complexity and content that they evaluate, and on the difficulty that they pose for students. One would obviously expect the most difficult tasks to be those that, from a pedagogical point of view, are cognitively more complex or involve contents that are less familiar to students at the grade level in question.
Tables C.1 and C.2 present these levels from the most complex to the simplest, as well as their respective cut-off points (first column), the areas covered (second column) and the processes involved (third column).
38 See: UNESCO/OREALC/LLECE (2008), Los Aprendizajes de los Estudiantes de América Latina y El Caribe. Primer reporte de los resultados del Segundo Estudio Regional Comparativo y Explicativo (SERCE), UNESCO, Santiago, Chile.

106
Table C.1. Description of the performance levels of students from the 3rd grade of primary in Reading. SERCE study.
level
Cut-off point
area: Reading processes: Reading
Extension Class and Genre General Specific Descriptive Texts Meta-linguistics
The student shows that he/she can read:
The student shows that he/she can read:
The student shows that he/shehas the ability to:
The student shows that he/she has the has the ability to recognise:
The student shows that he/she knows:
IV
637.49
• Two related texts
• Descriptions: dual-entry tables and diagrams with three elements
• Explanations: from the natural sciences
• Plots: commercials
• Integrate and generalise information given in a paragraph or in verbal and graphic codes
• Replace non-explicit information
• Read a text and identify new information
• Translate from one code to another (from numerical to verbal, from verbal to graphic)
• The implicit moral of a story• The implicit topic of a picture
story • The protagonist, based on the
cover of a story book• The link between sub-topics
and sub-sub-topics in the description
• The adjectives of persuasion in an argument
• The clarifying function of questions and comparisons in an explanation
• The meaning of “picture”, the definition of “riddle”
• The purpose of an explanatory appeal
• That a title provides a summary
• The meaning of words that have several definitions, based on knowledge of the language
III
552.14
• Relatively long texts (up to seven paragraphs)
• Sequenced drawings (up to four)
• Descriptions with sub-topics: encyclopaedic and journalistic (news) texts
• Narrations: picture stories
• Locate information and distinguish it from adjacent information
• Interpret reformulations that synthesise several pieces of data
• Infer information based on knowledge about the world
• Discern the meaning of words that have several meanings, based on the text
• The format and intent of a news piece
• Secondary characters, character attributes, story line, author and explicit causes in a linear story
• The order of the actions in a picture story
• The function of font size in a poster
• The meaning of the concepts “news”, “intention”, “storyline”, “author”, “paragraph” and “narration”
II
461.32
• Paragraphs (up to four)
• Short lists (up to two)
• Narrations: stories with a beginning, middle and end
• Instructions: recipes and posters
• Descriptions of a topic: riddle
• Locate information in a brief text that must not be distinguished from other conceptually similar information
• Discern words with a single meaning
• Recognise simple sentence reformulations
• Recognise redundancies between graphic and verbal codes
• In a linear story, the protagonist and character design
• The purpose of a recipe; the topic of a poster
• The attributes of an object described
• The meaning of the concepts “solving the riddle”, “title”, “recipe” and “instructions”
• The function of the phrase “Once upon a time”
I
367.36
• Words• Sentences• Images in a
picture
• Locate different pieces of information with a single meaning in a prominent part of the text, repeated literally or synonymously, and isolated from other information.
• The sender of a letter• The explicit causes and ending
of a picture story
• The meaning of the concepts of “letter” and “story”

107
Table C.2. Description of the performance levels of students from the 6th grade of primary in Reading. SERCE study.
level
Cut-off point
areas: Reading processes: Reading
Extension Class and genre General In relation to specific texts Meta-linguistic
The student shows that he/she can read:
The student shows that he/she can read:
The student shows that he/she has the ability to:
The student shows that he/shecan recognise:
The student shows that he/she knows:
IV
593.59
• Longer texts (a lengthy text and summary) with many relationships
• Descriptions: poems
• Arguments: letters with two arguments
• Narrations: complex journalistic articles
• Integrate, rank and generalise information distributed throughout a text
• Establish equivalences among more than two codes (verbal, numerical and graphic)
• Reinstate implicit information associated with the entire text
• Recognise the possible meanings of technical terms or figurative language
• Distinguish different tenses and nuances (certainty, doubt) used in a text
• The versions of the facts and causes in an historical account and the function of title, photo caption and image
• Definite and hypothetical information in a news piece, and the most important occurrence
• The persuasive intent and thesis of a letter
• The summary that corresponds to the informative rank of the description
• Personification and metaphor in texts with poetic figures
• The meaning of “diagram”, “topic”, “order of information”, “headline”, “textual expansion”, and “version”
• The content of encyclopaedias; the persuasive function
• The function of the title and text on the back cover of a book
• The explanatory function of parentheses and dashes
III
513.66
• Two related texts
• Dense paragraphs
• Lists of up to seven complex elements
• Medium-length texts (up to two paragraphs)
• Descriptions: of the social sciences, dual-entry comparative charts and diagrams with three elements
• Instructions: recipes
• Narrations: stories with a “psychological” conflict, tales with two protagonists and an implicit moral, both with dialogue
• Locate information and separate it from other nearby information
• Interpret reformulations and synthesis
• Integrate data distributed throughout a paragraph
• Reinstate implicit information in the paragraph
• Re-read in search of specific data
• Identify a single meaning in words that have several meanings
• Recognise the meaning of parts of words (affixes) using the text as a reference
• The implicit characteristics and desires of the characters in psychological stories
• The conflict in a legend• The explicit topic or sub-topic,
an implicit assessment and the informative purpose of descriptive texts
• The location of the ingredients and the function of numbering of steps in a recipe
• The content that one can anticipate encountering, based on the cover of a story book
• The meaning of “description”, “instruction”, “purpose”, “narrator”, “paragraph”, “sentence”, “conflict”, “realist” and “tale”, and some common connectors
• The purpose of suffixes and prefixes, exclamation points and pronouns
• The form of illustration
II
424.54
• Front and back covers of books with graphic and verbal codes
• Short texts (up to five paragraphs)
• Legends, historical stories
• Descriptions of the natural sciences
• Locate information in the middle of a text that must be distinguished from a different piece of information found in a different segment
• Integrate information on what is said and illustrated
• Identify words with a single meaning
• The intentions of the characters and explicit phenomena explained in a linear legend or story
• The explicit causes in a historical narrative
• The addressee of a letter • The support material on the
back cover of a book
• The meaning of the concept “explanation”
I
299.59
• Words• Sentences• Paragraphs• Brief texts
(up to four paragraphs)
• Narrations: stories• Descriptions:
encyclopaedia
• Locate information with a single meaning in a prominent or central part of a text (beginning or end), that is repeated literally or synonymously and is isolated from other information
• The protagonist and explicit author in a linear story
• An attribute of a being described
• A catalyzing incident in an historical account
• The informative function of a news piece
• The meanings of the concepts “author”, “news” and “information”

108
c.2. pRoficiency levels in MatheMatics
Student performance in mathematics is grouped in four levels for each grade. The levels correspond to categories of tasks that allow evaluators to group students with similar performance profiles on the tests. A student whose results place him or her at a given level has demonstrated the skills needed to carry out the activities proposed for that level and the preceding ones with a high probability of success. The main purpose of identifying the levels is to facilitate the process of describing students’ capabilities. A combination of empirical, discipline-specific and pedagogical criteria is used for the purpose.
The first columns of the following tables (C.3 and C.4) indicate the proficiency levels. The second column provides a general description of each level. The last column provides an example.
Table C.3. Description of the performance levels of students from the 3rd grade of primary in Mathematics. SERCE study.
level
Cut-off point
description examples of specific skills
IV
621.68
• Students identify an element in a two-dimensional plane and the properties of the sides of a square or rectangle to solve a problem.
• Students solve multiplication problems involving one unknown or that require making use of equivalency between the usual measurements of length.
• Students recognise the rule governing the formation of a numerical sequence and identify the component.
• Students identify the component of the rule governing the formation of an additive sequence in the field of natural four digit numbers.
• Students can solve a problem that requires addition and subtraction of natural numbers.
• Students can solve a problem that involves identifying the congruency of the sides of a square and division of a length by a number.
III
558.54
• Students identify elements of unusual geometric figures and interpret the different types of figures for extracting information and solving problems using the data.
• Students solve multiplication problems or addition problems that involve an equation or require two operations.
• Students solve addition problems using units of measure and their equivalents, or problems that include common fractions.
• Students recognise the rule governing a graphic sequence or additive numerical sequence and can continue it.
• Students can identify unusual geometric figures with more than four sides.
• Students can identify equivalencies between common measures of length: meter and centimetre.
• Students can solve a problem that requires subtracting with a sense of complement.
• Students can solve a problem that requires division with equitable distribution and a zero remainder among natural numbers.
• Students can solve problems that involve interpreting a bar chart or pictogram to extract and use data.
• Students can solve a measurement problem that includes the fraction 1/2.
II
489.01
• Students recognise the decimal and positional organisation of the numbering system and the elements of geometric figures.
• Students identify a path on a map and the most appropriate unit of measure for measuring an attribute of a known object.
• Students interpret charts and figures in order to extract and compare data.
• Students solve addition or multiplication problems involving proportions in the field of natural numbers.
• Students compose three digit numbers, identifying units, tens and hundreds.
• Students identify a drawing of a cube in a set of geometric figures.• Students identify the unit for measuring the length of a known
object.• Students interpret information presented in a double-entry table. • Students can solve a problem that involves adding that involves
addition in the sense of “adding”)) in a field of three-digit natural numbers.
• Students solve a problem that requires multiplying with a sense of proportionality among natural numbers.
I391.50
• Students recognise the relationship in the order between natural numbers and common two-dimensional geometric figures in simple drawings.
• Students locate relative positions of an object in a spatial representation.
• Students interpret charts and figures in order to extract direct information.
• Students recognise the largest number in a set of three-digit natural numbers.
• Students recognise triangles and circles.• Students interpret direct information from a bar chart.

109
Table C.4. Description of the performance levels of students from the 6th grade of primary in Mathematics. SERCE study.
level description examples of specific skills
IV
624.60
• Students find averages and do calculations using the four basic operations in the field of natural numbers.
• Students identify paralleIism and perpendicularity in a real situation, and graphic representations of a percentage.
• Students solve problems involving properties of angles, triangles and quadrilaterals as part of different shapes, or involving operations with two decimal numbers.
• Students solve problems involving fractions.• Students make generalisations in order to continue a complex
graphic sequence pattern.
• Students identify perpendicular streets on a city map.• Students solve a problem that involves calculating the interior
angle of a triangle when the other two are known.• Students can solve a problem that involves the concept of a
fraction of a whole, and equal distribution.• Students solve a problem that involves calculating the average
of five numbers.• Students identify the pattern of, and can continue, a complex
graphic sequence.
III
514.41
• Students compare fractions, and use the concept of percentages when analysing information and solving problems that require this type of calculation.
• Students identify parallelism and perpendicularity in a plane, as well as bodies and their elements without the benefit of graphic support.
• Students solve problems that require interpreting the constituent elements of a division or equivalent measures.
• Students recognise central angles and commonly used geometrical shapes, such as circles, and use their properties to solve problems.
• Students solve problems involving areas and perimeters of triangles and quadrilaterals.
• Students make generalisations in order to continue a graphic sequence or find the numerical sequence rule that applies to a relatively complex pattern.
• Students can compare fractions with a denominator equal to one.
• Students can recognise perpendicular lines on a map.• Students can solve a problem that requires calculating
durations.• Students solve a problem that involves division, and focus on
the result. • Students solve a problem that involves calculating the
perimeter of a quadrilateral.• Students can solve a problem that requires calculating a
percentage.• Students can identify specific geometrical shapes based on
their properties.• Students can identify the pattern of a graphic sequence that
involves a relatively complex pattern, and continue it.
II
413.58
• Students can analyse and identify the structure of the positional decimal number system, and estimate weight (mass) in units consistent with the attribute being measured.
• Students recognise commonly used geometrical shapes and their properties in order to solve problems.
• Students interpret, compare and work with information presented through various graphic images.
• Students identify the regularity of a sequence with a simple pattern.
• Students solve addition problems in different numerical fields (natural numbers, decimals) including commonly used fractions or equivalent measures.
• Students solve multiplication or division problems, or two natural number operations, or operations that include relations of direct proportionality.
• Students interpret the information in a table and use the data obtained.
• Students interpret and compare information from a dual-entry chart.
• Students identify the pattern of a simple multiplicative sequence and continue it.
• Students solve a problem that involves subtracting from decimal expressions that involve hundredths and using equivalencies between meters and centimetres.
• Students solve a problem that requires division of natural numbers.
• Students solve a problem that involves two operations: addition and multiplication of natural numbers.
• Students solve a problem that involves the notions of halves and quarters.
• Students recognise the congruency of the sides of a square and a rectangle in order to solve a problem.
I
309.64
• Students arrange natural numbers (up to 5 digits) and decimals (up to thousandths) in sequence.
• Students recognise common geometrical shapes and the unit appropriate to the attribute being measured.
• Students interpret information presented in graphic images in order to compare it and change it to a different form of representation.
• Students solve problems involving a single addition using natural numbers.
• Students interpret direct information from a pie chart.• Students interpret direct information from a bar chart.• Students compare decimal expressions at the hundredths level
in order to identify the smallest ones.• Students solve a problem with explicit data, using a solution
strategy based on subtraction to calculate the complement in a field of three-digit natural numbers.
c.3. science pRoficiency levels
These proficiency levels correspond to sets of tasks that allow graders to identify groups of students with similar test results. The purposes of establishing categories for levels of performance include presenting test findings from a pedagogical perspective, showing what students are doing in each case, and interpreting the findings in such a way as to help improve the quality of the educational process. Psychometric or quantitative, as well as pedagogical/discipline-specific or qualitative criteria, were combined to establish the categories.
Four levels of performance were established for the sciences. They are organised with a view to the ages of the students, the contributions of research on the teaching of science, and findings from the psychology of

110
learning. Table C.5 provides a general description of each level of performance for sixth-graders, as well as some specific examples.
Table C.5. Description of the performance levels of students from the 6th grade of primary in Sciences. SERCE study.
level description specific examples
IV
• At this level, students use and transfer scientific knowledge involving a high degree of formalisation and abstraction to diverse types of situations.
• Students are capable of identifying the scientific knowledge involved in a problem at hand. The problems are more formally stated and may relate to aspects, dimensions or analyses that are detached from the immediate setting
• Students interpret information presented in more complex tables than those used at lower levels, and with more variables.
• Students detect patterns in order to classify and describe phenomena.• Students name changes of state, recognising the reversibility of the processes
involved, and identifying the changes of state that are most present in everyday life.
• Students recognise manifestations of different forms of energy in everyday life.• Students use knowledge of human health to interpret simple data such as blood
test results.• Students interpret simple optical phenomena to explain shadows.• Students use explanatory models.
III
• At this level, students explain everyday situations on the basis of scientific evidence, use simple descriptive models to interpret natural phenomena, and draw conclusions from a description of experimental activities.
• Students explain the phenomena of day and night, and orient themselves in relation to the sun.
• Students recognise changes of state and the reversibility of the processes involved, as well as the conservation of mass and volume.
• Students recognise sources of energy and transformations of energy as well as their applications in the home and in everyday life.
• Students differentiate physical and chemical phenomena.• Students recognise an electrical circuit and its parts, the role of a battery, and
conductive and non-conductive materials.• Students recognise variables and the incidence of one or two variables in a
situation.• Students analyse experimental situations and state the question that a situation
presented in a text answers.• Students use simple explanatory models.
II
• Students apply school-acquired scientific knowledge, they compare, organise and interpret information, they identify causal relationships and they classify living beings in accord with a criterion
• Students access and discuss information presented in various formats (tables, charts, graphs, pictures).
• Students identify criteria for classifying living beings and the use of taxonomies.• Students establish food relationships among living things.• Students identify a simple trophic chain.• Students interpret and compare information presented in texts, graphs, data
tables and figures.• Students analyse the results of simple experiments and draw conclusions.• Students recognise the states of matter and their characteristics.
I
• Students relate scientific knowledge to daily situations that are common in their surroundings.
• Students are capable of explaining their immediate world based on their own observations and experiences and establish a simple and lineal relation with previously acquired scientific knowledge.
• Students describe simple, concrete events involving cognitive processes such as remembering and identifying.
• Students use knowledge in familiar or everyday situations. • Students demonstrate knowledge and attitudes conducive to promoting healthy
living habits with a strong impact on personal and social life.• Students can differentiate plants from animals.

111
d. pRoficiency levels in the pisa study
This appendix provides descriptions of the proficiency levels applying to each category and level evaluated by the PISA study.
Table D.1. Description of the performance levels of students in Reading. PISA study.39
proficency levels
in reading: what are students able to do?
5
Locate and perhaps sequence or combine multiple pieces of deeply embedded information, some of which may be outside the main body of text. Infer which information in the text is relevant to the task. Deal with highly plausible and/or extensive compe-ting information. Either construe the meaning of nuanced language or demonstrate a full and detailed understanding of a text. Critically evaluate or hypothesise, drawing on specialised knowledge. Deal with concepts that are contrary to expectations, and draw on a deep understanding of long or complex texts.
Continuous texts: negotiate texts whose discourse structure is not obvious or clearly marked, in order to discern the relations-hip of specific parts of the text to its implicit theme or intention.
Non-continuous texts: Identify patterns among many pieces of information presented in a display which may be long and detailed, sometimes by referring to information external to the display. The reader may need to realise independently that a full understanding of a section of text requires referring to a separate part of the same document, such as a footnote.
4
Locate and perhaps sequence or combine multiple pieces of embedded information, each of which may need to meet multiple criteria, in a text with an unfamiliar context or form. Infer which information in the text is relevant to the task. Use a high level of text-based inference to understand and apply categories in an unfamiliar context, and to construe the meaning of a section of text by considering the text as a whole. Deal with ambiguities, ideas that are contrary to expectation and ideas that are negati-vely worded. Use formal or public knowledge to hypothesise about or critically evaluate a text. Show accurate understanding of long or complex texts.
Continuous texts: Follow linguistic or thematic links over several paragraphs, often in the absence of clear discourse markers, in order to locate, interpret or evaluate embedded information, or to infer psychological or metaphysical meaning.
Non-continuous texts: Scan a long, detailed text in order to find relevant information, often with little or no assistance from organisers such as labels or special formatting, and locate different pieces of information to be compared or combined.
3
Locate, and in some cases recognise, the relationship between pieces of information, each of which may need to meet multiple criteria. Deal with prominent competing information. Integrate several parts of a text in order to identify a main idea, understand a relationship or construe the meaning of a word or phrase. Compare, contrast or categorise, taking many criteria into account. Deal with competing information. Make connections or comparisons, give explanations, or evaluate a feature of a text. Demons-trate a detailed understanding of the text in relation to familiar, everyday knowledge, or draw on less common knowledge.
Continuous texts: Use conventions of text organisation, where present, and follow implicit or explicit logical links such as cause and effect relationships across sentences or paragraphs in order to locate, interpret or evaluate information.
Non-continuous texts: consider one display in the light of a second, separate document or display, possibly in a different format, or combine several pieces of spatial, verbal and numerical information in a graph or map to draw conclusions about the information represented.
39 PISA (2006), Assessing scientific, reading and mathematical literacy: A framework for PISA 2006. OECD.

112
2
Locate one or more pieces of information, each of which may need to meet multiple criteria. Deal with competing information. Identify the main idea in a text, understand relationships, form or apply simple categories, or construe meaning within a limited part of the text when the information is not prominent and low-level inferences are required. Make a comparison or connections between the text and outside knowledge, or explain a feature of the text by drawing on personal experience and attitudes.
Continuous texts: Follow logical and linguistic connections within a paragraph in order to locate or interpret information; or synthesise information across texts or parts of a text in order to infer the author’s purpose.
Non-continuous texts: demonstrate a grasp of the underlying structure of a visual display such as a simple tree diagram or table, or combine two pieces of information from a graph or table.
1
Locate one or more independent pieces of explicitly stated information, typically meeting a single criterion, with little or no competing information in the text. Recognise the main theme or author’s purpose in a text about a familiar topic, when the required information in the text is prominent. make a simple connection between information in the text and common, everyday knowledge.
Continuous texts: Use redundancy, paragraph headings or common print conventions to form an impression of the main idea of a text, or to locate information stated explicitly within a short section of text.
Non-continuous texts: Focus on discrete pieces of information, usually within a single display such as a simple map, a line graph or a bar graph, that presents only a small amount of information in a straightforward way, and verbal sections of text being limited to a small number of words or phrases.
Table D.2. Description of the performance levels of students in Mathematics. PISA study.40
proficiency levels in mathematics: what are students able to do?
6
At Level 6, students can conceptualise, generalise, and utilise information based on their investigations and modelling of complex problem situations. They can link different information sources and representations and flexibly translate among them. Students at this level are capable of advanced mathematical thinking and reasoning. These students can apply their insight and understanding, and have a mastery of symbolic and formal mathematical operations and relationships that allows them to develop new approaches and strategies for novel situations. Students at this level can formulate and accurately communicate their action and thinking as these relate to their findings, interpretations, arguments, and the applicability of these to the original situations posed.
5
At Level 5, students can develop and work with models for complex situations, identifying constraints and specifying assumptio-ns. They can select, compare, and evaluate appropriate problem-solving strategies for dealing with complex problems related to these models. Students at this level can work strategically, using broad, well-developed thinking and reasoning skills, appropriate related representations, symbolic and formal characterisations, and insight into the situations posed. They can reflect on their actions and formulate and communicate their interpretations and reasoning.
4
At Level 4, students can work effectively with explicit models for complex concrete situations that may involve constraints or call for making assumptions. They can select and integrate different representations, including symbolic ones, linking them directly to aspects of real-world situations. Students at this level have and can use well-developed skills and can reason flexibly, with some insight, in these contexts. They can construct and communicate explanations and arguments based on their interpretations, arguments, and actions.
3At Level 3, students can execute clearly described procedures, including those that require sequential decisions. They can select and apply simple problem-solving strategies, and they can interpret and use representations based on different information sour-ces, and reason directly from them. They can develop short communications reporting their interpretations, results and reasoning.
2
At Level 2, students can interpret and recognise situations in contexts that require no more than direct inference. They can extract relevant information from a single source and make use of a single representational mode. Students at this level can employ basic algorithms, formulas, procedures and conventions. They are capable of direct reasoning and of making literal interpretations of their results.
1At Level 1, students can answer questions involving familiar contexts where all relevant information is present and the questions are clearly defined. They are able to identify information and to carry out routine procedures following direct instructions in explicit situations. They can perform actions that are obvious and follow immediately from the stimuli provided.
40 See PISA (2009), Assessment Framework. Key competencies in reading, mathematics and science. OECD.

113
Table D.3. Description of the performance levels of students in Science. PISA study.41
proficiency levels in science: what are students able to do?
6
At Level 6, students can consistently identify, explain and apply scientific knowledge, as well as knowledge about science, in a variety of complex life situations. They can link different information sources and explanations, and use evidence from those sources to justify decisions. They clearly and consistently demonstrate advanced scientific thinking and reasoning, and they use their scientific understanding in support of solutions to unfamiliar scientific and technological situations. Students at this level can use scientific knowledge and develop arguments in support of recommendations and decisions relating to personal, social or global situations.
5
At Level 5, students can identify the scientific components of many complex life situations, apply both scientific concepts and knowledge about science to these situations, and compare, select and evaluate appropriate scientific evidence for responding to life situations. Students at this level have and can use well-developed abilities of inquiry, relate knowledge appropriately and bring critical insight to situations. They can construct explanations based on evidence, and build arguments based on critical analysis.
4
At Level 4, students can work effectively with situations and issues that may involve explicit phenomena requiring them to make inferences about the role of science or technology. They can select and integrate explanations from different scientific or technological disciplines, and relate those explanations directly to aspects of life situations. Students at this level can reflect on their actions, and they can communicate decisions using scientific knowledge and evidence.
3
At Level 3, students can identify clearly described scientific issues in a range of contexts. They can select facts and knowledge to explain phenomena, and apply simple models or strategies of inquiry. Students at this level can interpret and use scientific concepts from different disciplines and can apply them directly. They can make short statements using facts, and make decisions based on scientific knowledge.
2At Level 2, students have scientific knowledge that is adequate to provide possible explanations in familiar contexts or to draw conclusions based on simple investigations. They are capable of direct reasoning and of making literal interpretations of the results of scientific inquiry or technological problem-solving.
1 At Level 1, students have such limited scientific knowledge that it can only be applied to a small number of familiar situations. They can present scientific explanations that are obvious and follow explicitly from given evidence.
41 PISA (2009), Assessment Framwork. Key competencies in reading, mathematics and science. OECD.


115
The following symbols are used in the table:
… no data available
* national estimation
** uis estimation
. Not applicable
-n Data refer to the school or financial year (or period) n prior to the reference year or period.
e. data taBles

116
Table 1a: Primary education / ISCED 1 / Enrolment, new entrants and repeaters. 2008.
Regi
on
ID
Educ
atio
n sy
stem
Pr
imar
y (IS
CED
1)
Enro
lmen
t (IS
CED
1)
Adj
uste
d ne
t en
rolm
ent
rate
pr
imar
y ed
ucat
ion
(ISCE
D 1
)
2008
2000
2008
Coun
try
Entr
ance
ag
e
Dur
atio
n
MF
% F
MF
F GPI
MF
F GPI
(1) (2) (3) (4) (5) (6) (7) (8) (9) (10)
OAS Member States
Antigua and Barbuda AG 5 7 11 569 -1 48.9 -1 … … … 74.0 *.-1 73.4 *.-1 0.98 *.-1
Argentina AG 6 6 4 685 696 -2 48.8 -2 … … … 99.1 -3 … …
Bahamas BS 5 6 37 122 -1 49.1 -1 86.4 ** 86.3 ** 1.00 ** 90.8 -1 92.4 -1 1.03 -1
Barbados BB 5 6 22 849 * 49.0 * … … … … … …
Belize BZ 5 6 51 994 48.6 91.6 91.4 1.00 99.7 99.9 1.00
Bolivia BO 6 6 1 512 002 -1 49.0 -1 96.3 96.4 1.00 95.0 -1 95.4 -1 1.01 -1
Brazil BR 7 4 17 996 083 -1 47.2 -1 92.5 … … 93.5 -1 93.5 -1 1.00 -1
Canada CA 6 6 2 305 211 -2 48.6 -2 99.5 ** 99.7 ** 1.00 ** … … …
Chile CH 6 6 1 679 017 -1 47.8 -1 … … … 94.5 -1 94.1 -1 0.99 -1
Colombia CO 6 5 5 285 523 48.8 96.8 ** 96.7 ** 1.00 ** 93.5 93.6 1.00
Costa Rica CR 6 6 534 816 48.4 … … … … … …
Dominica DM 5 7 8 369 48.7 97.4 ** 96.8 ** 0.99 ** 75.6 * 80.0 * 1.12 *
Ecuador EC 6 6 2 039 168 -1 49.0 -1 99.5 … … 99.3 -1 … -1 … -1
El Salvador SV 7 6 993 795 48.2 88.9 1 89.5 1 1.01 1 95.6 96.5 1.02
Grenada GD 5 7 13 873 47.7 83.9 ** 80.6 ** 0.93 ** 98.5 99.0 1.01
Guatemala GT 7 6 2 500 575 48.0 86.7 83.3 0.93 96.4 94.9 0.97
Guyana GY 6 6 107 456 48.8 … … … 98.5 98.5 1.00
Haiti HT 6 6 … … … … … … … …
Honduras HN 6 6 1 276 495 49.0 88.4 88.8 1.01 97.2 98.3 1.02
Jamaica JM 6 6 310 021 -1 49.0 -1 93.2 93.4 1.00 85.5 -1 84.9 -1 0.99 -1
Mexico MX 6 6 14 631 498 -1 48.8 -1 99.4 99.9 1.01 99.4 -1 99.6 -1 1.00 -1
Nicaragua NI 6 6 944 341 48.4 82.7 83.5 1.02 93.4 93.8 1.01
Panama PN 6 6 445 107 48.2 98.8 98.8 1.00 98.9 98.5 0.99
Paraguay PY 6 6 894 422 -1 48.3 -1 96.5 -1 96.7 -1 1.00 -1 90.7 -1 90.8 -1 1.00 -1
Peru PE 6 6 3 993 965 -1 49.0 -1 100.0 … … 99.7 -1 … …
Dominican Republic DO 6 6 1 305 661 47.4 82.1 82.7 1.01 82.4 83.3 1.02
Saint Kitts and Nevis KN 5 7 6 474 49.8 … … … … … …
Saint Lucia LC 5 7 20 938 49.1 97.3 ** 96.9 ** 0.99 ** 93.5 93.2 0.99
Saint Vincent and the Grenadines VC 5 7 15 532 47.4 98.4 ** … … 97.5 … …
Suriname SR 6 6 69 604 48.3 92.4 ** 94.4 ** 1.04 ** 90.1 89.6 0.99
Trinidad and Tobago TT 5 7 130 880 48.5 94.0 94.3 1.01 95.3 95.1 0.99
United States of America US 6 6 24 492 041 -1 48.8 -1 95.1 95.1 1.00 92.7 -1 93.5 -1 1.02 -1
Uruguay UY 6 6 359 439 -1 48.3 -1 … … … 97.8 -1 97.9 -1 1.00 -1
Venezuela VN 6 6 3 439 199 48.3 89.5 90.2 1.02 92.1 92.5 1.01
Averages … … … … 93.1 92.2 1.00 93.5 92.9 1.01

117
Table 1a: Primary education / ISCED 1 / Enrolment, new entrants and repeaters. 2008.
ID
New
en
tran
ts
in p
rim
ary
Net
inta
ke
rate
(IS
CED
1)
Perc
enta
ge
of re
peat
ers
in
gra
de 1
of
prim
ary
2008
2008
2008
MF
% F
MF
GPI
MF
M F
(11) (12) (13) (14) (15) (16) (17)
AG 1 619 -1 47.7 -1 … … 3.4 -1 4.2 -1 2.5 -1
AG 750 571 -2 49.1 -2 98.6 -2 0.97 -2 10.0 -2 11.4 -2 8.4 -2
BS 6 476 -1 48.2 -1 70.7 -1 1.01 -1 … … …
BB 3 768 * 48.1 * … … a a a
BZ 8 208 48.3 65.2 0.96 14.0 15.4 12.5
BO 286 677 -1 48.9 -1 66.1 -1 1.01 -1 2.5 -1 2.6 -1 2.4 -1
BR 4 322 968 -3 … -3 … … 24.5 -3 … …
CA 350 579 -2 48.7 -2 … … … … …
CH 255 793 -1 48.6 -1 … … 2.7 -1 3.1 -1 2.1 -1
CO 1 105 650 48.4 63.8 0.98 5.1 5.7 4.4
CR 75 673 48.6 … … 14.8 16.4 12.9
DM 1 177 51.7 54.2 * 1.25 * 10.8 14.7 6.7
EC 405 406 -1 48.7 -1 90.0 -1 1.01 -1 2.9 -1 3.1 -1 2.6 -1
SV 160 898 48.1 64.5 1.02 13.0 14.5 11.4
GD 1 821 48.5 79.6 -1 0.95 -1 2.7 3.2 2.2
GT 471 165 48.9 71.6 0.98 24.8 26.3 23.1
GY 16 410 48.9 62.0 -1 0.99 -1 1.0 1.2 0.8
HT … … … … … … …
HN 229 737 48.1 62.7 1.05 12.2 13.2 11.0
JM 48 435 **. -1 48.7 **. -1 73.5 **. -3 1.00 **. -3 3.3 **.-1 4.1 **.-1 2.4 **.-1
MX 2 500 552 -1 49.1 -1 94.9 1.00 5.8 -1 6.9 -1 4.7 -1
NI 202 310 47.3 66.7 1.02 20.0 21.6 18.2
PN 73 367 48.3 … … 8.7 9.9 7.5
PY 144 249 -1 48.3 -1 64.6 -1 1.02 -1 7.4 -1 8.4 -1 6.3 -1
PE 643 660 -1 49.7 -1 76.4 -1 1.00 -1 3.9 -1 4.1 -1 3.7 -1
DO 219 539 46.2 55.8 0.96 2.7 2.4 3.1
KN 737 49.9 … … 3.4 4.9 1.9
LC 2 616 48.4 68.7 **. -2 1.02 **. -2 8.2 11.2 4.9
VC 1 970 49.5 64.8 **. -3 0.89 **. -3 6.9 9.6 3.9
SR 10 445 49.3 86.1 1.00 19.6 23.6 14.9
TT 17 262 49.2 67.5 1.00 11.3 13.2 9.2
US 4 204 502 -1 50.1 -1 73.8 -1 1.07 -1 … … …
UY 53 169 -1 48.7 -1 … … 14.4 -1 16.8 -1 11.8 -1
VN 575 147 48.3 63.2 1.02 5.4 6.5 4.2
… … 71.0 1.01 9.0 9.9 7.1

118
ID
Prim
ary
com
plet
ion
rate
(IS
CED
1)
Pari
ty in
pr
imar
y co
mpl
etio
n (IS
CED
1)
Gen
der
pari
ty
Rura
l/urb
an
pari
ty
Low
est
quin
tile/
high
est
quin
tile
pa
rity
Indi
geno
us/
non-
indi
geno
us
pari
ty
pop.
(15-
19)
pop.
(20-
24)
pop.
(25-
29)
pop.
(15-
19)
pop.
(20-
24)
pop.
(25-
29)
pop.
(15-
19)
pop.
(20-
24)
pop.
(25-
29)
pop.
(15-
19)
pop.
(20-
24)
pop.
(25-
29)
pop.
(15-
19)
pop.
(20-
24)
pop.
(25-
29)
(1) (2) (3) (4) (5) (6) (7) (8) (9) (10) (11) (12) (13) (14) (15)
AG … … … … … … … … … … … … … … …
AG 97,8 98,1 97,1 1,01 1,01 1,00 … … … 0,96 0,95 0,92
BS 99,7 99,1 98,8 1,00 1,00 1,00 … … … … … … … … …
BB 97,7 98,5 98,4 1,01 1,01 1,01 … … … … … … … … …
BZ 81,1 79,1 76,6 1,05 1,02 0,97 0,71 0,74 0,81 … … … … … …
BO 93,0 89,5 78,5 0,98 0,98 0,88 0,91 0,84 0,61 0,89 0,73 0,43 0,94 0,92 0,87
BR 94,7 93,8 90,3 1,03 1,03 1,03 0,93 0,88 0,78 0,91 0,86 0,75 0,98 0,99 0,99
CA … … … … … … … … … … … … … … …
CH 98,7 98,2 97,1 1,01 1,01 1,00 0,99 0,96 0,93 0,98 0,95 0,92 0,99 0,99 0,96
CO 93,6 91,1 89,0 1,03 1,02 1,02 0,89 0,80 0,73 0,89 0,80 0,72 … … …
CR 94,1 90,7 89,0 1,01 1,00 1,01 0,95 0,91 0,88 0,92 0,76 0,73 … … …
DM 96,2 96,5 95,5 1,00 1,02 1,03 … … … … … … … … …
EC 94,6 93,4 90,9 1,01 1,01 1,00 0,95 0,91 0,86 0,93 0,87 0,81 0,94 0,91 0,89
SV 76,1 74,1 70,9 1,05 0,98 0,90 0,75 0,67 0,55 0,63 0,49 0,39 … … …
GD … … … … … … … … … … … … … … …
GT 62,6 58,6 52,7 0,86 0,82 0,83 0,64 0,50 0,43 0,42 0,18 0,17 0,70 0,59 0,52
GY … … … … … … … … … … … … … … …
HT … … … … … … … … … … … … … … …
HN 79,2 75,8 68,2 1,06 1,06 1,05 0,78 0,72 0,63 0,65 0,46 0,38 … … …
JM … … … … … … … … … … … … … … …
MX 95,7 93,0 88,5 … … … 0,95 0,92 0,83 0,90 0,82 0,69 … … …
NI 70,8 70,8 64,6 1,15 1,12 1,09 0,62 0,56 0,45 0,49 0,42 0,33 0,81 0,89 1,03
PN 94,6 94,8 92,7 1,00 0,99 1,01 0,90 0,88 0,86 0,87 0,82 0,77 0,75 0,75 0,63
PY 89,3 88,6 84,6 1,02 1,00 0,97 0,89 0,84 0,81 0,83 0,77 0,63 0,88 0,84 0,78
PE 93,9 93,2 89,1 0,99 0,96 0,94 0,92 0,86 0,77 0,87 0,78 0,70 … … …
DO 88,3 86,1 80,9 1,09 1,08 1,08 0,91 0,84 0,79 0,88 0,90 0,78 … … …
KN … … … … … … … … … … … … … … …
LC … … … … … … … … … … … … … … …
VC … … … … … … … … … … … … … … …
SR 91,1 87,4 86,4 … … … … … … … … … … … …
TT … … … … … … … … … … … … … … …
US … … … … … … … … … … … … … … …
UY 96,7 96,6 95,7 1,02 1,02 1,02 1,00 1,00 0,98 0,93 0,90 0,88 … … …
VN 93,5 93,5 91,6 1,04 1,05 1,06 … … … 0,93 0,89 0,85 … … …
Aver. 90,1 88,7 85,5 1,02 1,01 0,99 0,86 0,81 0,75 0,83 0,74 0,66 0,88 0,86 0,83
Table 1b: Primary education / ISCED 1 / Completion and parity indexes. 2008.

119
ID
Tota
l se
cond
ary
(ISCE
D
2+3)
, all
prog
ram
mes
Educ
atio
n sy
stem
Se
cond
ary
(ISCE
D 2
+3)
Tota
l en
rolm
ent
(ISCE
D 2
+3)
Net
en
rolm
ent
rate
to
tal
seco
ndar
y
2008 2000 2008
Entr
ance
ag
e
Dur
atio
n
MF
% F
MF
F GPI
MF
F GPI
(1) (2) (3) (4) (5) (6) (7) (8) (9) (10)
AG 12 5 7 838 -1 51.1 -1 … … … … … …
AG 12 6 3 481 085 -2 52.1 -2 79.3 81.9 1.07 79.4 -2 83.6 -2 1.11 -2
BS 11 6 34 217 -1 50.4 -1 72.4 ** 71.1 ** 0.97 ** 86.1 -1 88.5 -1 1.06 -1
BB 11 5 20 337 * 50.3 * … … … … … …
BZ 11 6 31 120 51.4 56.5 ** 58.4 ** 1.07 ** 63.4 -1 66.0 -1 1.09 -1
BO 12 6 1 052 014 -1 48.4 -1 67.7 **. 1 67.0 **. 1 0.98 **. 1 69.9 -1 69.7 -1 0.99 -1
BR 11 7 23 423 870 -1 51.7 -1 68.5 71.0 1.08 77.0 -1 80.9 -1 1.10 -1
CA 12 6 2 632 432 -2 48.2 -2 … … … … … …
CH 12 6 1 611 631 -1 49.8 -1 … … … 85.3 -1 86.7 -1 1.03 -1
CO 11 6 4 772 189 51.4 58.1 ** 60.9 ** 1.10 ** 71.2 74.5 1.09
CR 12 5 380 813 50.0 … … … … … …
DM 12 5 7 309 49.1 75.6 ** 81.8 ** 1.17 ** … … …
EC 12 -1 6 1 141 866 -1 49.5 -1 47.2 47.9 1.03 59.2 -1 59.8 -1 1.02 -1
SV 13 6 539 277 50.1 47.0 ** 46.5 ** 0.98 ** 55.0 55.8 1.03
GD 12 5 12 469 47.3 … … … 88.6 84.6 0.91
GT 13 5 902 796 48.3 26.9 ** 25.5 ** 0.90 ** 39.9 38.7 0.94
GY 12 5 74 673 50.3 … … … … … …
HT 12 7 … … … … … … … …
HN 12 5 566 938 55.3 … … … … … …
JM 12 5 257 186 50.4 77.7 ** 79.0 ** 1.03 ** 76.7 -1 78.4 -1 1.05 -1
MX 12 6 11 122 276 -1 51.3 -1 57.3 ** 57.1 ** 0.99 ** 70.9 -1 72.1 -1 1.03 -1
NI 12 5 462 198 52.6 34.7 37.6 1.18 45.2 ** 48.5 ** 1.16 **
PN 12 6 266 760 50.9 61.1 ** 63.7 ** 1.09 ** 65.6 68.7 1.01
PY 12 6 532 103 -1 50.1 -1 … … … 58.3 -1 60.2 -1 1.07 -1
PE 12 5 2 861 313 -1 50.0 -1 65.1 64.0 0.97 75.9 76.1 1.01
DO 12 6 909 331 53.7 39.2 43.5 1.24 57.7 63.4 1.22
KN 12 5 4 396 50.8 … … … 78.7 ** 77.3 ** 0.96 **
LC 12 5 16 014 50.9 62.5 ** 69.7 ** 1.26 ** 79.6 ** 82.1 ** 1.06 **
VC 12 5 11 641 52.3 67.9 ** 78.4 ** 1.36 ** 90.3 95.4 1.12
SR 12 7 48 134 55.5 64.8 **. 1 70.5 **. 1 1.19 **. 1 64.6 **.-3 74.1 **.-3 1.34 **.-3
TT 12 5 95 275 ** 51.1 ** 66.7 ** 69.8 ** 1.01 ** 73.9 ** 76.4 ** 1.07 **
US 12 6 24 731 027 -1 48.9 -1 85.9 86.9 1.02 88.2 -1 89.1 -1 1.02 -1
UY 12 6 294 852 -1 48.8 -1 … … … 67.7 -1 71.2 -1 1.11 -1
VN 12 5 2 224 214 51.4 50.5 55.3 1.21 69.5 73.6 1.12
Aver. … … … … 60.6 63.1 1.09 70.7 72.9 1.07
Table 2a: Secondary education / ISCED 2-3 / Enrolment. 2008.

120
ID
Low
er s
econ
dary
co
mpl
etio
n ra
te (I
SCED
2)
Pari
ty in
lo
wer
se
cond
ary
com
plet
ion
(ISCE
D 2
)
Gen
der
pari
ty in
dex
Rura
l/urb
an
pari
ty in
dex
Low
est
quin
tile/
high
est
quin
tile
pa
rity
inde
x
Indi
geno
us/
non-
indi
geno
us
pari
ty in
dex
pop.
(20-
24)
pop.
(25-
29)
pop.
(30-
34)
pop.
(20-
24)
pop.
(25-
29)
pop.
(30-
34)
pop.
(20-
24)
pop.
(25-
29)
pop.
(30-
34)
pop.
(20-
24)
pop.
(25-
29)
pop.
(30-
34)
pop.
(20-
24)
pop.
(25-
29)
pop.
(30-
34)
(1) (2) (3) (4) (5) (6) (7) (8) (9) (10) (11) (12) (13) (14) (15)
AG … … … … … … … … … … … … … … …
AG 81.0 75.8 72.4 … … … … … … 0.63 0.47 0.48 … … …
BS 97.0 96.2 95.4 … … … … … … … … … … … …
BB 97.3 96.1 93.9 … … … … … … … … … … … …
BZ … … … … … … … … … … … … … … …
BO 83.0 73.0 65.5 0.93 0.84 0.84 0.71 0.50 0.43 0.56 0.29 0.30 0.87 0.82 0.82
BR 77.6 71.6 62.0 1.01 1.08 1.13 0.64 0.50 0.41 0.52 0.40 0.30 0.95 0.93 0.92
CA … … … … … … … … … … … … … … …
CH 96.3 94.0 89.7 1.01 1.00 0.99 0.91 0.82 0.79 0.91 0.84 0.79 0.98 0.90 0.86
CO 69.9 66.9 57.7 1.06 1.06 1.09 0.46 0.39 0.29 0.48 0.37 0.28 … … …
CR 60.6 54.7 48.2 1.01 1.06 1.10 0.64 0.59 0.50 0.36 0.24 0.21
DM 66.8 49.1 37.0 1.35 1.49 1.66 … … … … … … … … …
EC 69.8 62.1 55.7 1.02 1.01 1.00 0.57 0.47 0.39 0.52 0.36 0.28 0.65 0.60 0.50
SV 58.4 53.9 50.9 0.95 0.90 0.92 0.53 0.41 0.35 0.29 0.23 0.21
GD … … … … … … … … … … … … … … …
GT 35.1 31.7 28.3 0.82 0.84 0.83 0.30 0.28 0.20 0.06 0.04 0.01 0.44 0.38 0.36
GY … … … … … … … … … … … … … … …
HT … … … … … … … … … … … … … … …
HN 40.1 31.3 26.6 1.14 1.18 1.17 0.36 0.25 0.19 0.11 0.05 0.03
JM … … … … … … … … … … … … … … …
MX 77.2 69.7 63.6 1.00 0.96 0.97 0.77 0.65 0.59 0.53 0.40 0.34 … … …
NI 43.9 40.9 33.8 1.27 1.16 1.28 0.36 0.22 0.23 0.20 0.11 0.07 0.77 0.96 0.86
PN 75.9 71.1 66.2 … … … 0.61 0.53 0.47 0.46 0.34 0.28 0.45 0.38 0.17
PY 67.4 59.4 48.1 1.05 0.95 0.83 0.56 0.48 0.45 0.47 0.24 0.23 0.57 0.48 0.37
PE 81.3 74.4 68.2 0.94 0.91 0.89 0.66 0.50 0.43 0.53 0.37 0.32 … … …
DO 78.5 71.9 60.3 1.12 1.07 1.13 0.78 0.69 0.63 0.84 0.68 0.57
KN … … … … … … … … … … … … … … …
LC … … … … … … … … … … … … … … …
VC … … … … … … … … … … … … … … …
SR 62.0 60.4 58.7 … … … … … … … … … … … …
TT … … … … … … … … … … … … … … …
US … … … … … … … … … … … … … … …
UY 70.0 64.4 64.7 1.14 1.13 1.17 0.71 0.53 0.55 0.35 0.27 0.36
VN 73.5 69.0 65.4 1.19 1.22 1.21 … … … 0.62 0.53 0.52 … … …
Aver. 71.0 65.3 59.7 1.07 1.05 1.07 0.60 0.49 0.43 0.47 0.35 0.31 0.71 0.68 0.61
Table 2b: Lower secondary education / ISCED 2 / Completion and parity indexes. 2008.

121
ID
Upp
er s
econ
dary
co
mpl
etio
n ra
te
(ISCE
D 3
)
Pari
ty in
se
cond
ary
com
plet
ion
(ISCE
D 3
)
Gen
der
pari
ty in
dex
Rura
l/urb
an
pari
ty in
dex
Low
est
quin
tile/
high
est
quin
tile
pa
rity
inde
x
Indi
geno
us/
non-
indi
geno
us
pari
ty in
dex
pop.
(20-
24)
pop.
(25-
29)
pop.
(30-
34)
pop.
(20-
24)
pop.
(25-
29)
pop.
(30-
34)
pop.
(20-
24)
pop.
(25-
29)
pop.
(30-
34)
pop.
(20-
24)
pop.
(25-
29)
pop.
(30-
34)
pop.
(20-
24)
pop.
(25-
29)
pop.
(30-
34)
(1) (2) (3) (4) (5) (6) (7) (8) (9) (10) (11) (12) (13) (14) (15)
AG … … … … … … … … … … … … … … …
AG 68.8 63.5 57.5 1.13 1.12 1.13 … … … 0.49 0.32 0.25 … … …
BS 86.5 84.7 83.0 1.25 1.02 1.11 … … … … … … … … …
BB 94.9 91.5 89.1 1.05 1.06 1.07 … … … … … … … … …
BZ 38.5 34.5 31.2 1.10 1.21 0.94 0.34 0.40 0.43 … … … … … …
BO 64.5 56.2 50.1 0.94 0.86 0.86 0.55 0.38 0.35 0.37 0.11 0.21 0.77 0.78 0.82
BR 55.3 54.2 45.3 1.20 1.15 1.18 0.45 0.37 0.32 0.25 0.21 0.15 0.84 0.87 0.86
CA … … … … … … … … … … … … … … …
CH 80.0 75.1 65.4 1.03 1.03 0.99 … … … 0.64 0.48 0.40 0.80 0.74 0.68
CO 30.0 29.1 25.3 1.13 1.13 1.13 0.14 0.12 0.10 0.11 0.07 0.06 … … …
CR 44.8 43.0 37.6 1.16 1.15 1.18 0.57 0.55 0.44 0.19 0.14 0.09 … … …
DM 21.5 16.9 12.7 1.25 1.02 1.11 … … … 0.53 0.45 0.35 … … …
EC 55.5 49.3 44.3 1.09 1.01 1.00 0.47 0.39 0.31 0.37 0.28 0.17 0.53 0.52 0.46
SV 36.5 36.0 33.1 0.98 0.93 1.00 0.34 0.27 0.20 0.12 0.11 0.10 … … …
GD … … … … … … … … … … … … … … …
GT 25.6 23.8 22.5 0.88 0.86 0.97 0.23 0.25 0.14 0.04 0.02 0.01 0.39 0.35 0.30
GY … … … … … … … … … … … … … … …
HT … … … … … … … … … … … … … … …
HN 29.5 24.4 20.7 1.18 1.24 1.14 0.29 0.20 0.15 0.07 0.02 0.02 … … …
JM … … … … … … … … … … … … … … …
MX 45.3 37.5 32.0 1.03 0.98 1.00 0.56 0.43 0.43 0.20 0.12 0.08 … … …
NI 31.5 31.0 23.2 1.41 1.23 1.17 0.30 0.19 0.18 0.14 0.07 0.02 0.66 0.81 0.83
PN 56.3 53.3 49.0 1.18 1.17 1.12 0.50 0.45 0.42 0.24 0.19 0.16 0.20 0.28 0.01
PY 48.4 44.9 34.8 1.05 0.96 0.90 0.43 0.38 0.37 0.25 0.13 0.14 0.41 0.41 0.34
PE 73.8 67.2 60.7 0.95 0.92 0.87 0.60 0.43 0.36 0.46 0.30 0.26 … … …
DO 52.4 45.9 34.1 1.31 1.21 1.28 0.67 0.52 0.54 … … … … … …
KN … … … … … … … … … … … … … … …
LC … … … … … … … … … … … … … … …
VC … … … … … … … … … … … … … … …
SR 14.8 13.5 11.4 1.42 1.38 0.95 … … … … … … … … …
TT … … … … … … … … … … … … … … …
US … … … … … … … … … … … … … … …
UY 38.1 36.1 33.3 1.41 1.40 1.42 0.60 0.39 0.37 0.10 0.04 0.07
VN 61.3 56.7 52.7 1.25 1.28 1.31 … … … 0.50 0.39 0.37 … … …
Aver. 51.8 48.0 42.6 1.15 1.10 1.08 0.44 0.36 0.32 0.28 0.19 0.16 0.58 0.59 0.55
Table 2c: Upper secondary education / ISCED 3 / Completion and parity indexes. 2008.

122
ID
Num
ber o
f stu
dent
s
enro
lled
in te
rtia
ry
per 1
00 0
00 in
habi
tant
s
(tota
l)
Educ
atio
nal
atta
inm
ent
of th
e po
pula
tion
25
yea
rs a
nd
olde
r
Lite
racy
ra
tes
No
scho
olin
g or
inco
mpl
ete
prim
ary
ISCE
D 1
ISCE
D 2
ISCE
D 3
+4
ISCE
D 5
+6
Adu
ltos
A
dults
(15
year
s an
d ol
der)
Yout
h
(15
to 2
4 ye
ars)
2000
2008
MF
(%)
MF
(%)
MF
(%)
MF
(%)
MF
(%)
MF
M F GPI
MF
M F GPI
(1) (2) (3) (4) (5) (6) (7) (8) (9) (10) (11) (12) (13) (14) (15)
AG … … … … … … … … … … … … … … …
AG 4 802 5 615 -1 19.2 35.0 11.6 23.2 11.1 97.7 ** 97.6 ** 97.7 ** 1.00 ** 99.1 ** 99.0 ** 99.3 ** 1.00 **
BS … … 1.5 8.3 19.1 70.2 0.3 … … … … … … … …
BB … … 13.6 8.3 53.8 23.1 1.1 … … … … … … … …
BZ … 1 457 … … … … … … … … … … … … …
BO 3 382 3 802 *.-1 41.7 12.8 7.1 23.8 14.0 90.7 -1 96.0 -1 86.0 -1 0.90 -1 99.4 -1 99.8 -1 99.1 -1 0.99 -1
BR 1 607 3 116 31.0 26.5 13.0 21.2 8.1 90.0 -1 89.8 -1 90.2 -1 1.01 -1 97.8 -1 97.1 -1 98.6 -1 1.02 -1
CA … … … … … … … … … … … … … … …
CH 2 965 4 568 -1 … … … … … 98.6 98.6 98.7 1.00 99.2 99.1 99.2 1.00
CO 2 376 3 344 30.2 29.2 5.3 25.4 9.7 93.4 93.3 93.4 1.00 98.0 97.5 98.4 1.01
CR … … 22.0 28.9 13.8 18.5 15.0 96.0 ** 95.7 ** 96.2 ** 1.00 ** 98.1 ** 97.7 ** 98.6 ** 1.01 **
DM … … … … … … … … … … … … … … …
EC … 4 027 … … … … … 84.2 -1 87.3 -1 81.7 -1 0.94 -1 95.4 -1 95.2 -1 95.6 -1 1.00 -1
SV 1 957 2 303 47.9 15.2 12.5 13.8 10.6 84.0 87.1 81.4 0.93 96.0 95.4 96.5 1.01
GD … … … … … … … … … … … … … … …
GT … 1 771 -1.0 … … … … … 73.8 ** 79.5 ** 68.7 ** 0.86 ** 86.0 ** 88.5 ** 83.6 ** 0.95 **
GY … 1 141 … … … … … … … … … … … … …
HT … … … … … … … … … … … … … … …
HN 1 483 2 053 … … … … … 83.6 -1 83.7 -1 83.5 -1 1.00 -1 93.9 -1 92.7 -1 95.1 -1 1.03 -1
JM 1 611 2 486 … … … … … 85.9 ** 80.6 ** 90.8 ** 1.13 ** 95.0 ** 91.8 ** 98.2 ** 1.07 **
MX 2 016 2 464 29.2 19.0 21.5 15.3 14.9 92.9 94.6 91.5 0.97 98.4 98.4 98.4 1.00
NI … … … … … … … 78.0 -3 78.1 -3 77.9 -3 1.00 -3 87.0 -3 85.2 -3 88.8 -3 1.04 -3
PN 4 079 4 035 -1.0 23.6 28.7 13.7 23.1 10.4 93.5 ** 94.1 ** 92.8 ** 0.99 ** 96.4 ** 96.6 ** 96.2 ** 1.00 **
PY 1 574 2 984 -1.0 35.8 25.3 11.4 23.6 3.7 94.6 -1 95.7 -1 93.5 -1 0.98 -1 98.8 -1 98.8 -1 98.8 -1 1.00 -1
PE 3 150 3 431 **.-2 27.7 20.6 5.4 26.0 16.3 89.6 -1 94.9 -1 84.6 -1 0.89 -1 97.4 -1 98.0 -1 96.7 -1 0.99 -1
DO … … … … … … … 88.2 -1 88.2 -1 88.3 -1 1.00 -1 95.8 -1 94.6 -1 96.9 -1 1.02 -1
KN … … … … … … … … … … … … … … …
LC … 2 193 … … … … … … … … … … … … …
VC … … … … … … … … … … … … … … …
SR … … … … … … … 90.7 ** 93.0 ** 88.4 ** 0.95 ** 95.3 ** 95.7 ** 94.8 ** 0.99 **
TT … … … … … … … 98.7 ** 99.1 ** 98.2 ** 0.99 ** 99.5 ** 99.5 ** 99.5 ** 1.00 **
US 4 655 5 928 … … … … … … … … … … … … …
UY 2 799 4 823 -1.0 … … … … … 97.9 -1 97.4 -1 98.2 -1 1.01 -1 98.8 -1 98.5 -1 99.0 -1 1.01 -1
VN … … 25.1 28.1 10.7 21.7 12.8 95.2 -1 95.4 -1 94.9 -1 1.00 -1 98.4 -1 98.0 -1 98.8 -1 1.01 -1
Aver. … … … … … … … 90.3 91.4 89.4 0.98 96.4 96.1 96.7 1.01
Table 3: Lifelong learning / Tertiary education, educational attainment and literacy. 2008.

123
ID
Educ
atio
n sy
stem
Pr
e-pr
imar
y (IS
CED
0)
Enro
lmen
t
Net
enr
olm
ent r
ate
pre-
prim
ary
Entr
ance
age
Dur
atio
n
2008
2000
2008
MF
%F
MF
F GPI
MF
F IPG
(1) (2) (3) (4) (5) (6) (7) (8) (9) (10)
AG 3 2 2 356 48.9 … … … 66.3 *. -1 66.2 *. -1 1.00 *. -1
AG 3 3 1 373 577 -1 49.5 -1 60.2 60.7 1.02 66.4 -2 66.9 -2 1.01 -2
BS 3 2 … … 15.3 ** 15.9 ** 1.09 ** … … …
BB 3 2 5 931 50.2 * … … … … … …
BZ 3 2 5 801 50.5 25.0 24.5 0.96 38.2 39.0 1.04
BO 4 2 237 957 -1 49.1 -1 35.9 36.2 1.02 39.7 -1 39.9 -1 1.01 -1
BR 4 3 6 784 955 48.7 46.8 46.9 1.00 48.5 -1 48.6 -1 1.00 -1
CA 4 2 485 762 -2 48.7 -2 63.6 … 0.99 … … …
CH 3 3 407 418 -1 50.1 -1 … … … 52.8 -1 54.1 -1 1.05 -1
CO 3 3 1 312 470 48.8 36.0 ** 36.3 ** 1.02 ** 43.6 43.8 1.01
CR 4 2 107 941 48.6 … … … … … …
DM 3 2 2 006 49.2 64.9 ** 73.8 ** 1.31 ** … … …
EC 5 1 291 059 ** 49.4 ** 55.6 56.4 1.03 83.3 -1 83.7 -1 1.01 -1
SV 4 3 223 920 49.7 39.2 39.8 ** 1.03 ** 50.8 51.9 1.04
GD 3 2 3 808 49.8 90.6 **. +1 91.9 **. +1 1.03 **. +1 95.2 97.2 1.04
GT 3 4 477 920 49.5 37.3 36.9 0.98 28.2 28.4 1.01
GY 4 2 27 153 48.8 … … … 70.9 70.8 1.00
HT 3 3 ... … … … … … … …
HN 3 3 227 394 49.7 21.6 22.1 ** 1.05 ** 27.0 27.3 1.03
JM 3 3 133 903 50.3 76.9 77.8 1.02 84.3 -1 85.1 -1 1.02 -1
MX 4 2 4 756 870 49.5 67.0 67.7 1.02 96.9 -1 97.3 -1 1.01 -1
NI 3 3 220 529 49.2 28.6 29.1 1.04 55.8 56.1 1.01
PN 4 2 94 928 49.1 43.9 44.1 1.01 61.0 61.2 1.01
PY 3 3 152 363 -1 49.3 -1 25.9 -1 26.4 -1 1.04 -1 29.9 -2 30.2 -2 1.02 -2
PE 3 3 1 276 268 49.3 58.6 59.1 1.02 64.2 -1 64.5 -1 1.01 -1
DO 3 3 222 241 49.1 28.6 29.1 1.03 30.6 30.8 1.02
KN 3 2 1 608 50.5 … … … … … …
LC 3 2 3 882 49.9 48.8 49.9 ** 1.05 ** 51.3 51.3 1.00
VC 3 2 … … … … … … … …
SR 4 2 17 467 49.5 … … … 80.1 79.9 0.99
TT 3 2 29 585 49.2 * 49.5 50.4 ** 1.04 ** 65.7 * 65.6 * 1.00 *
US 3 3 7 191 333 48.6 54.0 … 1.03 56.3 -1 … 1.00 -1
UY 3 3 122 089 -1 49.1 -1 52.9 … … 72.2 -1 72.6 -1 1.00 -1
VN 3 3 1 183 816 49.1 44.2 44.7 1.02 55.1 -1 55.3 -1 1.01 -1
Aver. … … … … 46.8 46.4 1.04 58.2 58.4 1.01
Table 4: Pre-primary education and ECCE / ISCED 0 / Enrolment, school attendance and teachers. 2008.

124
ID
Scho
ol
atte
ndan
ce ra
te,
child
ren
one
year
yo
unge
r tha
n th
e of
ficia
l ent
ranc
e ag
e fo
r pri
mar
y
% T
rain
ed
teac
hers
pr
e-pr
imar
y ed
ucat
ion
By
gend
er
By
inco
me
quin
tile
By
geog
raph
ic
area
MF
FMF
M F Low
est
quin
tile
Hig
hest
qu
intil
e
Urb
an
Rura
l
(11) (12) (13) (14) (15) (16) (17) (18) (19)
AG ... ... ... ... ... ... ... 28,9 -1 28,9 -1
AG 90.8 -2 91.0 -2 90.5 -2 84.7 -2 94.5 -2 ... ... ... ...
BS ... ... ... ... ... ... ... … …
BB ... ... ... ... ... ... ... 49.7 -1 51.0 -1
BZ ... ... ... ... ... ... ... 9.3 -1 9.4 -1
BO 60.8 -1 58.5 -1 62.5 -1 56.9 -1 62.6 -1 63.3 -1 57.0 -1 … …
BR 93.5 93.2 93.9 90.4 99.6 94.4 90.1 ... ...
CA ... ... ... ... ... ... ... ... ...
CH 87.0 -2 88.2 -2 85.8 -2 81.5 -2 93.8 -2 89.6 -2 69.6 -2 ... ...
CO 80.3 79.5 81.2 73.6 93.8 85.2 69.0 100.0 100.0
CR 73.0 69.4 77.1 67.1 95.4 78.4 66.7 80.7 -1 82.1 -1
DM ... ... ... ... ... ... ... … …
EC 88.1 87.0 89.2 77.9 96.6 92.8 79.6 74.6 -1 76.4 -1
SV 75.3 75.1 75.5 59.7 98.0 83.0 66.0 89.7 -1 92.9 -1
GD ... ... ... ... ... ... ... 42.3 -1 42.3 -1
GT 99.2 - 98.4 - 100.0 - 98.4 -2 100.0 -2 100.0 -2 98.6 -2 ... ...
GY ... ... ... ... ... ... ... 52.5 -1 52.6 -1
HT ... ... ... ... ... ... ... ... ...
HN 45.8 -1 45.1 - 46.6 - 36.5 -1 74.9 -1 52.0 -1 41.7 -1 … …
JM ... ... ... ... ... ... ... … …
MX 93.9 94.6 93.1 89.7 97.5 96.6 89.9 84.7 …
NI ... ... ... ... ... ... ... 39.2 -1 39.0 -1
PN 78.7 81.4 75.8 68.6 96.2 85.4 69.6 41.0 -1 43.1 -1
PY 60.9 61.7 60.2 40.9 87.1 71.7 50.0 ... ...
PE 68.1 66.8 69.3 58.5 72.1 75.7 57.7 ... ...
DO 77.6 73.7 81.8 81.1 88.8 77.1 78.5 77.1 *.-1 77.3 *.-1
KN ... ... ... ... ... ... ... 46.0 **.-3 46.0 **.-3
LC ... ... ... ... ... ... ... 55.9 **.-3 55.9 **.-3
VC ... ... ... ... ... ... ... … …
SR ... ... ... ... ... ... ... 100.0 100.0
TT ... ... ... ... ... ... ... … …
US ... ... ... ... ... ... ... ... ...
UY 96.0 95.9 96.2 94.9 99.2 96.6 87.8 ... ...
VN 91.8 92.4 91.3 88.1 99.0 ... ... 86.1 -3 87.1 -3
Aver. 80.0 79.5 80.6 73.4 91.1 82.8 71.5 62.0 61.5
Table 4: Pre-primary education and ECCE / ISCED 0 / Enrolment, school attendance and teachers. 2008.

125
ID
Hum
an D
evel
opm
ent I
ndex
200
7
GD
P pe
r cap
ita 2
007
(USD
PPP
)
Publ
ic
expe
nditu
re
per p
upil
as
% G
DP
per
capi
ta
Pupi
l/te
ache
r ra
tio
Trai
ned
teac
hers
(%)
Prim
ary
educ
atio
n (IS
CED
1) Ed
ucac
ión
secu
ndar
ia
(CIN
E 2-
3)
Prim
ary
educ
atio
n (IS
CED
1) Se
cond
ary
educ
atio
n (IS
CED
2-3
)
Prim
ary
educ
atio
n (IS
CED
1)
Seco
ndar
y ed
ucat
ion
(ISCE
D 2
-3)
MF
F MF
F
(1) (2) (3) (4) (5) (7) (9) (10) (11) (12)
AG 0.87 18 691 … … 21.5 -1 … 67.286 -1 67.0 -1 … …
AG 0.87 13 238 13.2 -2 20.3 -2 16.3 -2 12.8 -2 … … … …
BS 0.86 20 253 … … 13.8 -1 12.3 -1 85.140 -1 … 85.940 -1 88.4 -1
BB 0.90 17 956 27.7 * 24.8 * 13.5 * 14.6 -2 61.0 * 60.0 * 57.1 -2 57.2 -2
BZ 0.77 6 734 14.3 -1 21.0 -1 22.6 17.0 42.8 43.0 34.7 40.0
BO 0.73 4 206 13.7 **.-2 14.5 **.-2 24.2 -1 18.2 -1 … … … …
BR 0.81 9 567 15.4 -3 13.1 -3 23.9 -1 18.6 -1 … … … …
CA 0.97 35 812 … … … … … … … …
CH 0.88 13 880 11.9 -1 13.4 -1 25.1 -1 23.7 -1 … … … …
CO 0.81 8 587 12.4 14.8 29.4 25.6 100.0 100.0 96.8 97.6
CR 0.85 10 842 … … 19.0 15.6 86.1 85.9 83.3 82.5
DM 0.81 7 893 22.2 19.0 16.7 14.4 59.4 62.6 31.0 30.4
EC 0.81 7 449 … … 18.1 21.5 71.6 -1 71.9 -1 70.5 -1 76.7 -1
SV 0.75 5 804 8.5 9.1 32.6 26.3 93.2 94.1 87.5 89.7
GD 0.81 7 344 … … 22.6 16.6 73.5 74.3 29.3 25.5
GT 0.70 4 562 10.3 -1 5.9 -1 29.4 16.6 … … … …
GY 0.73 2 782 14.4 -1 17.1 -1 25.6 20.9 58.5 59.2 54.9 57.0
HT 0.53 1 155 … … … … … … … …
HN 0.73 3 796 … … 33.3 … 36.4 38.1 … …
JM 0.77 6 079 17.3 -1 19.9 -1 27.7 **.-3 18.5 **.-3 … … … …
MX 0.85 14 104 13.4 -2 13.8 -2 28.0 -1 17.9 -1 … … … …
NI 0.70 2 570 9.8 -2 4.5 -2 29.2 28.6 72.7 77.4 58.9 64.9
PN 0.84 11 391 7.5 10.0 24.2 15.4 91.3 90.7 90.9 92.1
PY 0.76 4 433 … … … … … … … …
PE 0.81 7 836 7.3 -1 8.9 22.2 -1 18.0 -1 … … … …
DO 0.78 6 706 7.4 6.5 19.6 24.5 89.2 89.0 85.5 85.8
KN 0.84 14 481 … … 16.1 10.5 63.6 … 35.7 …
LC 0.82 9 786 … … 21.4 16.4 87.8 90.3 57.0 -2 59.1 -2
VC 0.77 7 691 24.9 -1 … 17.0 19.5 83.0 76.5 55.9 59.0
SR 0.77 7 813 … … 16.0 -2 14.1 -2 … … … …
TT 0.84 23 507 … … 17.2 * 13.5 ** 86.6 82.6 * … …
US 0.96 45 592 22.2 -2 24.6 -2 13.8 -2 14.6 -2 … … … …
UY 0.84 12 156 8.5 -2 10.4 -2 15.5 -1 13.8 -1 … … … …
VN 0.87 11 216 9.1 -1 8.1 -1 16.2 10.2 83.5 86.8 80.3 84.5
Aver. … … 13.9 14.0 21.7 17.6 74.6 75.0 64.4 68.2
Table 5: Resources for education / ISCED 1-2-3 / Expenditure per pupil, pupil-teacher ratio, trained teachers. 2008.

