regional / local data beyond supply -...
TRANSCRIPT

SCORUS-Conference • Shanghai Oct. 2008 1
Regional / Local Data
beyond Supply
By Hans Menge

SCORUS-Conference • Shanghai Oct. 2008 2 2
Target of this presentation
How to provide
regional or local data
in case a
National System of Statistics
does not supply
the variables requested for
regional or local level "xyz“

SCORUS-Conference • Shanghai Oct. 2008 3 3
Reasons for „no supply“ YOUNG administration or young system of statistics,
not yet so well developed
OLD statistical framework, downgraded to reduce the burden
on respondents, increased use of administrative data
My hypothesis:
There is more IN the national systems of statistics
(as possible source of regional information)
than is usually pulled OUT
Compared with the expenses for implementing and operating
a new survey or for enlarging a sample survey,
it is rather inexpensive to implement a system of calculation
(even a comprehensive and sophisticated system)
and execute all the data analysis needed

SCORUS-Conference • Shanghai Oct. 2008 4 4
Methodological approaches to
Regional Disaggregation (R.D.), specified by
3 Examples
1 Regional Accounts
All Regional Account variables are generated by
R.D.
2 Urban Audit
97 of 333 variables for the German Urban Audit
to be generated more or less by R.D.
3 Labour Force Survey in Turkey
Upgrade the Turkish Statistical System
by generating regional data (NUTS-3)
with the aid of R.D., using NUTS-2 data

SCORUS-Conference • Shanghai Oct. 2008 5
REGIONAL DISAGGREGATION
in Regional Accounts
Top down: Preset national benchmark figure must be scored by the sum of all regional results
Bottom up: The sum of the available (auxiliary) regional variable should score the national benchmark figure !
Requested: most appropriate (= best correlated) regional variable to suit the national variable (benchmark)
Problem of Adequacy Example: „Gainfully Employed” as key variable to disaggregate some part of GDP ? …
Does that fit ? You have to face large regional differences of … • full-time.../ half-time... / marginal employment • contracted hours • qualification and monetary compen- sation
SCORUS-Conference • Shanghai Oct. 2008 6
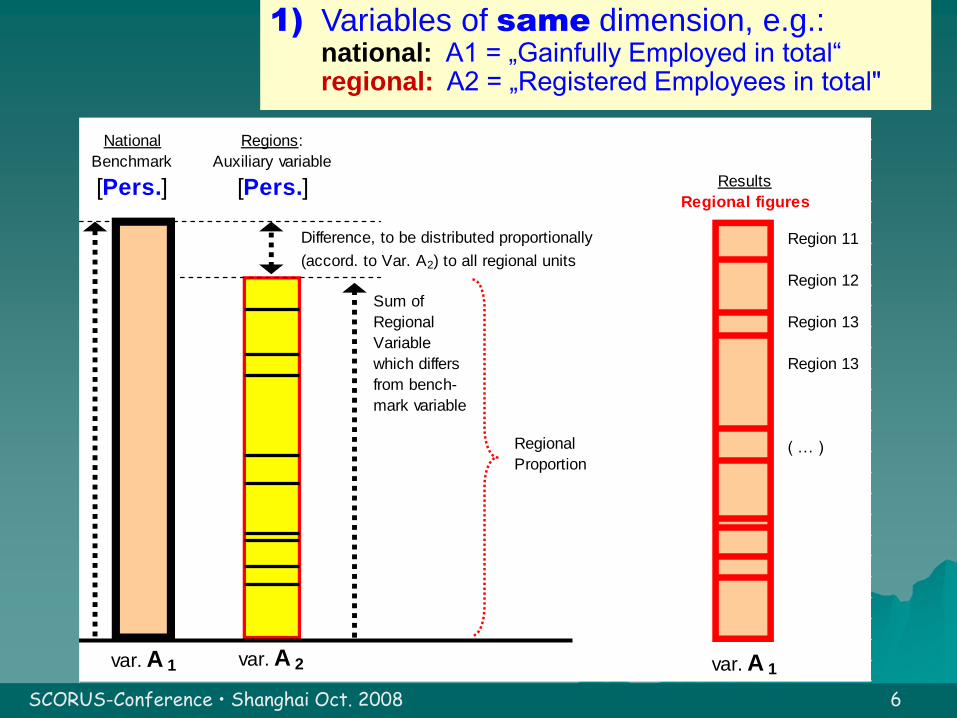
Regions:
Auxiliary variable
[Pers.]
National
Benchmark
[Pers.]
var. A 1
Regional
Proportion
Sum of
Regional
Variable
which differs
from bench-
mark variable
Difference, to be distributed proportionally
(accord. to Var. A2) to all regional units
Results
Regional figures
var. A 2 var. A 1
Region 11
Region 12
Region 13
Region 13
( … )
1) Variables of same dimension, e.g.: national: A1 = „Gainfully Employed in total“ regional: A2 = „Registered Employees in total"

SCORUS-Conference • Shanghai Oct. 2008 7
2nd Example:
Urban Audit (German data) 333 variables required in total
97 of which had to be „estimated“ for German U.A.
because: lack of census data
No statistical source with results at regional level available for these
variables
Only „Estimation“ ?
No ! – because:
Validity of results is comparable to those of Reg. Accounts
How ?
• Use of upgraded system of calculation,
• based on Regional Accounts methods, but
• more sophisticated calculations (to fit special requirements)
Special Problems … (see next slide)

SCORUS-Conference • Shanghai Oct. 2008 8
Special Problems • Special Solutions
Non Totable variables, e.g.:
„%“, „sqm / household“, „EUR/hh"
Complementary variables
(„Sex“, „modal split of commuters“)
Nested variables, e.g.:
„A“, „B“ and „total of A living in B“
Classified variables (by data supply) However, required: „Quinitil“ etc...
Unsuitable Reference Time Required: 2004,
supplied: 2002.
Different Regional levels (and code systems): NUTS-3 or
S of NUTS-3 or part of NUTS-3
Refining Methods: 2 different paths
acc. to types of numerator / denominator
Iterative Proportional Fitting (IPF)
to ensure consistent results
Special Trick to ensure consistent results
Satellit Calculation Systems for diverse extraction and conversion of the demanded variables
Different Techniques of Regional
Disaggregation & Aggregation
Projection of basic Suryey 2002 by appropiate key variables on regional level

SCORUS-Conference • Shanghai Oct. 2008 9
Are there Alternatives to avoid Deduction of data by Regional Disaggregation ?
Alternatives:
Upgrade Sample Size ?
More Regional Detail from the Sample Survey
itself ?
Effort to Steady /
Stabilize annual data base ?
(to avoid mavericks
in time series)
Answer:
Not feasible because of high costs
involved
No valid results on lower level Even Supplied Regional data provide:
a) plenty of blocked data
b) some problematic results
Apply Sample Survey of each year ! … and Smooth time series
by „EMA“ (Exponential Moving Average)
= „Temporal Aggregation“ Why EMA ?
Well known simple „moving average“ has a problem …
– at the current edge and a problem of
– unsteadiness through former periods

SCORUS-Conference • Shanghai Oct. 2008 10
Why not enlarge the calculations?
To execute the system of calculations for • 85 Core Cities and LCA on behalf of Urban Audit – or for all … • 439 regional units of level NUTS-3 means only a slight increase in effort & expense !
Thus:
It would be reasonable to do it for all regions ! – In oder to generate general improvement of regional data base !
! 85 Core
Cities
(Urban Audit) 439 regional units
(level NUTS-3
+30%
effort
means
+ 500%
data !
Total Effort to provide
439 regional units
(level NUTS-3
439 Regional
Units
(level NUTS-3)

SCORUS-Conference • Shanghai Oct. 2008 11
3rd Example: Turkey: Statistics to be upgraded (here: to be refined)
Task:
Break down
Labour Force
Survey data
(„LFS“ 2004-2007)
from NUTS-2
to NUTS-3
Problem:
Missing Key variables at level NUTS-3 (which were up to date !), as needed for standard disaggregation methods
Supplied only: • Census 2000 [too old !], • Current population projection [no adequate key variable to disaggregate „Labour“ ]
What to do ?

SCORUS-Conference • Shanghai Oct. 2008 12
Way out: Combined Methodical Approach
A „Structural Method“ Use strongly discriminating Structural Variables within LFS: • Urban / Rural • Male / Female
Adaptation & Projection of Census 2000 figures
1) Compare Census 2000 with old LFS 2000, then Adapt Census figures
2) „Disaggregate“ Census 2000 [NUTS-2 to NUTS-3] by „Structural Method“ and Compare with real NUTS-3 results, then derive factors for EACH regional unit (to adjust results of Method A)
C Use register data (for Employed)
as soon as their validity proves to be sufficient for this purpose. Register is being installed in Turkey, but not yet completed. (Problem: Different stage of completeness)
D Efforts to ensure valid data • Use all helpfull techniques
(IPF, Exponent. Moving Average, etc.)
• Lots of data analysis at EACH
step of the Calculation system to ensure consistency to distinguish between regional particularities and mavericks and to identify simple mistakes within your calculation system
Means: Calculate on lower level than requested

SCORUS-Conference • Shanghai Oct. 2008 13
Conclusions
Data IN >> Data OUT
There is more possible Information IN some
national Survey Data than usually pulled OUT
How ? – by special Techniques
There are simple Methods & assistant Techniques
to ensure valid Regional Data
These have to be
• adapted to the challenges of each specific data supply & request
and
• joined to a comprehensive & circumspect system of calculations &
plausibility control
Chance to put into practice ?
Efforts to generate and apply these procedures are rather small,
compared with the expenses for (enlarging) a survey

SCORUS-Conference • Shanghai Oct. 2008 14
Thank you for your attention
Hans Menge
53175 Bonn / Germany
email: [email protected]
Tel. +49 228 317438
… and thank you, Berthold, for the Presentation
… Thank you, • Klaus Trutzel / Germany for supervising German Urban Audit methods and … • Didem Sezer / Turkey for initiating & attending further development of Methods