regional parameterization and applicability of integrated ... · regional parameterization and...
TRANSCRIPT

Pakistan Journal of Meteorology Vol. 8, Issue 15
Regional Parameterization and Applicability of Integrated Flood Analysis System (IFAS) for Flood Forecasting of Upper-Middle Indus River
Abdul Aziz1, Shigenobu Tanaka2
Abstract Pakistan is a flood prone country and suffers from medium to high floods almost every year. The structural countermeasures have been taken time and again but due to destabilized economic condition of the country it is not possible to invest bulk amount of money for the flood control. In this study, an attempt is made to develop the non-structural countermeasures for the downstream reach of the Indus River so that the losses and damages due to flooding could be minimized to the lowest level. The precise and timely flood forecast and warning play vital role in saving the lives and movable properties of the community. An early flood forecast provides sufficient lead time to rescue team and flood fighting agencies for necessary action to protect the embankment. A number of structural and non-structural measures including the Delft Hydraulic flood forecasting model (FEWS) have been adopted for the flood forecasting of the Indus River but the flood 2010 has washed away all of these efforts and demanded for the concrete solution-oriented flood forecasting model. Considering all the previous devastating floods and non-structural measures adopted to mitigate the damages, an attempt has been made to implement the Integrate Flood Analysis System (IFAS) for the flood forecasting of the Indus River. The discharge data of different locations of the Indus River and the corresponding rainfall data of the upper catchment areas have been analyzed especially for the devastating flood 2010 carefully to check the feasibility of IFAS for the flood forecasting of the Indus River. In this study the IFAS has been regionally parameterized for the flood forecasting of the Indus River. This regionally parameterized IFAS has the capability to generate sufficient lead time forecast for the local population of the Indus River. This model is practically helpful for the flood early warning and to save the lives and properties of the community.
Keywords: Flood Forecasting, upper-middle Indus River, IFAS, Parameterization, Pakistan
Introduction The 2010 Pakistan floods, driven by unprecedented monsoon rain, began in late July in the Khyber Pukhtunkhwa, Sindh, Punjab and Balochistan regions of Pakistan and affected the Indus River Basin. Approximately one-fifth of Pakistan's total land area was underwater. Colossal devastation brought a total human death toll of 1,985 with 2,946 injured; affecting approximately 20 million people with over 100,000 square kilometers of area inundated by the flood waters including over 2.1 million hectares cultivated land. Roads, bridges and railway network being the mainstay of communication links were severely damaged besides colossal damages to the housing sector totaling 1.6 million houses. Overall damage is estimated at PKR 855 billion which is 5.8 percent of 2009/10 GDP. Floods submerged 69,000 Square kilometers of Pakistan's most fertile crop land, killed 200,000 livestock and washed away massive amounts of grain (NDMA, Annual Report 2010).
1 [email protected], Pakistan Meteorological Department 2 International Centre for Water Hazard and Risk Management (ICH
21
Figure 1: Study area depicts five gauge stations
ARM), PWRI, Japan.

Regional Parameterization and Applicability of Integrated Flood Analysis System (IFAS) for … Vol. 8
Hazard Scenario Flooding is a common phenomenon every year in Pakistan since last three decades. The impact of natural disasters in Pakistan can be judged by the fact that 6,037 people were killed and 8,989,631 affected in the period from 1993-2002 (IFRCRC, 2003).Disaster caused by natural hazards have played a major hindrance in economic development of Pakistan. The main objective of disaster management is to increase preparedness, provide early warning, monitor the hazard in real time, assess the damage and organize relief activities (Ayanz et al. 1997).
There is a growing consensus that the impacts of climate change may well lead to an increase in both the frequency and magnitude of floods (Kennedy, 2004). Pakistan became flood victim during the years 1950, 1956, 1957, 1973, 1976, 1978, 1988, 1992, 1995, 2001, 2003, 2004, 2005, 2007 and 2010. After the devastating floods of 1973 and 1976, emphasis laid down on the improvement of the forecasting and warning system. In 2003, Sindh province was badly affected when above normal monsoon rainfall caused flooding in the province. At least 484 people died and some 4,476 villages in the province were affected. All the provinces of Pakistan became victim of flooding time to time.
During the flood-2005, more than 30 people killed and over 460,000 people affected. Floods have affected a total of 4791 persons, 74 villages of 4 districts of Sindh. In Punjab 17 persons lost their lives, 963 villages and 405,142 persons were affected, 20,306 houses damaged, 239 cattle lost, and 309,217 acres of crops were destroyed. In KPK, a total of 1,805 houses damaged, out of which 468 destroyed. Standing crops on almost 26,943 acres destroyed. The floods had also damaged water infrastructure and drinking water sources in the most affected areas. Intense storms and a major cyclone at the end of June and early July 2007 caused severe flooding in Pakistan, displacing over 300,000 and affecting more than 2.5 million people. Sindh and coastal Balochistan were affected by Cyclone Yemyin in June and then torrential rains in July and August, while Khyber-Pukhtunkhwa was affected by melting glaciers and heavy rainfall in July and August. At least 130 people died and 2,000 were displaced in Khyber-Pukhtunkhwa in July and 22 people died in August, while 815 people died in Balochistan and Sindh due to flash floods.
In 2010, almost all of Pakistan was affected when massive flooding caused by record breaking rains hit Khyber-Pukhtunkhwa and Punjab. At least 1985 people died in this flood and overall 20 million people were affected by it.
Classification of Hydrological Models Recently, mathematical models have taken over the most important tasks in problem solving in hydrology (UNESCO, 1985). The purpose of developto the requirement and therefore the form of the modeare basically developed for the two purposes of whydrological phenomena and effect of catchment chgeneration of the synthetic sequences of hydrologicalmodels are useful to study the potential impacts of modeling was originated in the 19th century to findesign, land reclamation drainage system design and considered the major parameter of interest. An Irish of rational method for determining flood peak discmethod was modified for the larger catchments in ord
F
22
igure 2: Provincial areas affected by Pakistan Flood 2010
ment of catchment hydrologic models is according l is different in each case. The hydrological models hich one is the understanding of the catchment ange on the phenomena and the other one is the data for use in flood forecasting. The hydrological changes in land use or climate. The rainfall runoff d the solution of problems like reservoir spillway urban sewer design. The design discharge had been engineer, Mulvaney (1850), introduced the concept harge from rainfall depth. During 1920’s rational er to cope with the non uniform distribution in space

Issue 15 Abdul Aziz , Shigenobu Tanaka
and time, rainfall and catchment characteristics. The modified rational method, based on the concept of isochrones, was the first basic rainfall-runoff model dependent upon transfer function. In 1932, Sherman introduced the concept of unit hydrograph on the basis of superposition principle. The unit hydrograph helped to calculate flood peak discharge as well as the whole hydrograph. Actually Conceptual models were originated during the period 1950’s. The unit hydrograph could then be expressed in terms of few parameters to be estimated from catchment characteristics (Parsad, 1967). A large number of conceptual, lumped, rainfall-runoff models appeared thereafter include: Stanford Model IV, Sacramento Model and the Tank Model which represent differently the interconnected subsystems and were considered the leading models of 1960s and 1970s. During 1980s, to fulfill the forecasting requirement i.e. the effects of land use changes, the effects of spatially variable inputs and outputs, the movements of pollutants and sediments, and the hydrological response of ungauged catchments where no data are available for calibration of a lumped model, the physical-based distributed-parameter models were developed. Since the late 1980s macro-scale hydrological models were developed for a variety of operational and planning purposes especially to estimate the variability of water resources over larger areas at a spatial resolution and the sources of pollutions leading to streams. The hydrologic models can be variously classified. One of the classification methods used by Singh is used here which distinguishes hydrologic models as material and sy
DISTRIBUTED
MATHEMATICALNON MATHEMATICAL
SYMBOLIC MATERIALS
RUNOFF MODELS
THEORETICALCONCEPTUALEMPIRICAL
ANALOGLABORATORY
LUMPED
TIME VARIANTTIME INVARIANT
NON LINEAR LINEAR
F )
Regional Parameterization of HydrologicalThe use of hydrological models in ungauged sitesmore important issue in hydrological study. Thevalues of the hydrological models for any/everywithout a need of calibration or “tune” the model the model parameters to catchment characteristicregionalization study, the following principle is im
The parameter classes (soil types, vegetation typebe selected so that it becomes easy, in an objectivebe evaluated which parameters can be assessedcalibration. The number of real calibration paramethodological points of view.
The methods of regional parameterization A number of regionalization methods have been classified into two categories: point estimation mdiscuss only the former one.
igure 3: Classification of hydrological models (Singh, 1988
mbolic or formal as shown in figure 3.
Models and in large geographical regions becomes a more and aim of regionalization study is to estimate parameter grid cell, sub-catchment or large geographic region
to get the best fit. Regionalization methods aim to relate s and/or geographical location. To be successful in the portant:
s, climatologically zones, geological layers, etc.) should way, to associate parameter values. It should explicitly
from field data alone and which need some kind of meters should be kept little, both from practical and
reported in the hydrological literature, which might be ethods and interval estimation methods; here we will
23

Regional Parameterization and Applicability of Integrated Flood Analysis System (IFAS) for … Vol. 8
Point estimation methods The point estimation methods intend to provide unique value of each parameter for the ungauged catchment in case of lumped models or for each regular grid cell in case of distributed models. The point estimation methods usually do not take into consideration of parameter uncertainty. It is noted here that in order to have better chance of success in the regionalization study it is important to list some basic requirements on the model, the model parameters and the catchments.
First, to have meaningful statistical regression analysis, the number of gauged catchments used to optimized model parameters and establish regression equations should be more than 20, in any case not less than 10. Second, the number of parameters that needs to be regionalized should be kept to minima, i.e. the principle of parsimony is important in the analysis. Third, the automatic optimization technique should be used in order to get unique and repeatable value for each parameter in each gauged catchment. With manual calibration, every person who calibrates the model will get different values for the same parameter on the same catchment and one never knows which value should be used in the regression analysis. Four, most regionalization methods assume that model parameters are independent and identically distributed for all catchments. Methods of statistical analysis of parameter values should be performed in order to test the hypothesis, i.e., whether they are uncorrelated, identically distributed and statistically significant.
The proxy basin method The proxy basin method for testing the geographic transferability of the hydrological models is used for any model that is assumed to be geographically transferable within a region hydrologic and climatically homogeneous. If the goal is to simulate stream flow for an ungauged basin C, then the model to be used should be calibrated on basin A and validated on basin B and vice versa. Only if both proxy-basin tests are acceptable should one consider the model as geographically transferable (Klemes, 1986). The proxy basin test has been the most common regionalization method. The main problems of the method include: (1) it is not possible to have any idea on the error of estimation on both parameter values and stream flow simulations, (2) it is not easy to determine the degree of similarity between the ungauged catchment and the reference catchments, (3) if there do not exist gauged catchments at the region the method is not useful.
Study Area The upper-middle Indus River has been discussed in this study with catchment area 467, 136 square kilometers and length about 2, 100 kilometers. The river's estimated annual flow stands at around 207 cubic kilometers, making it the twenty-first largest river in the world in terms of annual flow. It drains four countries including Afghanistan, China, India and Pakistan and its trans-boundary catchment area spans over these four countries. The river originates in the Tibetan Plateau of western China in the vicinity of Lake Mansarover in Tibet and snakes through the Ladakh district of Jammu and Kashmir, province of India. It enters Pakistan via northern areas flowing through the north in a southerly direction along the entire length of Pakistan and finally merges into the Arabian Sea
F s
24
igure 4: Catchment Area spans over four countrie
.

Issue 15 Abdul Aziz , Shigenobu Tanaka
Data There are nineteen rainfall stations in the selected upper-middle Indus River. The daily rainfall data for the period from June 15 to Sep 30 for the three consecutive flood seasons (2008-2010) have been collected from Pakistan Meteorological Department. The daily rainfall data then converted into two hourly rainfall data by the liner interpolation method. Global Satellite Mapping of Precipitation (GSMaP) hourly rainfall data are used for the period from June 15 to Sep 30 for the consecutive three flood seasons (2008-2010) in Pakistan. The hourly GSMaP data then converted into two hourly by using the IFAS function (Project time interval). The 3B42RT three hourly rainfall data, after converting it into two hourly data by using the IFAsame period. The specifications of the both satellite
Table 1: SpecificatProduct Name GSMaP_NR
Resolution 0.10 (L=11 km, A=
Resolution Time 1 (hour)
Coverage 600N-600S
Time Lag 4 (hours)
Coordinate System WGS
Historical Data Dec 2007
Developer and Provider JAXA/EOR
Sensors TRMM/TMIAqua/AMSII/AMSRSSM/IIRA
Objective of the Study The specific objectives of the study are; Firstly, t(IFAS) and make it applicable for the flood forecforecast the peak travel time or peak delay timdownstream population of the upper-middle Indus R
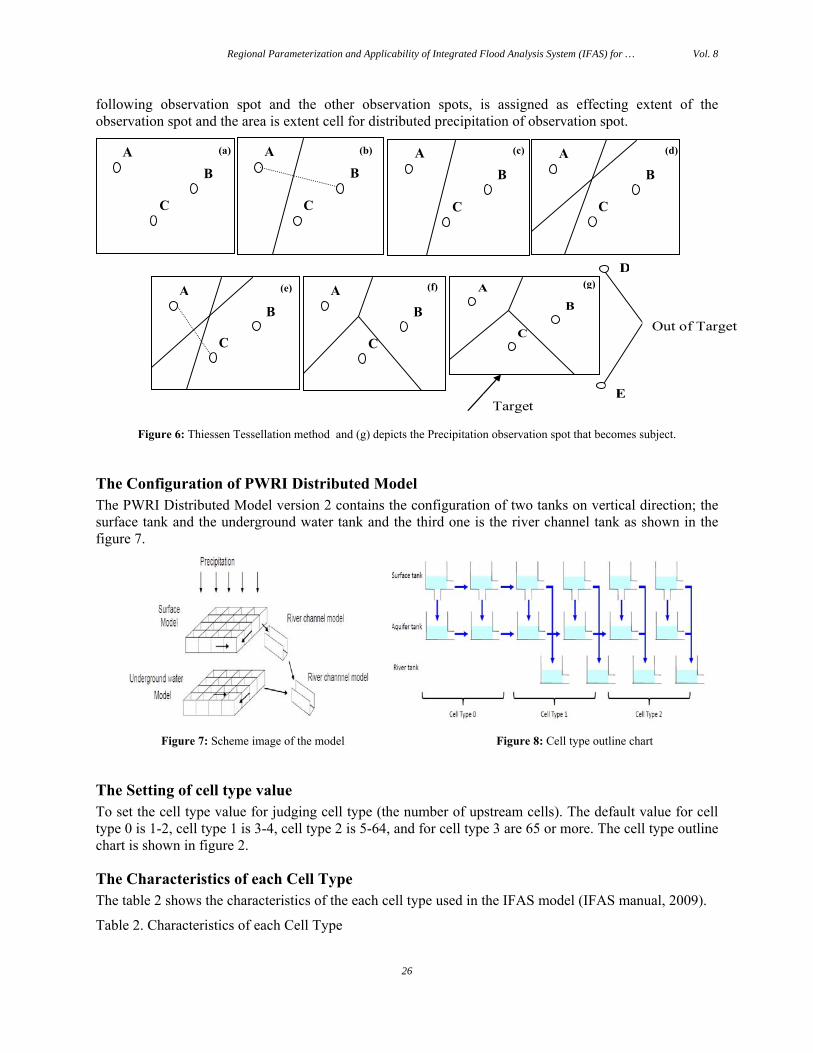
Estimation of missing data The rainfall stations are sparsely located in the ccontains a few and the Himalayan portion has almomade by comparing the data from nearby rain gaufor this job. There are three observatories (A, B anhas to be made uniform or estimate the missing rainknown while the rainfall data of observatory C has the target area as shown in the figure 6(g). Accalculation is the area which is surrounded by two
Figure 5: Rainfall stations in the study area
S project time interval function, have been used for the data are shown in the Table 1 (IFAS manual, 2009). ions of the Satellite data T 3B42RT
120 km2) 0.250 (L=25 km, A=600 km2)
3 (hours)
600N-600S
10 (hours)
WGS
Dec 1997
C NASA/GSFC
R-EADEOS MSU-B
TRMM/TMIAqua/AMSR-EAMSU-BDMSP/SSM/IIR
o parameterize the Integrated Flood Analysis System asting of the upper-middle Indus River. Secondly, to e from the parameterized IFAS for the vulnerable iver.
atchment area. The uppermost part of the study area st no rainfall station. The estimation of missing data is ge stations. Thiessen Tessellation method is employed d C) inside the target area whose rainfall distribution fall data. The rainfall data of observatories A and B is
to be determined. The observatories D and E are out of cording to Thiessen Tessellation, grid precipitation perpendiculars and two bisector line between one of
25
Regional Parameterization and Applicability of Integrated Flood Analysis System (IFAS) for … Vol. 8
following observation spot and the other observation spots, is assigned as effecting extent of the observation spot and the area is extent cell for distributed precipitation of observation spot.
A
C
B
A
C
B
A
C
B
A
C
B
A
C
B
Target
Out of Target
D
E
A
C
B
A
C
B
(g) (f)(e)
(d)(c)(b)(a)
Figure 6: Thiessen Tessellation method and (g) depicts the Precipitation observation spot that becomes subject.
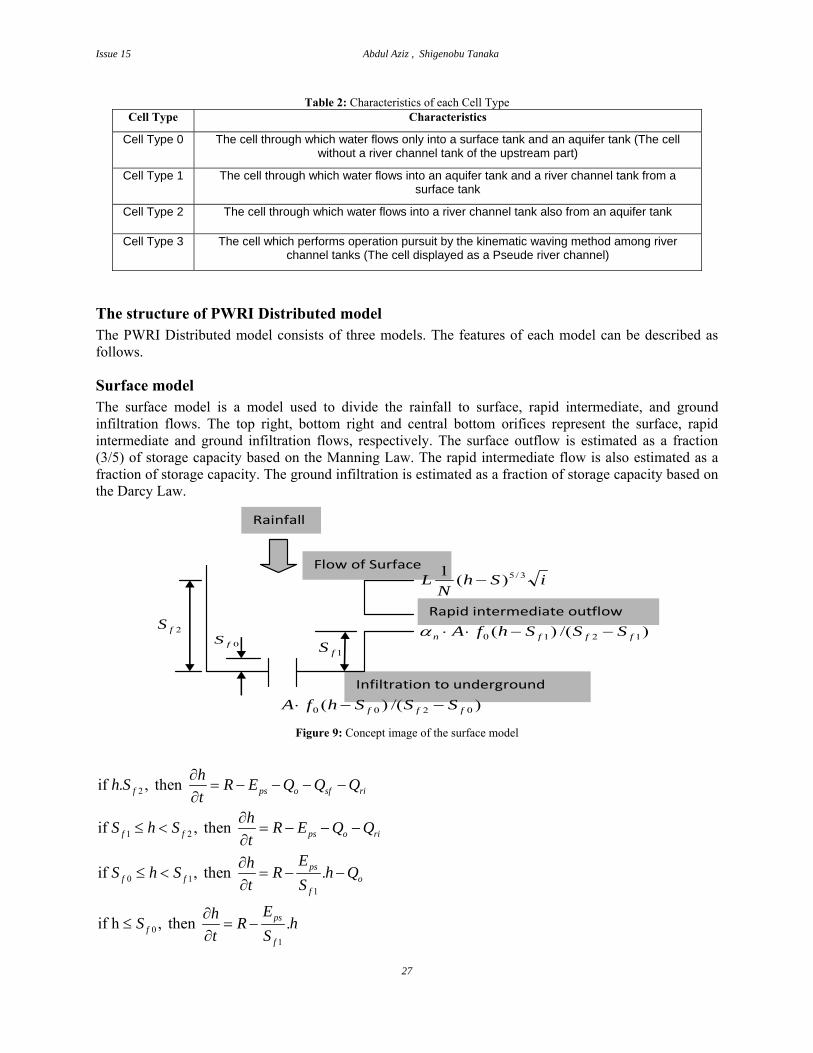
The Configuration of PWRI Distributed Model The PWRI Distributed Model version 2 contains the configuration of two tanks on vertical direction; the surface tank and the underground water tank and the third one is the river channel tank as shown in the figure 7.
Figure 7: Scheme image of the model Figure 8: Cell type outline chart
The Setting of cell type value To set the cell type value for judging cell type (the number of upstream cells). The default value for cell type 0 is 1-2, cell type 1 is 3-4, cell type 2 is 5-64, and for cell type 3 are 65 or more. The cell type outline chart is shown in figure 2.
The Characteristics of each Cell Type The table 2 shows the characteristics of the each cell type used in the IFAS model (IFAS manual, 2009).
Table 2. Characteristics of each Cell Type
26
Issue 15 Abdul Aziz , Shigenobu Tanaka
Table 2: Characteristics of each Cell Type Cell Type Characteristics
Cell Type 0 The cell through which water flows only into a surface tank and an aquifer tank (The cell without a river channel tank of the upstream part)
Cell Type 1 The cell through which water flows into an aquifer tank and a river channel tank from a surface tank
Cell Type 2 The cell through which water flows into a river channel tank also from an aquifer tank
Cell Type 3 The cell which performs operation pursuit by the kinematic waving method among river channel tanks (The cell displayed as a Pseude river channel)
The structure of PWRI Distributed model The PWRI Distributed model consists of three models. The features of each model can be described as follows.
Surface model The surface model is a model used to divide the rainfall to surface, rapid intermediate, and ground infiltration flows. The top right, bottom right and central bottom orifices represent the surface, rapid intermediate and ground infiltration flows, respectively. The surface outflow is estimated as a fraction (3/5) of storage capacity based on the Manning Law. The rapid intermediate flow is also estimated as a fraction of storage capacity. The ground infiltration is estimated as a fraction of storage capacity based on the Darcy Law.
Rainfall
Flow of Surface
Rapid intermediate outflow
Infiltration to underground
)/()( 1210 fffn SSShfA −−⋅⋅α
)/()( 0200 fff SSShfA −−⋅
iShN
L 3/5)(1−
1fS0fS2fS
Figure 9: Concept image of the surface model
2
1 2
0 11
01
if . , then
if , then
if , then .
if h , then .
f ps o sf ri
f f ps
psf f
f
psf
f
hh S R E Q Q Qt
hS h S R E Q Qt
EhS h S R h Qt S
EhS R ht S
∂= − − − −
∂∂
≤ < = − − −∂∂
≤ < = − −∂
∂≤ = −
∂
o ri
o
27

Regional Parameterization and Applicability of Integrated Flood Analysis System (IFAS) for … Vol. 8
Where, R: Rainfall; Sf2: Height where surface flow occurs; Qsf : Surface outflow
Sf1: Height where intermediate outflow occurs; Qri: Fast intermediate outflow
Sf0: Height where ground infiltration occurs; Eps: Evapotranspiration
Qo: Infiltration for infiltrate model; h: Storage height for model
Surface Parameters The surface parameters used in this study have been shown in the table 3.
Table 3: Surface parameters used for upper-middle Indus River
Para
met
er
Def
ault
Tune
d
Final infiltration
capacity
fo(cm/s)
Maximum storage height
Sf2(m)
Rapid intermediate
flow
Sf1(m)
Height where ground
infiltration occurs
Sf0(m)
Surface roughness coefficient
N(m-1/3)
Rapid intermediate
flow regulation coefficient
αn
Initial storage height
(m)
1 0.0005 0.1 0.01 0.005 0.7 0.8 0
2 0.00002 0.05 0.01 0.005 2 0.6 0
3 0.00001 0.05 0.01 0.005 2 0.5 0
4 0.000001 0.001 0.0005 0.0001 0.1 0.9 0
5 0.00001 0.05 0.01 0.005 2 0.5 0
1 0.00001 0.06 0.01 0.002 1 0.15 0
2 0.00002 0.08 0.01 0.002 3 0.2 0
3 0.00001 0.09 0.01 0.005 3.5 0.3 0
4 0.000001 0.05 0.0005 0.0001 2.1 0.25 0
5 0.000001 0.09 0.01 0.005 4.5 0.3 0
Groundwater Tank The configuration of groundwater model is shown as figure 10. The top right and bottom right orifices represent the unconfined and confined groundwater flows, respectively. Outflow of ground water is considered as a fraction of confined ground water to h, and of unconfined groundwater to h2.
1 2
1 2
if , then
if , then
g in g g
g in g g
hh S Q Q Qt
hh S Q Q Qt
∂≥ = −
∂
∂< = −
∂
−
−
Unconfined groundwater flow
Confined groundwater flow AhAg ⋅⋅
gS
AShA gu ⋅−⋅ 22 )(
F
igure 10: Concept image of the groundwater model
28

Issue 15 Abdul Aziz , Shigenobu Tanaka
Where, Sg: Height where unconfined groundwater outflow occurs
Qin: Inflow from infiltration mode; Qg1: Unconfined groundwater outflow
h: Storage height of model; Qg2: Unconfined and confined groundwater outflow
Aquifer Parameters The aquifer parameters used in this study have been shown in the table 4.
Table 4: Aquifer parameters used for upper-middle Indus River
Parameters AUD
(1/mm/day)1/2
AGD
(1/day)
HCGD
(m)
HIGD
(m)
Default 0.1 0.003 2 2
Tuned 0.2 0.0003 2 2
River Channel Model The configuration of river channel model is shown in figure 11. Outflow is based on Manning equation.
Flow of river channel
Qin
ihh
B 3/51
in rhLB Q Qt
∂= −
∂
Figure 11: Concept image of the river channel model
Where, Qr: Outflow of river channel ; L: Length of river channel; B: Breadth of river channel
Qin: Inflow from ground water and upstream river channel models
29

Regional Parameterization and Applicability of Integrated Flood Analysis System (IFAS) for … Vol. 8
River Tank Parameters The river parameters used in this study are shown in the table 5.
Table 5: River tank parameters used for upper-middle Indus River Constant of
the Resume Law
Constant of the
Resume Law
Manning
roughness
coefficient
Initial water table
of river chann
el
Infiltration of Aquifer tank
Coefficient of cross shape
(RHW)
Coefficient of cross shape (RHS)
Coefficient of cross shape (RBH)
Coefficient of cross shape
(RBET)
Coefficient of cross shape
(RLCOF)
Para
met
ers
c s n (m1/3/
s)
(m) (1/day) non-dim
non-dim
non-dim
non-dim non-dim
1 7 0.5 0.035 0.2 0 9999 1 0.5 0.05 1.4
2 7 0.5 0.035 0.2 0 9999 1 0.5 0.05 1.4
Def
ault
3 7 0.5 0.035 0.2 0 9999 1 0.5 0.05 1.4
1 7 0.5 0.038 0.2 0 9999 1 0.5 0.05 1.4
2 7 0.5 0.037 0.2 0 9999 1 0.5 0.05 1.4
Tun
ed
3 7 0.5 0.036 0.2 0 9999 1 0.5 0.05 1.4
Objective Function Efficiency criteria (objective function) are defined as mathematical measures of how well a model simulation fits the available observations (Beven, 1999). Krause (Krause et al, 2005) mentioned the reason of evaluation of model as, to provide a means for evaluating improvements to the modeling approach through adjustment of model parameters values, model structural modifications, the inclusion of additional observational information, and representation of important spatial and temporal characteristics of watershed. The performance of the IFAS model can be evaluated by three indices like wave shape error, volume error and peak discharge error which are defined by the Japan Institute of Construction Engineering (JICE). The each and every indicator can be described as shown in the table 6.
Table 6: Indicators for the error analysis of IFAS Wave Shape Error Volume Error Peak Discharge Error
∑=
⎟⎟⎠
⎞⎜⎜⎝
⎛ −=
n
i iO
iCiOw Q
QQn
E1
2
)(
)()(1
∑
∑∑
=
==
−= n
iiO
n
iiC
n
iiO
v
Q
QQE
1)(
1)(
1)(
OP
CPOPP Q
QQE −=
Where, E, EW, Ev and Ep represent Error, Wave Shape Error, Volume Error and Peak Discharge Error respectively; n: The number of calculating time
QO(i): Measured run-off at time I; QC(i): Calculated run-off at time I
QOP: Calculated maximum run-off; QOP: Measured maximum run-off
30
Issue 15 Abdul Aziz , Shigenobu Tanaka
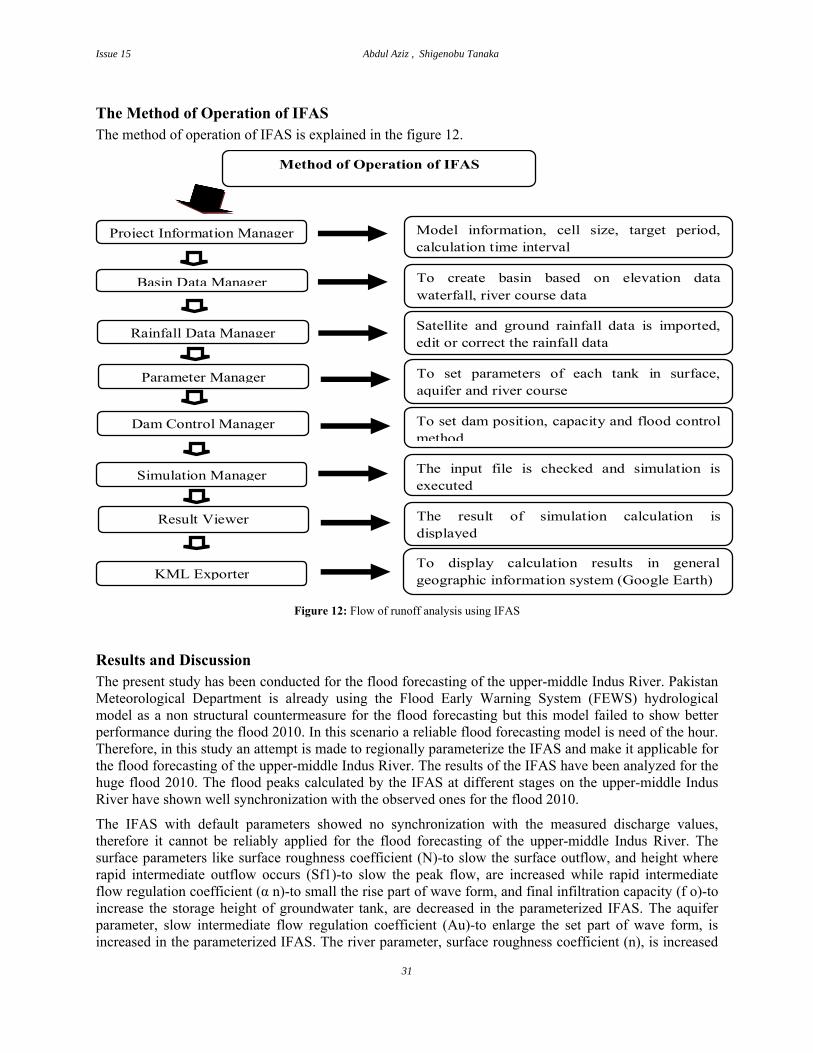
The Method of Operation of IFAS The method of operation of IFAS is explained in the figure 12.
Project Information Manager
Basin Data Manager
Simulation Manager
Rainfall Data Manager
Parameter Manager
Dam Control Manager
KML Exporter
Result Viewer
Model information, cell size, target period, calculation time interval
To create basin based on elevation data waterfall, river course data
The input file is checked and simulation is executed
To display calculation results in general geographic information system (Google Earth)
To set dam position, capacity and flood control method
The result of simulation calculation is displayed
Satellite and ground rainfall data is imported, edit or correct the rainfall data
To set parameters of each tank in surface, aquifer and river course
Method of Operation of IFAS
Figure 12: Flow of runoff analysis using IFAS
Results and Discussion The present study has been conducted for the flood forecasting of the upper-middle Indus River. Pakistan Meteorological Department is already using the Flood Early Warning System (FEWS) hydrological model as a non structural countermeasure for the flood forecasting but this model failed to show better performance during the flood 2010. In this scenario a reliable flood forecasting model is need of the hour. Therefore, in this study an attempt is made to regionally parameterize the IFAS and make it applicable for the flood forecasting of the upper-middle Indus River. The results of the IFAS have been analyzed for the huge flood 2010. The flood peaks calculated by the IFAS at different stages on the upper-middle Indus River have shown well synchronization with the observed ones for the flood 2010.
The IFAS with default parameters showed no synchronization with the measured discharge values, therefore it cannot be reliably applied for the flood forecasting of the upper-middle Indus River. The surface parameters like surface roughness coefficient (N)-to slow the surface outflow, and height where rapid intermediate outflow occurs (Sf1)-to slow the peak flow, are increased while rapid intermediate flow regulation coefficient (α n)-to small the rise part of wave form, and final infiltration capacity (f o)-to increase the storage height of groundwater tank, are decreased in the parameterized IFAS. The aquifer parameter, slow intermediate flow regulation coefficient (Au)-to enlarge the set part of wave form, is increased in the parameterized IFAS. The river parameter, surface roughness coefficient (n), is increased
31

Regional Parameterization and Applicability of Integrated Flood Analysis System (IFAS) for … Vol. 8
in the parameterized IFAS. The observed discharge data of Tarbela for 30.7.2010 and Kabul from 29.7.2010 to 7.8.2010 are missing therefore there is disruption in the hydrograph. The flood peak happened in the missing data period in case of Kabul at Nowshera. The PMD estimated the value of peak discharge as 14000 m3/s and is represented by the symbol star. The results of Tarbela for each and every case are not satisfactory. This may be due to the lack of dam information like flood control method, control start discharge and initial volume etc.
Results of Ground-based Rainfall The upstream rainfall data for the period from June 15 to September 30, 2010 have been analyzed. The IFAS calculated discharge on the basis of ground rainfall. The discharge results of IFAS for Tarbela, Kabul, Kalabagh, Chashma and Taunsa have been shown in the figure 13.
0
1
2
3
4
5
6
7
8
9
100
9000
18000
27000
36000
45000
5/22
6/11
7/1
7/21
8/10
8/30
9/19
10/9
Rai
nfal
l (m
m/2
h)
Disc
harg
e (m
3 /s)
Ground Rainfall
Measured discharge
Calculated discharge
Ground rainfall for Chashma 20100
1
2
3
4
5
6
7
8
9
100
5000
10000
15000
20000
25000
30000
5/22
6/11
7/1
7/21
8/10
8/30
9/19
10/9
Rai
nfal
l (m
m/2
h)
Dis
char
ge (m
3 /s)
Ground rainfall for Kalabagh 2010
Ground Rainfall Calculated discharge Measured discharge
Ground‐based rainfall
Wave shape error
Ew
Volume error
Ev
Peak discharge error Ep
Tarbela 0.130 0.273 0.449Kabul 0.118 ‐0.290 0.105Kalabagh 0.083 ‐0.132 ‐0.124Chashma 0.117 ‐0.210 ‐0.480Taunsa 0.493 ‐0.627 ‐0.858
0
1
2
3
4
5
6
7
8
9
100
10000
20000
30000
40000
50000
60000
5/22
6/11
7/1
7/21
8/10
8/30
9/19
10/9
Rai
nfal
l (m
mm
/2h)
Dis
char
ge (m
3 /s)
Ground rainfall
Calculated discharge
Measured discharge
Ground rainfall for Taunsa 2010
0123456789100
4000
8000
12000
16000
20000
24000
28000
5/22
6/11
7/1
7/21
8/10
8/30
9/19
10/9
Rai
nfal
l (m
m/2
h)
Dis
char
ge (m
3 /s) Ground Rainfall
Calculated discharge Measured discharge
Ground rainfall for Kabul 20100
1
2
3
4
5
6
7
8
9
100
4000
8000
12000
16000
20000
24000
28000
5/22
6/11
7/1
7/21
8/10
8/30
9/19
10/9
Rai
nfal
l (m
m/2
h)
Disc
harg
e (m
3 /s)
Ground rainfall for Tarbela 2010
Ground Rainfall
Calculated discharge
Measured discharge
(f) (e)
(d) (c)
(b) (a)
Figure 13: Results of IFAS for ground-based rainfall for the stations (a) Tarbela (b) Kabul (c) Kalabagh
(d) Chashma (e) Taunsa while the table (f) shows the error analysis of the IFAS.
32

Issue 15 Abdul Aziz , Shigenobu Tanaka
The IFAS captures well the flood duration in almost all the cases. The flood peak calculated by IFAS has well synchronization with the observed ones in case of Kabul and Kalabagh with the error of only 10% and 12% respectively. The wave shape error for Kalabagh and Chashma are 8% and 11% respectively which shows the good agreement with the observed values.
Results of Satellite GSMaP (original) The upstream rainfall data for the period from June 15 to September 30, 2010 have been analyzed. The IFAS calculated discharge by using rainfall data of the Satellite GSMaP (original). The discharge results of IFAS for Tarbela, Kabul, Kalabagh, Chashma and Taunsa have been shown in the figure 14.
GSMaP (original)
Wave shape error Ew
Volume error
Ev
Peak discharge error Ep
Tarbela 0.504 0.717 0.827Kabul 1.327 ‐0.695 0.532Kalabagh 0.382 0.626 0.707Chashma 0.400 0.644 0.719Taunsa 0.290 0.545 0.646
0
1
2
3
4
5
6
7
8
9
100
10000
20000
30000
40000
50000
60000
5/22
6/11
7/1
7/21
8/10
8/30
9/19
10/9
Rai
nfal
l (m
m/2
h)
Disc
harg
e (m
3 /s)
GSMaP (original) Rainfall
GSMaP (original) discharge
Measured discharge
GSMaP (original) for Taunsa 2010
0
1
2
3
4
5
6
7
8
9
100
9000
18000
27000
36000
45000
5/22
6/11
7/1
7/21
8/10
8/30
9/19
10/9
Rai
nfal
l (m
m/2
h)
Disc
harg
e (m
3 /s)
GSMaP (original) Rainfall Measured discharge GSMaP (original) discharge
GSMaP (original) for Chashma 2010
0
1
2
3
4
5
6
7
8
9
100
5000
10000
15000
20000
25000
30000
5/22
6/11
7/1
7/21
8/10
8/30
9/19
10/9
Rai
nfal
l (m
m/2
h)
Disc
harg
e (m
3 /s)
GSMaP (original) Rainfall
GSMaP (original) discharge
Measured discharge
GSMaP (original) for Kalabagh 2010
0123456789100
4000
8000
12000
16000
20000
24000
28000
5/22
6/11
7/1
7/21
8/10
8/30
9/19
10/9
Rai
nfal
l (m
m/2
h)
Disc
harg
e (m
3 /s) GSMaP (original) Rainfall
GSMaP (original) discharge
(e)
(c)
Measured discharge
GSMaP (original) for Kabul 20100
1
2
3
4
5
6
7
8
9
100
4000
8000
12000
16000
20000
24000
28000
5/22
6/11
7/1
7/21
8/10
8/30
9/19
10/9
Rai
nfal
l (m
m/2
h)
Dis
char
ge (m
3 /s)
GSMaP (original) Rainfall GSMaP (original) discharge Measured discharge
GSMaP (original) for Tarbela 2010
(b)
(d)
(f)
(a)
Figure 14: Results of IFAS for the Satellite GSMaP (original) for the stations (a) Tarbela (b) Kabul (c) Kalabagh (d) Chashma and (e) Taunsa while the table (f) shows the error analysis of the IFAS.
33

Regional Parameterization and Applicability of Integrated Flood Analysis System (IFAS) for … Vol. 8
The wave shape error, volume error and peak discharge error for GSMaP (original) have been shown in the table (f). The Satellite GSMaP (original) has captured neither the flood peak nor the flood duration in almost all the cases. Whenever the flood peak starts, the GSMaP (original) discharge goes straight showing no signal to the flood peak and flood duration.
Results of Satellite GSMaP (corrected) The upstream rainfall data for the period from June 15 to September 30, 2010 have been analyzed. The IFAS calculated discharge by using rainfall data of the Satellite GSMaP (corrected). The discharge results of IFAS for Tarbela, Kabul, Kalabagh, Chashma and Taunsa have been shown in the figure 15.
(a) (b)
(c) (d)
0
1
2
3
4
5
6
7
8
9
100
4000
8000
12000
16000
20000
24000
28000
5/22
6/11
7/1
7/21
8/10
8/30
9/19
10/9
Rin
fall
(mm
/2h)
Dis
char
ge (m
3 /s)
GSMaP (corrected) Rainfall
GSMaP (corrected) discharge
Measured discharge
GSMaP (corrected) for Kabul 20100
1
2
3
4
5
6
7
8
9
100
4000
8000
12000
16000
20000
24000
28000
5/22
6/11
7/1
7/21
8/10
8/30
9/19
10/9
Rai
nfal
l (m
m/2
h)
Disc
harg
e (m
3 /s)
GSMaP (Corrected) for Tarbela 2010
GSMaP (corrected) Rainfall
Measured discharge
GSMaP (corrected) discharge
0
1
2
3
4
5
6
7
8
9
100
9000
18000
27000
36000
45000
5/22
6/11
7/1
7/21
8/10
8/30
9/19
10/9
Rai
nfal
l (m
m/2
h)
Disc
harg
e (m
3 /s)
GSMaP (corrected) rainfall
Measured discharge
GSMaP (corrected) discharge
GSMaP (corrected) for Chashma 20100
1
2
3
4
5
6
7
8
9
100
5000
10000
15000
20000
25000
30000
5/22
6/11
7/1
7/21
8/10
8/30
9/19
10/9
Rai
nfal
l (m
m/2
h)
Dis
char
ge (m
3 /s)
GSMaP (corrected) Rainfall
GSMaP (corrected) discharge
Measured discharge
GSMaP (corrected) for Kalabagh 2010
GSMaP (corrected)
Wave shape error
Ew
Volume error
Ev
Peak discharge error Ep
Tarbela 0.260 0.488 0.481Kabul 3.705 ‐1.565 0.027Kalabagh 0.027 0.091 ‐0.040Chashma 0.064 0.136 ‐0.010Taunsa 0.080 ‐0.164 ‐0.217
0
1
2
3
4
5
6
7
8
9
100
10000
20000
30000
40000
50000
60000
5/22
6/11
7/1
7/21
8/10
8/30
9/19
10/9
Rai
nfal
l (m
m/2
h)
Dis
char
ge (m
3 /s)
GSMap (corrected) rainfall
GSMaP (corrected) discharge
Measured discharge
GSMaP (corrected) for Taunsa 2010
(f) (e)
Figure 15: Results of IFAS for the Satellite GSMaP (corrected) for the stations (a) Tarbela (b) Kabul (c) Kalabagh (d) Chashma and (e) Taunsa while the table (f) shows the error analysis of the IFAS.
34
Issue 15 Abdul Aziz , Shigenobu Tanaka
The flood peak and flood duration captured by the satellite GSMaP (corrected) have well synchronization with the observed ones in almost all the cases. The peaks calculated by GSMaP (corrected) for Kabul, Kalabagh and Chashma have errors of only 2%, 4% and 1% respectively which show the best results of the satellite. The very little volume errors of 2%, 6% and 8% have been observed for Kalabagh, Chashma and Taunsa respectively. The error analysis shows the best results by the satellite GSMaP (corrected).
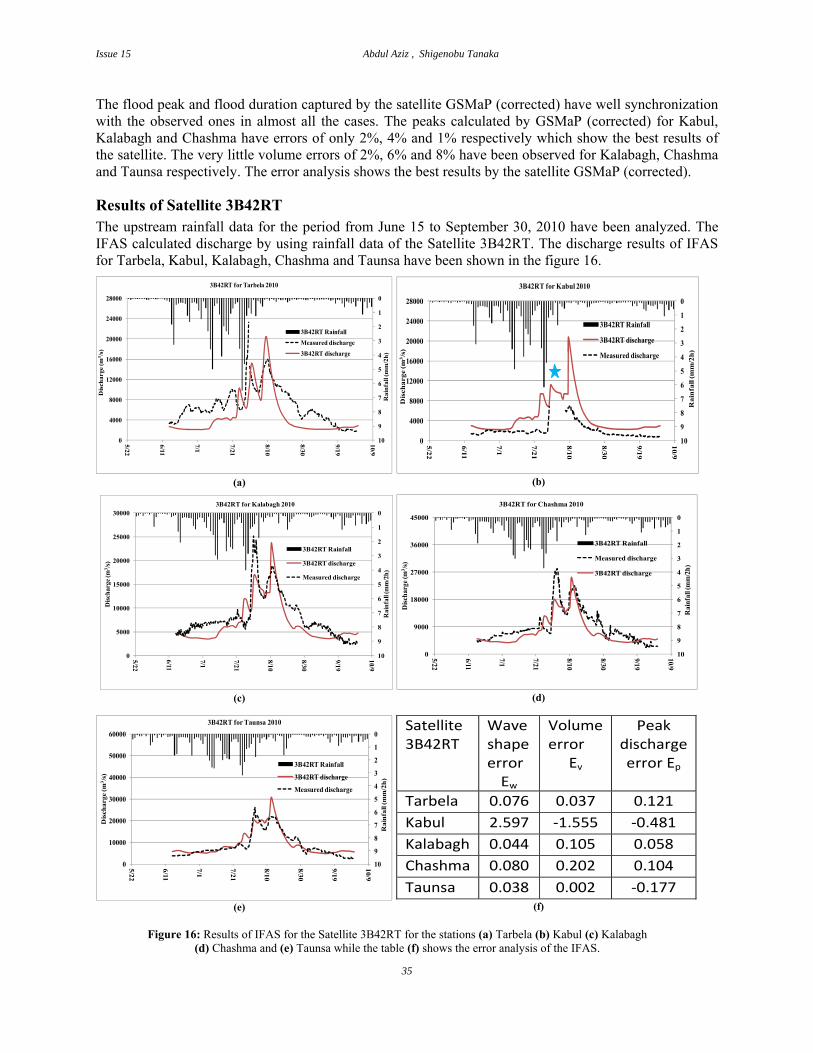
Results of Satellite 3B42RT The upstream rainfall data for the period from June 15 to September 30, 2010 have been analyzed. The IFAS calculated discharge by using rainfall data of the Satellite 3B42RT. The discharge results of IFAS for Tarbela, Kabul, Kalabagh, Chashma and Taunsa have been shown in the figure 16.
0
1
2
3
4
5
6
7
8
9
100
4000
8000
12000
16000
20000
24000
28000
5/22
6/11
7/1
7/21
8/10
8/30
9/19
10/9
Rai
nfal
l (m
m/2
h)
Dis
char
ge (m
3 /s)
3B42RT Rainfall
3B42RT discharge
Measured discharge
3B42RT for Kabul 20100
1
2
3
4
5
6
7
8
9
100
4000
8000
12000
16000
20000
24000
28000
5/22
6/11
7/1
7/21
8/10
8/30
9/19
10/9
Rai
nfal
l (m
m/2
h)
Disc
harg
e (m
3 /s)
3B42RT for Tarbela 2010
3B42RT Rainfall Measured discharge 3B42RT discharge
0
1
2
3
4
5
6
7
8
9
100
9000
18000
27000
36000
45000
5/22
6/11
7/1
7/21
8/10
8/30
9/19
10/9
Rai
nfal
l (m
m/2
h)
Disc
harg
e (m
3 /s)
3B42RT Rainfall
Measured discharge
3B42RT discharge
3B42RT for Chashma 20100
1
2
3
4
5
6
7
8
9
100
5000
10000
15000
20000
25000
30000
5/22
6/11
7/1
7/21
8/10
8/30
9/19
10/9
Rai
nfal
l (m
m/2
h)
Disc
harg
e (m
3 /s)
3B42RT Rainfall
3B42RT discharge
Measured discharge
3B42RT for Kalabagh 2010
Satellite 3B42RT
Wave shape error Ew
Volume error
Ev
Peak discharge error Ep
Tarbela 0.076 0.037 0.121Kabul 2.597 ‐1.555 ‐0.481Kalabagh 0.044 0.105 0.058Chashma 0.080 0.202 0.104Taunsa 0.038 0.002 ‐0.177
0
1
2
3
4
5
6
7
8
9
100
10000
20000
30000
40000
50000
60000
5/22
6/11
7/1
7/21
8/10
8/30
9/19
10/9
Rai
nfal
l (m
m/2
h)
Dis
char
ge (m
3 /s)
3B42RT Rainfall
3B42RT discharge
Measured discharge
3B42RT for Taunsa 2010
(f) (e)
(d) (c)
(b) (a)
F
igure 16: Results of IFAS for the Satellite 3B42RT for the stations (a) Tarbela (b) Kabul (c) Kalabagh (d) Chashma and (e) Taunsa while the table (f) shows the error analysis of the IFAS.35

Regional Parameterization and Applicability of Integrated Flood Analysis System (IFAS) for … Vol. 8
The Satellite 3B42RT captured the flood duration well in almost all the cases. The Satellite 3B42RT showed the underestimated discharge values for the first flood peak and overestimated values for the second flood peak in almost all the cases. The flood peaks calculated by 3B42RT with the errors of only 5%, 10% and 17% for the stations Kalabagh, Chashma and Taunsa respectively which show the good agreement with the observed values. The wave shape errors and volume errors for this satellite are also negligible small.
Travel time forecast of flood wave in the Indus River In this study an attempt has also been made to find out the travel time forecast for the upper-middle Indus River. The travel time forecast is very important in the context of the flood early warning. A reliable flood early warning system requires accurate travel time forecast. The flood forecasting system has been developed to provide flood warning for the upper-middle Indus River downstream of Tarbela dam. Most of the forecasting points in the Indus forecasting system are sufficiently far downstream and warnings can be issued primarily on the basis of observed upstream flows. The travel time for the Indus River downstream of Tarbela dam has been calculated on the basis of GSMaP (corrected) data for the flood-2010. The travel time of the peak from its extreme point of origin to the end point of the study area has been calculated in this study. This calculation provides an idea about the time taken by the flood peak to travel from forecasting point (Tarbela) to the end point of the study area (Taunsa). Flood water passes through Kalabagh earlier, therefore people get even less than 18 hours. If we do not use the flood forecasting model, people rely on communication from flood observation at Tarbela station and ultimately they will not get enough time to prepare themselves to save their lives and movable properties during flooding.
The travel time forecast from Tarbela to downstream Taunsa is shown in figure 17(a) with the help of measured discharge and in fig 17(b) by using GSMaP (corrected).
0
7000
14000
21000
28000
35000
Disc
harg
e (m
3 /s)
Travel Time Forecast of Peak by GSMaP (corrected)
Discharge at Tarbela Discharge at Kalabagh Discharge at Chashma Discharge at Taunsa
0
7000
14000
21000
28000
35000
Disc
harg
e (m
3 /s)
Travel Time of Peak by Measured Discharge
Discharge at TarbelaDischarge at KalabaghDischarge at ChashmaDischarge at Taunsa
(b) (a)
Figure 17: Travel time forecast (a) by measured discharge and (b) with the help of GSMaP (corrected)
The observed peak time and forecasted peak time on each point have relatively better agreement. The travel time is calculated considering the Tarbela as reference point.
Table 7: Peak travel time forecast from Tarbela to downstream Taunsa Location Chainage (km) Travel Time by Measured
Discharge (hrs) Travel Time by GSMaP-corrected
(hrs)
Tarbela dam 0 0 0
Kalabagh barrage 210 18 22
Chashma barrage 268 78 30
Taunsa barrage 505 90 68
36

Issue 15 Abdul Aziz , Shigenobu Tanaka
Conclusion The IFAS is used to calculated discharge on the basis of ground rainfall. The results of calculated discharge for all the cases show well agreement with the measured one. The calculated discharge in each and every case is well synchronized with the measured one both in terms of flood peak and flood duration. The calculation results of the Satellite GSMaP (original) have low signal for each and every case. The Satellite GSMaP (original) neither captures the flood duration nor does the flood peak. The Satellite GSMaP with corrected rainfall, by using the ICHARM’s method for correction of rainfall data, shows the best calculation results for each and every case. The discharge calculated by the Satellite GSMaP (corrected) is well synchronized with the measured discharge. This satellite shows the best results while calculating the huge and colossal Pakistan flood 2010. The flood duration and flood peak calculated by the Satellite GSMaP (corrected) have the best agreement with the observed ones. The Satellite 3B42RT captured the flood duration well for most of the cases but for the flood peak its behavior is a little bit different. In case of Pakistan flood 2010, the Satellite 3B42RT captured the first peak with low discharge value but the second peak with exaggerated high value as compared to the observed one. Therefore, the Satellite 3B42RT has well synchronization in terms of flood duration and if there is a secondary flood peak it shows extraordinary high value.
Recommendation The IFAS (GSMaP-corrected) can be used for the flood forecast of the upper-middle Indus River. The results of the IFAS (GSMaP_ corrected) for the flood 2010 are, no doubt, very good but the Satellite 3B42RT and GSMaP (original) may still need to be improved. The mechanism can be developed for the modification of the rainfall data of Satellite 3B42RT. The results of GSMaP (corrected) even can be made more accurate by tuning different parameters. The present study can also be enhanced to the entire Indus River Basin.
Acknowledgement I am extremely excited to pick the opportunity for expressing my solemn gratitude to Prof. Shigenobu Tanaka, Deputy Director, International Centre for Water Hazard and Risk Management (ICHARM) under the auspicious of UNESCO, Public Works Research Institute, Tsukuba, Ibaraki, Japan for his overall supervision, invaluable suggestions and passionate encouragement in every aspect of my work by sharing experiences from his wide wisdom.
References Ayanz, J.; Verstrate M.; Pinty, B.; Meyer-Roux, J.; Schmuck, G. (1997) ‘The use of Existing and Future Remote Sensing System in Natural Hazard Management Specifications and Requirements. Available at http//natural- hazards.jrs.it/documents/fires/1997-presentations/enarmors.pdf.
Beven, K.J. (1999).Rainfall-Runoff Modeling (The Primer). Lancester. UK: John Wiley & Sons, LTD.
IFRCRC (2003) World Disaster Report 2003.Geneva: International Federation of the Red Cross and Red Crescent Societies.
Kennedy, D. (2004) ‘Climate Change and Climate Science’. In Science, 304: 1565.
Klemes, V., 1986. Operational testing of hydrological simulation models, Hydrol. Sc. J., 31: 13-24.
Krause, P., Boyle, D.P., & Base, F. (2005).Comparison of Different Efficiency Criteria for Hydrological Model Assessment.
National Disaster Management Authority (NDMA), annual report 2010. Available at http://www.ndma.gov.pk/.
37

Regional Parameterization and Applicability of Integrated Flood Analysis System (IFAS) for … Vol. 8
PWRI Techinical Note No.4148, ICHARM Publication No.14, IFAS Version 1.2, user’s manual June 2009.
Prasad, R., 1967. A non linear hydrologic system response model. J. Hydraul. Div., ASCE HY4.
United Nations Educational, Scientific and Cultural Organization (UNESCO), Courier, Internet Newsletter, October 2001 Ed.
38