regional planning partnership/ planners committee · regional planning partnership / planners...
TRANSCRIPT

Sacramento Area Council of Governments
1415 L Street, Suite 300 Sacramento, CA 95814
tel: 916.321.9000 fax: 916.321.9551 tdd: 916.321.9550 www.sacog.org
Regional Planning Partnership / Planners Committee
Wednesday February 25, 2015, 2:00 p.m. – 4:00 p.m. Board Room (please note room change)
Teleconference Information: Dial-in #: 888-431-3598
Access Code: 8547312801
1. Introductions and Information Sharing a. State Funding Updates: Cap-and-Trade sub-programs, Active Transportation Program (Ms. Devere-Oki) b. SACTrak 2.0 Training Sessions (Mr. Cáceres) c. SACOG Delivery Plan Tier 2 Projects (Mr. Shelton)
2. Approve January 28, 2015 Action Summary ◄ Ms. Cacciatore 3. Update on Eastern Solano Projects of Air Quality Concern (Mr. Jones) 4. Project Level Conformity Working Group Update (Mr. Cáceres) 5. Draft Frameworks for Regional Funding Programs (Ms. Devere-Oki) 6. 2036 Discussion Draft Preferred Scenario Preliminary VMT Results
(Mr. Griesenbeck) 7. 2016 Metropolitan Transportation Plan/Sustainable Communities Strategy
Update a. Job Center Discussion (Mr. Griesenbeck) b. Project Screening Criteria (Mr. Griesenbeck) c. Discussion Draft Preferred Land Use Scenario for 2020 (Ms. Hargrove)
8. Other Matters 9. Adjournment
The next meeting is scheduled for Wednesday, March 25, 2015
◄ Indicates Action The Meridian Plaza Building is accessible to the disabled. If requested, this agenda, and documents in the agenda packet can be made available in appropriate alternative formats to persons with a disability, as required by Section 202 of the Americans with Disabilities Act of 1990 and the Federal Rules and Regulations adopted in implementation thereof. Persons seeking an alternative format should contact SACOG for further information. In addition, a person with a disability who requires a modification or accommodation, including auxiliary aids or services, in order to participate in a public meeting should contact SACOG by phone at 916-321-9000, e-mail ([email protected]) or in person as soon as possible and preferably at least 24 hours prior to the meeting.
Parking is available at 15th and K Streets
Item #1b: SACTrak 2.0 goes live February 20, 2015.
https://sactrak.sacog.org
Attend a Webinar For an introduction to the basic features, including the new Delivery Plan Editor, we are offering a training webinar to help users get acquainted with the new site. Instructions on how to connect to the GotoMeeting webinar appointments is listed on the next page.
Two Options
• 10:30 to Noon, February 24th • 10:30 to Noon, March 3rd
Agenda
1. What & Why 2. Where is my project? 3. How do I amend it? 4. How do I report it? (For RFAs and grants.) 5. How do I submit Delivery Plan info?
Fill Out the Delivery Plan by 3/20 Please fill out the 2015 Delivery Plan using SACTrak, available starting 2/20. Sponsors that have CMAQ, RSTP, STIP, ATP, HBP, HSTIP, or SRTS funding should use the Delivery Plan Editor to indicate when they plan to submit their request for authorization for the various phases of their projects. Delivery Plan submittals are due 5 p.m. March 20.
Hands On Session Want extra help? SACOG staff will be available after the RPP meeting from 3:30 to 5 p.m., February 25th in the Sutter Buttes Room at SACOG. Please RSVP to [email protected]. Seats are limited.
Background SACTrak is the online database used by SACOG and over 200 users to manage the projects that comprise the Metropolitan Transportation Improvement Program (MTIP). SACOG has made significant changes and improvements to SACTrak. Most of these changes may be intuitive for users. Even so, SACOG is offering a webinar and a hands-on session to help users get acquainted with the recently launched new version of SACTrak. The webinar will be offered on two different dates, and it will cover the basics: How to view, amend, and report on the status of projects.
Changes and improvements were developed and reviewed by the SACTrak Project Development Group over the course of eight meetings. This group was comprised of six "power users" from the region.
Next Phases SACOG will launch the SACTrak Public Portal summer 2015. This will be a separate website designed to help the public better interact with the projects in the MTIP as well as the Metropolitan Transportation Plan/Sustainable Communities Strategy (MTP/SCS).

How to Connect to the Webinars Tue, Feb 24, 10:30 AM Pacific Standard Time
• Join meeting from your computer, tablet or smartphone. https://global.gotomeeting.com/join/195987581
• You can also dial in using your phone. United States (Long distance): +1 (657) 220-3412 Access Code: 195-987-581 More phone numbers: https://global.gotomeeting.com/195987581/numbersdisplay.html
Tue, Mar 3, 10:30 AM Pacific Standard Time • Join meeting from your computer, tablet or smartphone.
https://global.gotomeeting.com/join/484555181
• You can also dial in using your phone. United States (Long distance): +1 (646) 749-3131 Access Code: 484-555-181 More phone numbers: https://global.gotomeeting.com/484555181/numbersdisplay.html
Contact José Luis Cáceres at [email protected] for more information.
Regional Planning Partnership / P lanners Commit tee I tem #2
Action Summary January 28, 2015
Attendees: Cyrus Abhar, City of Citrus Heights Jerry Barton, EDCTC Mark Barry, Caltrans Dan Bolster, EDCTC Rod Brown, Fehr & Peers Victoria Cacciatore, SACOG Jose Luis Caceres, SACOG Scott Carson, FHWA Greg Chew, SACOG Joe Concannon, SACOG Rosemary Covington, Sacramento Regional
Transit District Jeff Damon, Sacramento Regional Transit
District John Deeter, ECOS Dave Defanti, El Dorado County Woody Deloria, EDCTC Renee DeVere-Oki, SACOG Teri Duarte, WALKSacramento Florigna Feliciano, Caltrans District 3 Karen Fink, Tahoe Regional Planning
Authority Chris Flores, Congresswoman Doris Matui’s
Office Erik Fredericks, Caltrans Kathy Garcia, City of Rancho Cordova Tina Glover, SACOG Carol Gregory, County of Sacramento Jennifer Hargrove, SACOG Neal Hay, Sutter County Mark Heiman, SACOG Stephanie Henry, City of Folsom Monica Hernandez, SACOG Katherine Hess, City of Davis Ally Holmqvist, SACOG Clint Holtzen, SACOG Aaron Hoyt, PCTPA Crystal Jacobsen, Placer County Matt Jones, Yolo-Solano AQMD
Bob Lagamarsino, AECOM Amy Lee, SACOG Kacey Lizon, SACOG Andrew Maneli, FHWA Jim McDonald, City of Sacramento Brent Meyer, City of Woodland Derek Minnema, Capital Southeast
Connector JPA Leanne Moffit, Sacramento County Ryan Moore, Drake Haglan & Associates Debbie Moss, Parsons-Brinkerhoff Anne Novotny, El Dorado County Karina O’Connor, EPA Yanmei Ou, SACOG Jerry Park, City of Elk Grove Kathy Pease, City of Roseville Heather Phillips, ARB Raef Porter, SACOG Terry Preston, ECOS Mark Rackovan, City of Folsom Refugio Razo, Sacramento County Dave Robinson, Fehr & Peers Larry Robinson, Sacramento Metropolitan
AQMD Rosie Ramos, SACOG Greg Sandlund, City of Sacramento Megan Siren, City of Rancho Cordova Elizabeth Sparkman, City of Rancho
Cordova Nellie Sperka, City of Winters Tara Thronson, Valley Vision Laura Webster, City of Rocklin Jeff Werner, City of Elk Grove Lucinda Willcox, City of Sacramento Michael Winter, Sacramento County Ashley Wright, Mark Thomas & Co. Holly Wunder Stiles, Mutual Housing
1. Introductions and Info Sharing.
i. Sacramento Regional Safe Routes to School Summit. Ms. Hernández announced the
February 17 Summit, scheduled from 10 a.m. to 3 p.m., aimed to help local staff, advocates, school districts, and policymakers. Staff sent needs assessment surveys in December to determine the focus and content of the Summit. She added that fewer than 15 spaces are available, so prompt RSVPs are encouraged.

ii. Cap & Trade Updates. Ms. DeVere-Oki informed the Partnership that the final guidelines for the Affordable Housing and Sustainable Communities (AHSC) program have been adopted. SACOG will hold a workshop Friday, January 30, from 1 to 3 p.m. to provide technical assistance to potential applicants in calculating greenhouse gas emissions reductions. Attendees are requested to RSVP to Greg Chew ([email protected]). She added information about the Low Carbon Transit Program, a formula program to which transit districts and operators will submit an intention to apply letter.
iii. SACOG Round 3 Strategic Growth Council (SGC) Grant Briefing. SACOG is using the awarded funds from SGC to offer technical assistance with corridor planning and economic development and has begun working with specific local agencies. Contact Greg Chew at [email protected] with any questions.
iv. Identification of Routes of Regional Significance. Mr. Heiman gave a briefing on the process of identifying routes that are “regionally significant” through the perspective of 511 and Federal Highway Administration. The designation of regionally significant is primarily for data and information addressing congestion problems and monitoring roadways. He noted that the information reporting requirements for regionally significant routes is within the region’s 511 reporting abilities, but at this point in time, there is no immediately apparent benefit of being designated a route of regional significance in terms of funding or programming. Attachments from Mr. Heiman’s presentation are available on the SACOG website.
v. Caltrans Goods Movement Study. Ms. Feliciano of Caltrans District 3 informed the Partnership of the district-wide gap analysis of the goods movement network being prepared by Caltrans. A draft will be available on February 4 for two weeks of public review. Ms. Cacciatore requested that members of the Partnership contact her if interested in hearing a presentation of the full study at the February 25 meeting of the RPP.
2. Approve December 3, 2014 Action Summary. Mr. Robinson moved to approve the action summary; Mr. Blank seconded the motion. The Partnership voted in favor of approving the action summary and the motion carried.
3. Conceptual Organization of 2015 Regional Funding Program. Ms. DeVere-Oki informed the Partnership that SACOG staff will be soliciting feedback from its Board about policy frameworks for the 2015 Funding Round. There are three conceptual frameworks being proposed:
i. Integrate State & Regional Funding Programs. This proposed change would allow a project
sponsor to submit a project application to the statewide Active Transportation Program (ATP) and have that application carry over to compete in the Six-County Regional ATP, and also in the four-county SACOG Bicycle/Pedestrian Funding Program, with minimal supplemental materials needed. Additionally, the announcement of the AHSC grant awards is timed such that unsuccessful projects could compete in other programs of SACOG’s Regional Funding Program.
ii. Link Air Quality & GHG Reduction Funding. Given the overlapping timing of developing the next Ozone State Implementation Plan, there would be a set-aside of funds to dedicate towards the results of an upcoming analysis of reasonably available control measures. This could create competitive funding for air quality improvement projects that have previously been reserved funding noncompetitively, due to their identification as Transportation Control Measures.
iii. Increase the Focus on System Maintenance Needs. Ongoing work for the 2016 MTP/SCS is looking at how to handle “Fix-it-First”; the 2015 regional funding program will consider these ongoing discussions.
4. Active Transportation Program Briefing. Ms. Cacciatore briefed the Partnership on SACOG staff’s research to enhance the region’s competitiveness in Cycle 2 of the statewide ATP. By population, the SACOG region should have received over $11 million; however, it only received $6.5 million. The CTC published the successful ATP applications and the scoring metrics. Ms. Cacciatore gave an overview on how the region’s projects performed on each metric and discussed strategies to increase the number of points captured per metric. She also noted that statewide, 87% of projects could claim a benefit to disadvantaged communities. Ms. Cacciatore announced that the draft guidelines for Cycle 2 have been released by CTC. Approval of the guidelines is expected March 26, which will signal the call for projects. Applications will be due June 1, with the evaluation process conducted by the CTC instead of Caltrans. CTC staff has indicated they will provide training for scorers and implement slight changes to scoring.
5. Improvements to SACTrak. Mr. Cáceres reminded the Partnership that SACTrak is an online
database of transportation projects used by SACOG and project sponsors. This online tool is being updated and staff will host training sessions for interested SACTrak users. The updated website will have a mapping interface of all federally funded projects and a public portal to allow greater access to its information.
6. 2016 Metropolitan Transportation Plan/Sustainable Communities Strategy Update. Ms. Lizon informed the group that SACOG staff is about halfway through the timeline of the 2016 MTP/SCS, with the endpoint of an anticipated February 2016 adoption date. The update process was started in December 2013 when the SACOG Board adopted the policy framework with an implementation focus. She also directed the Partnership to a handout that describes past and upcoming major board actions.
i. Briefing on Discussion Draft Preferred Scenario. Ms. Lizon announced that the Discussion Draft land use forecast and transportation project list has been released for member and partner agency comment through March 9. SACOG staff is available for questions, meetings, presentations, and any other outreach needs. On February 6, the MTP/SCS Sounding Board will meet and give feedback to be reported to the Board. Ms. Lizon also noted the upcoming Elected Official Information Meetings, which are required under SB 375. These meetings will engage City Councils and Boards of Supervisors in every jurisdiction; this input will inform the Draft Preferred Scenario, to be taken to the SACOG Board in April.
a) Draft Preferred Scenario Transportation Project List. Mr. Holtzen presented the newly developed draft project list, with a base budget of about $32.4 billion dollars. He noted that it is budgeted conservatively because of projected lower fuel consumption and fuel tax revenue. Additional revenues are a potential transportation bond in Placer County, bridge funding, and cap and trade funding. The maintenance budget is still lower than what is needed in the region, and SACOG staff is still doing analysis to find potential fix-it-first projects. This list and associated policies will be taken to the Board for discussion.
b) Draft Preferred Scenario Land Use Forecast. Ms. Hargrove presented the
discussion draft preferred scenario for land use, which shows the regional growth totals for homes and jobs held constant for 2036, per Board direction to allow an implementation focus. “Guardrails” for land use were set in the December 2014 Board-adopted Framework for a Draft Preferred Scenario and maintain roughly the same levels of growth in the four community types, with a slight increase of homes and jobs in Centers & Corridors and Established Communities in order to try and meet the GHG targets. A 2020 discussion draft scenario (per the interim target year) will be released shortly.

c) MTP/SCS Elected Official Information Meetings. Ms. Lizon announced the upcoming meetings with elected officials in her above report of the Discussion Draft Preferred Scenario.
iv. Outreach Update. Ms. Hernandez deferred to Ms. Lizon’s outreach announcements earlier in the item.
7. Other Matters. Mr. Robinson announced a lunch meeting at the Sacramento Metropolitan Air Quality
Management District at noon on February 25 regarding the City of Sacramento planning effort, “Grid 2.0”. Cost for lunch is $10. Mr. Carson announced that he will be changing jurisdictions and that Stew Sonnenberg will be the new FHWA liaison for SACOG.
8. Adjournment. Mr. Robinson moved to adjourn; Mr. Fredericks seconded. The Partnership voted in
favor of adjournment and the motion carried.
Item #3
Regional Planning Partnership / Planners Committee
February 17, 2015 Eastern Solano Projects of Air Quality Concern Report Recommendation: None, this item is for information. Discussion: Under federal law, certain types of transportation projects must be reviewed through interagency consultation to determine whether they are in conformity with regional PM2.5 attainment efforts. Projects that are not determined by the interagency group to be projects of air quality concern (POAQC) are considered to meet the conformity criteria. The Sacramento Federal Nonattainment Area (SFNA) for PM2.5 includes all of Sacramento County and portions of El Dorado, Placer, Yolo, and Solano Counties. The majority of the SFNA falls within the boundaries of SACOG’s metropolitan planning area, but the Metropolitan Transportation Commission (MTC) is responsible for making conformity determinations for projects in Eastern Solano County. As such, a representative of the SFNA is responsible for participating in MTC’s interagency consultation and providing quarterly reports of POAQC determinations in Eastern Solano County to the SACOG Regional Planning Partnership. Since the last POAQC determination update in November 2014, no projects in Eastern Solano County have been reviewed through MTC’s interagency consultation process. Mr. Matt Jones of Yolo-Solano Air Quality Management District will be present to answer any questions from the Partnership regarding conformity determinations and other topics of air quality interest in Eastern Solano County. Key Staff: Sharon Sprowls, Senior Program Specialist, (916) 340-6235 Renée Devere-Oki, Regional Air Quality Team Manager, (916) 340-6219 Victoria Cacciatore, Regional Air Quality Team Member, 916-340-6214
Item #4
Regional Planning Partnership / Planners Committee
February 17, 2015 Project Level Conformity Working Group Update Recommendation: None, this is for information only. Discussion: Using delegated authority from the RPP, the Project Level Conformity Group (PLCG) is tasked with reviewing and taking action on PM2.5 and PM10 Project of Air Quality Concern (POAQC) determinations and hot spot analyses. Since November 2014, the PLCG has determined that two projects were not POAQCs.
• City of Sacramento, 14th
Ave. Extension Phase 1 & 2 • City of West Sacramento, Pioneer Bluff Bridge Phase 2 - Village Parkway Extension
To date, the PLCG has reviewed 13 projects (Attachment A). Anyone from the RPP is welcome to be a member of the PLCG (Attachment B). If you would like to join, please contact José Luis Cáceres. Attachments Key Staff: Sharon Sprowls, Senior Program Specialist, (916) 340-6235 Renée DeVere-Oki, Senior Planner, (916) 340-6219 José Luis Cáceres, Associate Planner, (916) 340-6218
Attachment A
Actions Taken by the Project Level Conformity Group, September 2011 to July 2014.
#Date
Circulated Action Date Action ID Title Sponsor1 12/23/2011 1/4/2012 POAQC Approved CAL20452 SR 113/SR 99 Interchange Caltrans District 3
2 1/19/2012 1/27/2012 POAQC Approved PLA25502 Rocklin Rd/Meyers St. RoundaboutCity of Rocklin Division of Engineering
3 4/23/2012 5/10/2012 POAQC Approved SAC24470White Rock Rd. - Sunrise Blvd. to City Limits City of Rancho Cordova
4 7/5/2012 7/17/2012 POAQC Approved PLA25499 Rocklin Rd/Grove St RoundaboutCity of Rocklin Division of Engineering
5 8/6/2012 8/13/2012 POAQC Approved PLA25252Swetzer Road / King Road Signalization
Town of Loomis Dept of Public Works
6 9/11/2012 9/18/2012 POAQC Approved SAC16800Fair Oaks Boulevard Improvements Phase 2
Sacramento County Dept of Transportation
7 12/5/2012 4/23/2013* POAQC Approved* PLA25440 I-80/SR 65 Interchange ImprovementsPlacer County Transportation Planning Agency
8 1/4/2013 2/4/2013 POAQC ApprovedPLA20721/PLA25299 Placer Parkway Project
Placer County Dept of Public Works
9 3/21/2013 3/28/2013 POAQC Approved PLA25520 Oak Street ImprovementsCity of Roseville Dept of Public Works
10 4/15/2013 4/30/2013 POAQC Approved PLA25509Nelson Ln/Markham Ravine Bridge Replacement
City of Lincoln Dept of Public Works
11 4/9/2014 5/5/2014 POAQC Approved YOL17400Kentucky Avenue Widening & Complete Streets City of Woodland
Actions Taken by the Project Level Conformity Group since November 2014
12 12/11/2014 12/19/2014 POAQC ApprovedSAC24610 &
SAC24656 14th Ave. Extension Phase 1 & 2 City of Sacramento
13 12/20/2014 12/22/2014 POAQC Approved YOL19329Pioneer Bluff Bridge Phase 2 - Village Parkway Extension City of West Sacramento
* Action taken by Regional Planning Partnership at its April 23, 2013 Meeting.
Attachment B
Attachment BMembers of the Project Level Conformity Group
# Last Name First Name Organization
1 Anderson Charles SMAQMD
2 Barton Jerry EDCTC
3 Christian Shalanda Caltrans
4 Coleman Douglas Caltrans
5 DeVere-Oki Renée SACOG
6 Fong Alex Caltrans
7 Green Angel Placer County
8 Johnston Dave El Dorado County
9 Jones Matt YSAQMD
10 McNeel-Caird Luke PCTPA
11 O'Connor Karina EPA
12 Phillips Heather CARB
13 Riding Chad Caltrans
14 Robinson Larry SMAQMD
15 Spaethe Sondra FRAQMD
16 Tang Sharon Caltrans
17 Tavitas Rodney Caltrans HQ
18 Tollstrup Brigette SMAQMD
19 Ungavarsky John EPA
20 Vaughn Joseph FHWA
CoordinatorCáceres José Luis SACOG

Item #5 Regional Planning Partnership / Planners Committee
February 19, 2015 Title: Draft Frameworks for Regional Funding Programs Recommendation: This item will be forwarded to the committee prior to the meeting.

Item #6 Regional Planning Partnership / Planners Committee
February 19, 2015 Title: 2036 Discussion Draft Preferred Scenario Preliminary VMT Results Recommendation: Please see Attachment A.
Early Rough Draft Preferred Scenario 2036Lowest Vehicle Miles Traveled per Capita
Attachment A
Early Rough Draft Preferred Scenario 2036Largest Reduction in Vehicle Miles Traveled per Capita
Early Rough Draft Preferred Scenario 2036Reduction in Total Vehicle Miles Traveled Compared
to 2008 Regional Average
Early Rough Draft Preferred Scenario 2036Compilation of the 3 Vehicle Miles Traveled Metrics

Item #7a
Regional Planning Partnership Information
February 18, 2015 Job Center Discussion Recommendation: None. This item is for information and discussion. Discussion: Staff is developing performance outcomes that describe jobs-housing balance around jobs centers and the transportation characteristics of those centers. Staff will present to the committee the latest information, which is included in Attachment A. This information was also presented to the SACOG Board at its February Board meeting. Key Staff: Sharon Sprowls, Senior Program Specialist, (916) 340-6235
Bruce Griesenbeck, Principal Project Expert, (916) 340-6268
Attachment A
Jobs/Housing Balance, Jobs Centers and Transportation
Summary To allow the Metropolitan Transportation Plan/Sustainable Communities Strategy (MTP/SCS) to achieve its greenhouse gas reduction targets and air quality conformity targets, the Framework for a Draft Preferred Scenario specifies that the land use forecast of the plan should have as much or slightly more improvement in sub-regional jobs/housing balance as in the current MTP/SCS. The reason for this emphasis is that regional accessibility to jobs, or the number of jobs within a reasonable drive time from a place of residence, explains much of the travel performance difference between the three scenarios that are being used to inform the update of the MTP/SCS. In areas within the existing urbanized area, regional accessibility is usually higher, and in outlying areas or areas on the urban/suburban edge, it tends to be lower. Increased regional accessibility to jobs means shorter driving trips and a corresponding decrease in vehicle miles traveled and air emissions. There are multiple travel benefits to sub-regional jobs/housing balance. The Discussion Draft Preferred Scenario (Discussion Draft), with its improvement in sub-regional jobs/housing balance and supporting transportation investments, achieves the following travel improvements into regional employment centers:
• Average commute vehicle miles traveled (VMT) per worker within the regional
employment centers declines over time. • Transit, bike and walk mode share for commute travel to regional employment centers
increases over time. • Average auto commute time to regional employment centers decreases over time (this
is an average commute time of both single-occupancy vehicles and carpools to workplace).
Fourteen regional employment centers were identified as part of this analysis. The memo herein discusses 1) the definition of jobs/housing balance, 2) the definition of employment centers as applied in the Discussion Draft, and 3) the travel performance of workers to each of the fourteen regional employment centers in the Discussion Draft. Staff is also willing and able to run this analysis for smaller job centers upon request. In the February Board workshop, staff will brief the Board on the fundamental assumptions in this memo and solicit questions and comments that will be used to further refine the regional jobs center definition and related transportation performance outcomes.
1
Attachment A
1. Definition of Jobs/Housing Balance The relationship between the number of households and jobs has long been used as an indicator of the potential for longer (or shorter) commutes. The most common quantitative statement of the relationship is the “jobs/housing balance” (J/HB). In areas with very low J/HB (i.e. few jobs for the number of households in the area), many workers need to commute out of their residence area to find work. In areas with very high J/HB (i.e. many jobs for the number of households in the area), jobs need to be filled by workers from outside the area. Areas with high or low J/HB’s, all else being equal, are likely to generate longer commutes for workers. This is the most basic assumed relationship of the balance between J/HB, and the need for travel. The reality of the relationship between jobs and housing is far more complex than the J/HB portrays, though, for several reasons:
• The true relationship is not between jobs and housing, but between jobs and workers—housing has long been treated as a proxy for workers and worker residence. In reality, the number of workers per household varies widely across the region, and different types of housing have the capacity for accommodating different numbers of workers.
• J/HB is dependent on the geography used for the computation—but there is no “right” geography to use. Example: One jurisdiction has a housing-rich J/HB (say 10,000 households and 3,000 jobs, or a J/HB of 0.3). An adjacent jurisdiction has jobs-rich J/HB (13,000 jobs and 2,000 households, or a J/HB of 6.5). Both jurisdictions combined, with a total of 16,000 jobs and 12,000 houses, has a “good” J/HB of 1.3. Which of these three J/HB’s is worth paying attention to?
• Areas with “good” J/HB may still force longer commutes for workers, if the housing available in the area is unaffordable or unattractive to the workers filling jobs in the area. For example, if most of the jobs in a given area pay minimum wage, does the presence of sufficient market-rate housing to theoretically house all these workers (i.e. a “good” J/HB of 1.2) mean the area has good J/HB?
• Finally, employment necessarily agglomerates and concentrates in specific areas. For example, industrial/warehouse areas are usually homogenous employment areas, with little or no housing, for good reason—they are unattractive areas in which to reside. Even for office and service employment centers, where attractive housing could be located, employment uses often out-compete housing as a land use in those centers, for economic reasons. So, for good planning and economic reasons, healthy, vibrant employment centers tend to have “poor” (and usually jobs-rich) J/HB’s.
2
Attachment A
These issues, among others, have stimulated a reappraisal of J/HB as a worthwhile indicator of the relationship between jobs and housing, and a move toward the notion of “fit” between jobs (where people work) and housing (where workers reside). SACOG staff used a measure of J/HB as an indicator for the 2012 MTP/SCS update, and proposes to use this measure for the MTP/SCS update. This measure would be based on the following principles and guidelines:
• Use as a target regional average J/HB. In 2008, the regional J/HB was about 1.2, or 1.2 jobs per household. This ratio dropped to 1.06 by 2012, due to the loss of employment in the recession. Because 2008 was a more normal year in the regional economy, and based on regional forecasts, the region is expected to return to about that ratio of jobs to households by 2036, 1.2 is proposed as a target for evaluating J/HB. That is, the degree to which an area which moves toward 1.2 is considered improvement in J/HB. So, a jobs-rich area with, say 1.9 jobs per household, would improve by adding more housing than jobs, and thereby moving J/HB toward 1.2. A housing-rich area with, say, 0.5 jobs per household, would improve by adding more jobs than housing, and thereby increasing J/HB toward 1.2.
• Accept the fact that employment, in a healthy regional economy, has and will continue to cluster and agglomerate in centers, within which “good” J/HB is very difficult, and undesired-able in some cases, to achieve. J/HB targets must be set for employment centers and a reasonable area around the centers, and not necessarily within the centers.
• Use an objective definition of employment centers, based on the size, concentration, and future capacity of jobs centers within the region, to identify employment areas of interest for assessing and measuring the balance between jobs and potential locations of residence for workers in and around those centers.
• Use an consistent distance measure from employment centers to identify surrounding areas of interest for measuring the fit between jobs and worker residence. For example, the median one-way commute distance for workers in the Sacramento region is about eight miles. For the 2012 MTP/SCS, areas within four miles of employment centers were defined as J/HB areas. Four miles is significantly lower than the median commute distance, and improving the balance between jobs and housing within this distance should support shorting of commute distances. Four miles is also a distance within a reasonable bicycle distance, and could be served with local transit service. For the 2016 MTP/SCS update, continued use of the four-mile area around employment centers is proposed.
• In the near term, the simple balance or ratio between jobs and housing units in J/HB areas will be the metric provided. Ultimately, in addition to total numbers of jobs and households, the distribution of wages paid at the jobs center, and housing cost in the
3
Attachment A
surrounding J/HB area, should be taken into account in measuring the “fit” between jobs and housing, rather than just the “balance”. This more sophisticated measure of fit will take significant research and data collection to develop, and will not happen in the course of the 2016 MTP/SCS update.
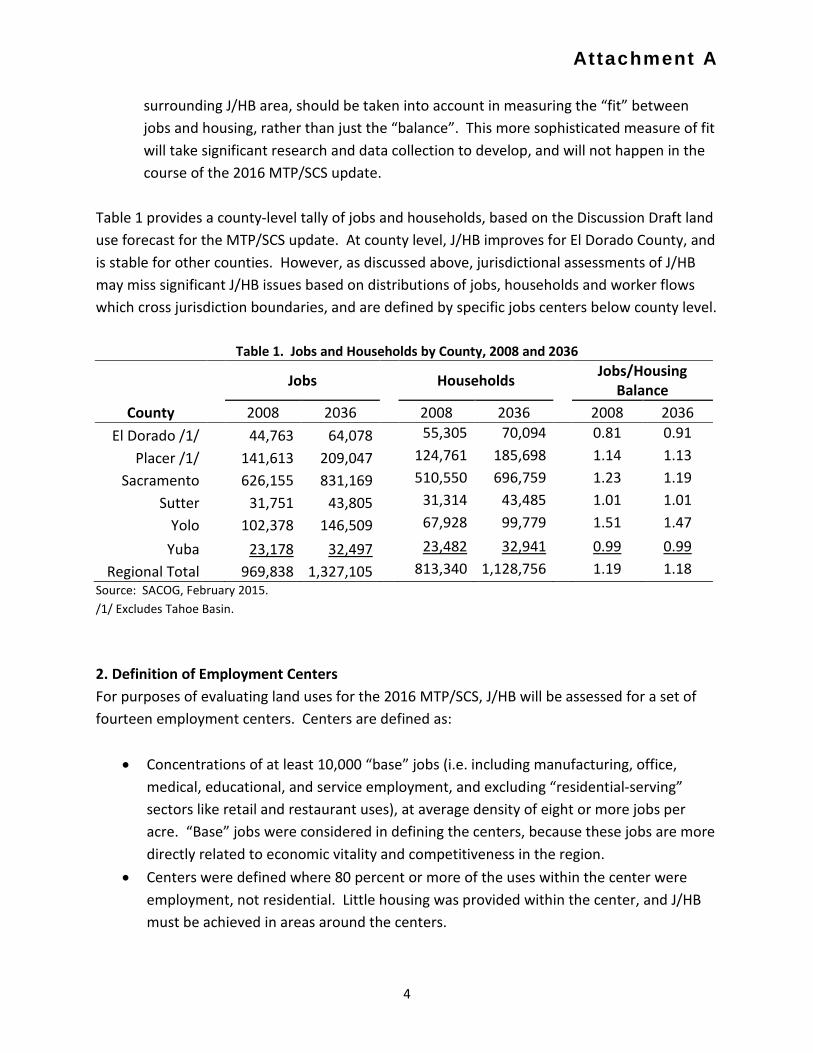
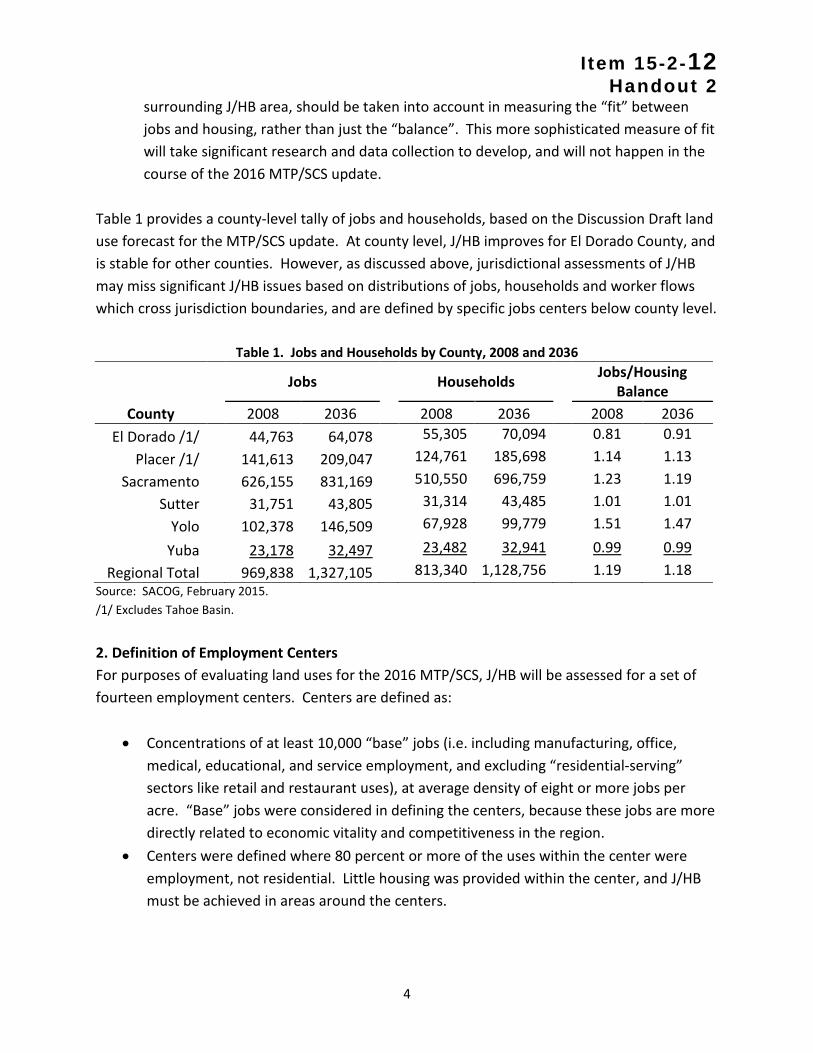
Table 1 provides a county-level tally of jobs and households, based on the Discussion Draft land use forecast for the MTP/SCS update. At county level, J/HB improves for El Dorado County, and is stable for other counties. However, as discussed above, jurisdictional assessments of J/HB may miss significant J/HB issues based on distributions of jobs, households and worker flows which cross jurisdiction boundaries, and are defined by specific jobs centers below county level.
Table 1. Jobs and Households by County, 2008 and 2036
Jobs Households Jobs/Housing Balance
County 2008 2036 2008 2036 2008 2036 El Dorado /1/ 44,763 64,078 55,305 70,094 0.81 0.91
Placer /1/ 141,613 209,047 124,761 185,698 1.14 1.13 Sacramento 626,155 831,169 510,550 696,759 1.23 1.19
Sutter 31,751 43,805 31,314 43,485 1.01 1.01
Yolo 102,378 146,509 67,928 99,779 1.51 1.47
Yuba 23,178 32,497 23,482 32,941 0.99 0.99 Regional Total 969,838 1,327,105 813,340 1,128,756 1.19 1.18
Source: SACOG, February 2015. /1/ Excludes Tahoe Basin.
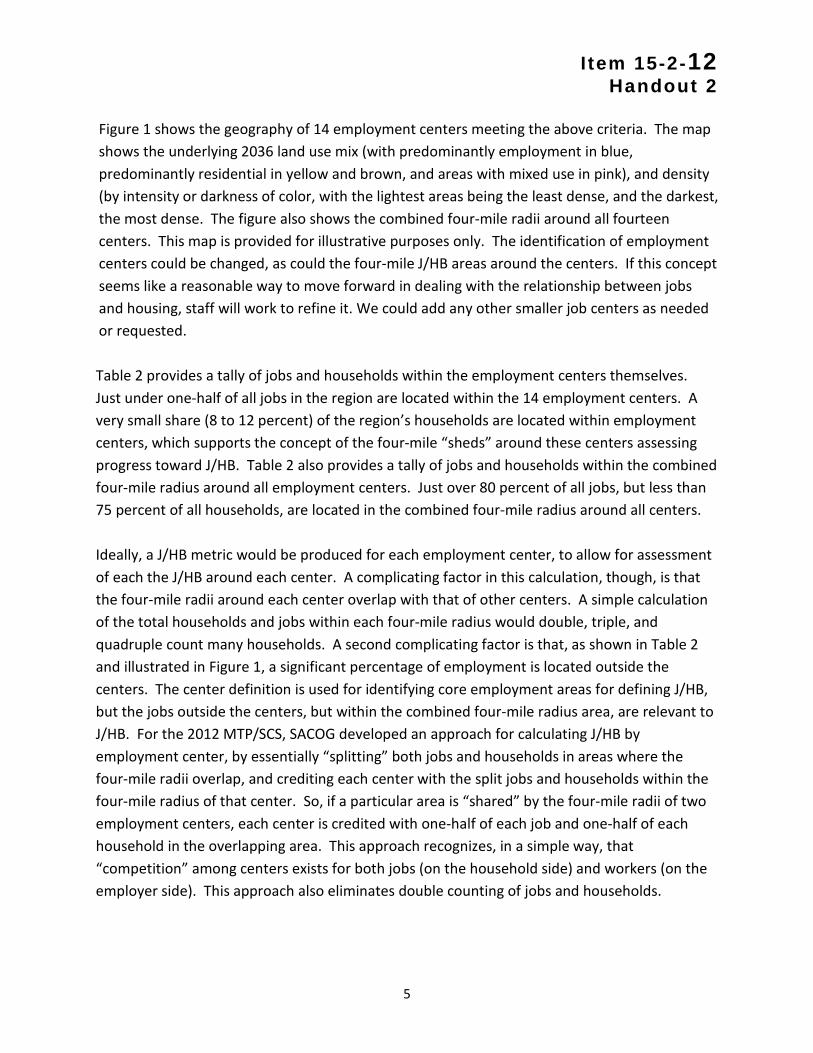
2. Definition of Employment Centers For purposes of evaluating land uses for the 2016 MTP/SCS, J/HB will be assessed for a set of fourteen employment centers. Centers are defined as:
• Concentrations of at least 10,000 “base” jobs (i.e. including manufacturing, office, medical, educational, and service employment, and excluding “residential-serving” sectors like retail and restaurant uses), at average density of eight or more jobs per acre. “Base” jobs were considered in defining the centers, because these jobs are more directly related to economic vitality and competitiveness in the region.
• Centers were defined where 80 percent or more of the uses within the center were employment, not residential. Little housing was provided within the center, and J/HB must be achieved in areas around the centers.
4
Attachment A
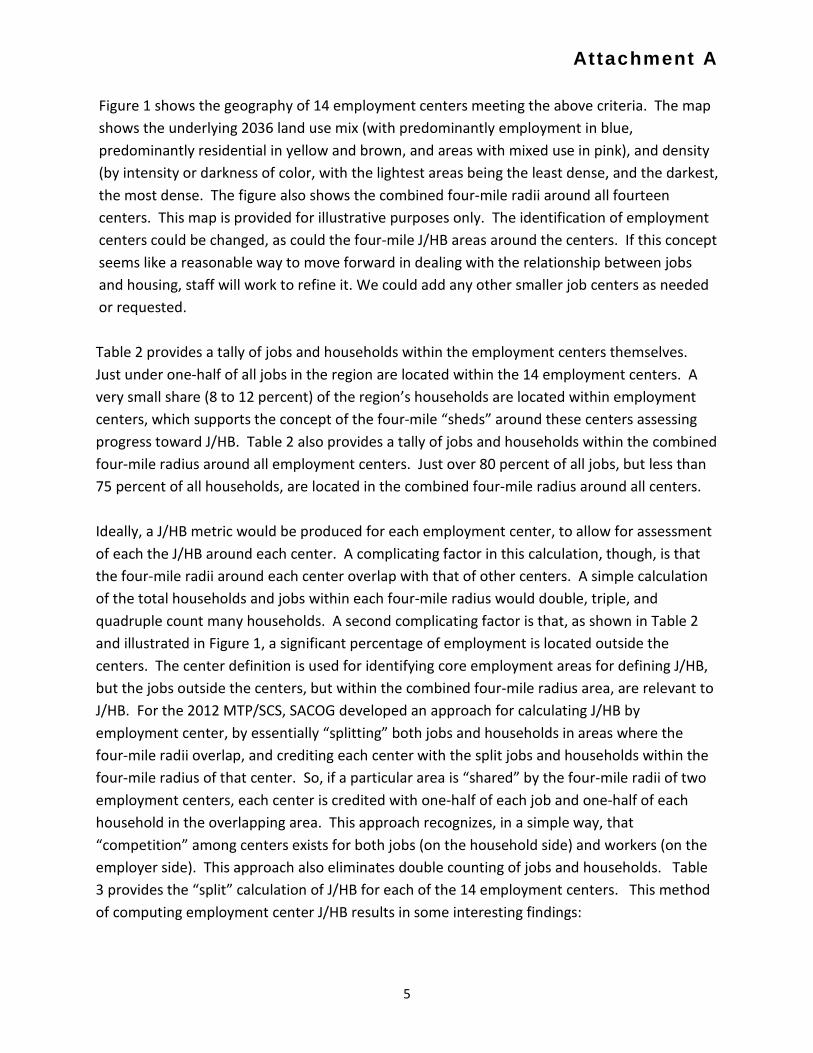
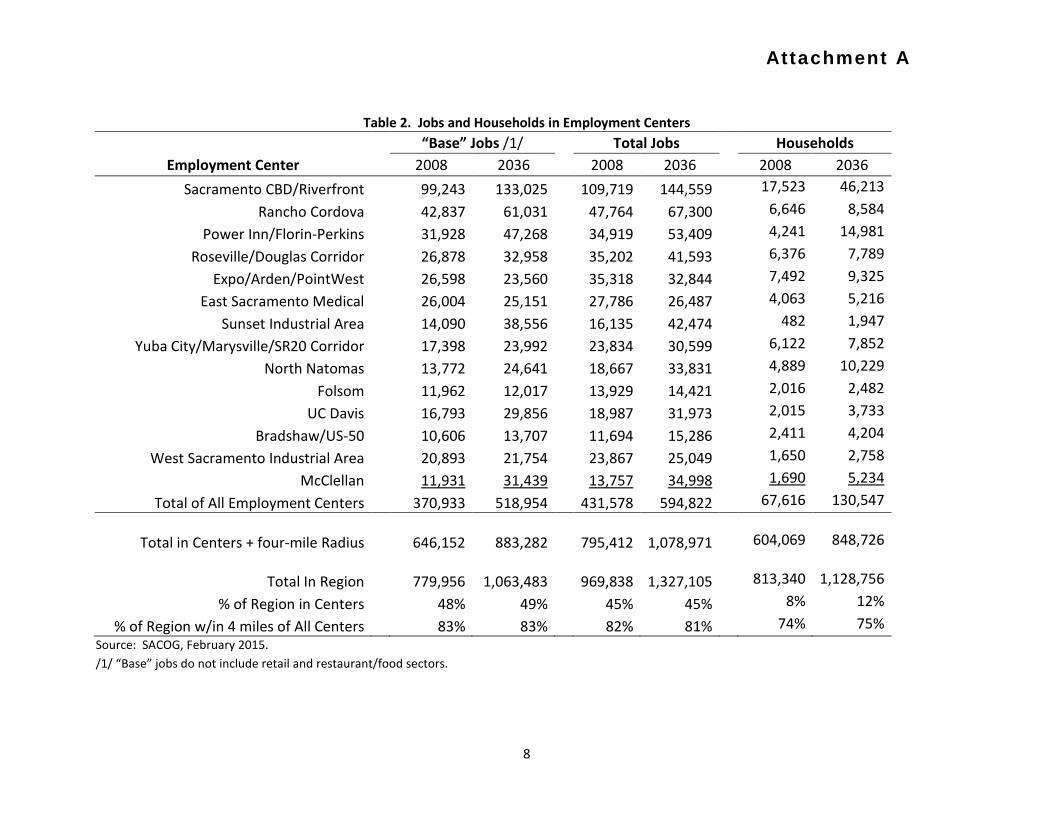
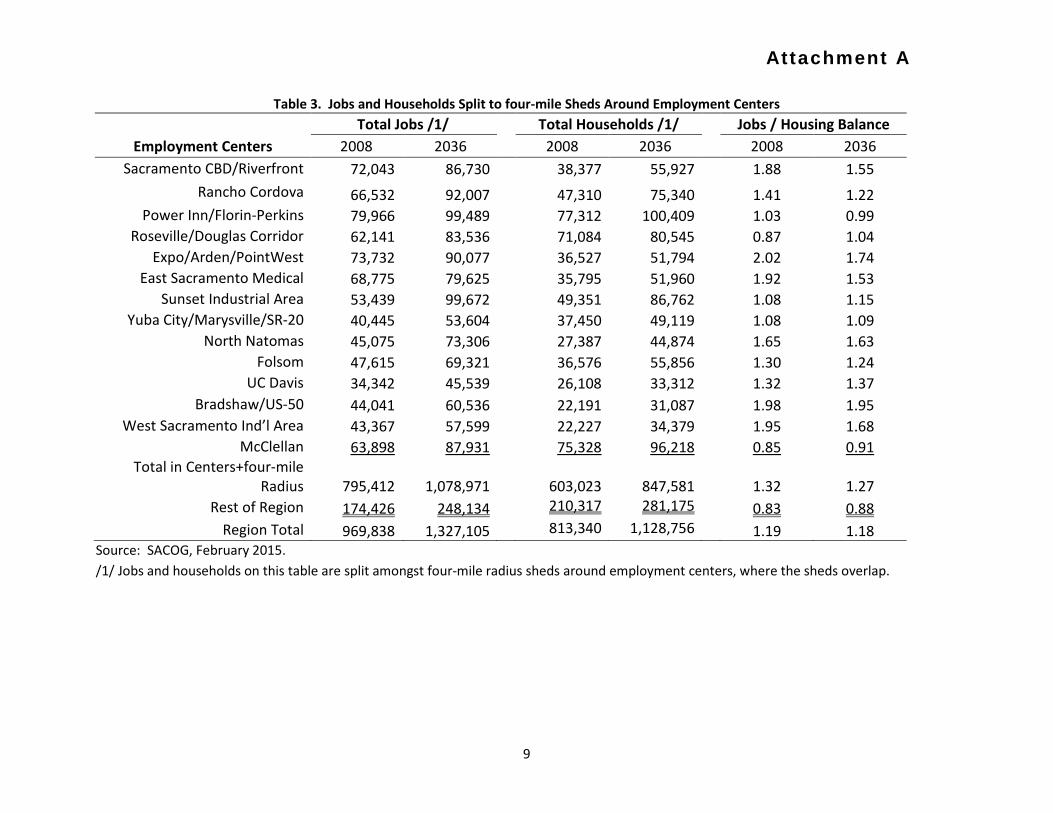
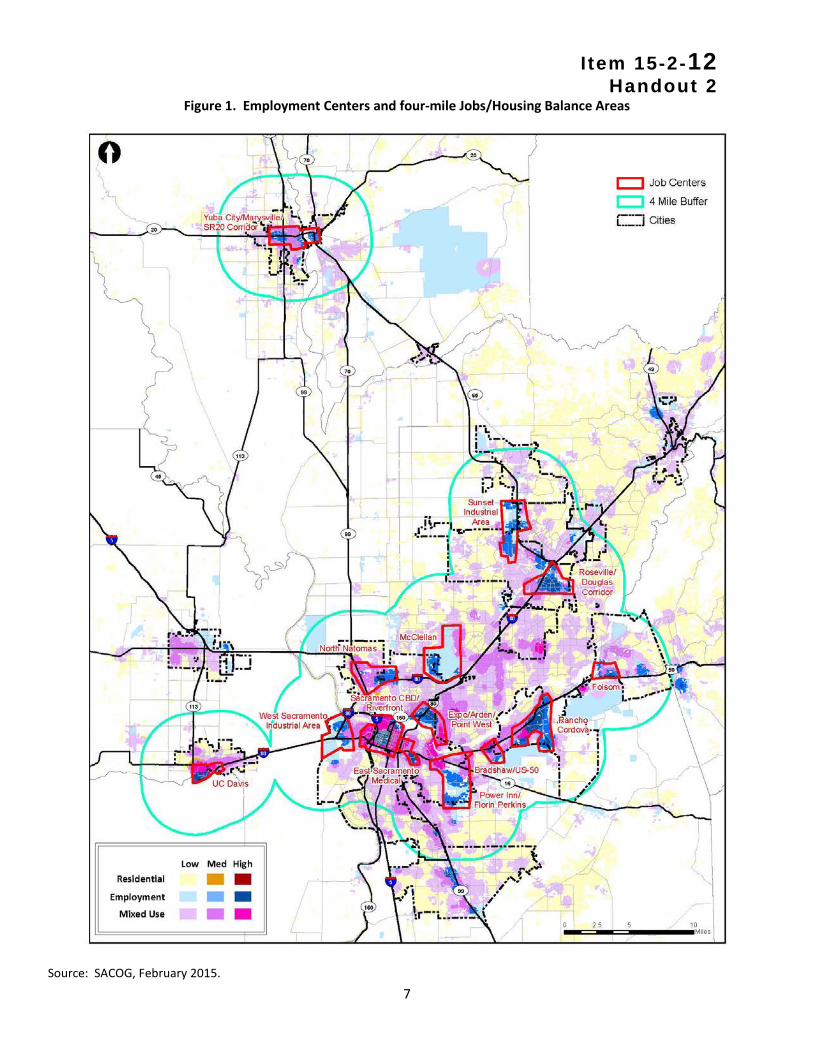
Figure 1 shows the geography of 14 employment centers meeting the above criteria. The map shows the underlying 2036 land use mix (with predominantly employment in blue, predominantly residential in yellow and brown, and areas with mixed use in pink), and density (by intensity or darkness of color, with the lightest areas being the least dense, and the darkest, the most dense. The figure also shows the combined four-mile radii around all fourteen centers. This map is provided for illustrative purposes only. The identification of employment centers could be changed, as could the four-mile J/HB areas around the centers. If this concept seems like a reasonable way to move forward in dealing with the relationship between jobs and housing, staff will work to refine it. We could add any other smaller job centers as needed or requested. Table 2 provides a tally of jobs and households within the employment centers themselves. Just under one-half of all jobs in the region are located within the 14 employment centers. A very small share (8 to 12 percent) of the region’s households are located within employment centers, which supports the concept of the four-mile “sheds” around these centers assessing progress toward J/HB. Table 2 also provides a tally of jobs and households within the combined four-mile radius around all employment centers. Just over 80 percent of all jobs, but less than 75 percent of all households, are located in the combined four-mile radius around all centers. Ideally, a J/HB metric would be produced for each employment center, to allow for assessment of each the J/HB around each center. A complicating factor in this calculation, though, is that the four-mile radii around each center overlap with that of other centers. A simple calculation of the total households and jobs within each four-mile radius would double, triple, and quadruple count many households. A second complicating factor is that, as shown in Table 2 and illustrated in Figure 1, a significant percentage of employment is located outside the centers. The center definition is used for identifying core employment areas for defining J/HB, but the jobs outside the centers, but within the combined four-mile radius area, are relevant to J/HB. For the 2012 MTP/SCS, SACOG developed an approach for calculating J/HB by employment center, by essentially “splitting” both jobs and households in areas where the four-mile radii overlap, and crediting each center with the split jobs and households within the four-mile radius of that center. So, if a particular area is “shared” by the four-mile radii of two employment centers, each center is credited with one-half of each job and one-half of each household in the overlapping area. This approach recognizes, in a simple way, that “competition” among centers exists for both jobs (on the household side) and workers (on the employer side). This approach also eliminates double counting of jobs and households. Table 3 provides the “split” calculation of J/HB for each of the 14 employment centers. This method of computing employment center J/HB results in some interesting findings:
5
Attachment A
• In Year 2008, more centers are jobs-rich than housing-rich. Seven centers (Sacramento CBD/Riverfront, Rancho Cordova, Expo/Arden/Point West, East Sacramento Medical, North Natomas, Bradshaw/US-50, and West Sacramento Industrial Area) show up as significantly jobs-rich. Only two centers (Roseville/Douglas Corridor, McClellan) show up as significantly housing-rich.
• Based on the 2036 proposed growth allocations for the MTP/SCS, 12 of 14 centers improve in J/HB (i.e. they move closer to 1.2 over the plan horizon). Two of the centers do not improve in J/HB: Power Inn Industrial Area, and UC Davis. Power Inn gets marginally more housing rich, and UC Davis gets marginally more jobs-rich.
• Overall in the combined four-mile radius area, J/HB improves through the planning horizon, decreasing from 1.32 to 1.27 (i.e. becoming less jobs-rich in total).
• To achieve “perfect” J/HB of 1.2, 51,000 more households would need to be located within the combined four-mile radius area.
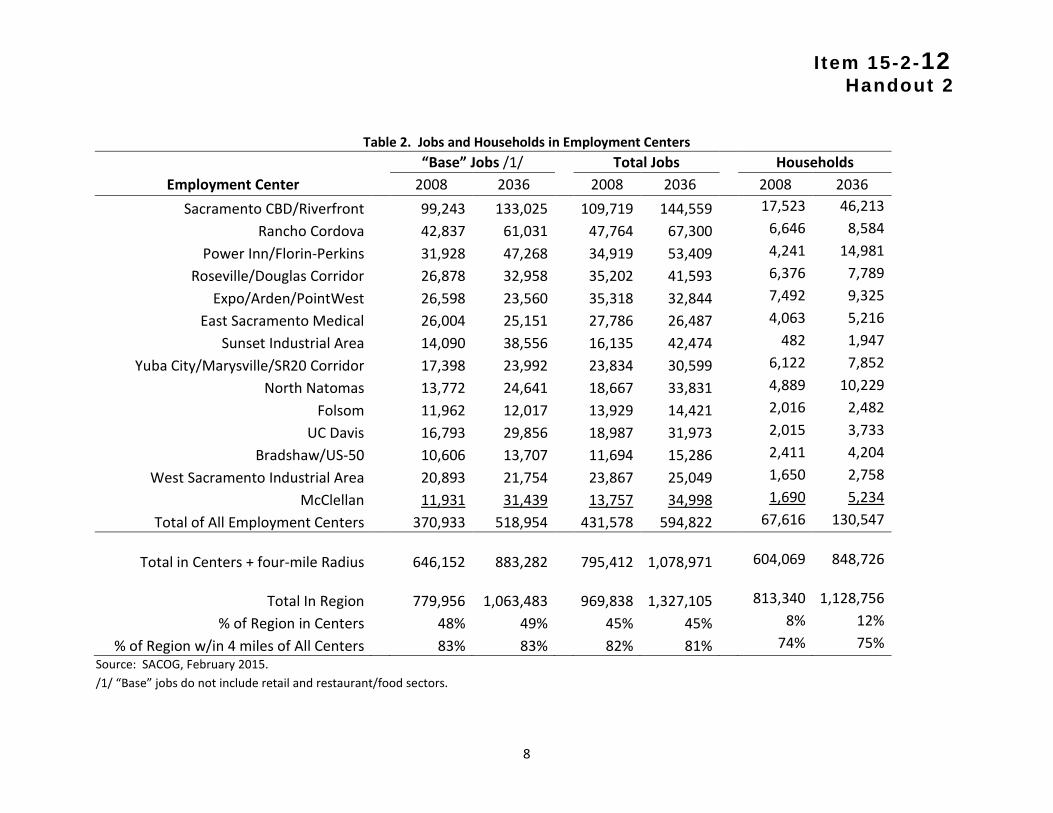
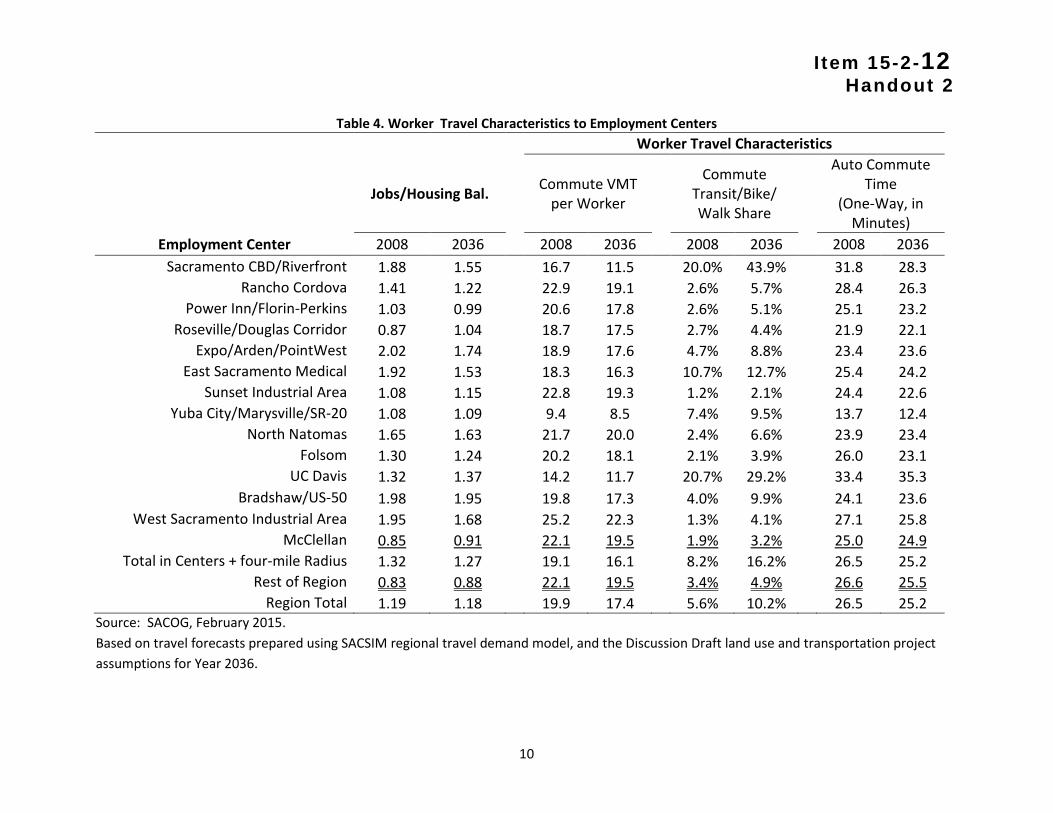
3. Travel Performance to Employment Centers Finally, Table 4 provides a snapshot of selected worker-travel characteristics to each of the 14 employment centers. Shown in the table are:
• Average commute vehicle miles traveled (VMT) per worker at the employment center. This metric declines for each center, with an overall decline for all centers of five percent.
• Transit, bike and walk mode share for commute travel to each center. This metric captures the combined non-auto travel to each center. This metric increases for all of the centers.
• Average auto commute time to each center. This is an average of both SOV and carpool times for all auto trips to each workplace. This metric improves to 11 of 14 of the centers.
6
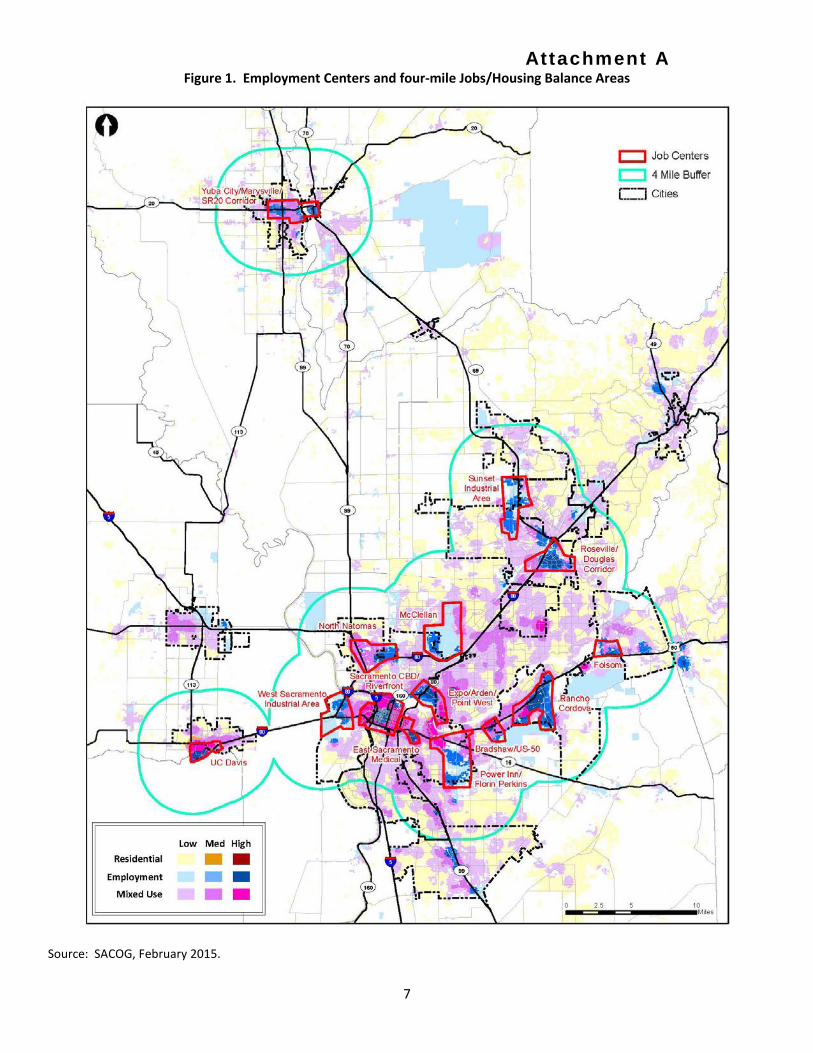
Attachment A Figure 1. Employment Centers and four-mile Jobs/Housing Balance Areas
Source: SACOG, February 2015.
7
At tachment A
Table 2. Jobs and Households in Employment Centers
“Base” Jobs /1/ Total Jobs Households Employment Center 2008 2036 2008 2036 2008 2036
Sacramento CBD/Riverfront 99,243 133,025 109,719 144,559 17,523 46,213
Rancho Cordova 42,837 61,031 47,764 67,300 6,646 8,584
Power Inn/Florin-Perkins 31,928 47,268 34,919 53,409 4,241 14,981
Roseville/Douglas Corridor 26,878 32,958 35,202 41,593 6,376 7,789
Expo/Arden/PointWest 26,598 23,560 35,318 32,844 7,492 9,325 East Sacramento Medical 26,004 25,151 27,786 26,487 4,063 5,216
Sunset Industrial Area 14,090 38,556 16,135 42,474 482 1,947
Yuba City/Marysville/SR20 Corridor 17,398 23,992 23,834 30,599 6,122 7,852 North Natomas 13,772 24,641 18,667 33,831 4,889 10,229
Folsom 11,962 12,017 13,929 14,421 2,016 2,482 UC Davis 16,793 29,856 18,987 31,973 2,015 3,733
Bradshaw/US-50 10,606 13,707 11,694 15,286 2,411 4,204
West Sacramento Industrial Area 20,893 21,754 23,867 25,049 1,650 2,758
McClellan 11,931 31,439 13,757 34,998 1,690 5,234
Total of All Employment Centers 370,933 518,954 431,578 594,822 67,616 130,547
Total in Centers + four-mile Radius
646,152 883,282 795,412 1,078,971 604,069 848,726
Total In Region
779,956
1,063,483 969,838 1,327,105 813,340 1,128,756
% of Region in Centers 48% 49% 45% 45% 8% 12%
% of Region w/in 4 miles of All Centers 83% 83% 82% 81% 74% 75% Source: SACOG, February 2015. /1/ “Base” jobs do not include retail and restaurant/food sectors.
8
At tachment A
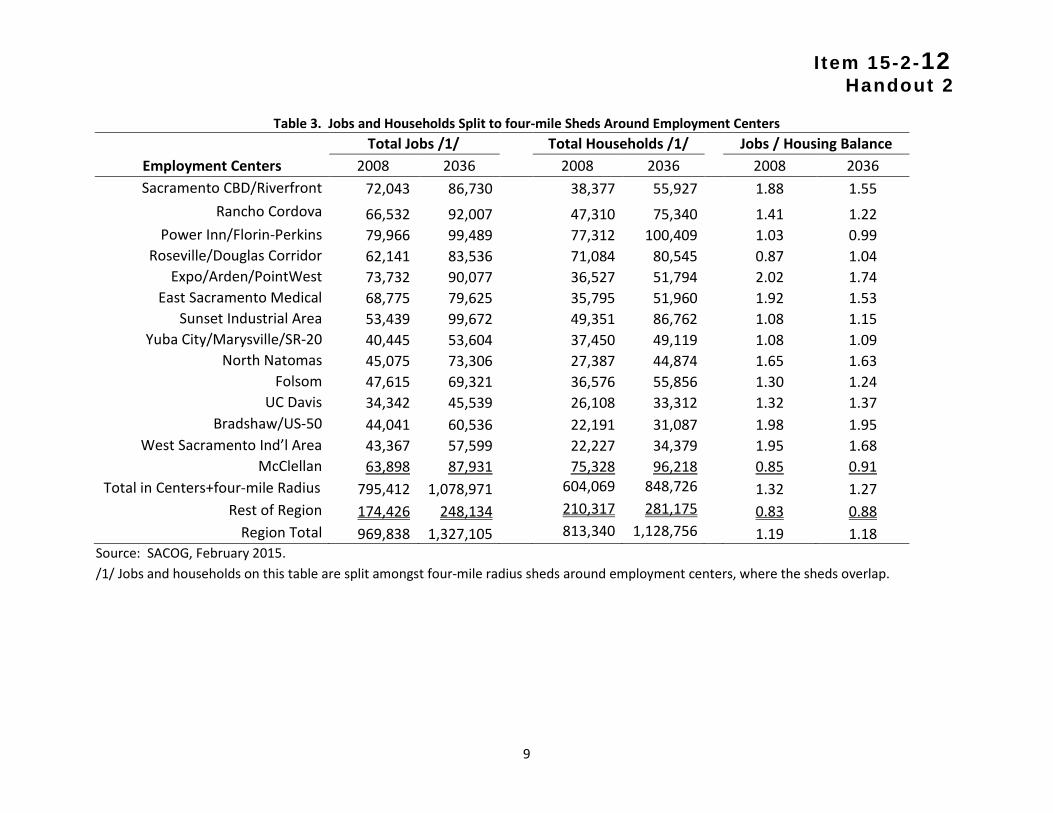
Table 3. Jobs and Households Split to four-mile Sheds Around Employment Centers Total Jobs /1/ Total Households /1/ Jobs / Housing Balance
Employment Centers 2008 2036 2008 2036 2008 2036 Sacramento CBD/Riverfront 72,043 86,730 38,377 55,927 1.88 1.55
Rancho Cordova 66,532 92,007 47,310 75,340 1.41 1.22 Power Inn/Florin-Perkins 79,966 99,489 77,312 100,409 1.03 0.99
Roseville/Douglas Corridor 62,141 83,536 71,084 80,545 0.87 1.04 Expo/Arden/PointWest 73,732 90,077 36,527 51,794 2.02 1.74
East Sacramento Medical 68,775 79,625 35,795 51,960 1.92 1.53 Sunset Industrial Area 53,439 99,672 49,351 86,762 1.08 1.15
Yuba City/Marysville/SR-20 40,445 53,604 37,450 49,119 1.08 1.09 North Natomas 45,075 73,306 27,387 44,874 1.65 1.63
Folsom 47,615 69,321 36,576 55,856 1.30 1.24 UC Davis 34,342 45,539 26,108 33,312 1.32 1.37
Bradshaw/US-50 44,041 60,536 22,191 31,087 1.98 1.95 West Sacramento Ind’l Area 43,367 57,599 22,227 34,379 1.95 1.68
McClellan 63,898 87,931 75,328 96,218 0.85 0.91 Total in Centers+four-mile
Radius 795,412 1,078,971 603,023 847,581 1.32 1.27 Rest of Region 174,426 248,134 210,317 281,175 0.83 0.88
Region Total 969,838 1,327,105 813,340 1,128,756 1.19 1.18 Source: SACOG, February 2015. /1/ Jobs and households on this table are split amongst four-mile radius sheds around employment centers, where the sheds overlap.
9

At tachment A
Table 4. Worker Travel Characteristics to Employment Centers Worker Travel Characteristics
Jobs/Housing Bal. Commute VMT per Worker
Commute Transit/Bike/ Walk Share
Auto Commute Time
(One-Way, in Minutes)
Employment Center 2008 2036 2008 2036 2008 2036 2008 2036 Sacramento CBD/Riverfront 1.88 1.55 16.7 11.5 20.0% 43.9% 31.8 28.3
Rancho Cordova 1.41 1.22 22.9 19.1 2.6% 5.7% 28.4 26.3 Power Inn/Florin-Perkins 1.03 0.99 20.6 17.8 2.6% 5.1% 25.1 23.2
Roseville/Douglas Corridor 0.87 1.04 18.7 17.5 2.7% 4.4% 21.9 22.1 Expo/Arden/PointWest 2.02 1.74 18.9 17.6 4.7% 8.8% 23.4 23.6
East Sacramento Medical 1.92 1.53 18.3 16.3 10.7% 12.7% 25.4 24.2 Sunset Industrial Area 1.08 1.15 22.8 19.3 1.2% 2.1% 24.4 22.6
Yuba City/Marysville/SR-20 1.08 1.09 9.4 8.5 7.4% 9.5% 13.7 12.4 North Natomas 1.65 1.63 21.7 20.0 2.4% 6.6% 23.9 23.4
Folsom 1.30 1.24 20.2 18.1 2.1% 3.9% 26.0 23.1 UC Davis 1.32 1.37 14.2 11.7 20.7% 29.2% 33.4 35.3
Bradshaw/US-50 1.98 1.95 19.8 17.3 4.0% 9.9% 24.1 23.6 West Sacramento Industrial Area 1.95 1.68 25.2 22.3 1.3% 4.1% 27.1 25.8
McClellan 0.85 0.91 22.1 19.5 1.9% 3.2% 25.0 24.9 Total in Centers + four-mile Radius 1.32 1.27 19.1 16.1 8.2% 16.2% 26.5 25.2
Rest of Region 0.83 0.88 22.1 19.5 3.4% 4.9% 26.6 25.5 Region Total 1.19 1.18 19.9 17.4 5.6% 10.2% 26.5 25.2
Source: SACOG, February 2015. Based on travel forecasts prepared using SACSIM regional travel demand model, and the Discussion Draft land use and transportation project assumptions for Year 2036.
10
Regional Planning Partnership / P lanners Commit tee Item #7b
February 18, 2015
Project Screening Criteria
Recommendation: None. This item is for information and discussion.
Discussion: As part of vetting the Discussion Draft Preferred Scenario transportation project list, staff
is using three project screening questions in discussions with selected local agency staff to help identify
transportation projects that were or could be considered for delay in the Discussion Draft project list.
The purpose of this effort is to arrive at a Draft Metropolitan Transportation Plan/Sustainable
Communities Strategy (MTP/SCS) that meets all federal and state financial constraint and air quality
emissions requirements. Attachment A summarizes these screening questions and provides examples of
projects that have been analyzed with them. Staff presented this information to the SACOG Board in its
February committee and Board meetings.
Key Staff: Sharon Sprowls, Senior Program Specialist, (916) 340-6235
Bruce Griesenbeck, Principal Project Expert, (916) 340-6268

Item #7c
Regional Planning Partnership / Planners Committee
February 18, 2015 Draft Preferred Land Use Scenario for 2020 Recommendation: None. This item is for information only. Discussion: SACOG staff has been working to update interim year projections for the 2016 Metropolitan Transportation Plan/Sustainable Communities Strategy (MTP/SCS) Update. One key interim year is 2020. At the SACOG Board Committees this month, staff shared draft 2020 projections for regional housing, population, and employment growth. Also shared with the Committees was a summary of peer review interviews with industry forecasters on SACOG’s draft projections for 2020. This summary is included in Attachments A, B, and C. After vetting the draft regional projections for 2020, staff began work on a Discussion Draft Preferred Land Use Scenario for 2020, which includes housing and employment growth to 2020 at a jurisdiction and Community Type level. This information has been sent to local jurisdiction planning departments for their review and comment, in tandem with their review of the Discussion Draft Preferred Land Use and Transportation Scenario for 2036. The 2036 scenario was sent to local agencies for review on January 26, 2015. The Discussion Draft Preferred Land Use Scenario for 2020 and 2036 is included in Attachment D. Key Staff: Sharon Sprowls, Senior Program Specialist, (916) 340-6235
Kacey Lizon, Planning Manager (916) 340-6265 Jennifer Hargrove, Associate Planner (916) 340-6216
I tem 15-2-12Handout 2
Jobs/Housing Balance, Jobs Centers and Transportation
Summary To allow the Metropolitan Transportation Plan/Sustainable Communities Strategy (MTP/SCS) to achieve its greenhouse gas reduction targets and air quality conformity targets, the Framework for a Draft Preferred Scenario specifies that the land use forecast of the plan should have as much or slightly more improvement in sub-regional jobs/housing balance as in the current MTP/SCS. The reason for this emphasis is that regional accessibility to jobs, or the number of jobs within a reasonable drive time from a place of residence, explains much of the travel performance difference between the three scenarios that are being used to inform the update of the MTP/SCS. In areas within the existing urbanized area, regional accessibility is usually higher, and in outlying areas or areas on the urban/suburban edge, it tends to be lower. Increased regional accessibility to jobs means shorter driving trips and a corresponding decrease in vehicle miles traveled and air emissions.
There are multiple travel benefits to sub-regional jobs/housing balance. The Discussion Draft Preferred Scenario (Discussion Draft), with its improvement in sub-regional jobs/housing balance and supporting transportation investments, achieves the following travel improvements into regional employment centers:
• Average commute vehicle miles traveled (VMT) per worker within the regionalemployment centers declines over time.
• Transit, bike and walk mode share for commute travel to regional employment centersincreases over time.
• Average auto commute time to regional employment centers decreases over time (thisis an average commute time of both single-occupancy vehicles and carpools toworkplace).
Fourteen regional employment centers were identified as part of this analysis. The memo herein discusses 1) the definition of jobs/housing balance, 2) the definition of employment centers as applied in the Discussion Draft, and 3) the travel performance of workers to each of the fourteen regional employment centers in the Discussion Draft. Staff is also willing and able to run this analysis for smaller job centers upon request. In the February Board workshop, staff will brief the Board on the fundamental assumptions in this memo and solicit questions and comments that will be used to further refine the regional jobs center definition and related transportation performance outcomes.
1
Attachment A
I tem 15-2-12 Handout 2 1. Definition of Jobs/Housing Balance The relationship between the number of households and jobs has long been used as an indicator of the potential for longer (or shorter) commutes. The most common quantitative statement of the relationship is the “jobs/housing balance” (J/HB). In areas with very low J/HB (i.e. few jobs for the number of households in the area), many workers need to commute out of their residence area to find work. In areas with very high J/HB (i.e. many jobs for the number of households in the area), jobs need to be filled by workers from outside the area. Areas with high or low J/HB’s, all else being equal, are likely to generate longer commutes for workers. This is the most basic assumed relationship of the balance between J/HB, and the need for travel. The reality of the relationship between jobs and housing is far more complex than the J/HB portrays, though, for several reasons:
• The true relationship is not between jobs and housing, but between jobs and workers—housing has long been treated as a proxy for workers and worker residence. In reality, the number of workers per household varies widely across the region, and different types of housing have the capacity for accommodating different numbers of workers.
• J/HB is dependent on the geography used for the computation—but there is no “right” geography to use. Example: One jurisdiction has a housing-rich J/HB (say 10,000 households and 3,000 jobs, or a J/HB of 0.3). An adjacent jurisdiction has jobs-rich J/HB (13,000 jobs and 2,000 households, or a J/HB of 6.5). Both jurisdictions combined, with a total of 16,000 jobs and 12,000 houses, has a “good” J/HB of 1.3. Which of these three J/HB’s is worth paying attention to?
• Areas with “good” J/HB may still force longer commutes for workers, if the housing available in the area is unaffordable or unattractive to the workers filling jobs in the area. For example, if most of the jobs in a given area pay minimum wage, does the presence of sufficient market-rate housing to theoretically house all these workers (i.e. a “good” J/HB of 1.2) mean the area has good J/HB?
• Finally, employment necessarily agglomerates and concentrates in specific areas. For example, industrial/warehouse areas are usually homogenous employment areas, with little or no housing, for good reason—they are unattractive areas in which to reside. Even for office and service employment centers, where attractive housing could be located, employment uses often out-compete housing as a land use in those centers, for economic reasons. So, for good planning and economic reasons, healthy, vibrant employment centers tend to have “poor” (and usually jobs-rich) J/HB’s.
2
I tem 15-2-12Handout 2
These issues, among others, have stimulated a reappraisal of J/HB as a worthwhile indicator of the relationship between jobs and housing, and a move toward the notion of “fit” between jobs (where people work) and housing (where workers reside). SACOG staff used a measure of J/HB as an indicator for the 2012 MTP/SCS update, and proposes to use this measure for the MTP/SCS update. This measure would be based on the following principles and guidelines:
• Use as a target regional average J/HB. In 2008, the regional J/HB was about 1.2, or 1.2jobs per household. This ratio dropped to 1.06 by 2012, due to the loss of employmentin the recession. Because 2008 was a more normal year in the regional economy, andbased on regional forecasts, the region is expected to return to about that ratio of jobsto households by 2036, 1.2 is proposed as a target for evaluating J/HB. That is, thedegree to which an area which moves toward 1.2 is considered improvement in J/HB.So, a jobs-rich area with, say 1.9 jobs per household, would improve by adding morehousing than jobs, and thereby moving J/HB toward 1.2. A housing-rich area with, say,0.5 jobs per household, would improve by adding more jobs than housing, and therebyincreasing J/HB toward 1.2.
• Accept the fact that employment, in a healthy regional economy, has and will continueto cluster and agglomerate in centers, within which “good” J/HB is very difficult, andundesired-able in some cases, to achieve. J/HB targets must be set for employmentcenters and a reasonable area around the centers, and not necessarily within thecenters.
• Use an objective definition of employment centers, based on the size, concentration,and future capacity of jobs centers within the region, to identify employment areas ofinterest for assessing and measuring the balance between jobs and potential locationsof residence for workers in and around those centers.
• Use an consistent distance measure from employment centers to identify surroundingareas of interest for measuring the fit between jobs and worker residence. For example,the median one-way commute distance for workers in the Sacramento region is abouteight miles. For the 2012 MTP/SCS, areas within four miles of employment centers weredefined as J/HB areas. Four miles is significantly lower than the median commutedistance, and improving the balance between jobs and housing within this distanceshould support shorting of commute distances. Four miles is also a distance within areasonable bicycle distance, and could be served with local transit service. For the 2016MTP/SCS update, continued use of the four-mile area around employment centers isproposed.
• In the near term, the simple balance or ratio between jobs and housing units in J/HBareas will be the metric provided. Ultimately, in addition to total numbers of jobs andhouseholds, the distribution of wages paid at the jobs center, and housing cost in the
3
I tem 15-2-12Handout 2
surrounding J/HB area, should be taken into account in measuring the “fit” between jobs and housing, rather than just the “balance”. This more sophisticated measure of fit will take significant research and data collection to develop, and will not happen in the course of the 2016 MTP/SCS update.
Table 1 provides a county-level tally of jobs and households, based on the Discussion Draft land use forecast for the MTP/SCS update. At county level, J/HB improves for El Dorado County, and is stable for other counties. However, as discussed above, jurisdictional assessments of J/HB may miss significant J/HB issues based on distributions of jobs, households and worker flows which cross jurisdiction boundaries, and are defined by specific jobs centers below county level.
Table 1. Jobs and Households by County, 2008 and 2036
Jobs Households Jobs/Housing Balance
County 2008 2036 2008 2036 2008 2036 El Dorado /1/ 44,763 64,078 55,305 70,094 0.81 0.91
Placer /1/ 141,613 209,047 124,761 185,698 1.14 1.13
Sacramento 626,155 831,169 510,550 696,759 1.23 1.19
Sutter 31,751 43,805 31,314 43,485 1.01 1.01
Yolo 102,378 146,509 67,928 99,779 1.51 1.47
Yuba 23,178 32,497 23,482 32,941 0.99 0.99
Regional Total 969,838 1,327,105 813,340 1,128,756 1.19 1.18 Source: SACOG, February 2015. /1/ Excludes Tahoe Basin.
2. Definition of Employment CentersFor purposes of evaluating land uses for the 2016 MTP/SCS, J/HB will be assessed for a set of fourteen employment centers. Centers are defined as:
• Concentrations of at least 10,000 “base” jobs (i.e. including manufacturing, office,medical, educational, and service employment, and excluding “residential-serving”sectors like retail and restaurant uses), at average density of eight or more jobs peracre. “Base” jobs were considered in defining the centers, because these jobs are moredirectly related to economic vitality and competitiveness in the region.
• Centers were defined where 80 percent or more of the uses within the center wereemployment, not residential. Little housing was provided within the center, and J/HBmust be achieved in areas around the centers.
4
I tem 15-2-12 Handout 2 Figure 1 shows the geography of 14 employment centers meeting the above criteria. The map shows the underlying 2036 land use mix (with predominantly employment in blue, predominantly residential in yellow and brown, and areas with mixed use in pink), and density (by intensity or darkness of color, with the lightest areas being the least dense, and the darkest, the most dense. The figure also shows the combined four-mile radii around all fourteen centers. This map is provided for illustrative purposes only. The identification of employment centers could be changed, as could the four-mile J/HB areas around the centers. If this concept seems like a reasonable way to move forward in dealing with the relationship between jobs and housing, staff will work to refine it. We could add any other smaller job centers as needed or requested. Table 2 provides a tally of jobs and households within the employment centers themselves. Just under one-half of all jobs in the region are located within the 14 employment centers. A very small share (8 to 12 percent) of the region’s households are located within employment centers, which supports the concept of the four-mile “sheds” around these centers assessing progress toward J/HB. Table 2 also provides a tally of jobs and households within the combined four-mile radius around all employment centers. Just over 80 percent of all jobs, but less than 75 percent of all households, are located in the combined four-mile radius around all centers. Ideally, a J/HB metric would be produced for each employment center, to allow for assessment of each the J/HB around each center. A complicating factor in this calculation, though, is that the four-mile radii around each center overlap with that of other centers. A simple calculation of the total households and jobs within each four-mile radius would double, triple, and quadruple count many households. A second complicating factor is that, as shown in Table 2 and illustrated in Figure 1, a significant percentage of employment is located outside the centers. The center definition is used for identifying core employment areas for defining J/HB, but the jobs outside the centers, but within the combined four-mile radius area, are relevant to J/HB. For the 2012 MTP/SCS, SACOG developed an approach for calculating J/HB by employment center, by essentially “splitting” both jobs and households in areas where the four-mile radii overlap, and crediting each center with the split jobs and households within the four-mile radius of that center. So, if a particular area is “shared” by the four-mile radii of two employment centers, each center is credited with one-half of each job and one-half of each household in the overlapping area. This approach recognizes, in a simple way, that “competition” among centers exists for both jobs (on the household side) and workers (on the employer side). This approach also eliminates double counting of jobs and households.
5
I tem 15-2-12 Handout 2 Table 3 provides the “split” calculation of J/HB for each of the 14 employment centers. This method of computing employment center J/HB results in some interesting findings:
• In Year 2008, more centers are jobs-rich than housing-rich. Seven centers (Sacramento CBD/Riverfront, Rancho Cordova, Expo/Arden/Point West, East Sacramento Medical, North Natomas, Bradshaw/US-50, and West Sacramento Industrial Area) show up as significantly jobs-rich. Only two centers (Roseville/Douglas Corridor, McClellan) show up as significantly housing-rich.
• Based on the 2036 proposed growth allocations for the MTP/SCS, 12 of 14 centers improve in J/HB (i.e. they move closer to 1.2 over the plan horizon). Two of the centers do not improve in J/HB: Power Inn Industrial Area, and UC Davis. Power Inn gets marginally more housing rich, and UC Davis gets marginally more jobs-rich.
• Overall in the combined four-mile radius area, J/HB improves through the planning horizon, decreasing from 1.32 to 1.27 (i.e. becoming less jobs-rich in total).
• To achieve “perfect” J/HB of 1.2, 51,000 more households would need to be located within the combined four-mile radius area.
3. Travel Performance to Employment Centers Finally, Table 4 provides a snapshot of selected worker-travel characteristics to each of the 14 employment centers. Shown in the table are:
• Average commute vehicle miles traveled (VMT) per worker at the employment center. This metric declines for each center, with an overall decline for all centers of five percent.
• Transit, bike and walk mode share for commute travel to each center. This metric captures the combined non-auto travel to each center. This metric increases for all of the centers.
• Average auto commute time to each center. This is an average of both SOV and carpool times for all auto trips to each workplace. This metric improves to 11 of 14 of the centers.
6
I tem 15-2-12 Handout 2
Figure 1. Employment Centers and four-mile Jobs/Housing Balance Areas
Source: SACOG, February 2015.
7
I tem 15-2-12 Handout 2
Table 2. Jobs and Households in Employment Centers “Base” Jobs /1/ Total Jobs Households
Employment Center 2008 2036 2008 2036 2008 2036 Sacramento CBD/Riverfront 99,243 133,025 109,719 144,559 17,523 46,213
Rancho Cordova 42,837 61,031 47,764 67,300 6,646 8,584
Power Inn/Florin-Perkins 31,928 47,268 34,919 53,409 4,241 14,981
Roseville/Douglas Corridor 26,878 32,958 35,202 41,593 6,376 7,789
Expo/Arden/PointWest 26,598 23,560 35,318 32,844 7,492 9,325
East Sacramento Medical 26,004 25,151 27,786 26,487 4,063 5,216 Sunset Industrial Area 14,090 38,556 16,135 42,474 482 1,947
Yuba City/Marysville/SR20 Corridor 17,398 23,992 23,834 30,599 6,122 7,852
North Natomas 13,772 24,641 18,667 33,831 4,889 10,229
Folsom 11,962 12,017 13,929 14,421 2,016 2,482
UC Davis 16,793 29,856 18,987 31,973 2,015 3,733 Bradshaw/US-50 10,606 13,707 11,694 15,286 2,411 4,204
West Sacramento Industrial Area 20,893 21,754 23,867 25,049 1,650 2,758
McClellan 11,931 31,439 13,757 34,998 1,690 5,234
Total of All Employment Centers 370,933 518,954 431,578 594,822 67,616 130,547
Total in Centers + four-mile Radius
646,152 883,282 795,412 1,078,971 604,069 848,726
Total In Region
779,956
1,063,483 969,838 1,327,105 813,340 1,128,756 % of Region in Centers 48% 49% 45% 45% 8% 12%
% of Region w/in 4 miles of All Centers 83% 83% 82% 81% 74% 75% Source: SACOG, February 2015. /1/ “Base” jobs do not include retail and restaurant/food sectors.
8
I tem 15-2-12 Handout 2
Table 3. Jobs and Households Split to four-mile Sheds Around Employment Centers Total Jobs /1/ Total Households /1/ Jobs / Housing Balance
Employment Centers 2008 2036 2008 2036 2008 2036 Sacramento CBD/Riverfront 72,043 86,730 38,377 55,927 1.88 1.55
Rancho Cordova 66,532 92,007 47,310 75,340 1.41 1.22 Power Inn/Florin-Perkins 79,966 99,489 77,312 100,409 1.03 0.99
Roseville/Douglas Corridor 62,141 83,536 71,084 80,545 0.87 1.04 Expo/Arden/PointWest 73,732 90,077 36,527 51,794 2.02 1.74
East Sacramento Medical 68,775 79,625 35,795 51,960 1.92 1.53 Sunset Industrial Area 53,439 99,672 49,351 86,762 1.08 1.15
Yuba City/Marysville/SR-20 40,445 53,604 37,450 49,119 1.08 1.09 North Natomas 45,075 73,306 27,387 44,874 1.65 1.63
Folsom 47,615 69,321 36,576 55,856 1.30 1.24 UC Davis 34,342 45,539 26,108 33,312 1.32 1.37
Bradshaw/US-50 44,041 60,536 22,191 31,087 1.98 1.95 West Sacramento Ind’l Area 43,367 57,599 22,227 34,379 1.95 1.68
McClellan 63,898 87,931 75,328 96,218 0.85 0.91 Total in Centers+four-mile Radius 795,412 1,078,971 604,069 848,726 1.32 1.27
Rest of Region 174,426 248,134 210,317 281,175 0.83 0.88 Region Total 969,838 1,327,105 813,340 1,128,756 1.19 1.18
Source: SACOG, February 2015. /1/ Jobs and households on this table are split amongst four-mile radius sheds around employment centers, where the sheds overlap.
9
I tem 15-2-12 Handout 2
Table 4. Worker Travel Characteristics to Employment Centers Worker Travel Characteristics
Jobs/Housing Bal. Commute VMT per Worker
Commute Transit/Bike/ Walk Share
Auto Commute Time
(One-Way, in Minutes)
Employment Center 2008 2036 2008 2036 2008 2036 2008 2036 Sacramento CBD/Riverfront 1.88 1.55 16.7 11.5 20.0% 43.9% 31.8 28.3
Rancho Cordova 1.41 1.22 22.9 19.1 2.6% 5.7% 28.4 26.3 Power Inn/Florin-Perkins 1.03 0.99 20.6 17.8 2.6% 5.1% 25.1 23.2
Roseville/Douglas Corridor 0.87 1.04 18.7 17.5 2.7% 4.4% 21.9 22.1 Expo/Arden/PointWest 2.02 1.74 18.9 17.6 4.7% 8.8% 23.4 23.6
East Sacramento Medical 1.92 1.53 18.3 16.3 10.7% 12.7% 25.4 24.2 Sunset Industrial Area 1.08 1.15 22.8 19.3 1.2% 2.1% 24.4 22.6
Yuba City/Marysville/SR-20 1.08 1.09 9.4 8.5 7.4% 9.5% 13.7 12.4 North Natomas 1.65 1.63 21.7 20.0 2.4% 6.6% 23.9 23.4
Folsom 1.30 1.24 20.2 18.1 2.1% 3.9% 26.0 23.1 UC Davis 1.32 1.37 14.2 11.7 20.7% 29.2% 33.4 35.3
Bradshaw/US-50 1.98 1.95 19.8 17.3 4.0% 9.9% 24.1 23.6 West Sacramento Industrial Area 1.95 1.68 25.2 22.3 1.3% 4.1% 27.1 25.8
McClellan 0.85 0.91 22.1 19.5 1.9% 3.2% 25.0 24.9 Total in Centers + four-mile Radius 1.32 1.27 19.1 16.1 8.2% 16.2% 26.5 25.2
Rest of Region 0.83 0.88 22.1 19.5 3.4% 4.9% 26.6 25.5 Region Total 1.19 1.18 19.9 17.4 5.6% 10.2% 26.5 25.2
Source: SACOG, February 2015. Based on travel forecasts prepared using SACSIM regional travel demand model, and the Discussion Draft land use and transportation project assumptions for Year 2036.
10
I tem 15-2-12Handout 3
Screening Questions for Project Phasing in the MTP/SCS Discussion Draft
As part of vetting the Discussion Draft Preferred Scenario transportation project list, staff is using three project screening questions in discussions with selected local agency staff to help identify transportation projects that were or could be considered for delay in the Discussion Draft project list. The purpose of this effort is to arrive at a Draft Metropolitan Transportation Plan/Sustainable Communities Strategy (MTP/SCS) that meets all federal and state financial constraint and air quality emissions requirements. The following memo summarizes these screening questions and provides examples of projects that have been analyzed with them. In the February Board workshop, staff will provide a status update on the progress to date in applying these questions to the Discussion Draft project list.
1
Attachment b
I tem 15-2-12 Handout 3
Screening Questions for Project Phasing in the MTP/SCS Discussion Draft This memo was distributed at the February 2015 Board committees
The Discussion Draft project list includes in total less roadway capacity projects, and less total added roadway capacity, than the current plan. This reduction reflects preliminary recommendations in the project list to re-phase some projects from the current plan to the “post-2036” timeframe. In some cases, these recommendations came from project sponsors; in others, from SACOG staff. Where SACOG staff recommended re-phasing to the post-2036 timeframe, the answers to three questions, drawn from the travel forecasts prepared for the Discussion Draft project list, guided the recommendations:
1) Is the roadway congested during peak demand periods, either in the base year (2012) or the planning horizon year?
2) Is the increase in capacity on the roadway greater than the projected increase in travel on the roadway?
3) Is the roadway significantly under-utilized during peak periods?
These three screening questions are by no means a comprehensive or final assessment of project performance or value. Recent information and presentations to the Board on the complexity and rigor of project benefit/cost analysis highlighted the time and resources needed to perform such project-level analysis, including time needed to develop consensus on methods. Based on the time and resources available for this update of the MTP/SCS, the simpler screening approach is a way of identifying projects which, though valuable in a longer time frame, are candidates for re-phasing in this update. The screening questions above were used to flag a relatively small subset of projects for further discussion with sponsoring agencies. These discussions are being scheduled already.
Regarding the first screening question, the logic is fairly simple: if a roadway segment is not heavily congested in the base year, and forecasts indicate that based on growth patterns and other project investments, the existing roadway is unlikely to become significantly congested in in the plan horizon, that project could potentially be re-phased to the post-2036 timeframe without undue effect on congestion in the region.
Regarding the second screening question, the logic is that if a road capacity project is being built, it should serve an increased demand for travel on that roadway. The demand for travel on a roadway may be related to growth in the vicinity, and in some cases, the growth projected near a proposed road capacity project is modest enough that the actual change in travel
2
I tem 15-2-12 Handout 3
demand is far less than the capacity added by the proposed project. In cases where the anticipated increase in demand is significantly less than the proposed increase in capacity, the project could potentially be re-phased to the post-2036 timeframe.
The third screening question comes from a more nuanced roadway utilization concept which was introduced as a regional measure in the 2012 MTP/SCS document: optimal utilization of roadways. Normal congestion and level-of-service measures tend to focus on the prevalence of over-full roadways, or roadways where capacity is insufficient to serve the expected demand, without looking at the other side of the coin: locations where capacity provided is under-utilized, even during peak periods. This is more of an economist’s view of providing roadway capacity, in which providing too much capacity is undesired-able, because it diverts resources needed to address other problems. Optimal utilization starts from the premise that during peak demand periods, roadways should be “manage-ably full”—i.e. near enough to capacity that normal operational strategies could be employed to maintain a reasonable level-of-service, though not free-flow conditions, during peak periods. The concept also recognizes that optimal utilization varies by facility type. Optimal utilization for HOV lanes, because they are intended to provide faster travel than the adjacent mixed flow lanes to provide an incentive to carpool, is well below the capacity of the HOV lane. Optimal utilization for a general purpose freeway lane, though, is at-or-about normal lane capacity. Optimal utilization for collector-and-below streets, because their main function is to provide access to residential and business land uses rather than to provide through-put capacity, is well below normal capacity for a collector street, and these roadways are expected to operate at that level even during commute periods. This concept was considered as the Discussion Draft project list was prepared, and was a factor in some of the recommendations to re-phase projects.
The table on page 3 provides examples of a few projects for which these screening questions were used, and recommended for re-phasing to post-2036 in the Discussion Draft project list.
Next steps:
S SACOG staff will be meeting with project sponsors with questions or concerns on the phasing status of their projects in the Discussion Draft project list, and will provide analysis results related to the screening questions described above. These meetings are already being scheduled starting next week.
3
I tem 15-2-12 Handout 3
Sample of Project Proposed for Re-Phasing to Post-2036 in Discussion Draft Project List
2016 Project ID TITLE PROJECT DESCRIPTION
Cost (Current $) Notes
SUT10330 Riego Road In Sutter County, Riego Road from SR 99 to Power Line Road: widen Riego Road from 2 to 4 lanes.
$9,356,000 Little current congestion; low growth in traffic forecasted
SAC20290 Franklin Boulevard Widening
In Elk Grove, from Elk Grove Blvd to Whitelock Rd.: Widen from 4 to 6 lanes.
$3,520,000 Manageable congestion; low growth in traffic forecasted
ELD19179 Sophia Pkwy. Widen: 4 lanes (divided) from Alexandria Rd. to Empire Rancho Rd. at the County Line.
$5,000,000 Low projected growth in vicinity; low growth in traffic forecasted
PLA15940 Taylor Road Widening
Widen Taylor Rd. from 2 to 4 lanes from Horseshoe Bar Road to King Road.
$425,000 Little current congestion; low growth in traffic forecasted
Source: SACOG, February 2015, Discussion Draft Project List.
4
CENTER FOR CONTINUING STUDY OF THE CALIFORNIA ECONOMY
385 HOMER AVENUE • PALO ALTO • CALIFORNIA • 94301
TELEPHONE: (650) 321-8550 FAX: (650) 321-5451
www.ccsce.com
DATE: December 15, 2014
TO: Gordon Garry, Mike McKeever and Greg Chew
FROM: Stephen Levy
SUBJECT: Review of SACOG Update
The Period to 2020
Jobs
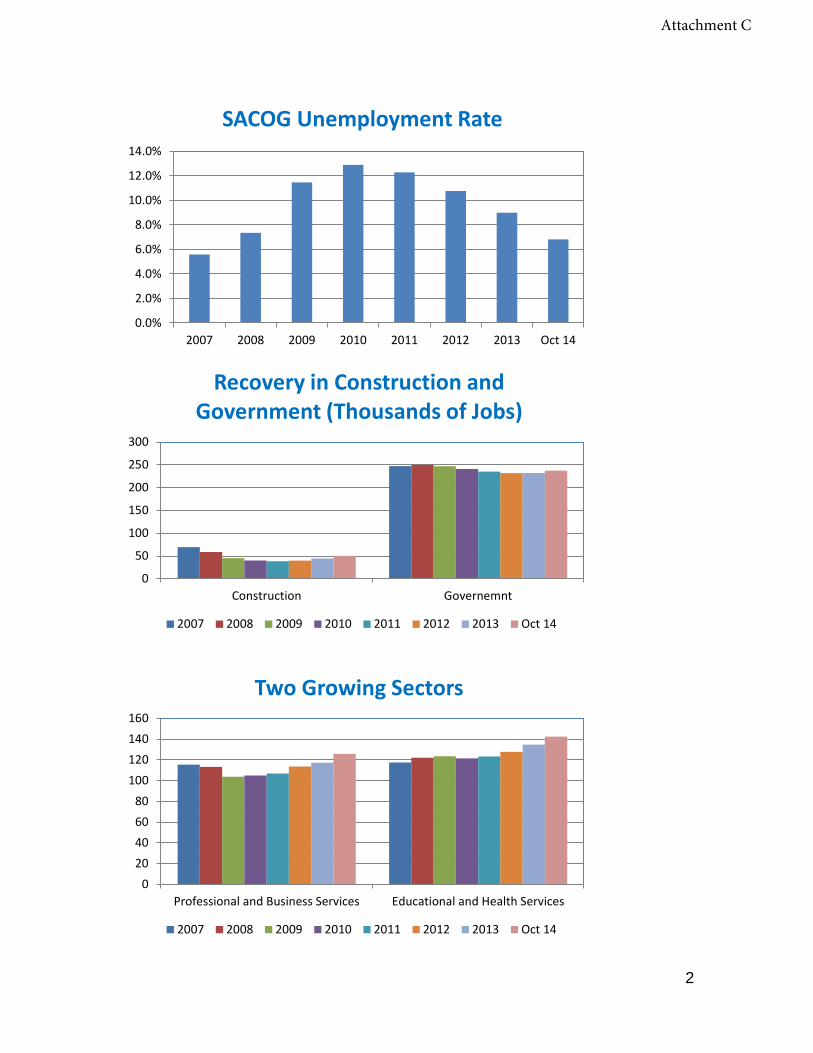
The SACOG region lags other regions in California in recovering from the recession. Job levels in October 2014 are still below pre-recession levels.
However the last 12 months have brought job growth of more than 2% and a sharp drop in the unemployment rate for the six-county region from 12.9% in 2010 to 6.8% in October 2014.
Two sectors—construction and government, heavily hit during the recession and important to the regional economy, have begun to recover. The state budget is growing again as revenues surge and construction is finally picking up. The other large sectors—Professional and Business Services and Health Care—showed substantial growth in the past 12 months and exceed pre-recession levels.
800000820000840000860000880000900000920000940000960000980000
Jul07
Jan08
Jan09
Jan10
Jan11
Jan12
Jan13
Feb14
Oct14
Jobs in SACOG Metro Areas
Attachment C
1
0.0%
2.0%
4.0%
6.0%
8.0%
10.0%
12.0%
14.0%
2007 2008 2009 2010 2011 2012 2013 Oct 14
SACOG Unemployment Rate
0
50
100
150
200
250
300
Construction Governemnt
Recovery in Construction and Government (Thousands of Jobs)
2007 2008 2009 2010 2011 2012 2013 Oct 14
020406080
100120140160
Professional and Business Services Educational and Health Services
Two Growing Sectors
2007 2008 2009 2010 2011 2012 2013 Oct 14
2
Attachment C
The forecast update for 2020 is reasonable. The forecast expects about 17,500 jobs a year to be added between 2014 and 2020. The new UCLA state forecast released on December 10th anticipates strong job growth of over 2% for each of the next two years, which could add almost half the forecast SACOG job growth by early 2017. In addition the housing cost gap between the region and the Bay Area has widened again making the SACOG region more attractive. The region should come close to the 2012 MTP/SCS forecast as it already took account of the deep recession but the update, which shows a small decrease from the 2012 MTP/SCS forecast, is prudent given the slower pace of recovery in the region.
Much will depend, as discussed below, on the pace of housing growth between 2014 and 2020.
Population
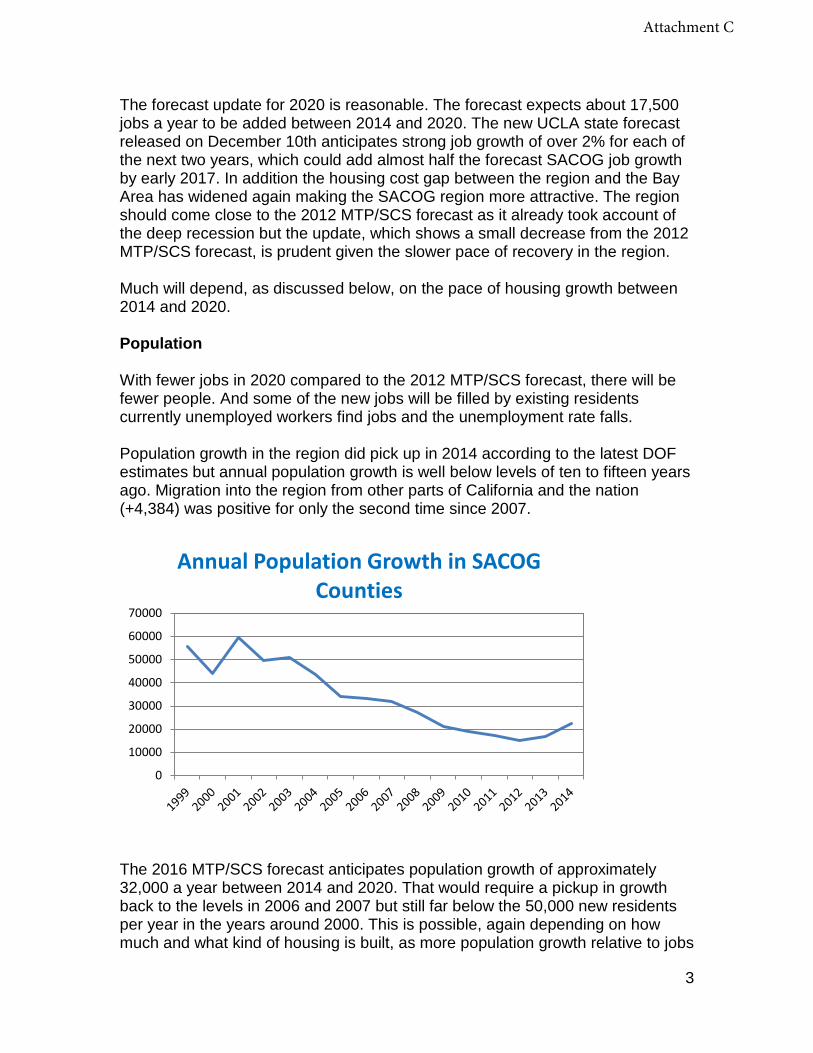
With fewer jobs in 2020 compared to the 2012 MTP/SCS forecast, there will be fewer people. And some of the new jobs will be filled by existing residents currently unemployed workers find jobs and the unemployment rate falls.
Population growth in the region did pick up in 2014 according to the latest DOF estimates but annual population growth is well below levels of ten to fifteen years ago. Migration into the region from other parts of California and the nation (+4,384) was positive for only the second time since 2007.
The 2016 MTP/SCS forecast anticipates population growth of approximately 32,000 a year between 2014 and 2020. That would require a pickup in growth back to the levels in 2006 and 2007 but still far below the 50,000 new residents per year in the years around 2000. This is possible, again depending on how much and what kind of housing is built, as more population growth relative to jobs
0
10000
20000
30000
40000
50000
60000
70000
Annual Population Growth in SACOG Counties
3
Attachment C
will be likely as the unemployment rate nears full employment and baby boomers retire and need to be replaced. It is more likely that the region’s population in 2020 will be slightly lower than forecast as opposed to be slightly higher.
Housing
This is the most difficult part of the forecast to assess as it depends both on job growth and migration (demand) and the response of builders (supply).
One fact is that since 2007 additions to the housing stock have lagged regional population growth. Additions to the housing stock have average just over 3,000 units a year while annual population growth has been near 20,000. Note; The household population growth estimates in the spreadsheet show lower growth within the SACOG region for 2008-2014 than the full six county DOD estimates show by a wide enough margin to be worth checking.
So there should be some pent up demand for housing as the economy improves.
On the other hand the lagging housing production since 2007 means that the 2020 housing stock total and intervening growth will certainly be less than anticipated in the 2012 MTC/SCS. The only issue is by how much will the 2020 total fall short of the 2012 plan forecast.
Both the May 2014 forecast of 966,480 units and the newer forecast of 947,980 units are possible. It is difficult without a lot more specific knowledge about land use and zoning policies and talking to builders to make a more precise assessment of what will happen in housing by 2020.
Beyond 2020
It is probably wise to reassess the long-term job outlook in the next (after 2016) MTP/SCS forecast. There are and will be significant changes in U.S. growth—population and jobs—and more data on how the SACOG region economy is progressing to warrant new projections to 2040.
DOF is about to release new long-term county population projections. I expect that there will be changes from past projections in births (lower) and Asian population growth (higher).
The state HCD is preparing new housing forecasts to 2025 that will examine the impact of demographic changes on household forming behavior. The combination of lower fertility rates and an aging population could lead to reduced housing size and a market for smaller units.
None of these changes will materially affect the outlook to 2020.
4
Attachment C
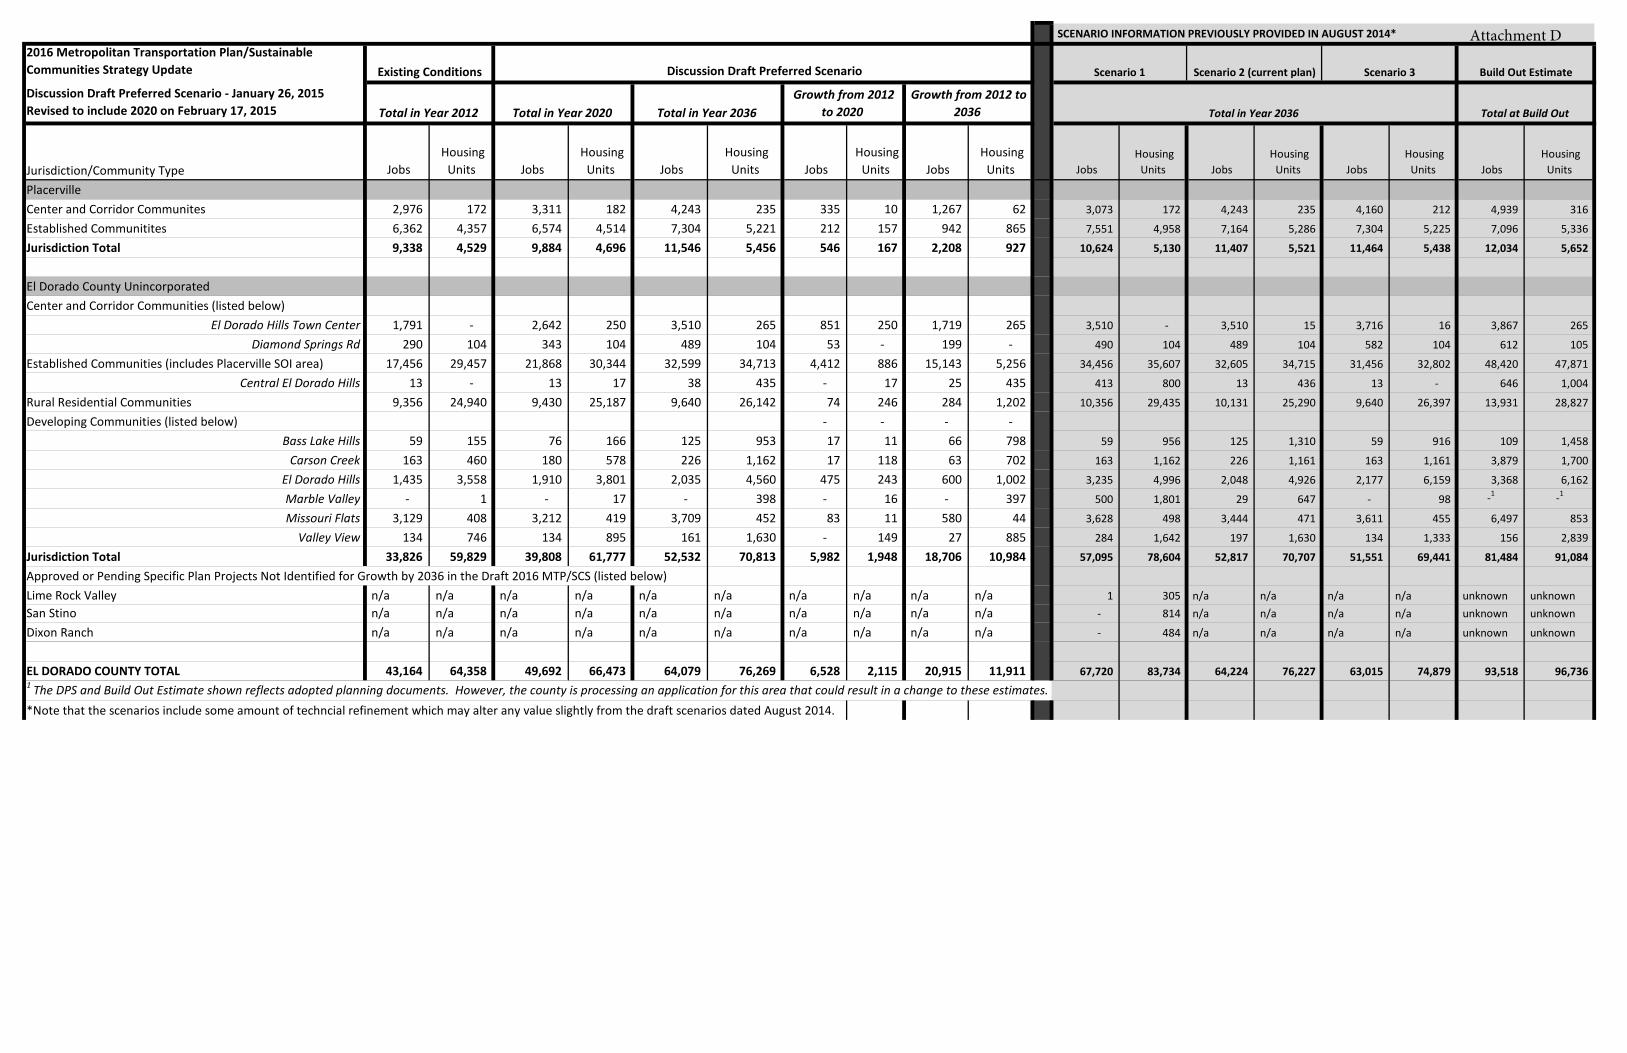
SCENARIO INFORMATION PREVIOUSLY PROVIDED IN AUGUST 2014*
2016 Metropolitan Transportation Plan/Sustainable Communities Strategy Update Build Out Estimate
Discussion Draft Preferred Scenario - January 26, 2015 Revised to include 2020 on February 17, 2015 Total in Year 2012 Total in Year 2020 Total in Year 2036 Total in Year 2036 Total at Build Out
Jurisdiction/Community Type Jobs Housing
Units Jobs Housing
Units Jobs Housing
Units Jobs Housing
Units Jobs Housing
Units Jobs Housing
Units Jobs Housing
Units Jobs Housing
Units Jobs Housing
Units
PlacervilleCenter and Corridor Communites 2,976 172 3,311 182 4,243 235 335 10 1,267 62 3,073 172 4,243 235 4,160 212 4,939 316
Established Communitites 6,362 4,357 6,574 4,514 7,304 5,221 212 157 942 865 7,551 4,958 7,164 5,286 7,304 5,225 7,096 5,336
Jurisdiction Total 9,338 4,529 9,884 4,696 11,546 5,456 546 167 2,208 927 10,624 5,130 11,407 5,521 11,464 5,438 12,034 5,652
El Dorado County UnincorporatedCenter and Corridor Communities (listed below)
El Dorado Hills Town Center 1,791 - 2,642 250 3,510 265 851 250 1,719 265 3,510 - 3,510 15 3,716 16 3,867 265
Diamond Springs Rd 290 104 343 104 489 104 53 - 199 - 490 104 489 104 582 104 612 105
Established Communities (includes Placerville SOI area) 17,456 29,457 21,868 30,344 32,599 34,713 4,412 886 15,143 5,256 34,456 35,607 32,605 34,715 31,456 32,802 48,420 47,871
Central El Dorado Hills 13 - 13 17 38 435 - 17 25 435 413 800 13 436 13 - 646 1,004
Rural Residential Communities 9,356 24,940 9,430 25,187 9,640 26,142 74 246 284 1,202 10,356 29,435 10,131 25,290 9,640 26,397 13,931 28,827
Developing Communities (listed below) - - - - Bass Lake Hills 59 155 76 166 125 953 17 11 66 798 59 956 125 1,310 59 916 109 1,458
Carson Creek 163 460 180 578 226 1,162 17 118 63 702 163 1,162 226 1,161 163 1,161 3,879 1,700
El Dorado Hills 1,435 3,558 1,910 3,801 2,035 4,560 475 243 600 1,002 3,235 4,996 2,048 4,926 2,177 6,159 3,368 6,162
Marble Valley - 1 - 17 - 398 - 16 - 397 500 1,801 29 647 - 98 -1 -1
Missouri Flats 3,129 408 3,212 419 3,709 452 83 11 580 44 3,628 498 3,444 471 3,611 455 6,497 853
Valley View 134 746 134 895 161 1,630 - 149 27 885 284 1,642 197 1,630 134 1,333 156 2,839
Jurisdiction Total 33,826 59,829 39,808 61,777 52,532 70,813 5,982 1,948 18,706 10,984 57,095 78,604 52,817 70,707 51,551 69,441 81,484 91,084
Approved or Pending Specific Plan Projects Not Identified for Growth by 2036 in the Draft 2016 MTP/SCS (listed below)Lime Rock Valley n/a n/a n/a n/a n/a n/a n/a n/a n/a n/a 1 305 n/a n/a n/a n/a unknown unknownSan Stino n/a n/a n/a n/a n/a n/a n/a n/a n/a n/a - 814 n/a n/a n/a n/a unknown unknown
Dixon Ranch n/a n/a n/a n/a n/a n/a n/a n/a n/a n/a - 484 n/a n/a n/a n/a unknown unknown
EL DORADO COUNTY TOTAL 43,164 64,358 49,692 66,473 64,079 76,269 6,528 2,115 20,915 11,911 67,720 83,734 64,224 76,227 63,015 74,879 93,518 96,736 1 The DPS and Build Out Estimate shown reflects adopted planning documents. However, the county is processing an application for this area that could result in a change to these estimates.*Note that the scenarios include some amount of techncial refinement which may alter any value slightly from the draft scenarios dated August 2014.
Scenario 3
Growth from 2012 to 2020
Growth from 2012 to 2036
Existing Conditions Scenario 1 Scenario 2 (current plan) Discussion Draft Preferred Scenario
Attachment D
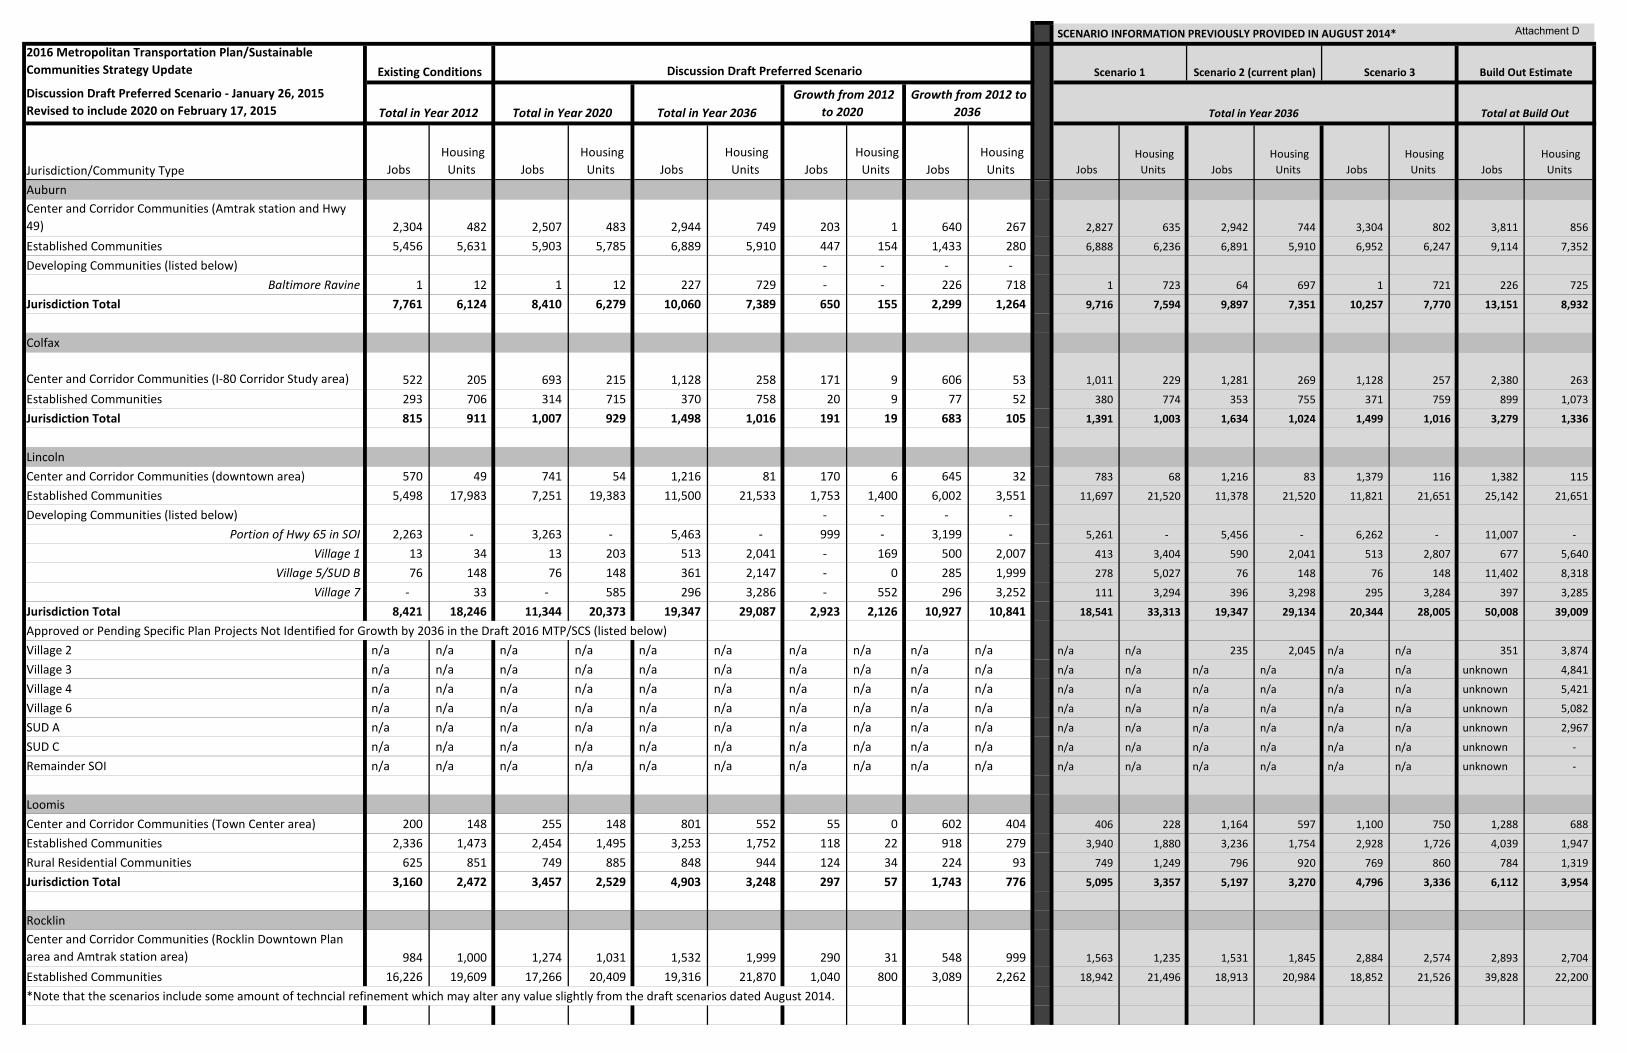
SCENARIO INFORMATION PREVIOUSLY PROVIDED IN AUGUST 2014*
2016 Metropolitan Transportation Plan/Sustainable Communities Strategy Update Build Out Estimate
Discussion Draft Preferred Scenario - January 26, 2015 Revised to include 2020 on February 17, 2015 Total in Year 2012 Total in Year 2020 Total in Year 2036 Total in Year 2036 Total at Build Out
Jurisdiction/Community Type Jobs Housing
Units Jobs Housing
Units Jobs Housing
Units Jobs Housing
Units Jobs Housing
Units Jobs Housing
Units Jobs Housing
Units Jobs Housing
Units Jobs Housing
Units
Scenario 3
Growth from 2012 to 2020
Growth from 2012 to 2036
Existing Conditions Scenario 1 Scenario 2 (current plan) Discussion Draft Preferred Scenario
Auburn Center and Corridor Communities (Amtrak station and Hwy 49) 2,304 482 2,507 483 2,944 749 203 1 640 267 2,827 635 2,942 744 3,304 802 3,811 856
Established Communities 5,456 5,631 5,903 5,785 6,889 5,910 447 154 1,433 280 6,888 6,236 6,891 5,910 6,952 6,247 9,114 7,352
Developing Communities (listed below) - - - - Baltimore Ravine 1 12 1 12 227 729 - - 226 718 1 723 64 697 1 721 226 725
Jurisdiction Total 7,761 6,124 8,410 6,279 10,060 7,389 650 155 2,299 1,264 9,716 7,594 9,897 7,351 10,257 7,770 13,151 8,932
Colfax
Center and Corridor Communities (I-80 Corridor Study area) 522 205 693 215 1,128 258 171 9 606 53 1,011 229 1,281 269 1,128 257 2,380 263
Established Communities 293 706 314 715 370 758 20 9 77 52 380 774 353 755 371 759 899 1,073
Jurisdiction Total 815 911 1,007 929 1,498 1,016 191 19 683 105 1,391 1,003 1,634 1,024 1,499 1,016 3,279 1,336
LincolnCenter and Corridor Communities (downtown area) 570 49 741 54 1,216 81 170 6 645 32 783 68 1,216 83 1,379 116 1,382 115
Established Communities 5,498 17,983 7,251 19,383 11,500 21,533 1,753 1,400 6,002 3,551 11,697 21,520 11,378 21,520 11,821 21,651 25,142 21,651
Developing Communities (listed below) - - - - Portion of Hwy 65 in SOI 2,263 - 3,263 - 5,463 - 999 - 3,199 - 5,261 - 5,456 - 6,262 - 11,007 -
Village 1 13 34 13 203 513 2,041 - 169 500 2,007 413 3,404 590 2,041 513 2,807 677 5,640
Village 5/SUD B 76 148 76 148 361 2,147 - 0 285 1,999 278 5,027 76 148 76 148 11,402 8,318
Village 7 - 33 - 585 296 3,286 - 552 296 3,252 111 3,294 396 3,298 295 3,284 397 3,285
Jurisdiction Total 8,421 18,246 11,344 20,373 19,347 29,087 2,923 2,126 10,927 10,841 18,541 33,313 19,347 29,134 20,344 28,005 50,008 39,009
Approved or Pending Specific Plan Projects Not Identified for Growth by 2036 in the Draft 2016 MTP/SCS (listed below)Village 2 n/a n/a n/a n/a n/a n/a n/a n/a n/a n/a n/a n/a 235 2,045 n/a n/a 351 3,874
Village 3 n/a n/a n/a n/a n/a n/a n/a n/a n/a n/a n/a n/a n/a n/a n/a n/a unknown 4,841
Village 4 n/a n/a n/a n/a n/a n/a n/a n/a n/a n/a n/a n/a n/a n/a n/a n/a unknown 5,421
Village 6 n/a n/a n/a n/a n/a n/a n/a n/a n/a n/a n/a n/a n/a n/a n/a n/a unknown 5,082
SUD A n/a n/a n/a n/a n/a n/a n/a n/a n/a n/a n/a n/a n/a n/a n/a n/a unknown 2,967
SUD C n/a n/a n/a n/a n/a n/a n/a n/a n/a n/a n/a n/a n/a n/a n/a n/a unknown -
Remainder SOI n/a n/a n/a n/a n/a n/a n/a n/a n/a n/a n/a n/a n/a n/a n/a n/a unknown -
LoomisCenter and Corridor Communities (Town Center area) 200 148 255 148 801 552 55 0 602 404 406 228 1,164 597 1,100 750 1,288 688
Established Communities 2,336 1,473 2,454 1,495 3,253 1,752 118 22 918 279 3,940 1,880 3,236 1,754 2,928 1,726 4,039 1,947
Rural Residential Communities 625 851 749 885 848 944 124 34 224 93 749 1,249 796 920 769 860 784 1,319
Jurisdiction Total 3,160 2,472 3,457 2,529 4,903 3,248 297 57 1,743 776 5,095 3,357 5,197 3,270 4,796 3,336 6,112 3,954
RocklinCenter and Corridor Communities (Rocklin Downtown Plan area and Amtrak station area) 984 1,000 1,274 1,031 1,532 1,999 290 31 548 999 1,563 1,235 1,531 1,845 2,884 2,574 2,893 2,704
Established Communities 16,226 19,609 17,266 20,409 19,316 21,870 1,040 800 3,089 2,262 18,942 21,496 18,913 20,984 18,852 21,526 39,828 22,200
*Note that the scenarios include some amount of techncial refinement which may alter any value slightly from the draft scenarios dated August 2014.
Attachment D
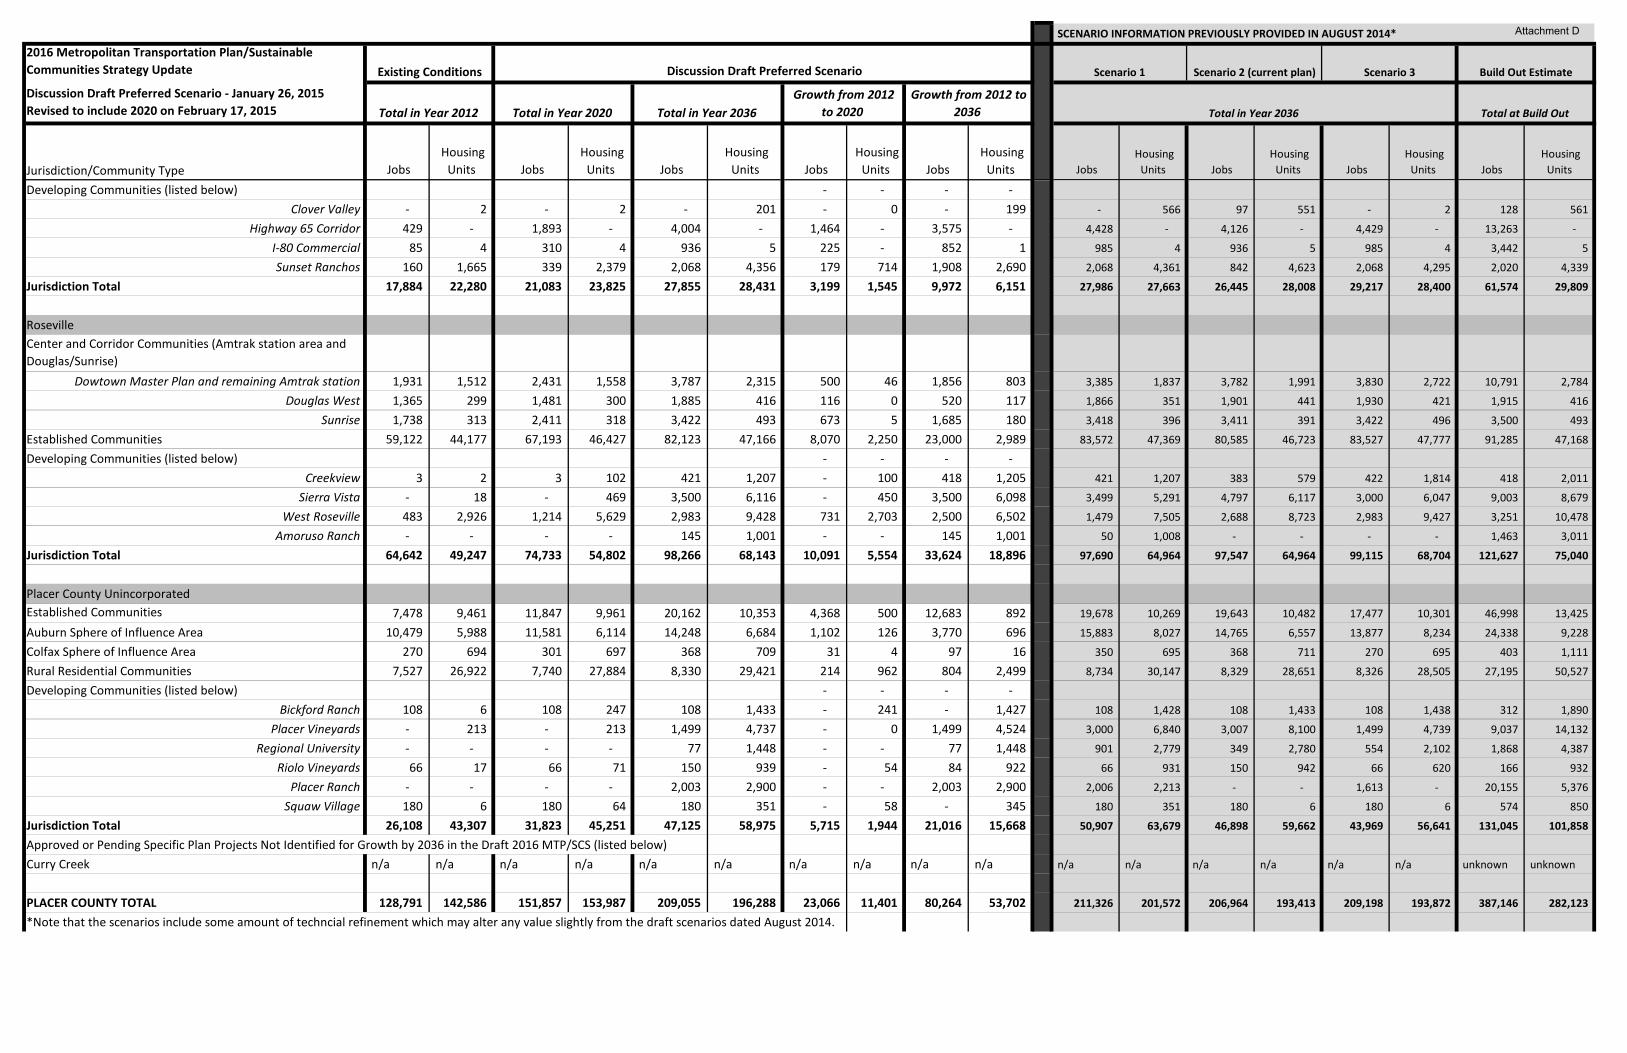
SCENARIO INFORMATION PREVIOUSLY PROVIDED IN AUGUST 2014*
2016 Metropolitan Transportation Plan/Sustainable Communities Strategy Update Build Out Estimate
Discussion Draft Preferred Scenario - January 26, 2015 Revised to include 2020 on February 17, 2015 Total in Year 2012 Total in Year 2020 Total in Year 2036 Total in Year 2036 Total at Build Out
Jurisdiction/Community Type Jobs Housing
Units Jobs Housing
Units Jobs Housing
Units Jobs Housing
Units Jobs Housing
Units Jobs Housing
Units Jobs Housing
Units Jobs Housing
Units Jobs Housing
Units
Scenario 3
Growth from 2012 to 2020
Growth from 2012 to 2036
Existing Conditions Scenario 1 Scenario 2 (current plan) Discussion Draft Preferred Scenario
Developing Communities (listed below) - - - - Clover Valley - 2 - 2 - 201 - 0 - 199 - 566 97 551 - 2 128 561
Highway 65 Corridor 429 - 1,893 - 4,004 - 1,464 - 3,575 - 4,428 - 4,126 - 4,429 - 13,263 -
I-80 Commercial 85 4 310 4 936 5 225 - 852 1 985 4 936 5 985 4 3,442 5
Sunset Ranchos 160 1,665 339 2,379 2,068 4,356 179 714 1,908 2,690 2,068 4,361 842 4,623 2,068 4,295 2,020 4,339
Jurisdiction Total 17,884 22,280 21,083 23,825 27,855 28,431 3,199 1,545 9,972 6,151 27,986 27,663 26,445 28,008 29,217 28,400 61,574 29,809
RosevilleCenter and Corridor Communities (Amtrak station area and Douglas/Sunrise)
Dowtown Master Plan and remaining Amtrak station 1,931 1,512 2,431 1,558 3,787 2,315 500 46 1,856 803 3,385 1,837 3,782 1,991 3,830 2,722 10,791 2,784
Douglas West 1,365 299 1,481 300 1,885 416 116 0 520 117 1,866 351 1,901 441 1,930 421 1,915 416
Sunrise 1,738 313 2,411 318 3,422 493 673 5 1,685 180 3,418 396 3,411 391 3,422 496 3,500 493
Established Communities 59,122 44,177 67,193 46,427 82,123 47,166 8,070 2,250 23,000 2,989 83,572 47,369 80,585 46,723 83,527 47,777 91,285 47,168
Developing Communities (listed below) - - - - Creekview 3 2 3 102 421 1,207 - 100 418 1,205 421 1,207 383 579 422 1,814 418 2,011
Sierra Vista - 18 - 469 3,500 6,116 - 450 3,500 6,098 3,499 5,291 4,797 6,117 3,000 6,047 9,003 8,679
West Roseville 483 2,926 1,214 5,629 2,983 9,428 731 2,703 2,500 6,502 1,479 7,505 2,688 8,723 2,983 9,427 3,251 10,478
Amoruso Ranch - - - - 145 1,001 - - 145 1,001 50 1,008 - - - - 1,463 3,011
Jurisdiction Total 64,642 49,247 74,733 54,802 98,266 68,143 10,091 5,554 33,624 18,896 97,690 64,964 97,547 64,964 99,115 68,704 121,627 75,040
Placer County UnincorporatedEstablished Communities 7,478 9,461 11,847 9,961 20,162 10,353 4,368 500 12,683 892 19,678 10,269 19,643 10,482 17,477 10,301 46,998 13,425
Auburn Sphere of Influence Area 10,479 5,988 11,581 6,114 14,248 6,684 1,102 126 3,770 696 15,883 8,027 14,765 6,557 13,877 8,234 24,338 9,228
Colfax Sphere of Influence Area 270 694 301 697 368 709 31 4 97 16 350 695 368 711 270 695 403 1,111
Rural Residential Communities 7,527 26,922 7,740 27,884 8,330 29,421 214 962 804 2,499 8,734 30,147 8,329 28,651 8,326 28,505 27,195 50,527
Developing Communities (listed below) - - - - Bickford Ranch 108 6 108 247 108 1,433 - 241 - 1,427 108 1,428 108 1,433 108 1,438 312 1,890
Placer Vineyards - 213 - 213 1,499 4,737 - 0 1,499 4,524 3,000 6,840 3,007 8,100 1,499 4,739 9,037 14,132
Regional University - - - - 77 1,448 - - 77 1,448 901 2,779 349 2,780 554 2,102 1,868 4,387
Riolo Vineyards 66 17 66 71 150 939 - 54 84 922 66 931 150 942 66 620 166 932
Placer Ranch - - - - 2,003 2,900 - - 2,003 2,900 2,006 2,213 - - 1,613 - 20,155 5,376
Squaw Village 180 6 180 64 180 351 - 58 - 345 180 351 180 6 180 6 574 850
Jurisdiction Total 26,108 43,307 31,823 45,251 47,125 58,975 5,715 1,944 21,016 15,668 50,907 63,679 46,898 59,662 43,969 56,641 131,045 101,858
Approved or Pending Specific Plan Projects Not Identified for Growth by 2036 in the Draft 2016 MTP/SCS (listed below)Curry Creek n/a n/a n/a n/a n/a n/a n/a n/a n/a n/a n/a n/a n/a n/a n/a n/a unknown unknown
PLACER COUNTY TOTAL 128,791 142,586 151,857 153,987 209,055 196,288 23,066 11,401 80,264 53,702 211,326 201,572 206,964 193,413 209,198 193,872 387,146 282,123
*Note that the scenarios include some amount of techncial refinement which may alter any value slightly from the draft scenarios dated August 2014.
Attachment D
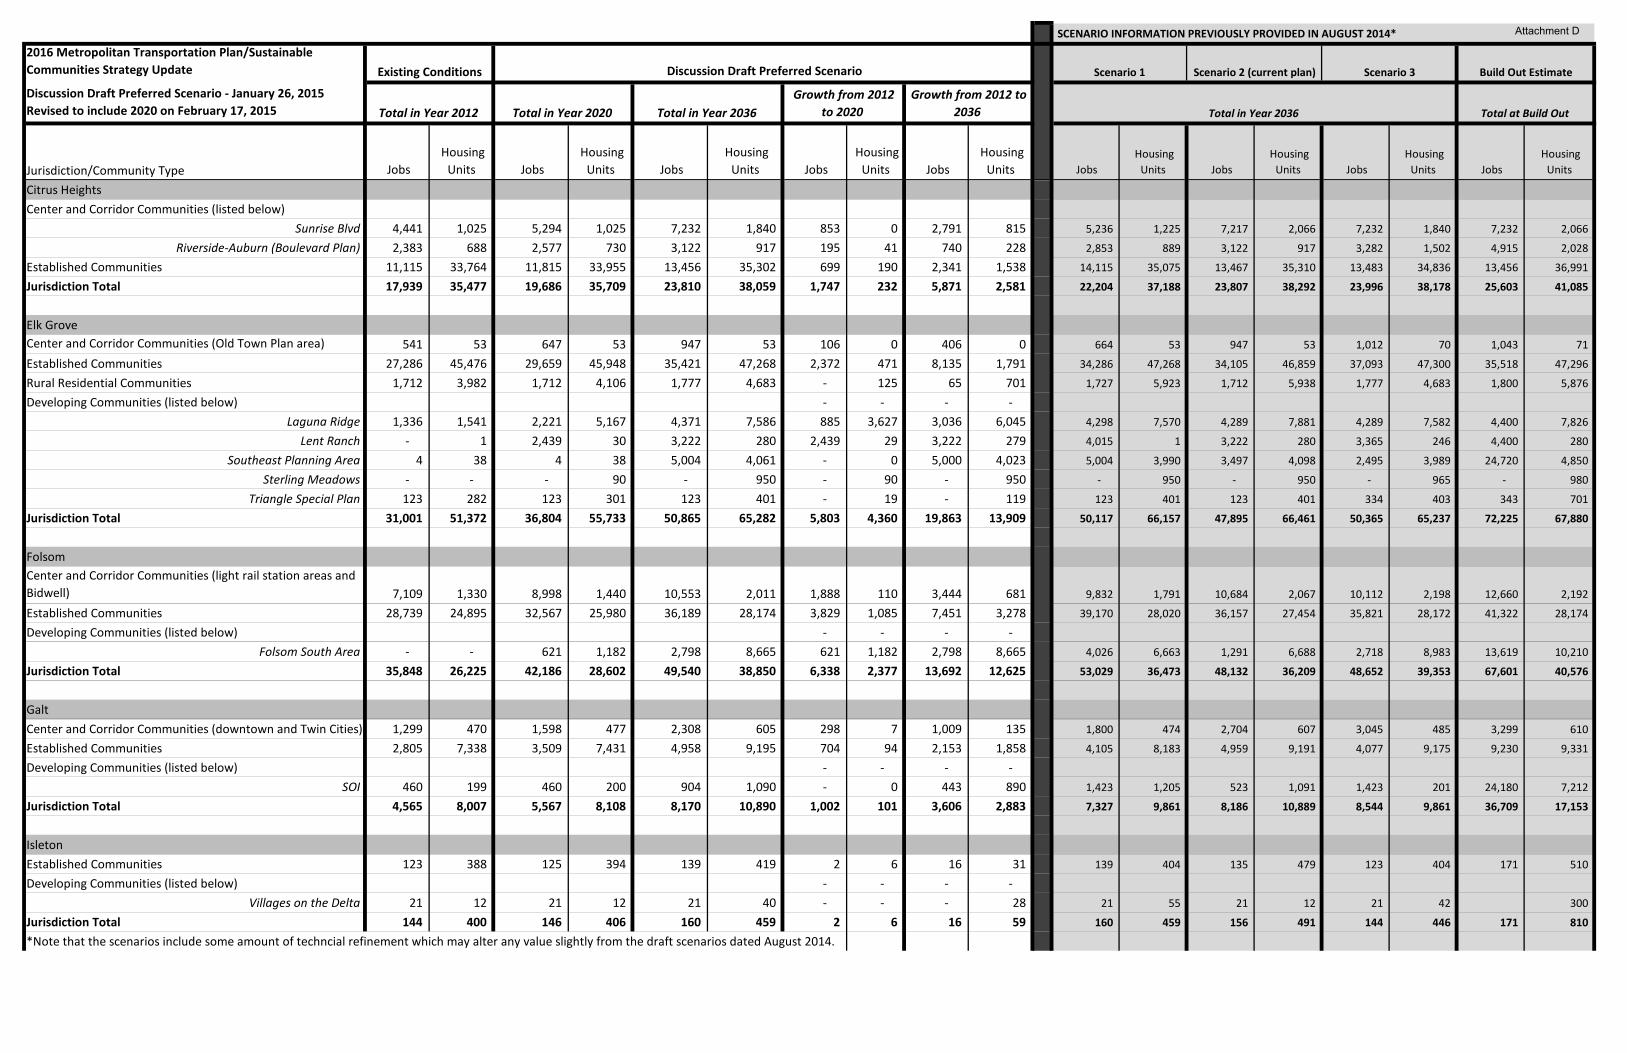
SCENARIO INFORMATION PREVIOUSLY PROVIDED IN AUGUST 2014*
2016 Metropolitan Transportation Plan/Sustainable Communities Strategy Update Build Out Estimate
Discussion Draft Preferred Scenario - January 26, 2015 Revised to include 2020 on February 17, 2015 Total in Year 2012 Total in Year 2020 Total in Year 2036 Total in Year 2036 Total at Build Out
Jurisdiction/Community Type Jobs Housing
Units Jobs Housing
Units Jobs Housing
Units Jobs Housing
Units Jobs Housing
Units Jobs Housing
Units Jobs Housing
Units Jobs Housing
Units Jobs Housing
Units
Scenario 3
Growth from 2012 to 2020
Growth from 2012 to 2036
Existing Conditions Scenario 1 Scenario 2 (current plan) Discussion Draft Preferred Scenario
Citrus HeightsCenter and Corridor Communities (listed below)
Sunrise Blvd 4,441 1,025 5,294 1,025 7,232 1,840 853 0 2,791 815 5,236 1,225 7,217 2,066 7,232 1,840 7,232 2,066
Riverside-Auburn (Boulevard Plan) 2,383 688 2,577 730 3,122 917 195 41 740 228 2,853 889 3,122 917 3,282 1,502 4,915 2,028
Established Communities 11,115 33,764 11,815 33,955 13,456 35,302 699 190 2,341 1,538 14,115 35,075 13,467 35,310 13,483 34,836 13,456 36,991
Jurisdiction Total 17,939 35,477 19,686 35,709 23,810 38,059 1,747 232 5,871 2,581 22,204 37,188 23,807 38,292 23,996 38,178 25,603 41,085
Elk GroveCenter and Corridor Communities (Old Town Plan area) 541 53 647 53 947 53 106 0 406 0 664 53 947 53 1,012 70 1,043 71
Established Communities 27,286 45,476 29,659 45,948 35,421 47,268 2,372 471 8,135 1,791 34,286 47,268 34,105 46,859 37,093 47,300 35,518 47,296
Rural Residential Communities 1,712 3,982 1,712 4,106 1,777 4,683 - 125 65 701 1,727 5,923 1,712 5,938 1,777 4,683 1,800 5,876
Developing Communities (listed below) - - - - Laguna Ridge 1,336 1,541 2,221 5,167 4,371 7,586 885 3,627 3,036 6,045 4,298 7,570 4,289 7,881 4,289 7,582 4,400 7,826
Lent Ranch - 1 2,439 30 3,222 280 2,439 29 3,222 279 4,015 1 3,222 280 3,365 246 4,400 280
Southeast Planning Area 4 38 4 38 5,004 4,061 - 0 5,000 4,023 5,004 3,990 3,497 4,098 2,495 3,989 24,720 4,850
Sterling Meadows - - - 90 - 950 - 90 - 950 - 950 - 950 - 965 - 980
Triangle Special Plan 123 282 123 301 123 401 - 19 - 119 123 401 123 401 334 403 343 701
Jurisdiction Total 31,001 51,372 36,804 55,733 50,865 65,282 5,803 4,360 19,863 13,909 50,117 66,157 47,895 66,461 50,365 65,237 72,225 67,880
FolsomCenter and Corridor Communities (light rail station areas and Bidwell) 7,109 1,330 8,998 1,440 10,553 2,011 1,888 110 3,444 681 9,832 1,791 10,684 2,067 10,112 2,198 12,660 2,192
Established Communities 28,739 24,895 32,567 25,980 36,189 28,174 3,829 1,085 7,451 3,278 39,170 28,020 36,157 27,454 35,821 28,172 41,322 28,174
Developing Communities (listed below) - - - - Folsom South Area - - 621 1,182 2,798 8,665 621 1,182 2,798 8,665 4,026 6,663 1,291 6,688 2,718 8,983 13,619 10,210
Jurisdiction Total 35,848 26,225 42,186 28,602 49,540 38,850 6,338 2,377 13,692 12,625 53,029 36,473 48,132 36,209 48,652 39,353 67,601 40,576
GaltCenter and Corridor Communities (downtown and Twin Cities) 1,299 470 1,598 477 2,308 605 298 7 1,009 135 1,800 474 2,704 607 3,045 485 3,299 610
Established Communities 2,805 7,338 3,509 7,431 4,958 9,195 704 94 2,153 1,858 4,105 8,183 4,959 9,191 4,077 9,175 9,230 9,331
Developing Communities (listed below) - - - - SOI 460 199 460 200 904 1,090 - 0 443 890 1,423 1,205 523 1,091 1,423 201 24,180 7,212
Jurisdiction Total 4,565 8,007 5,567 8,108 8,170 10,890 1,002 101 3,606 2,883 7,327 9,861 8,186 10,889 8,544 9,861 36,709 17,153
Isleton Established Communities 123 388 125 394 139 419 2 6 16 31 139 404 135 479 123 404 171 510
Developing Communities (listed below) - - - - Villages on the Delta 21 12 21 12 21 40 - - - 28 21 55 21 12 21 42 300
Jurisdiction Total 144 400 146 406 160 459 2 6 16 59 160 459 156 491 144 446 171 810
*Note that the scenarios include some amount of techncial refinement which may alter any value slightly from the draft scenarios dated August 2014.
Attachment D
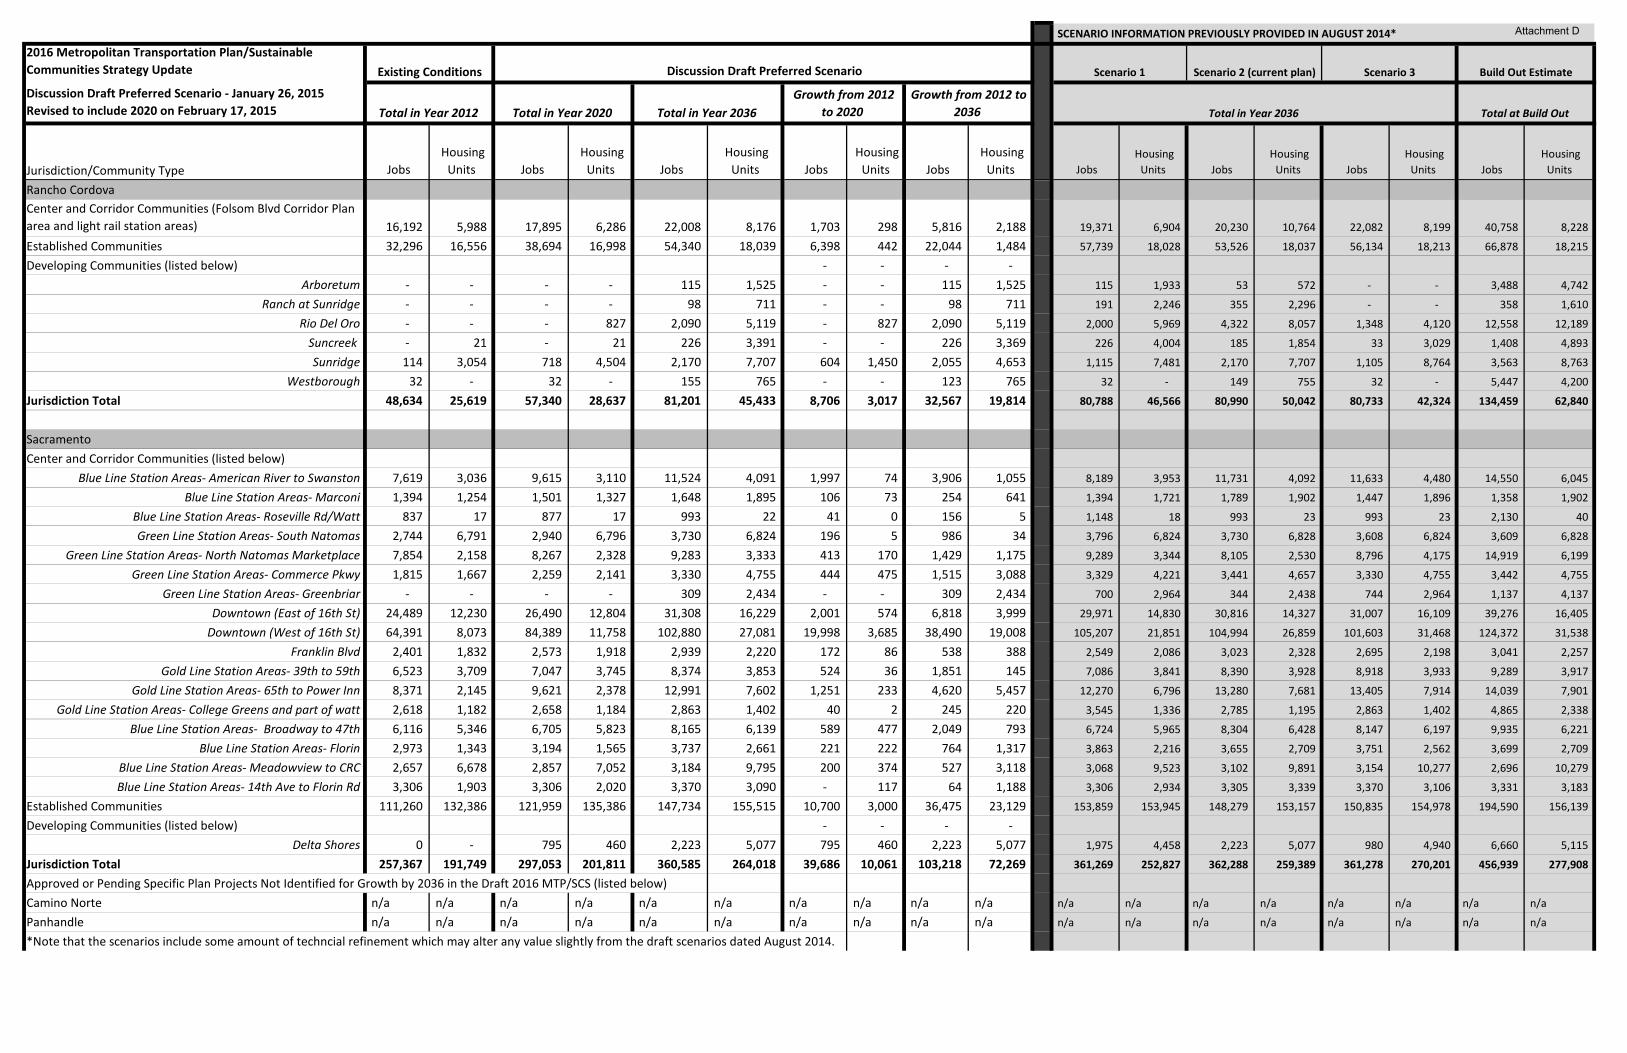
SCENARIO INFORMATION PREVIOUSLY PROVIDED IN AUGUST 2014*
2016 Metropolitan Transportation Plan/Sustainable Communities Strategy Update Build Out Estimate
Discussion Draft Preferred Scenario - January 26, 2015 Revised to include 2020 on February 17, 2015 Total in Year 2012 Total in Year 2020 Total in Year 2036 Total in Year 2036 Total at Build Out
Jurisdiction/Community Type Jobs Housing
Units Jobs Housing
Units Jobs Housing
Units Jobs Housing
Units Jobs Housing
Units Jobs Housing
Units Jobs Housing
Units Jobs Housing
Units Jobs Housing
Units
Scenario 3
Growth from 2012 to 2020
Growth from 2012 to 2036
Existing Conditions Scenario 1 Scenario 2 (current plan) Discussion Draft Preferred Scenario
Rancho CordovaCenter and Corridor Communities (Folsom Blvd Corridor Plan area and light rail station areas) 16,192 5,988 17,895 6,286 22,008 8,176 1,703 298 5,816 2,188 19,371 6,904 20,230 10,764 22,082 8,199 40,758 8,228
Established Communities 32,296 16,556 38,694 16,998 54,340 18,039 6,398 442 22,044 1,484 57,739 18,028 53,526 18,037 56,134 18,213 66,878 18,215
Developing Communities (listed below) - - - - Arboretum - - - - 115 1,525 - - 115 1,525 115 1,933 53 572 - - 3,488 4,742
Ranch at Sunridge - - - - 98 711 - - 98 711 191 2,246 355 2,296 - - 358 1,610
Rio Del Oro - - - 827 2,090 5,119 - 827 2,090 5,119 2,000 5,969 4,322 8,057 1,348 4,120 12,558 12,189
Suncreek - 21 - 21 226 3,391 - - 226 3,369 226 4,004 185 1,854 33 3,029 1,408 4,893
Sunridge 114 3,054 718 4,504 2,170 7,707 604 1,450 2,055 4,653 1,115 7,481 2,170 7,707 1,105 8,764 3,563 8,763
Westborough 32 - 32 - 155 765 - - 123 765 32 - 149 755 32 - 5,447 4,200
Jurisdiction Total 48,634 25,619 57,340 28,637 81,201 45,433 8,706 3,017 32,567 19,814 80,788 46,566 80,990 50,042 80,733 42,324 134,459 62,840
SacramentoCenter and Corridor Communities (listed below)
Blue Line Station Areas- American River to Swanston 7,619 3,036 9,615 3,110 11,524 4,091 1,997 74 3,906 1,055 8,189 3,953 11,731 4,092 11,633 4,480 14,550 6,045
Blue Line Station Areas- Marconi 1,394 1,254 1,501 1,327 1,648 1,895 106 73 254 641 1,394 1,721 1,789 1,902 1,447 1,896 1,358 1,902
Blue Line Station Areas- Roseville Rd/Watt 837 17 877 17 993 22 41 0 156 5 1,148 18 993 23 993 23 2,130 40
Green Line Station Areas- South Natomas 2,744 6,791 2,940 6,796 3,730 6,824 196 5 986 34 3,796 6,824 3,730 6,828 3,608 6,824 3,609 6,828
Green Line Station Areas- North Natomas Marketplace 7,854 2,158 8,267 2,328 9,283 3,333 413 170 1,429 1,175 9,289 3,344 8,105 2,530 8,796 4,175 14,919 6,199
Green Line Station Areas- Commerce Pkwy 1,815 1,667 2,259 2,141 3,330 4,755 444 475 1,515 3,088 3,329 4,221 3,441 4,657 3,330 4,755 3,442 4,755
Green Line Station Areas- Greenbriar - - - - 309 2,434 - - 309 2,434 700 2,964 344 2,438 744 2,964 1,137 4,137
Downtown (East of 16th St) 24,489 12,230 26,490 12,804 31,308 16,229 2,001 574 6,818 3,999 29,971 14,830 30,816 14,327 31,007 16,109 39,276 16,405
Downtown (West of 16th St) 64,391 8,073 84,389 11,758 102,880 27,081 19,998 3,685 38,490 19,008 105,207 21,851 104,994 26,859 101,603 31,468 124,372 31,538
Franklin Blvd 2,401 1,832 2,573 1,918 2,939 2,220 172 86 538 388 2,549 2,086 3,023 2,328 2,695 2,198 3,041 2,257
Gold Line Station Areas- 39th to 59th 6,523 3,709 7,047 3,745 8,374 3,853 524 36 1,851 145 7,086 3,841 8,390 3,928 8,918 3,933 9,289 3,917
Gold Line Station Areas- 65th to Power Inn 8,371 2,145 9,621 2,378 12,991 7,602 1,251 233 4,620 5,457 12,270 6,796 13,280 7,681 13,405 7,914 14,039 7,901
Gold Line Station Areas- College Greens and part of watt 2,618 1,182 2,658 1,184 2,863 1,402 40 2 245 220 3,545 1,336 2,785 1,195 2,863 1,402 4,865 2,338
Blue Line Station Areas- Broadway to 47th 6,116 5,346 6,705 5,823 8,165 6,139 589 477 2,049 793 6,724 5,965 8,304 6,428 8,147 6,197 9,935 6,221
Blue Line Station Areas- Florin 2,973 1,343 3,194 1,565 3,737 2,661 221 222 764 1,317 3,863 2,216 3,655 2,709 3,751 2,562 3,699 2,709
Blue Line Station Areas- Meadowview to CRC 2,657 6,678 2,857 7,052 3,184 9,795 200 374 527 3,118 3,068 9,523 3,102 9,891 3,154 10,277 2,696 10,279
Blue Line Station Areas- 14th Ave to Florin Rd 3,306 1,903 3,306 2,020 3,370 3,090 - 117 64 1,188 3,306 2,934 3,305 3,339 3,370 3,106 3,331 3,183
Established Communities 111,260 132,386 121,959 135,386 147,734 155,515 10,700 3,000 36,475 23,129 153,859 153,945 148,279 153,157 150,835 154,978 194,590 156,139
Developing Communities (listed below) - - - - Delta Shores 0 - 795 460 2,223 5,077 795 460 2,223 5,077 1,975 4,458 2,223 5,077 980 4,940 6,660 5,115
Jurisdiction Total 257,367 191,749 297,053 201,811 360,585 264,018 39,686 10,061 103,218 72,269 361,269 252,827 362,288 259,389 361,278 270,201 456,939 277,908
Approved or Pending Specific Plan Projects Not Identified for Growth by 2036 in the Draft 2016 MTP/SCS (listed below)Camino Norte n/a n/a n/a n/a n/a n/a n/a n/a n/a n/a n/a n/a n/a n/a n/a n/a n/a n/a
Panhandle n/a n/a n/a n/a n/a n/a n/a n/a n/a n/a n/a n/a n/a n/a n/a n/a n/a n/a
*Note that the scenarios include some amount of techncial refinement which may alter any value slightly from the draft scenarios dated August 2014.
Attachment D
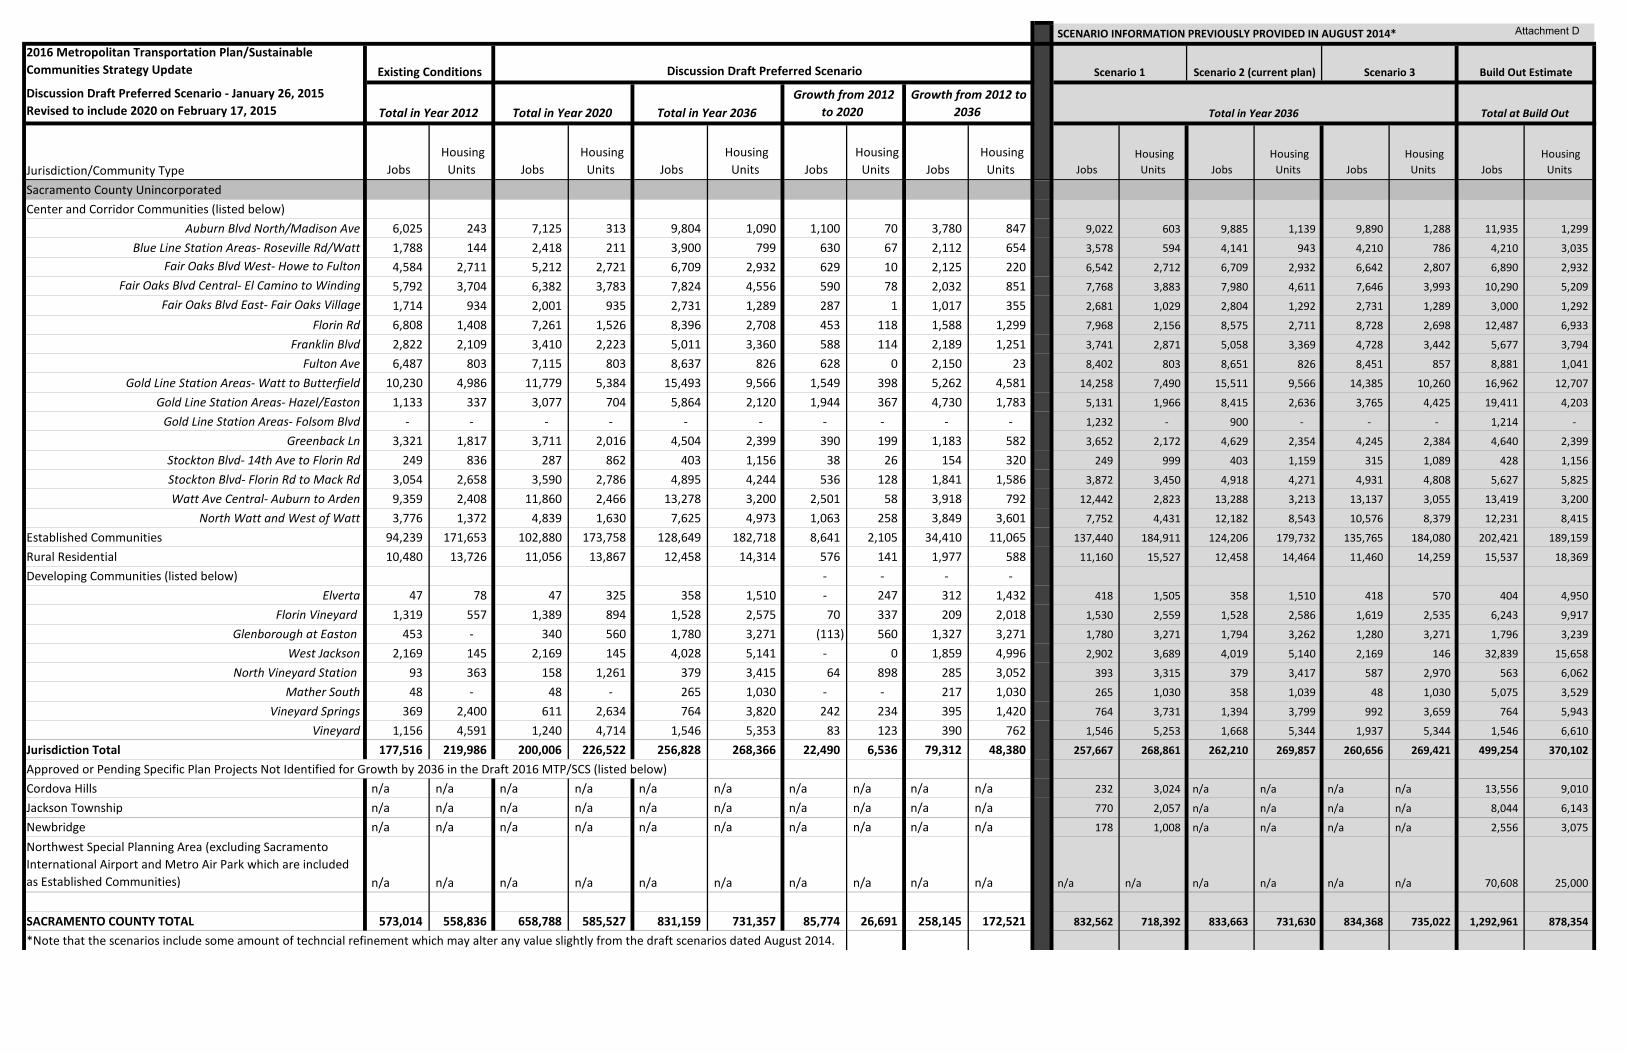
SCENARIO INFORMATION PREVIOUSLY PROVIDED IN AUGUST 2014*
2016 Metropolitan Transportation Plan/Sustainable Communities Strategy Update Build Out Estimate
Discussion Draft Preferred Scenario - January 26, 2015 Revised to include 2020 on February 17, 2015 Total in Year 2012 Total in Year 2020 Total in Year 2036 Total in Year 2036 Total at Build Out
Jurisdiction/Community Type Jobs Housing
Units Jobs Housing
Units Jobs Housing
Units Jobs Housing
Units Jobs Housing
Units Jobs Housing
Units Jobs Housing
Units Jobs Housing
Units Jobs Housing
Units
Scenario 3
Growth from 2012 to 2020
Growth from 2012 to 2036
Existing Conditions Scenario 1 Scenario 2 (current plan) Discussion Draft Preferred Scenario
Sacramento County UnincorporatedCenter and Corridor Communities (listed below)
Auburn Blvd North/Madison Ave 6,025 243 7,125 313 9,804 1,090 1,100 70 3,780 847 9,022 603 9,885 1,139 9,890 1,288 11,935 1,299
Blue Line Station Areas- Roseville Rd/Watt 1,788 144 2,418 211 3,900 799 630 67 2,112 654 3,578 594 4,141 943 4,210 786 4,210 3,035 Fair Oaks Blvd West- Howe to Fulton 4,584 2,711 5,212 2,721 6,709 2,932 629 10 2,125 220 6,542 2,712 6,709 2,932 6,642 2,807 6,890 2,932
Fair Oaks Blvd Central- El Camino to Winding 5,792 3,704 6,382 3,783 7,824 4,556 590 78 2,032 851 7,768 3,883 7,980 4,611 7,646 3,993 10,290 5,209 Fair Oaks Blvd East- Fair Oaks Village 1,714 934 2,001 935 2,731 1,289 287 1 1,017 355 2,681 1,029 2,804 1,292 2,731 1,289 3,000 1,292
Florin Rd 6,808 1,408 7,261 1,526 8,396 2,708 453 118 1,588 1,299 7,968 2,156 8,575 2,711 8,728 2,698 12,487 6,933
Franklin Blvd 2,822 2,109 3,410 2,223 5,011 3,360 588 114 2,189 1,251 3,741 2,871 5,058 3,369 4,728 3,442 5,677 3,794
Fulton Ave 6,487 803 7,115 803 8,637 826 628 0 2,150 23 8,402 803 8,651 826 8,451 857 8,881 1,041
Gold Line Station Areas- Watt to Butterfield 10,230 4,986 11,779 5,384 15,493 9,566 1,549 398 5,262 4,581 14,258 7,490 15,511 9,566 14,385 10,260 16,962 12,707
Gold Line Station Areas- Hazel/Easton 1,133 337 3,077 704 5,864 2,120 1,944 367 4,730 1,783 5,131 1,966 8,415 2,636 3,765 4,425 19,411 4,203
Gold Line Station Areas- Folsom Blvd - - - - - - - - - - 1,232 - 900 - - - 1,214 -
Greenback Ln 3,321 1,817 3,711 2,016 4,504 2,399 390 199 1,183 582 3,652 2,172 4,629 2,354 4,245 2,384 4,640 2,399
Stockton Blvd- 14th Ave to Florin Rd 249 836 287 862 403 1,156 38 26 154 320 249 999 403 1,159 315 1,089 428 1,156
Stockton Blvd- Florin Rd to Mack Rd 3,054 2,658 3,590 2,786 4,895 4,244 536 128 1,841 1,586 3,872 3,450 4,918 4,271 4,931 4,808 5,627 5,825
Watt Ave Central- Auburn to Arden 9,359 2,408 11,860 2,466 13,278 3,200 2,501 58 3,918 792 12,442 2,823 13,288 3,213 13,137 3,055 13,419 3,200
North Watt and West of Watt 3,776 1,372 4,839 1,630 7,625 4,973 1,063 258 3,849 3,601 7,752 4,431 12,182 8,543 10,576 8,379 12,231 8,415
Established Communities 94,239 171,653 102,880 173,758 128,649 182,718 8,641 2,105 34,410 11,065 137,440 184,911 124,206 179,732 135,765 184,080 202,421 189,159
Rural Residential 10,480 13,726 11,056 13,867 12,458 14,314 576 141 1,977 588 11,160 15,527 12,458 14,464 11,460 14,259 15,537 18,369
Developing Communities (listed below) - - - - Elverta 47 78 47 325 358 1,510 - 247 312 1,432 418 1,505 358 1,510 418 570 404 4,950
Florin Vineyard 1,319 557 1,389 894 1,528 2,575 70 337 209 2,018 1,530 2,559 1,528 2,586 1,619 2,535 6,243 9,917
Glenborough at Easton 453 - 340 560 1,780 3,271 (113) 560 1,327 3,271 1,780 3,271 1,794 3,262 1,280 3,271 1,796 3,239
West Jackson 2,169 145 2,169 145 4,028 5,141 - 0 1,859 4,996 2,902 3,689 4,019 5,140 2,169 146 32,839 15,658
North Vineyard Station 93 363 158 1,261 379 3,415 64 898 285 3,052 393 3,315 379 3,417 587 2,970 563 6,062
Mather South 48 - 48 - 265 1,030 - - 217 1,030 265 1,030 358 1,039 48 1,030 5,075 3,529
Vineyard Springs 369 2,400 611 2,634 764 3,820 242 234 395 1,420 764 3,731 1,394 3,799 992 3,659 764 5,943
Vineyard 1,156 4,591 1,240 4,714 1,546 5,353 83 123 390 762 1,546 5,253 1,668 5,344 1,937 5,344 1,546 6,610
Jurisdiction Total 177,516 219,986 200,006 226,522 256,828 268,366 22,490 6,536 79,312 48,380 257,667 268,861 262,210 269,857 260,656 269,421 499,254 370,102
Approved or Pending Specific Plan Projects Not Identified for Growth by 2036 in the Draft 2016 MTP/SCS (listed below)Cordova Hills n/a n/a n/a n/a n/a n/a n/a n/a n/a n/a 232 3,024 n/a n/a n/a n/a 13,556 9,010
Jackson Township n/a n/a n/a n/a n/a n/a n/a n/a n/a n/a 770 2,057 n/a n/a n/a n/a 8,044 6,143
Newbridge n/a n/a n/a n/a n/a n/a n/a n/a n/a n/a 178 1,008 n/a n/a n/a n/a 2,556 3,075
Northwest Special Planning Area (excluding Sacramento International Airport and Metro Air Park which are included as Established Communities) n/a n/a n/a n/a n/a n/a n/a n/a n/a n/a n/a n/a n/a n/a n/a n/a 70,608 25,000
SACRAMENTO COUNTY TOTAL 573,014 558,836 658,788 585,527 831,159 731,357 85,774 26,691 258,145 172,521 832,562 718,392 833,663 731,630 834,368 735,022 1,292,961 878,354
*Note that the scenarios include some amount of techncial refinement which may alter any value slightly from the draft scenarios dated August 2014.
Attachment D
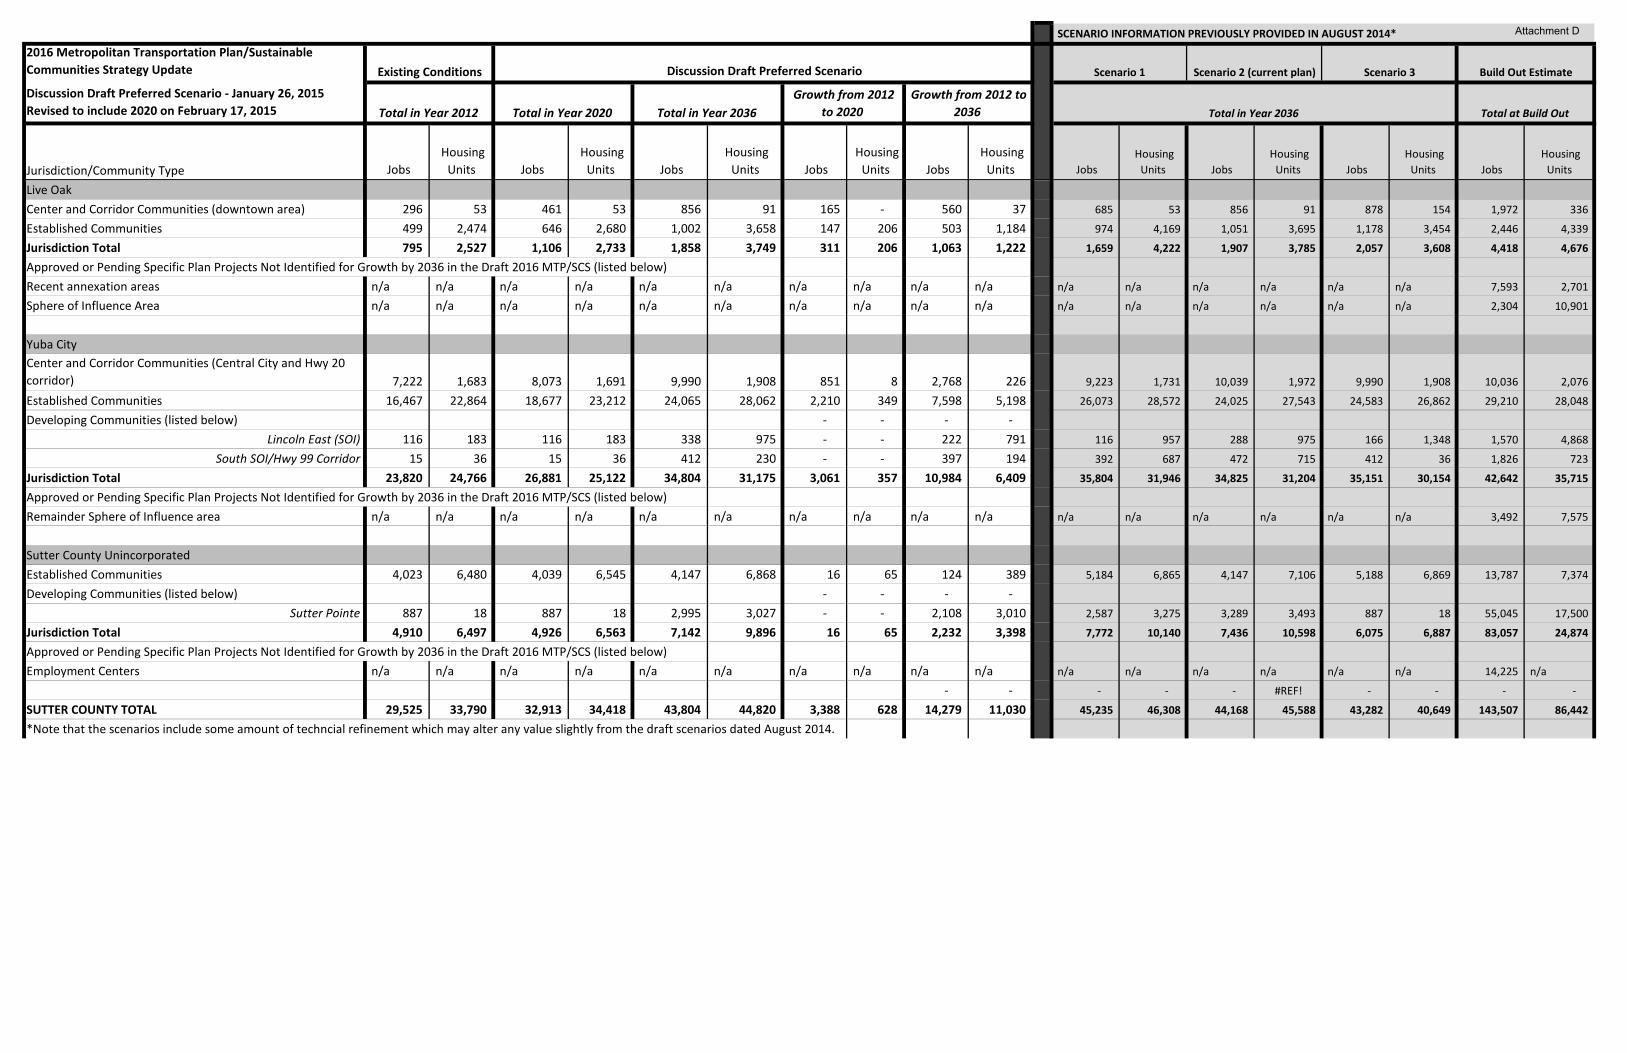
SCENARIO INFORMATION PREVIOUSLY PROVIDED IN AUGUST 2014*
2016 Metropolitan Transportation Plan/Sustainable Communities Strategy Update Build Out Estimate
Discussion Draft Preferred Scenario - January 26, 2015 Revised to include 2020 on February 17, 2015 Total in Year 2012 Total in Year 2020 Total in Year 2036 Total in Year 2036 Total at Build Out
Jurisdiction/Community Type Jobs Housing
Units Jobs Housing
Units Jobs Housing
Units Jobs Housing
Units Jobs Housing
Units Jobs Housing
Units Jobs Housing
Units Jobs Housing
Units Jobs Housing
Units
Scenario 3
Growth from 2012 to 2020
Growth from 2012 to 2036
Existing Conditions Scenario 1 Scenario 2 (current plan) Discussion Draft Preferred Scenario
Live OakCenter and Corridor Communities (downtown area) 296 53 461 53 856 91 165 - 560 37 685 53 856 91 878 154 1,972 336
Established Communities 499 2,474 646 2,680 1,002 3,658 147 206 503 1,184 974 4,169 1,051 3,695 1,178 3,454 2,446 4,339
Jurisdiction Total 795 2,527 1,106 2,733 1,858 3,749 311 206 1,063 1,222 1,659 4,222 1,907 3,785 2,057 3,608 4,418 4,676
Approved or Pending Specific Plan Projects Not Identified for Growth by 2036 in the Draft 2016 MTP/SCS (listed below)Recent annexation areas n/a n/a n/a n/a n/a n/a n/a n/a n/a n/a n/a n/a n/a n/a n/a n/a 7,593 2,701
Sphere of Influence Area n/a n/a n/a n/a n/a n/a n/a n/a n/a n/a n/a n/a n/a n/a n/a n/a 2,304 10,901
Yuba CityCenter and Corridor Communities (Central City and Hwy 20 corridor) 7,222 1,683 8,073 1,691 9,990 1,908 851 8 2,768 226 9,223 1,731 10,039 1,972 9,990 1,908 10,036 2,076
Established Communities 16,467 22,864 18,677 23,212 24,065 28,062 2,210 349 7,598 5,198 26,073 28,572 24,025 27,543 24,583 26,862 29,210 28,048
Developing Communities (listed below) - - - - Lincoln East (SOI) 116 183 116 183 338 975 - - 222 791 116 957 288 975 166 1,348 1,570 4,868
South SOI/Hwy 99 Corridor 15 36 15 36 412 230 - - 397 194 392 687 472 715 412 36 1,826 723
Jurisdiction Total 23,820 24,766 26,881 25,122 34,804 31,175 3,061 357 10,984 6,409 35,804 31,946 34,825 31,204 35,151 30,154 42,642 35,715
Approved or Pending Specific Plan Projects Not Identified for Growth by 2036 in the Draft 2016 MTP/SCS (listed below)Remainder Sphere of Influence area n/a n/a n/a n/a n/a n/a n/a n/a n/a n/a n/a n/a n/a n/a n/a n/a 3,492 7,575
Sutter County UnincorporatedEstablished Communities 4,023 6,480 4,039 6,545 4,147 6,868 16 65 124 389 5,184 6,865 4,147 7,106 5,188 6,869 13,787 7,374
Developing Communities (listed below) - - - - Sutter Pointe 887 18 887 18 2,995 3,027 - - 2,108 3,010 2,587 3,275 3,289 3,493 887 18 55,045 17,500
Jurisdiction Total 4,910 6,497 4,926 6,563 7,142 9,896 16 65 2,232 3,398 7,772 10,140 7,436 10,598 6,075 6,887 83,057 24,874
Approved or Pending Specific Plan Projects Not Identified for Growth by 2036 in the Draft 2016 MTP/SCS (listed below)Employment Centers n/a n/a n/a n/a n/a n/a n/a n/a n/a n/a n/a n/a n/a n/a n/a n/a 14,225 n/a
- - - - - #REF! - - - -
SUTTER COUNTY TOTAL 29,525 33,790 32,913 34,418 43,804 44,820 3,388 628 14,279 11,030 45,235 46,308 44,168 45,588 43,282 40,649 143,507 86,442
*Note that the scenarios include some amount of techncial refinement which may alter any value slightly from the draft scenarios dated August 2014.
Attachment D
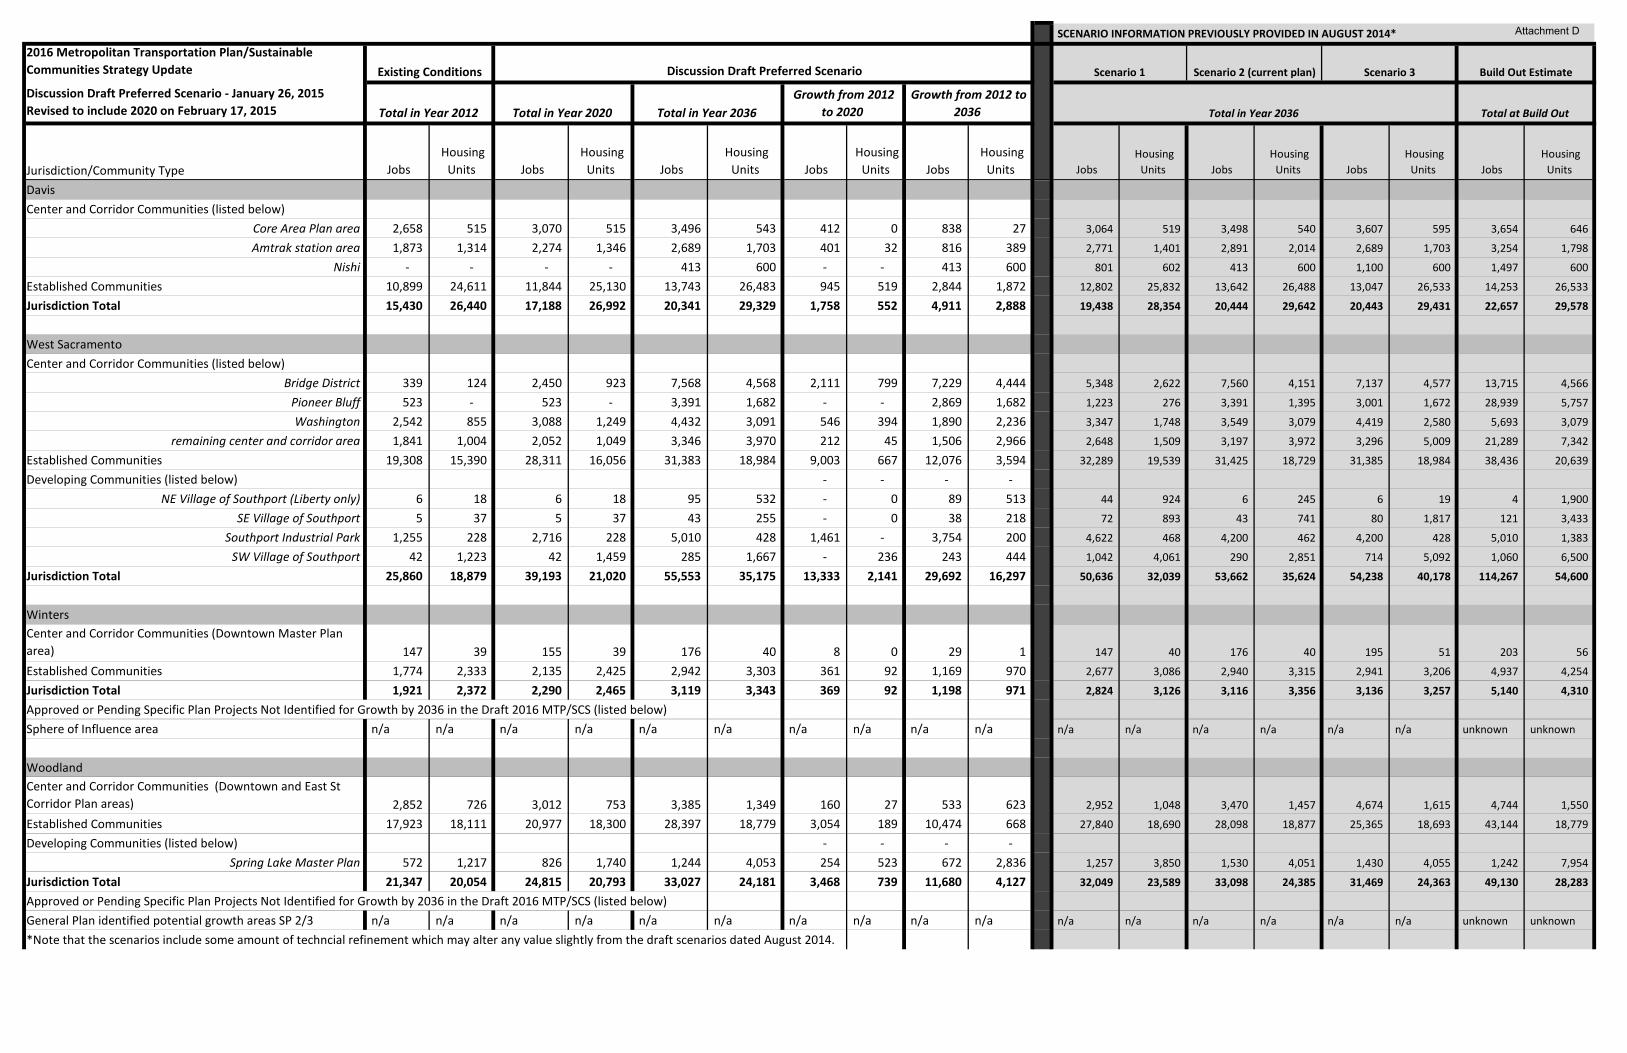
SCENARIO INFORMATION PREVIOUSLY PROVIDED IN AUGUST 2014*
2016 Metropolitan Transportation Plan/Sustainable Communities Strategy Update Build Out Estimate
Discussion Draft Preferred Scenario - January 26, 2015 Revised to include 2020 on February 17, 2015 Total in Year 2012 Total in Year 2020 Total in Year 2036 Total in Year 2036 Total at Build Out
Jurisdiction/Community Type Jobs Housing
Units Jobs Housing
Units Jobs Housing
Units Jobs Housing
Units Jobs Housing
Units Jobs Housing
Units Jobs Housing
Units Jobs Housing
Units Jobs Housing
Units
Scenario 3
Growth from 2012 to 2020
Growth from 2012 to 2036
Existing Conditions Scenario 1 Scenario 2 (current plan) Discussion Draft Preferred Scenario
DavisCenter and Corridor Communities (listed below)
Core Area Plan area 2,658 515 3,070 515 3,496 543 412 0 838 27 3,064 519 3,498 540 3,607 595 3,654 646
Amtrak station area 1,873 1,314 2,274 1,346 2,689 1,703 401 32 816 389 2,771 1,401 2,891 2,014 2,689 1,703 3,254 1,798
Nishi - - - - 413 600 - - 413 600 801 602 413 600 1,100 600 1,497 600
Established Communities 10,899 24,611 11,844 25,130 13,743 26,483 945 519 2,844 1,872 12,802 25,832 13,642 26,488 13,047 26,533 14,253 26,533
Jurisdiction Total 15,430 26,440 17,188 26,992 20,341 29,329 1,758 552 4,911 2,888 19,438 28,354 20,444 29,642 20,443 29,431 22,657 29,578
West SacramentoCenter and Corridor Communities (listed below)
Bridge District 339 124 2,450 923 7,568 4,568 2,111 799 7,229 4,444 5,348 2,622 7,560 4,151 7,137 4,577 13,715 4,566
Pioneer Bluff 523 - 523 - 3,391 1,682 - - 2,869 1,682 1,223 276 3,391 1,395 3,001 1,672 28,939 5,757
Washington 2,542 855 3,088 1,249 4,432 3,091 546 394 1,890 2,236 3,347 1,748 3,549 3,079 4,419 2,580 5,693 3,079
remaining center and corridor area 1,841 1,004 2,052 1,049 3,346 3,970 212 45 1,506 2,966 2,648 1,509 3,197 3,972 3,296 5,009 21,289 7,342
Established Communities 19,308 15,390 28,311 16,056 31,383 18,984 9,003 667 12,076 3,594 32,289 19,539 31,425 18,729 31,385 18,984 38,436 20,639
Developing Communities (listed below) - - - - NE Village of Southport (Liberty only) 6 18 6 18 95 532 - 0 89 513 44 924 6 245 6 19 4 1,900
SE Village of Southport 5 37 5 37 43 255 - 0 38 218 72 893 43 741 80 1,817 121 3,433
Southport Industrial Park 1,255 228 2,716 228 5,010 428 1,461 - 3,754 200 4,622 468 4,200 462 4,200 428 5,010 1,383
SW Village of Southport 42 1,223 42 1,459 285 1,667 - 236 243 444 1,042 4,061 290 2,851 714 5,092 1,060 6,500
Jurisdiction Total 25,860 18,879 39,193 21,020 55,553 35,175 13,333 2,141 29,692 16,297 50,636 32,039 53,662 35,624 54,238 40,178 114,267 54,600
WintersCenter and Corridor Communities (Downtown Master Plan area) 147 39 155 39 176 40 8 0 29 1 147 40 176 40 195 51 203 56
Established Communities 1,774 2,333 2,135 2,425 2,942 3,303 361 92 1,169 970 2,677 3,086 2,940 3,315 2,941 3,206 4,937 4,254
Jurisdiction Total 1,921 2,372 2,290 2,465 3,119 3,343 369 92 1,198 971 2,824 3,126 3,116 3,356 3,136 3,257 5,140 4,310
Approved or Pending Specific Plan Projects Not Identified for Growth by 2036 in the Draft 2016 MTP/SCS (listed below)Sphere of Influence area n/a n/a n/a n/a n/a n/a n/a n/a n/a n/a n/a n/a n/a n/a n/a n/a unknown unknown
WoodlandCenter and Corridor Communities (Downtown and East St Corridor Plan areas) 2,852 726 3,012 753 3,385 1,349 160 27 533 623 2,952 1,048 3,470 1,457 4,674 1,615 4,744 1,550
Established Communities 17,923 18,111 20,977 18,300 28,397 18,779 3,054 189 10,474 668 27,840 18,690 28,098 18,877 25,365 18,693 43,144 18,779
Developing Communities (listed below) - - - - Spring Lake Master Plan 572 1,217 826 1,740 1,244 4,053 254 523 672 2,836 1,257 3,850 1,530 4,051 1,430 4,055 1,242 7,954
Jurisdiction Total 21,347 20,054 24,815 20,793 33,027 24,181 3,468 739 11,680 4,127 32,049 23,589 33,098 24,385 31,469 24,363 49,130 28,283
Approved or Pending Specific Plan Projects Not Identified for Growth by 2036 in the Draft 2016 MTP/SCS (listed below)General Plan identified potential growth areas SP 2/3 n/a n/a n/a n/a n/a n/a n/a n/a n/a n/a n/a n/a n/a n/a n/a n/a unknown unknown
*Note that the scenarios include some amount of techncial refinement which may alter any value slightly from the draft scenarios dated August 2014.
Attachment D
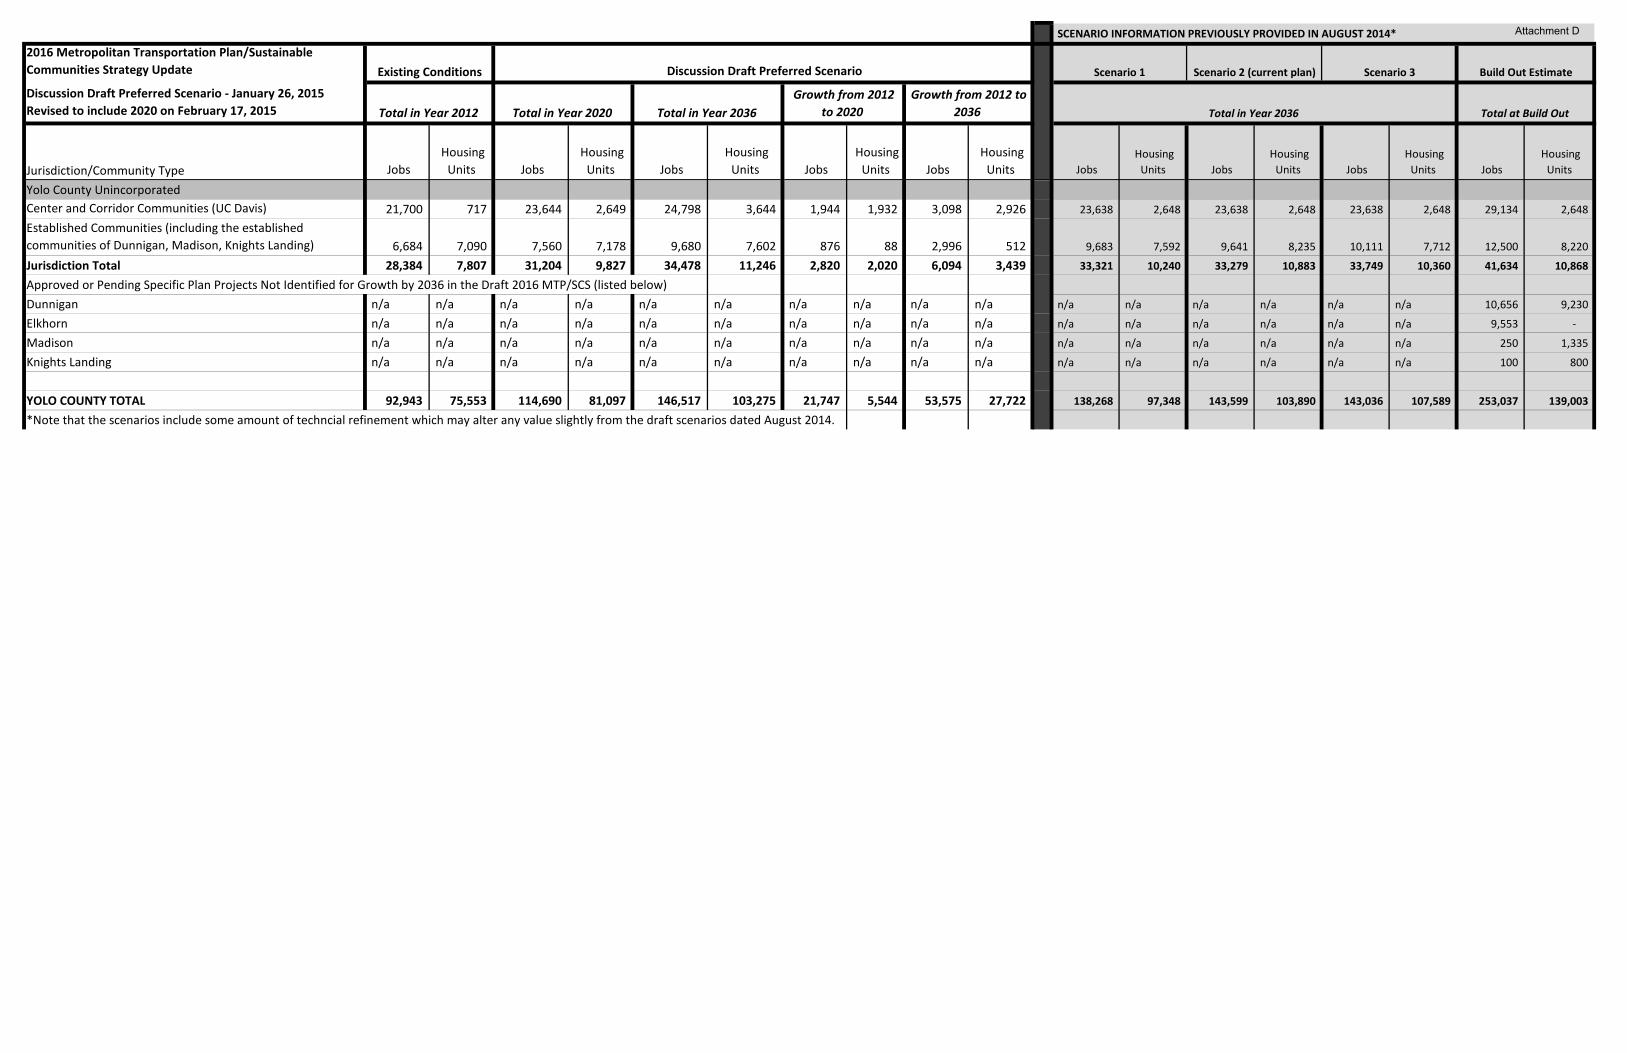
SCENARIO INFORMATION PREVIOUSLY PROVIDED IN AUGUST 2014*
2016 Metropolitan Transportation Plan/Sustainable Communities Strategy Update Build Out Estimate
Discussion Draft Preferred Scenario - January 26, 2015 Revised to include 2020 on February 17, 2015 Total in Year 2012 Total in Year 2020 Total in Year 2036 Total in Year 2036 Total at Build Out
Jurisdiction/Community Type Jobs Housing
Units Jobs Housing
Units Jobs Housing
Units Jobs Housing
Units Jobs Housing
Units Jobs Housing
Units Jobs Housing
Units Jobs Housing
Units Jobs Housing
Units
Scenario 3
Growth from 2012 to 2020
Growth from 2012 to 2036
Existing Conditions Scenario 1 Scenario 2 (current plan) Discussion Draft Preferred Scenario
Yolo County UnincorporatedCenter and Corridor Communities (UC Davis) 21,700 717 23,644 2,649 24,798 3,644 1,944 1,932 3,098 2,926 23,638 2,648 23,638 2,648 23,638 2,648 29,134 2,648 Established Communities (including the established communities of Dunnigan, Madison, Knights Landing) 6,684 7,090 7,560 7,178 9,680 7,602 876 88 2,996 512 9,683 7,592 9,641 8,235 10,111 7,712 12,500 8,220
Jurisdiction Total 28,384 7,807 31,204 9,827 34,478 11,246 2,820 2,020 6,094 3,439 33,321 10,240 33,279 10,883 33,749 10,360 41,634 10,868
Approved or Pending Specific Plan Projects Not Identified for Growth by 2036 in the Draft 2016 MTP/SCS (listed below)Dunnigan n/a n/a n/a n/a n/a n/a n/a n/a n/a n/a n/a n/a n/a n/a n/a n/a 10,656 9,230
Elkhorn n/a n/a n/a n/a n/a n/a n/a n/a n/a n/a n/a n/a n/a n/a n/a n/a 9,553 -
Madison n/a n/a n/a n/a n/a n/a n/a n/a n/a n/a n/a n/a n/a n/a n/a n/a 250 1,335
Knights Landing n/a n/a n/a n/a n/a n/a n/a n/a n/a n/a n/a n/a n/a n/a n/a n/a 100 800
YOLO COUNTY TOTAL 92,943 75,553 114,690 81,097 146,517 103,275 21,747 5,544 53,575 27,722 138,268 97,348 143,599 103,890 143,036 107,589 253,037 139,003
*Note that the scenarios include some amount of techncial refinement which may alter any value slightly from the draft scenarios dated August 2014.
Attachment D
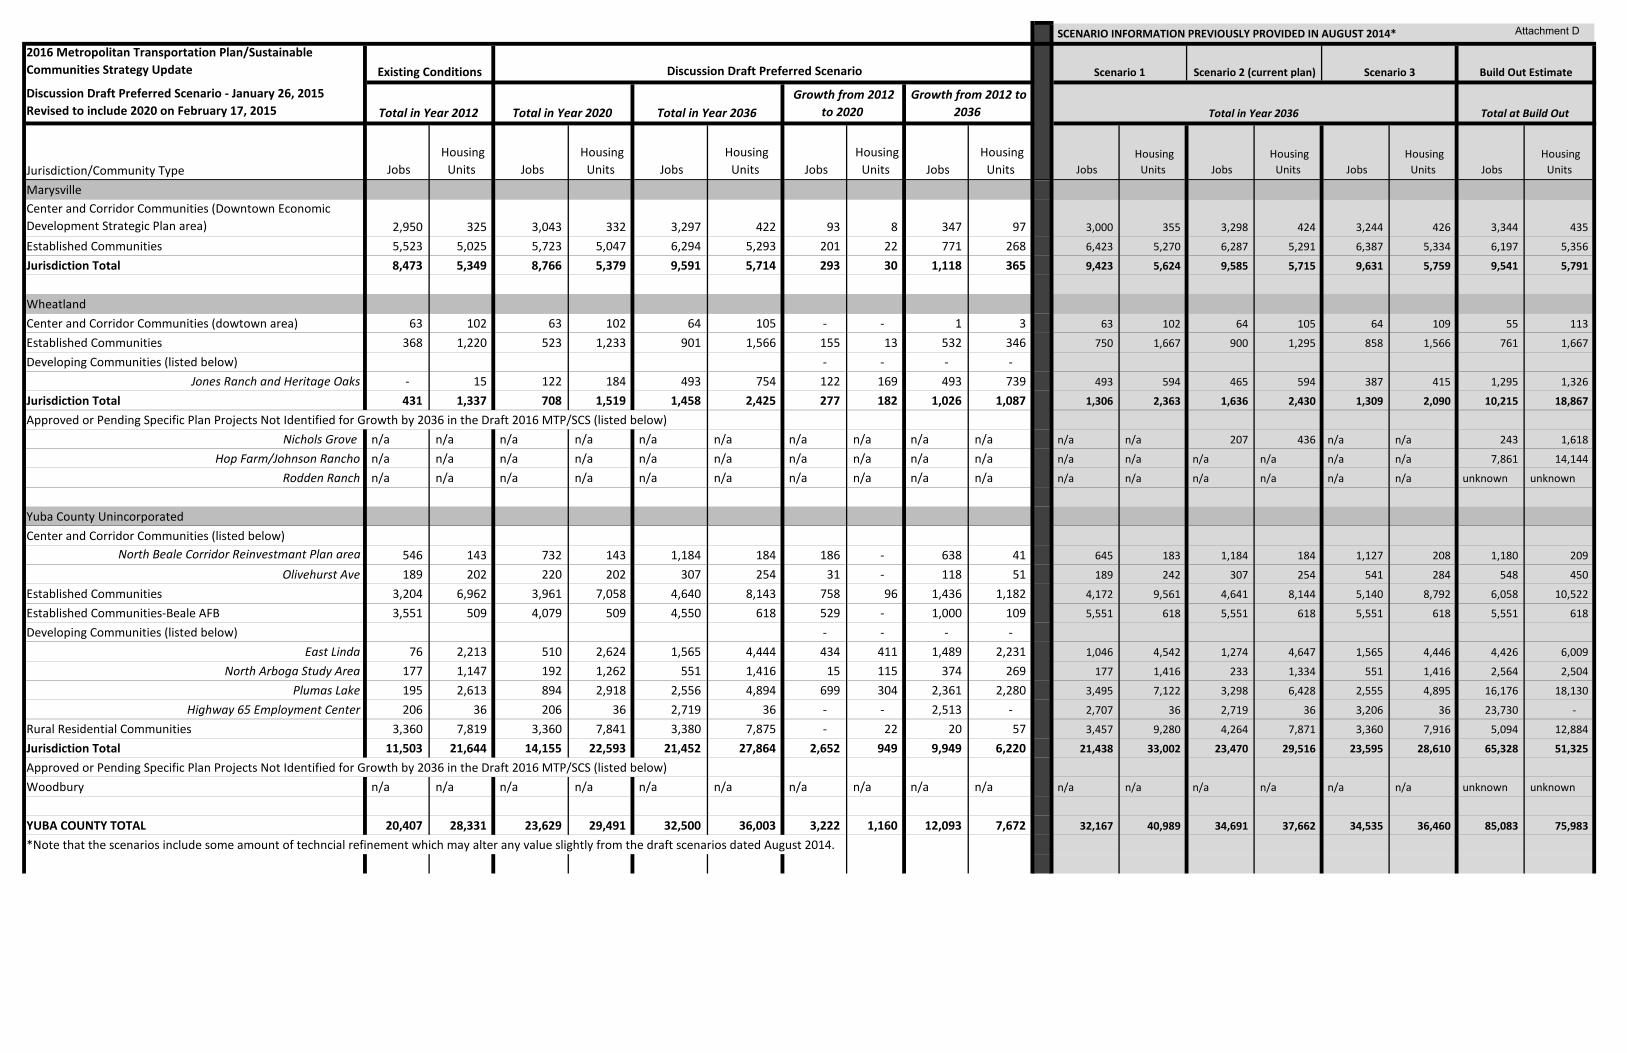
SCENARIO INFORMATION PREVIOUSLY PROVIDED IN AUGUST 2014*
2016 Metropolitan Transportation Plan/Sustainable Communities Strategy Update Build Out Estimate
Discussion Draft Preferred Scenario - January 26, 2015 Revised to include 2020 on February 17, 2015 Total in Year 2012 Total in Year 2020 Total in Year 2036 Total in Year 2036 Total at Build Out
Jurisdiction/Community Type Jobs Housing
Units Jobs Housing
Units Jobs Housing
Units Jobs Housing
Units Jobs Housing
Units Jobs Housing
Units Jobs Housing
Units Jobs Housing
Units Jobs Housing
Units
Scenario 3
Growth from 2012 to 2020
Growth from 2012 to 2036
Existing Conditions Scenario 1 Scenario 2 (current plan) Discussion Draft Preferred Scenario
MarysvilleCenter and Corridor Communities (Downtown Economic Development Strategic Plan area) 2,950 325 3,043 332 3,297 422 93 8 347 97 3,000 355 3,298 424 3,244 426 3,344 435
Established Communities 5,523 5,025 5,723 5,047 6,294 5,293 201 22 771 268 6,423 5,270 6,287 5,291 6,387 5,334 6,197 5,356
Jurisdiction Total 8,473 5,349 8,766 5,379 9,591 5,714 293 30 1,118 365 9,423 5,624 9,585 5,715 9,631 5,759 9,541 5,791
WheatlandCenter and Corridor Communities (dowtown area) 63 102 63 102 64 105 - - 1 3 63 102 64 105 64 109 55 113
Established Communities 368 1,220 523 1,233 901 1,566 155 13 532 346 750 1,667 900 1,295 858 1,566 761 1,667
Developing Communities (listed below) - - - - Jones Ranch and Heritage Oaks - 15 122 184 493 754 122 169 493 739 493 594 465 594 387 415 1,295 1,326
Jurisdiction Total 431 1,337 708 1,519 1,458 2,425 277 182 1,026 1,087 1,306 2,363 1,636 2,430 1,309 2,090 10,215 18,867
Approved or Pending Specific Plan Projects Not Identified for Growth by 2036 in the Draft 2016 MTP/SCS (listed below)Nichols Grove n/a n/a n/a n/a n/a n/a n/a n/a n/a n/a n/a n/a 207 436 n/a n/a 243 1,618
Hop Farm/Johnson Rancho n/a n/a n/a n/a n/a n/a n/a n/a n/a n/a n/a n/a n/a n/a n/a n/a 7,861 14,144
Rodden Ranch n/a n/a n/a n/a n/a n/a n/a n/a n/a n/a n/a n/a n/a n/a n/a n/a unknown unknown
Yuba County Unincorporated Center and Corridor Communities (listed below)
North Beale Corridor Reinvestmant Plan area 546 143 732 143 1,184 184 186 - 638 41 645 183 1,184 184 1,127 208 1,180 209
Olivehurst Ave 189 202 220 202 307 254 31 - 118 51 189 242 307 254 541 284 548 450
Established Communities 3,204 6,962 3,961 7,058 4,640 8,143 758 96 1,436 1,182 4,172 9,561 4,641 8,144 5,140 8,792 6,058 10,522
Established Communities-Beale AFB 3,551 509 4,079 509 4,550 618 529 - 1,000 109 5,551 618 5,551 618 5,551 618 5,551 618
Developing Communities (listed below) - - - - East Linda 76 2,213 510 2,624 1,565 4,444 434 411 1,489 2,231 1,046 4,542 1,274 4,647 1,565 4,446 4,426 6,009
North Arboga Study Area 177 1,147 192 1,262 551 1,416 15 115 374 269 177 1,416 233 1,334 551 1,416 2,564 2,504
Plumas Lake 195 2,613 894 2,918 2,556 4,894 699 304 2,361 2,280 3,495 7,122 3,298 6,428 2,555 4,895 16,176 18,130
Highway 65 Employment Center 206 36 206 36 2,719 36 - - 2,513 - 2,707 36 2,719 36 3,206 36 23,730 -
Rural Residential Communities 3,360 7,819 3,360 7,841 3,380 7,875 - 22 20 57 3,457 9,280 4,264 7,871 3,360 7,916 5,094 12,884
Jurisdiction Total 11,503 21,644 14,155 22,593 21,452 27,864 2,652 949 9,949 6,220 21,438 33,002 23,470 29,516 23,595 28,610 65,328 51,325
Approved or Pending Specific Plan Projects Not Identified for Growth by 2036 in the Draft 2016 MTP/SCS (listed below)Woodbury n/a n/a n/a n/a n/a n/a n/a n/a n/a n/a n/a n/a n/a n/a n/a n/a unknown unknown
YUBA COUNTY TOTAL 20,407 28,331 23,629 29,491 32,500 36,003 3,222 1,160 12,093 7,672 32,167 40,989 34,691 37,662 34,535 36,460 85,083 75,983
*Note that the scenarios include some amount of techncial refinement which may alter any value slightly from the draft scenarios dated August 2014.
Attachment D
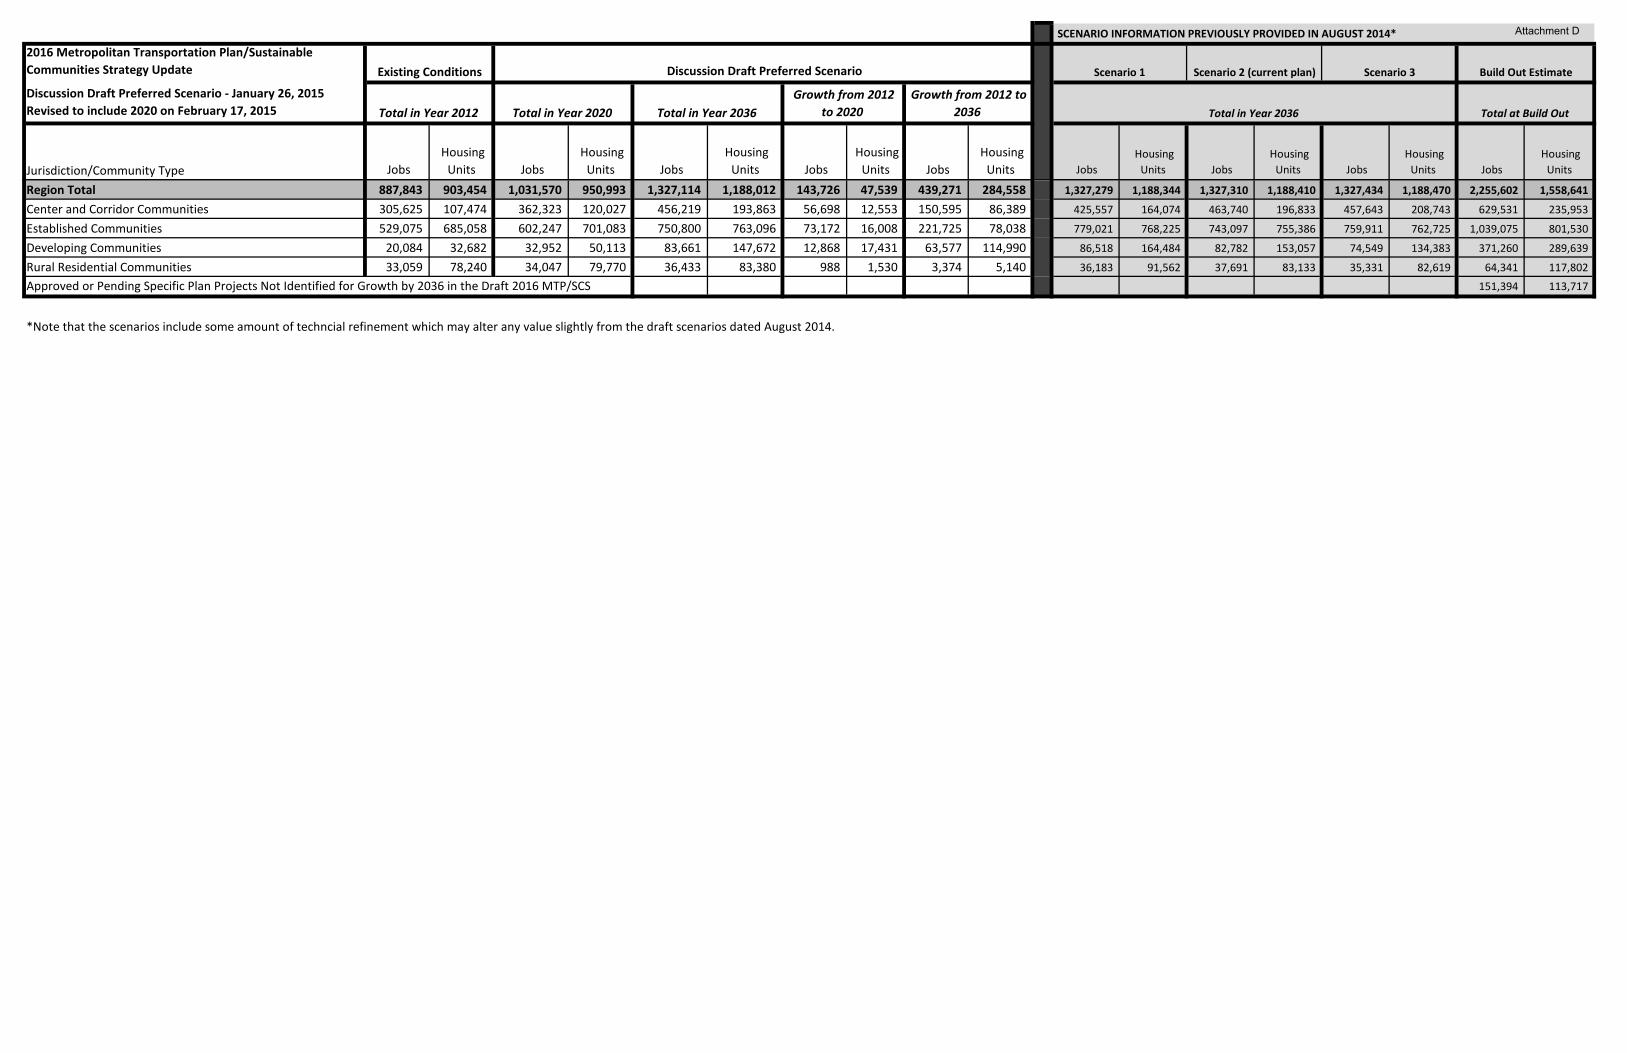
SCENARIO INFORMATION PREVIOUSLY PROVIDED IN AUGUST 2014*
2016 Metropolitan Transportation Plan/Sustainable Communities Strategy Update Build Out Estimate
Discussion Draft Preferred Scenario - January 26, 2015 Revised to include 2020 on February 17, 2015 Total in Year 2012 Total in Year 2020 Total in Year 2036 Total in Year 2036 Total at Build Out
Jurisdiction/Community Type Jobs Housing
Units Jobs Housing
Units Jobs Housing
Units Jobs Housing
Units Jobs Housing
Units Jobs Housing
Units Jobs Housing
Units Jobs Housing
Units Jobs Housing
Units
Scenario 3
Growth from 2012 to 2020
Growth from 2012 to 2036
Existing Conditions Scenario 1 Scenario 2 (current plan) Discussion Draft Preferred Scenario
Region Total 887,843 903,454 1,031,570 950,993 1,327,114 1,188,012 143,726 47,539 439,271 284,558 1,327,279 1,188,344 1,327,310 1,188,410 1,327,434 1,188,470 2,255,602 1,558,641
Center and Corridor Communities 305,625 107,474 362,323 120,027 456,219 193,863 56,698 12,553 150,595 86,389 425,557 164,074 463,740 196,833 457,643 208,743 629,531 235,953
Established Communities 529,075 685,058 602,247 701,083 750,800 763,096 73,172 16,008 221,725 78,038 779,021 768,225 743,097 755,386 759,911 762,725 1,039,075 801,530
Developing Communities 20,084 32,682 32,952 50,113 83,661 147,672 12,868 17,431 63,577 114,990 86,518 164,484 82,782 153,057 74,549 134,383 371,260 289,639
Rural Residential Communities 33,059 78,240 34,047 79,770 36,433 83,380 988 1,530 3,374 5,140 36,183 91,562 37,691 83,133 35,331 82,619 64,341 117,802 Approved or Pending Specific Plan Projects Not Identified for Growth by 2036 in the Draft 2016 MTP/SCS 151,394 113,717
*Note that the scenarios include some amount of techncial refinement which may alter any value slightly from the draft scenarios dated August 2014.
Attachment D