regional roadmap strategic plan 2010 - 2013 · south australian strategic directions ... swot...
TRANSCRIPT

Regional Development Australia Murraylands & Riverland
Regional Roadmap and Strategic Plan
2010 - 2013

Murraylands and Riverland Region
RDA M&R Regional Road Map June 2010 2
Table of contents Foreword.......................................................................................................................... 3 Vision Statement ............................................................................................................. 4
Vision............................................................................................................................. 4
Mission .......................................................................................................................... 4
Core Principles .............................................................................................................. 4
Introduction and Background........................................................................................ 5 Overview of the Region .................................................................................................. 6 Key Directions of our Partners .................................................................................... 11
Local Government ....................................................................................................... 11
Regional Strategic Directions ...................................................................................... 15
South Australian Strategic Directions .......................................................................... 18
Key Stakeholders .......................................................................................................... 19 SWOT Analysis.............................................................................................................. 22 Strategic Framework..................................................................................................... 23 Implementation and Review......................................................................................... 27 Appendicies................................................................................................................... 28 References..................................................................................................................... 54

Murraylands and Riverland Region
Foreword ‘Leadership without support is like trying to make bricks without enough straw. True leaders reinforce their ideas and plans with strategic partnerships, alliances and supportive audiences.’ Reed Markham, PhD American born Icelandic educator, b.1957. Regional Development Australia Murraylands Riverland (RDA MR) has been challenged to deliver a Strategy for Economic Development and Job Creation as part of a Regional Roadmap. It is a challenge that the RDA MR Board and staff team willingly accept. However, we acknowledge the words above of Reed Markham that, in order to implement a strategic vision for the Murraylands Riverland, we will need the support and willing participation of a range of partners, alliances and supportive audiences. Our obvious partners include the eight local government authorities, the South Australian Government and the Australian Government. Their support is critical if we are to implement the strategic directions contained within this document. However, our more important partners are the business and regional community members of the Murraylands and Riverland regions. As partners, they represent the engine room of change for our region. Their tireless passion and drive for the Murraylands and Riverland economies, in times of change, is both heartening and inspiring. This Murraylands Riverland Regional Roadmap provides an overview of the key features of our region, the strategic directions of our partners, and importantly the vision of the RDA MR Board and staff. The RDA MR looks forward to actively progressing, revising and implementing the various strategies contained within this plan with all of our partners. I commend the Murraylands Riverland Regional Roadmap to you and invite you to work with us in its implementation. Neil Martinson Chair Regional Development Australia Murraylands Riverland
RDA M&R - Regional Road Map June 2010 3

Murraylands and Riverland Region
Vision Statement
Vision To be recognised as South Australia’s most proactive and sustainable regional community.
Mission RDA MR facilitate, and deliver, a diverse range of strategic projects and services that build on, and enhance, regional opportunities.
Core Principles Two core principles underpin the work of RDA MR, namely:
• Leadership development: RDA MR will seek to embed leadership capacity building activities into all initiatives and activities.
• Sustainable business practices: RDA MR will
ensure that all initiatives and activities are developed with regard to their long term sustainability and the responsible use of resources.
RDA M&R - Regional Road Map June 2010 4

Murraylands and Riverland Region
Introduction and Background In February 2010, the Murraylands Regional Development Board (MRDB) merged with the Riverland Development Corporation (RDC) to form Regional Development Australia Murraylands Riverland Inc (RDA MR). One of the most important, and immediate, tasks for the newly formed RDA MR was to better understand the dynamics of the integrated region and prepare a strategic response for its future. To this end, the Murraylands & Riverland Regional Road Map has been prepared utilising key, statistical and analytical, information from the following resources:
• 2009 Murraylands/Riverland Employment and Skills Formation Strategic Plan. • Department of Further Education, Employment, Science and Technology
(DFEEST) Regional Profiles for Murraylands and Riverland. • Australian Bureau of Statistics (ABS) Census and Population Data • The eight (8) Strategic Plans of the RDA MR Local Government partners. • The former Murraylands Regional Development Strategic Plan • The former Riverland Development Corporation Strategic Plan • Riverland Futures Taskforce Reports • Regional Investment Opportunities – Economic Outlook Reports
(Murraylands) • The South Australian State Strategic Plan (SASP)
The information contained within this Murraylands & Riverland Regional Road Map has been reviewed by RDA MR staff and Board members during its development. The review provided much stronger anecdotal and current evidence as to the gaps, needs and issues within the broader region. A draft of the Murraylands & Riverland Regional Road Map was circulated to all RDA MR project partners for their comment, input and review.
RDA M&R - Regional Road Map June 2010 5
Murraylands and Riverland Region
Overview of the Region The RDA MR region encompasses the Local Government Areas (LGAs) of Berri and Barmera, Karoonda East Murray, Loxton Waikerie, Mid Murray, Murray Bridge, Renmark Paringa, Southern Mallee and the Coorong.i The Region is located in the Murraylands Statistical Region in eastern South Australia and is dissected by the River Murray. It covers a large area of approximately 36,720km2ii taking in the areas from the Riverland in the north, agriculture areas in the central, west, south and east along the Victorian border, and south westerly to the coast and lakes. Rural based communities throughout the area share a common interest in agriculture/horticulture/dryland farming, with towns primarily servicing the farming and horticultural communities and supporting a growing tourism sector. The Region has a population base of approximately 68,000 (approx. 4.6% of the State population). Map to be supplied by SAMRIC. The Murray River, and its associated wetlands and wildlife, Lake Bonney and a number of National/Conservation Parks, support a range of rare and endangered plant and animal species, and are major tourist attractions throughout parts of the Riverland and Mallee. Towards the coast, the Coorong National Park, Lake Alexandrina and the shores of Lake Albert are all well known tourist attractions, particularly for recreational boating and fishing. Murray Bridge provides regional services to the lower parts of the Region and supports both an industrial and commercial base. The Murray River travels from the north, and passing through seven of the member Councils, flows into Lake Alexandrina in the south. It supports a number of tourist and recreation activities, with a number of tourism vessels operating from centres along the river. The Region is serviced by the South Eastern Freeway, Princes, Dukes, Sturt and Mallee Highways, with the Berri (Loxton) to Murray Bridge Road providing a direct link diagonally across the Region.iii Map 1 above provides a local context to the RDA MR region, whereas, Map 2 (on the following page) describes the RDA MR region within a South Australian context.
RDA M&R - Regional Road Map June 2010 6

RDA M&R Regional Road Map June 2010 7
Map 2: South Australia. Regional Development Australia Regions. Sourced from Regional Development Australia Website Maps: http://www.rda.gov.au/resources/maps.aspx#sa_maps

Estimated Population The RDA MR region is home to 66,754 people or 4.4% of the South Australian State population.iv This is based on information supplied for the 2006 Census. Age Profile Compared to the State profile of 27% of population, the RDA MR region has an above average, population (29%) of people aged 55 years and older. Interestingly, young people under 14 years of age, represent 14.27% of the RDA MR population compared to the State average of 12.8%. Whereas, young people over the age of 15 years represent only 11.01% of the RDA MR population which is below the State average of 13.3%. v Key Populations The Aboriginal population in the RDA MR region is much higher (2.95% or 1971 Aboriginal people) than the State Aboriginal population rate of 1.7%vi. Approximately 5% of the RDA MR population has a disability and is in need of assistance, and this is slightly higher than the State average of 4.84%. It is interesting to note that the demand for assistance is much higher for those members generally considered of working age, notably 35-75 years.vii Family Composition The RDA MR region has a significant proportion (45%) of families who are couples with no children, compared to the State average of 40%. Interestingly, the RDA MR region has a below average (14%) proportion of single parent families compared to the State average (16%). viii Population Projection The RDA MR region has experienced a below average population growth with an average of 0.45%, per annum, in the four years between 2006 and 2009, as compared to the State average of 1.1%.ix Forecast population growth between 2006 and 2021 (or 15 years), is 1.4% or 1,030 people.x Unemployment At December 2009, the RDA MR region had an estimated unemployment rate of 6.1%, above the State unemployment rate of 5.4%.xi The long term unemployment rate is now above the State average, and has been increasing.xii
RDA M&R Regional Road Map June 2010 8

Participation In 2006, the RDA MR region experienced quite different rates of workforce participation. The Riverland sub region had a participation rate above the State average of 60.3%, compared to the State average of 59.0%. Participation for females, young people and mature aged was significantly higher that the State average. Whereas, in 2006, the Murraylands sub region had a participation rate of 56.4%, below the State average of 59.0%. All Murraylands co-horts (males, females, mature aged, aboriginal and people with disabilities) experienced lower levels of participation, with the exception of youth.xiii Employment The largest employing industry sectors in the region are:
• Agriculture, forestry & fishing (21.7%) • Manufacturing (12.6%) • Retail trade (11.2%)xiv
Occupation By comparison to the State average, employment in the RDA MR region is concentrated in Management (13% State average compared to 22% regional average) and Labouring (12% State average compared to 22% regional average). Professional and clerical/administrative employment is under-represented in the RDA MR region when compared to the State average. Professional occupations in region represent 10% of the workforce, compared to 18% at a State level. Similarly, clerical occupations in the region represent 10% of the workforce compared to 15% at the State level.xv Education and Qualifications Secondary Year 12 attainment (24% of population) within the RDA MR region is well below the State average of 38% of population.xvi Post secondary Post secondary qualification in the region is well below the States average in all categories, particularly at the Bachelor Degree level, with 11.24% of the RDA MR region attaining this level of qualification compared to the State average of 20%. However, at the vocational level, 35.75% of RDA MR region population has attained a Certificate III or IV level qualification, compared to the State average of 30%.xvii
RDA M&R Regional Road Map June 2010 9

RDA M&R Regional Road Map June 2010 10
Individual Incomes In 2006, the mean individual weekly incomes in the RDA MR region are below the State average of $433, with incomes ranging from $327 in Karoonda East Murray DC to $412 in Renmark Paringa DC.xviii Income Support In all categories (Disability Support Pension, New Start Allowance, Youth Allowance and Parenting Payment Single), both the Murraylands and Riverland subregions reported higher than the State average levels of support.xix Home Ownership The RDA MR region reports higher levels of outright home ownership (37.2%) and homes being rented (26.6%) compared to the State average of 26% and 15.5% respectively. However, homes being purchased (29%) in the RDA MR region are well below the State average of 57.5%.xx Labour Force Characteristics Significant labour force characteristics include:
• Increasing levels of unemployment in all LGAs within the region. • Below average participation rates for Murraylands sub region. • Above average concentration of Management and Labouring occupations.xxi
Economic Conditions The region is relatively insecure in economic terms, demonstrated by:
• Below average median weekly income levels. • Above average levels of income support recipients. • Above average proportions of rented homes and lower levels of homes being
purchased.xxii Further commentary to be added upon arrival of new statistics.

Murraylands and Riverland Region
Key Directions of our Partners Local Government Berri Barmera Council The Berri Barmera Council strategic priorities are:
Social and community: provide a safe community, increase participation with recreation facilities, culture a strong self help community, bring the community together and support both youth and the aged community. Environment and heritage: encourage effective and efficient use of resources, practice waste minimisation, promote alternative energy supplies, reduce reliance on the river, establish better water use – re use and become more sustainable. Economic development: encourage funding and investment opportunities, build high quality infrastructure to attract and grow tourism, work with community and business to increase profitability, grow population, attract industry and create employment.xxiii
Coorong District Council The Coorong District Council strategic priorities are:
Social and community: enhance the quality of life of the community by supporting the Tailem Bend Community Centre, Murray Mallee Community Transport Scheme, actively work with the indigenous community, support youth events and review the Ageing Population Taskforce Report. Environment and heritage: implement plans, provisions and resources to ensure the regions environment is sustainable for the community and sustainably manage the waste in the region by undertaking a Better Development Plan Conversion; developing a range of Strategic Land Use Plans and a Coorong Sustainability Plan; maintaining Council’s commitment to Local Action Planning; and exploring stormwater and wastewater harvesting opportunities. Economic development: encourage new and support existing economic development opportunities to ensure ongoing prosperity by undertaking a detailed assessment of the local economy, developing an Economic Development Policy and Investment package, developing a local business database, preparing a tourism asset auditxxiv
RDA M&R - Regional Road Map June 2010 11

District Council Karoonda East Murray The District Council of Karoonda East Murray strategic priorities are:
Social and community: encourage & support a healthy lifestyle for the community, recognise the value of sporting groups & community and support community volunteers. Environment and heritage: improve waste management and recycling, support climate change strategies, identify, implement renewable energy options and provide appropriate community infrastructure. Economic development: develop new value adding and support existing economic development opportunities to ensure ongoing prosperity, maintain & encourage improved infrastructure, promote the value of industries and support regional tourism.xxv
District Council of Loxton Waikerie – (2004 – 2009) The Loxton Waikerie Council strategic priorities are:
Social and community: develop, enhance and maintain cultural and community services by educating, volunteering programs and community facilities and events that improve the quality of life for the community. Environment and heritage: maintain and upgrade management plans for energy saving, waste collection, retention and reuse, provide protection for the environment and identify environmentally sensitive areas, increase awareness and appreciation of the environment through ecotourism and maintain a balanced and sustainable environment with the community. Economic development: encourage the growth of existing and new businesses and economic opportunities, foster new and existing tourism opportunities, plan for residential and business/industrial development, ensure strategies and partnerships that positively affect the region.xxvi
Mid Murray Council The Mid Murray Council strategic priorities are:
Social and community: develop a healthy cooperative community to achieved shared visions of the region, use and maintain facilities to improve services & healthy community needs and promote the benefits of cultural in the region. Environment and heritage: improve and maintain efficient environmental practices including waste management, plan and develop policies to adapt to environmental changes, develop alternative energy sources and support sustainable management practices to ensure adequate protection of environment and heritage. Economic development: develop an adaptable, sustainable, diverse economic region attracting industry and employment opportunities, develop partnerships with agencies and organisations to facilitate goals, tourism, recreation and increase visitors to the region and secure funding for region initiatives.xxvii
RDA M&R Regional Road Map June 2010 12

Rural City of Murray Bridge The Rural City of Murray Bridge strategic priorities are:
Social and community: encourage community communication with the council, plan to develop facilities and improve ageing infrastructure, promote event attraction and recreation and tourism in advance, implement key strategies from community consultation and ensure the community have access to services and facilities. Key actions include: Development of a Recreation and Sport Plan, progressing the Murray Bridge Railway Lands Tourist Precinct, investigating new walking trails, library fit out and promoting the Regional Art Gallery. Environment and heritage: implement plans to reduce waste to landfills, introduce water harvesting, improve waste reuse and recycling, become more self sustainable, explore alternative energy possibilities, conserve and maintain the regions environment and revegetate reserves and wetlands. Key actions include: Development of a Waste Management Plan and improved access to the waterfront. Economic development: plan a sustainable infrastructure provision for the region, building relationships to ensure coordinated and staged supplies are accessable, attract and encourage businesses, prepare and develop regional areas for growth, plan for efficient infrastructure service, ready for growth and implementation. Key actions include: Implementation of a 10 year Growth Management Plan and progressing the Monarto Intermodal Hub.xxviii
Renmark Paringa Council The Renmark Paringa Council strategic priorities are:
Social and community: ensure the council has an active and involved community (across all ages) by resourcing, planning, supporting and developing services and facilities that enhance quality of life. Key actions include: Renmark Precinct Master Plan, an Open Space Strategy and a multi-purpose sports complex. Environment and heritage: maintain water reuse, maintain an attractive and functional region protecting and maintaining the natural environment and heritage, continuous identification of heritage and preservation of towns, education of communities to adopt sustainable practices, review and maintain a district level waste collection, reuse and recycling standard. Key actions include: Develop a district level waste management strategy, flood mitigation strategy and bushfire prevention plans. Economic development: maintain an awareness of economic changes, provide financial support to the Riverland Development Corporation, attract investment to the region, enhance employment opportunities, enhance infrastructure and facilities to encourage tourists and support the regions tourism, promote a regional partnership approach and seek funding to support infrastructure &community growth. Key actions include: Implementing the Riverland Signage Audit, implementing a new tourism website, supporting the Riverland prospectus.xxix
RDA M&R Regional Road Map June 2010 13

RDA M&R Regional Road Map June 2010 14
Southern Mallee District Council The Southern Mallee District Council strategic priorities are:
Social and community: Provide opportunities for young people to develop life skills, increase knowledge and build their capacity within the community and develop effective communication methods. Environment and heritage: incorporate sustainability principals to all development and educate community in environment and resources sustainability, source funding to accommodate for regional changes in growth demands. Economic Development: attract industry and employment through partnerships with government, organisations and private sectors, plan for economic opportunities using communications, proactive plans and positive approaches.xxx

Murraylands and Riverland Region
Regional Strategic Directions Riverland Development Corporation The former Riverland Development Corporation strategic priorities were:
Social and community: support, identify and help deliver training and education to the community of all ages, individuals, migrants, businesses resulting in the increase of business and employment levels. Business and Tourism: Assist with the development of products, food and services, facilitate projects in the development of product integrity, market, capability and education, support and encourage new products for the region and for exporting, provide market intelligence, promote what the region has to offer and encourage inter-linkages between all food, business, export and tourism industries. Economic Development: develop networks to maintain and increase knowledge on economic development issues on behalf of the community, support, encourage and contribute to economic initiatives that impact the region, investigate the needs of the region in all aspects of economic development and lobby for major project areas, provide assistance to network, educate and support regional businesses and key industry support, including sourcing funds and develop, participate and initiate investment opportunities within the region.xxxi
Murraylands Regional Development Board The former Murraylands Regional Development Board strategic priorities were:
Social and community: facilitate programs to deliver training and education to the region resulting with direct links to employment opportunities, promote programs to the community and industry sectors, actively seek opportunities to increase labour force participation to the region, develop partnerships and networks through the region and beyond and engage with communities in planning. Business and tourism: Encourage, guide, support and assist new and established businesses to maximise opportunities in the region, educate employers and facilitate industry and business development growth, actively seek to increase the export capacity of the region, explore and foster innovation within industries. Environmental and heritage: Facilitate support for sustainable industry water use and work towards best practice models Economic development: actively pursue investment in collaboration with partnerships; facilitate, support and identify future infrastructure, share knowledge on economic development issues, investigate the needs of the region in all aspects of economic development and lobby for major project areas.xxxii
RDA M&R - Regional Road Map June 2010 15

Regional Prospects - Riverland In 2010, under the auspices of the Regional Investment Strategy, the Riverland Futures Taskforce, identified five potential growth sectors which were:
1. Pre-Retirement and Retirement Living – including residential development.
2. Value Added Food and Beverage Processing – including new
agribusiness investment.
3. Tourism – including tourism accommodation and eco-tourism.
4. Education – campus and student accommodation development suitable for national and international students.
5. Local Business Development – including irrigated horticulture, primary
production, retail, commercial and industrial development.xxxiii Regional Prospects - Murraylands In 2009, under the auspices of the Regional Investment Opportunities (RIO) project, the former MRDB identified twelve target areas of growth and investment which included:
1. Alternative Energy – bio fuels, solar power, wind power 2. Education/Skills Training - Private/public investment in “State of the Art” education and innovation precinct to support employment opportunities, expand the skilled workforce and expand training opportunities for young people and industry. 3. Food-processing-Higher Value Add – subject to water opportunities exist to expand horticulture, develop into the high profile gourmet niche market, expansion of viticulture industry, develop a distillation plant, expand packaging sector and potential exists for cold storage facilities. 4. Horticulture/Aquaculture/Viticulture - Potential expansion in horticulture in Prescribed Wells Area, promising models for fish commercialisation in saline water areas in the Murraylands, Investment in a crushing plant/bottling plant strategically located in the Monarto area could provide important support for the region. 5. Housing - Release of residential land at affordable prices has potential to attract investment, Urban Growth Management Plan defines residential growth in Murray Bridge & useful guidelines for other regions. 6. Intensive Animal Production – expansion of facilities and production for chicken meat and pork. Water allocations present opportunities of investment into the dairy industry.
RDA M&R Regional Road Map June 2010 16

RDA M&R Regional Road Map June 2010 17
7. Manufacturing – Mining - Opportunities are emerging for expansion of the irrigation industry, Australian Zircon Mine at Mindarie provides opportunities, opportunities increase for manufacturers to contract individually or collaboratively, alternative energies present exciting opportunities for investment. 8. Retail - Anticipated population growth in the Rural City of Murray Bridge present opportunities for investment across the board. Small business, niche markets, business service, medium and larger scale enterprises have potential for retail growth and diversity. 9. Recreation and Retirement - Retirement housing, Recreational facilities in conjunction with retirement housing, rural living retirement housing, Potential for quality sporting facilities and ovals, Opportunities for expansion of aged care facilities. 10. Transport Logistics - Tailem Bend/Murray Bridge Corridor transport logistics facility, Monarto precinct transport logistics/ warehouse distribution centre/intermodel hub, Karoonda transport and freight opportunities, potential airport to optimise road/rail links and warehousing. 11. Tourism - Potential for development and investment in conference facilities, authentic experiences relevant to history, industry, culture, lifestyle & natural resources, linking and expanding existing sites/facilities with supporting information maps, River Murray Dreaming Concept highlights potential for compatible development and potential for 7– Day Rural Trails highlighting rural life and agricultural heritage 12. Water Use - Re-use - Investment in desalination plant, water from T&R Pastoral has the potential for treatment and re-use, Bedford Project potential to take highly saline underground water through solar processes providing environments for aquaculture, potential for construction of water tanks, sewer upgrades and Grey water re-use for parks and reservesxxxiv
Murraylands and Riverland Region
South Australian Strategic Directions Social and community: improve wellbeing by:
• investing in infrastructure • establishing healthy independent lifestyles • improving health in the indigenous population • developing access to a range of health services available everyday • continue family health services • provide services for immediate health advice • community education on health/lifestyle choices and the consequences • establishing mental health services • making the workplaces safe with policies • build communities by involving and supporting the community to develop
leadership and contribute to SA’s public debate
Environment and heritage: attain sustainability by:
• introducing climate change and greenhouse programs • supporting research • rewarding sustainable actions from the community e.g. solar panel
installations • provide examples and education to businesses and community • promote sustainable water use • foster innovative sustainable ideas • manage the states natural resources • return water to the environment
Economic Development: grow prosperity and job opportunities by:
• securing major projects • developing new and existing industry sectors • supporting research • sourcing contracts & funding • foster creativity and innovation to drive industries, new technologies and
ensure future employment and education prospectsxxxv
RDA M&R - Regional Road Map June 2010 18
Murraylands and Riverland Region
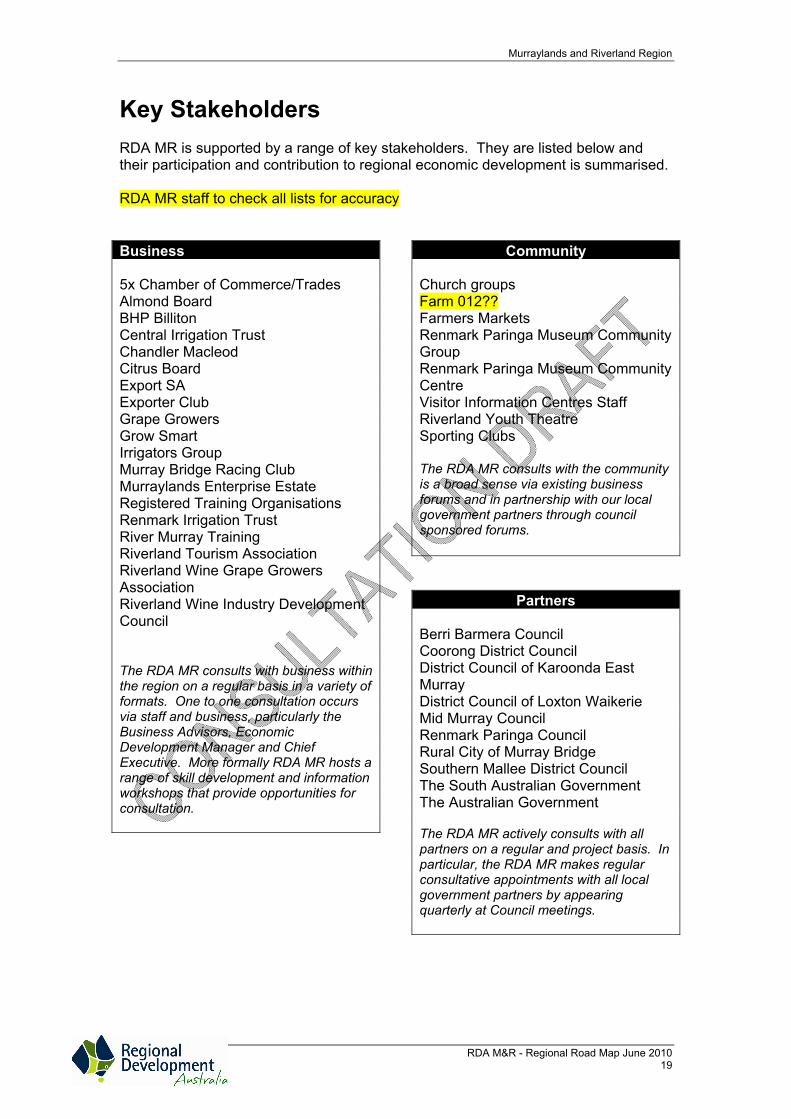
Key Stakeholders RDA MR is supported by a range of key stakeholders. They are listed below and their participation and contribution to regional economic development is summarised. RDA MR staff to check all lists for accuracy Business 5x Chamber of Commerce/Trades Almond Board BHP Billiton Central Irrigation Trust Chandler Macleod Citrus Board Export SA Exporter Club Grape Growers Grow Smart Irrigators Group Murray Bridge Racing Club Murraylands Enterprise Estate Registered Training Organisations Renmark Irrigation Trust River Murray Training Riverland Tourism Association Riverland Wine Grape Growers Association Riverland Wine Industry Development Council The RDA MR consults with business within the region on a regular basis in a variety of formats. One to one consultation occurs via staff and business, particularly the Business Advisors, Economic Development Manager and Chief Executive. More formally RDA MR hosts a range of skill development and information workshops that provide opportunities for consultation.
Community Church groups Farm 012?? Farmers Markets Renmark Paringa Museum Community Group Renmark Paringa Museum Community Centre Visitor Information Centres Staff Riverland Youth Theatre Sporting Clubs The RDA MR consults with the community is a broad sense via existing business forums and in partnership with our local government partners through council sponsored forums.
Partners Berri Barmera Council Coorong District Council District Council of Karoonda East Murray District Council of Loxton Waikerie Mid Murray Council Renmark Paringa Council Rural City of Murray Bridge Southern Mallee District Council The South Australian Government The Australian Government The RDA MR actively consults with all partners on a regular and project basis. In particular, the RDA MR makes regular consultative appointments with all local government partners by appearing quarterly at Council meetings.
RDA M&R - Regional Road Map June 2010 19

Murraylands and Riverland Region
Non-Government organisation Aboriginal Health/Education/Sobriety Group Aboriginal Lands Trust Advantage SA Australian Landscape Trust Business SA Career Development Centre Flinders University Rural Clinical School Headspace Job Network Australia Local Action Planning Murray Mallee General Practice Network Murray Mallee Local Government Association Riverland Division of General Practice School and Beyond South Australian Murray-Darling Basin Resource Information Centre Inc RDA MR consults with a range of non-government, not for profit organisations through participation in a range of regional networks, forums and project activities.
Government Aboriginal Learning On Country (Natural Resource Management) Apprenticeship Brokers (DECS) AusIndustry Austrade Careers Advice Australia Centrelink Department for Employment, Education, Science and Technology Department of Education and Children’s Services Department of Education, Employment and Workplace Relations Department of Environment and Heritage
Government (cont.) Department of Immigration, Multicultural and Indigenous Affairs Department of Primary Industries and Resources of South Australia Department of Trade and Economic Development Department of Water, Land and Biodiversity Conservation Digital Region Switchover Project Digital Switchover Taskforce Disability SA Drought Response Centre Families SA Food SA Hospitals Immigration SA Indigenous Business Australia Loxton Resource Centre Migrant Resource Centre Multicultural SA Murray Darling Basin Commission Murraylands and Riverland Tourism and Marketing Committees National Landscape Trust Parks Australia Riverland Community Health Service Riverland Futures Connect SA Works - Department for Employment, Education, Science and Technology South Australian Murray Darling Basin Natural Resource Management Board South Australian Police South Australian Tourism Commission TAFE SA Tradestart RDA MR consults with Government on a project specific basis and through maintaining personal relationships with key representative staff.
RDA M&R - Regional Road Map June 2010 20

Murraylands and Riverland Region
Working Parties Agro Forestry Group Broadband Steering Group Careers Expo Disability Transition Forum Dry Dock Working Party Engine Restoration Committee and Rural City of Murray Bridge Holistic Empowerment Aboriginal Riverland Integrated Networking Group Inland Saline Aquaculture Jobs for Indigenous Australians Network Karoonda East Murray/Australian Zircon Project Community Consultative Committee Lower Murray and Lakes Drought Impact Study Lower Murray Drought Task Force Mallee Migrant Settlement Coordinating Committee Manufacturers Alliance Mid Murray Tourism and Boating Industry Forum Mitsubishi Test Task (former) redevelopment project Mobilong Correctional Facility Working Party Monarto Intermodal Murray and Mallee Local Government Association Waste Management Committee Murray Bridge Business and Tourist Association Murray Bridge Racing Club Redevelopment Project Murray Futures Below Lock 1 Murray Mallee Ageing Taskforce Murray Mallee Community Consultative Committee Murray, Lakes and Mallee Alliance Meeting Murraylands and Riverland Ageing Taskforce Murraylands and Riverland Food Industry Development Murraylands and Riverland Integrated Tourism Plan Committee Murraylands Education Precinct Murraylands Employment, Education and Training Network
Working Parties (Cont.) Murraylands Greenhouse Project Murraylands Indigenous Education Network Murraylands Multicultural and Migration Settlement Committee Murraylands Recreation Sport and Open Space Strategy Steering Committee Murraylands Tourism and Marketing Murraylands Youth Sector Network National Aboriginal and Islander Day Observation Committee Ngarrindjeri Cultural Trail Group Pig Industry Development Board Regional Coordination Network Regional Investment Opportunities (RIO) Future Taskforce River Murray Advisory Committee Riverland Employment Training Network Riverland Futures Task Force Riverland Futures Taskforce Riverland Horticultural Reference Forum Riverland Mining Taskforce Riverland Tourism Association Riverland Transport Group Riverland Youth Sector Network Rural City of Murray Bridge Refugee Resettlement Project Rural City of Murray Bridge Water Proofing Project South Australian Business Ambassador Network Southern Mallee – Energy Upgrade T&R Expansion Working Party Telecommunications (Broadband) Murray and Mallee Local Government Association The Lower Murray Skill Centre Management Group Weathering the Weather
RDA MR actively facilitates a range of project specific Working Parties to resolve and improve regional issues. The above list is drawn from the Annual Reports of the former Murraylands Regional Development Board and Riverland Development Corporation. These Working Parties will be maintained by the RDA MR as a critical consultative tool. The Working Parties also represent an immediate source of potential partners for strategic partnership development.
RDA M&R - Regional Road Map June 2010 21
Murraylands and Riverland Region
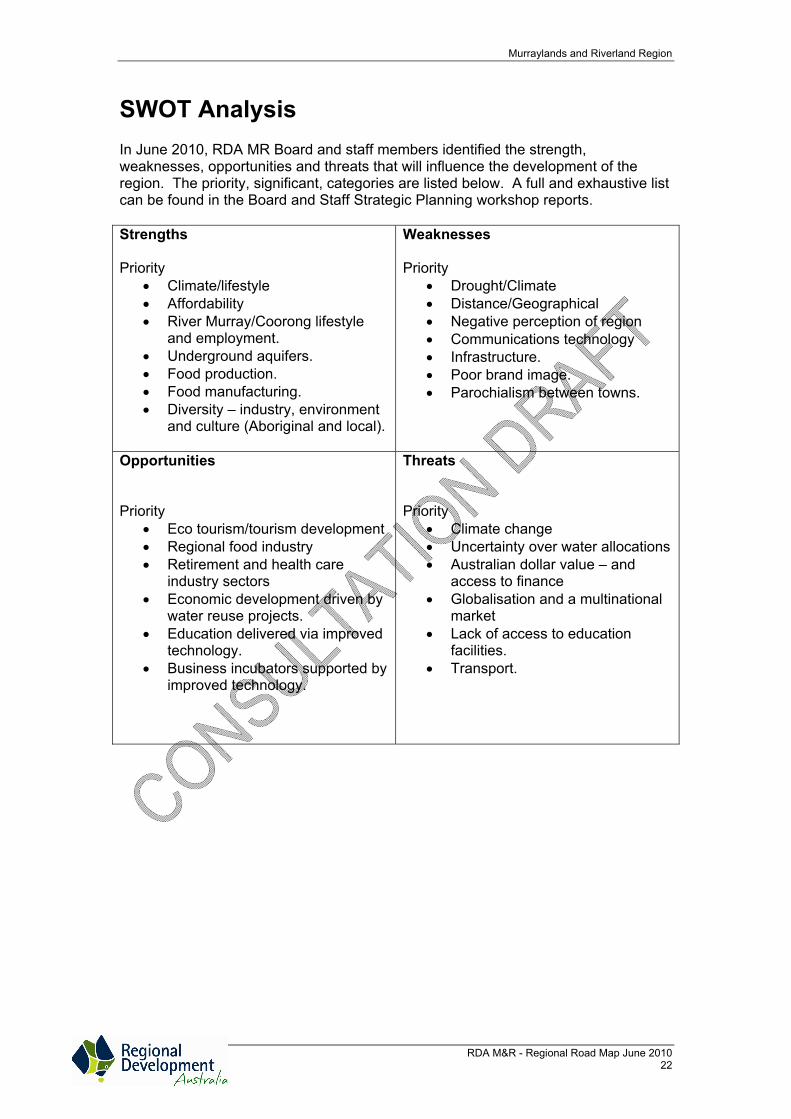
SWOT Analysis In June 2010, RDA MR Board and staff members identified the strength, weaknesses, opportunities and threats that will influence the development of the region. The priority, significant, categories are listed below. A full and exhaustive list can be found in the Board and Staff Strategic Planning workshop reports. Strengths Priority
• Climate/lifestyle • Affordability • River Murray/Coorong lifestyle
and employment. • Underground aquifers. • Food production. • Food manufacturing. • Diversity – industry, environment
and culture (Aboriginal and local).
Weaknesses Priority
• Drought/Climate • Distance/Geographical • Negative perception of region • Communications technology • Infrastructure. • Poor brand image. • Parochialism between towns.
Opportunities Priority
• Eco tourism/tourism development • Regional food industry • Retirement and health care
industry sectors • Economic development driven by
water reuse projects. • Education delivered via improved
technology. • Business incubators supported by
improved technology.
Threats Priority
• Climate change • Uncertainty over water allocations • Australian dollar value – and
access to finance • Globalisation and a multinational
market • Lack of access to education
facilities. • Transport.
RDA M&R - Regional Road Map June 2010 22

Murraylands and Riverland Region
Strategic Framework Core Operating Activities During 2010 – 2013 the RDA MR is challenged to build, and integrate, the organisational structure, culture and service delivery activities of the former Murraylands Regional Development Board and the Riverland Development Corporation. Goal: 1. To successfully implement the new RDA framework across two primary
service centres (Murray Bridge and Berri). Strategies
1.1 Organisational development. 1.1.1 The RDA MR will invest in skills development training
for all staff and Board members. 1.1.2 The RDA MR will re-invest in the development of an
integrated regional business data base.
1.2 Resourcing. 1.2.1 The RDA MR will actively work to leverage strategic
project funding against core funding at a ratio of 5:1.
1.3 Marketing 1.3.1 With strategic partners, the RDA MR will invest in a
branding and communication strategy to promote the RDA framework.
1.3.2 The RDA MR will further invest in the development of
marketing and communication activities that promote employment growth.
RDA M&R - Regional Road Map June 2010 23
Core Service Delivery Together with their strategic partners, RDA MR is responsible for the delivery of three core services: Goal: 2. To ensure that all opportunities for regional growth are identified, assessed
and progressed in a timely and effective manner. Strategies
2.1 Investment attraction. 2.1.1 The RDA MR will actively seek out, and respond to,
opportunities to increase the number and diversity of businesses within the region.
2.1.2 The RDA MR will continue to actively attract investment
in the 12 target areas identified by the Murraylands Regional Investment Opportunities project, namely:
Alternative Energy Education/Skills Training Food Processing/Value Adding Horticulture/Aquaculture/Viticulture Housing Intensive Animal Production Manufacturing – Mining Retail Recreation and Retirement Transport Logistics Tourism Water Use – Re-use
2.1.3 The RDA MR will work actively with the Riverland
Futures Taskforce to attract investment in the 5 target areas for growth identified in the Riverland Investment Strategy, namely:
Pre-Retirement and Retirement Living Value Added Food and Beverage Processing Tourism Education Local Business Development
2.2 Business development.
2.2.1 The RDA MR will actively support, enhance, and work with the business community to strengthen their competitiveness, profitability and sustainability.
2.3 Workforce and labour market development.
2.3.1 RDA MR will work to understand, and respond to, the changing needs of the local labour market.
RDA M&R Regional Road Map June 2010 24

Strategic Project Initiatives During 2010-2013 the RDA MR will build on the success of the former Murraylands Regional Development Board and the Riverland Development Corporation and recognise the work the Riverland Futures Taskforce by actively progressing a range of strategic project initiatives. Goal: 3. To successfully implement a range of strategic project initiatives that enhance
regional opportunities. Strategies
3.1 Tourism 3.1.1 The RDA MR will assume a regional leadership role to
support the effective implementation of the Murraylands Integrated Strategic Tourism Plan (MIRSTP) and the Riverland Integrated Strategic Tourism Strategy (RISTS).
3.1.2 The RDA MR will support the implementation of the River
Walking Trail.
3.1.3 With strategic regional partners, the RDA MR will explore the opportunities that exist for Eco-tourism within the region.
3.2 Food & Beverages 3.2.1 The RDA MR will actively lobby for, and implement, the
next generation Regional Food Plan.
3.2.2 The RDA MR will provide strategic coordination and advocacy to the regional wine and beverages industry sector.
3.3 Housing 3.3.1 The RDA MR will work with the Riverland Futures
Taskforce and other Murraylands partners to implement the recommended strategies for Retirement, Pre-Retirement and Immigration development.
3.3.2 The RDA MR will work with regional partners to explore
opportunities for Affordable Housing development across the region.
RDA M&R Regional Road Map June 2010 25

RDA M&R Regional Road Map June 2010 26
3.4 Education
3.4.1 The RDA MR will provide ongoing facilitation and leadership support to implement the Murraylands Education Precinct concept.
3.4.2 The RDA MR will work with the Riverland Futures
Taskforce to implement the recommended strategies for education development in the Riverland.
3.4.3 The RDA MR will work to strategically integrate and extend
the Murraylands and Riverland educational initiatives.
3.5 Infrastructure & Alternative Energy 3.5.1 The RDA MR will work with a range of partners to build
demand aggregation studies that present compelling cases for all forms of infrastructure and alternative energy development, including power, water, gas and technology.
3.6 Population Needs 3.6.1 The RDA MR will provide leadership and facilitation
support to the development of regional recreation and sporting facilities that increase regional amenity.
3.6.2 The RDA MR will provide leadership and facilitation
support to the development of strategic responses to the needs of youth, the aged, migrants and others.
3.7 Defence 3.7.1 The RDA MR will work with regional businesses to identify
and promote the regions capacity to supply and support the defence industry.
Murraylands and Riverland Region
Implementation and Review The previous ‘Strategic Framework’ section provides direction to RDA MR staff in the preparation of an annual Business Plan. The Annual Business Plan will detail:
• Work program and key priorities for the year. • Outcomes and key performance indicators • Marketing strategy • Risk management strategy
The annual Business Plan will provide the detailed implementation activities to ensure that the strategies outlined within the ‘Strategic Framework are achieved. The Murraylands Riverland Regional Roadmap will be revised, on an annual basis, by the RDA MR Board in consultation with key stakeholders.
RDA M&R - Regional Road Map June 2010 27

RDA M&R Regional Road Map June 2010 28
Appendicies

RDA M&R Regional Road Map June 2010
Environmental Scan – Statistical Analysis Regional Development Australia Murraylands and Riverland 1. Estimated Resident Population Australia = 19,855,288 South Australia Area = 1,514,337 RDAM&R = 66,754 4.4% of the States population
2006 data
Shire Population (ABS 2006 Data)
Loxton Waikerie (DC) 11,604 Renmark Paringa (DC) 9,449 Berri and Barmera (DC) 10,932 Gerard (State Suburb) 89 Mid Murray (DC) 8,035 Karoonda East Murray (DC) 1,163 Southern Mallee (DC) 2,134 The Coorong (DC) 5,670 Murray Bridge (RC) 17,678 Total RDA M&R 66,754
Estimated Resident PopulationRDA M&R
11,6049,449
10,932
89
8,035
1,163 2,134
5,670
17,678
02,0004,0006,0008,000
10,00012,00014,00016,00018,000
Loxt
on W
aike
rie (D
C)
Ren
mar
k P
arin
ga(D
C)
Ber
ri an
d B
arm
era
(DC
)
Ger
ard
(Sta
te S
ubur
b)
Mid
Mur
ray
(DC
)
Kar
oond
a E
ast
Mur
ray
(DC
)
Sou
ther
n M
alle
e (D
C)
The
Coo
rong
(DC
)
Mur
ray
Brid
ge (R
C)
Source: 2006 Census QuickStats (Local Government Area): Loxton Waikerie (DC), Renmark Paringa (DC), Berri and Barmera (DC), Gerard, Mid Murray (DC), Karoonda East Murray (DC), Southern Mallee (DC), The Coorong (DC), Murray Bridge (RC) and South Australia
29

RDA M&R Regional Road Map June 2010
2. Age Profiles
Age groups RDA M&R
% of total persons in RDA M&R
State SA %of total in SA
0-4 Years 3995 5.98% 87,334 5.8% 5-14 years 9526 14.27% 193,490 12.8% 15-24 years 7348 11.01% 200,865 13.3% 25-54 years 26246 39.32% 621,697 41.1% 55-64 years 8696 13.03% 177,824 11.7% 65 years + 10855 16.26% 233,127 15.4%
55 years + 19551 29.33% 410951 27.13%
Age Profile
0-4 years6%
5-14 years14%
15-24 years11%
25-54 years40%
55-64 years13%
65 years and over16%
Source: 2006 Census QuickStats (Local Government Area): Loxton Waikerie (DC), Renmark Paringa (DC), Berri and Barmera (DC), Mid Murray (DC), Karoonda East Murray (DC), Southern Mallee (DC), The Coorong (DC), Murray Bridge (RC) and South Australia
30

RDA M&R Regional Road Map June 2010
3. Key Populations 3a. Indigenous Numbers Indigenous persons (comprises Aboriginal and Torres Strait Islander)
2006 data
Shire Indigenous Population (ABS 2006 Data)
% of total persons in region
1971 2.95% RDA M&R 25,557 State SA 1.7%
Indigenous Numbers
2.95%
1.70%
0.00%0.50%1.00%1.50%2.00%2.50%3.00%3.50%
Regional Development AustraliaMurraylands & Riverland
South Australia
Source: 2006 Census QuickStats (Local Government Area): Loxton Waikerie (DC), Renmark Paringa (DC), Berri and Barmera (DC), Mid Murray (DC), Karoonda East Murray (DC), Southern Mallee (DC), The Coorong (DC), Murray Bridge (RC) and South Australia
31

RDA M&R Regional Road Map June 2010
3b. Disability – Need for assistance
Age RDA M&R No. People RDA M&R % South Australia South Australia % 0-4 years 17 1% 962 1.3% 5-14 years 205 6% 4,567 6.2% 15-19 years 79 2% 1,774 2.4% 20-24 years 63 2% 1,415 1.9% 25-34 years 102 3% 2,906 4.0% 35-44 years 275 8% 5,214 7.1% 45-54 years 358 11% 6,983 9.5% 55-64 years 481 15% 9,179 12.5% 65-74 years 416 13% 8,544 11.6% 75-84 years 700 21% 17,198 23.4% 85 years and over
612 19% 14,659 20.0% Total 3308 100% 73,401 100%
4.95% of the regions population has a disability in need of assistance 4.84% of the states population has a disability in need of assistance
Disability
17
20579 63 102
275358
481416
700612
0100200300400500600700800
0-4
year
s
5-14
yea
rs
15-1
9 ye
ars
20-2
4 ye
ars
25-3
4 ye
ars
35-4
4 ye
ars
45-5
4 ye
ars
55-6
4 ye
ars
65-7
4 ye
ars
75-8
4 ye
ars
85 y
ears
and
ove
r
Source: Core activity need for assistance Cat. No. 2068.0 - 2006 Census Tables, 2006 Census of Population and Housing, Loxton Waikerie (DC), Renmark Paringa (DC), Berri and Barmera (DC), Mid Murray (DC), Karoonda East Murray (DC), Southern Mallee (DC), The Coorong (DC) and Murray Bridge (RC)
32
RDA M&R Regional Road Map June 2010
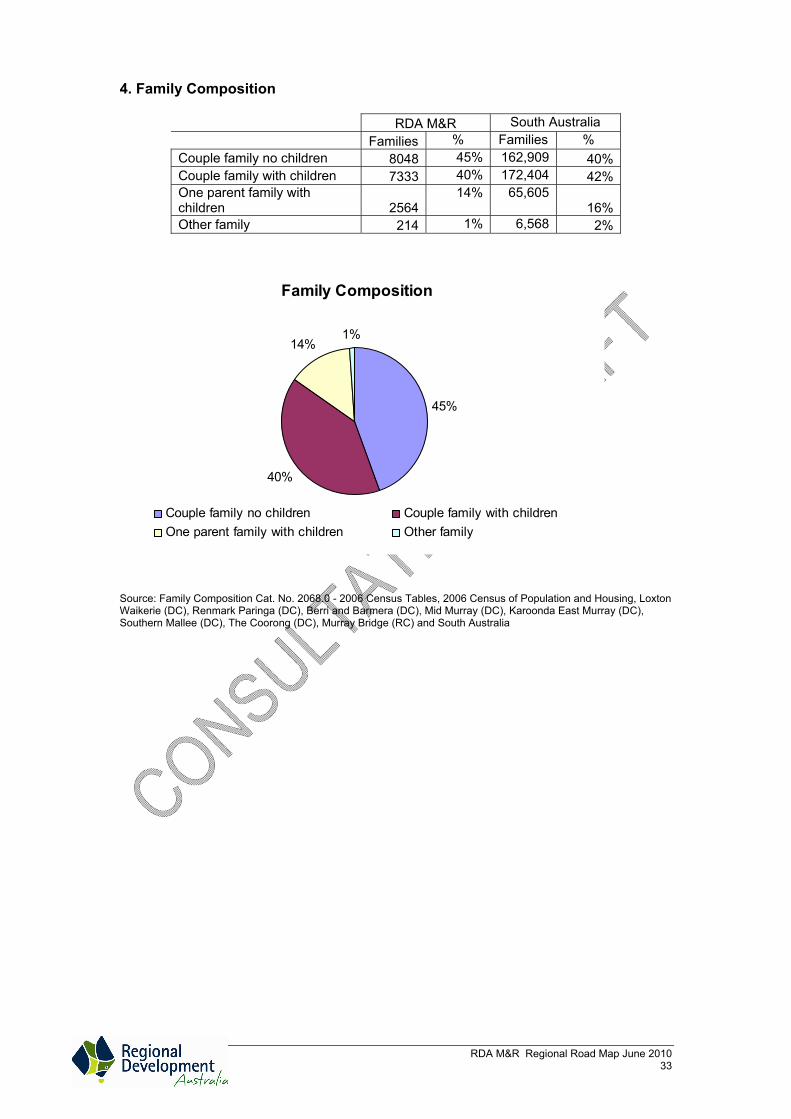
4. Family Composition
RDA M&R South Australia Families % Families %
Couple family no children 8048 45% 162,909 40% Couple family with children 7333 40% 172,404 42% One parent family with children
14% 65,6052564 16%
1% 6,568Other family 214 2%
Family Composition
45%
40%
14%1%
Couple family no children Couple family with childrenOne parent family with children Other family
Source: Family Composition Cat. No. 2068.0 - 2006 Census Tables, 2006 Census of Population and Housing, Loxton Waikerie (DC), Renmark Paringa (DC), Berri and Barmera (DC), Mid Murray (DC), Karoonda East Murray (DC), Southern Mallee (DC), The Coorong (DC), Murray Bridge (RC) and South Australia
33

RDA M&R Regional Road Map June 2010 34
5. Projections and Growth 5a. Population Growth RDA M&R South Australia
Year Population Change % Population Change %
2006 69338 303 0.4% 1567888 15374 1 2007 69694 356 0.5% 1585794 17906 1.1 2008 70013 319 0.5% 1603985 18191 1.1 2009 70285 272 0.4% 1623590 19605 1.2
Source: ABS Statistics Estimated Resident Population, Local Government Areas, South Australia 5b. Population Projections Murray Lands Statistical Division MEDIUM Series includes all 8 LGAs
Year 2001 2006 2011 2016 2021
0-4 4,578 4,241 4,156 4,175 4,200 5-9 5,081 4,641 4,325 4,220 4,236 10-14 4,985 4,989 4,561 4,226 4,115 15-19 4,419 4,420 4,410 3,929 3,575 20-24 3,378 3,809 3,844 3,750 3,244 25-29 4,055 3,389 3,945 3,932 3,832 30-34 4,672 4,184 3,644 4,176 4,153 35-39 5,071 4,687 4,272 3,717 4,244 40-44 5,247 5,142 4,804 4,376 3,823 45-49 4,813 5,145 5,063 4,722 4,296 50-54 4,849 4,620 4,967 4,879 4,541 55-59 4,055 4,809 4,607 4,950 4,879 60-64 3,435 3,903 4,657 4,479 4,835 65-69 2,858 3,254 3,719 4,459 4,310 70-74 2,571 2,617 3,015 3,468 4,184 75-79 2,109 2,218 2,293 2,675 3,117 80-84 1,290 1,637 1,757 1,859 2,217 85+ 1,091 1,273 1,630 1,932 2,207
Age
Total 68,557 68,978 69,669 69,924 70,008

RDA M&R Regional Road Map June 2010
Population Projections
68,557
68,978
69,66969,924 70,008
67,500
68,000
68,500
69,000
69,500
70,000
70,500
2001 2006 2011 2016 2021
Source: Population Projections Enquiry System, Planning SA - Murray Lands Statistical Division
35

RDA M&R Regional Road Map June 2010
6. Unemployment Rates
Statistical Local Area Unemployment Rate (%) Karoonda East Murray (DC) 2.4% Southern Mallee (DC) 2.6% Loxton Waikerie (DC) – East 4.0% Renmark Paringa (DC) – Paringa 4.6% Loxton Waikerie (DC) – West 4.9% Mid Murray (DC) 5.0% The Coorong (DC) 5.0% Berri & Barmera (DC) - Barmera 7.0% Renmark Paringa (DC) – Renmark 7.0% Berri & Barmera (DC) – Berri 7.3% Murray Bridge (RC) 8.0% RDA M&R 6.1% South Australia 5.6%
Unemployment Rates
2.4% 2.6%
4.0%4.6% 4.9% 5.0% 5.0%
7.0% 7.0% 7.3%8.0%
0.0%1.0%2.0%3.0%4.0%5.0%6.0%7.0%8.0%9.0%
Kar
oond
a E
ast M
urra
y(D
C)
Sou
ther
n M
alle
e (D
C)
Loxt
on W
aike
rie (D
C) –
Eas
t
Ren
mar
k P
arin
ga (D
C) –
Par
inga
Loxt
on W
aike
rie (D
C) –
Wes
t
Mid
Mur
ray
(DC
)
The
Coo
rong
(DC
)
Ber
ri &
Bar
mer
a (D
C) -
Bar
mer
a
Ren
mar
k P
arin
ga (D
C) –
Ren
mar
k
Ber
ri &
Bar
mer
a (D
C) –
Ber
ri
Mur
ray
Brid
ge (R
C)
Source: Small Area Labour Markets – December Quarter 2009: Table 3 Number of unemployed and unemployment rates, states/territories and statistical local areas, December quarter 2008 to December quarter 2009: Smoothed Series
36

RDA M&R Regional Road Map June 2010
Dec-09 Sep-09 Jun-09 Mar-09 Dec-08 RDA M&R 6.1% 5.6% 4.9% 5.4% 5.5% South Australia 5.6% 5.6% 5.4% 5.3% 4.9%
Dec-09 Sep-09 Jun-09 Mar-09 Dec-08 Karoonda East Murray (DC) 2.4% 2.1% 1.8% 1.7% 1.8% Southern Mallee (DC) 2.6% 2.3% 2.0% 2.1% 2.2% Loxton Waikerie (DC) – East 4.0% 3.5% 2.9% 3.2% 3.4% Renmark Paringa (DC) – Paringa 4.6% 4.1% 3.6% 4.3% 5.0% Loxton Waikerie (DC) – West 4.9% 4.5% 4.0% 4.3% 4.5% Mid Murray (DC) 5.0% 4.5% 3.7% 4.0% 4.3% The Coorong (DC) 5.0% 4.4% 3.8% 4.5% 4.7% Berri & Barmera (DC) - Barmera 7.0% 6.2% 5.3% 5.7% 6.0% Renmark Paringa (DC) – Renmark 7.0% 6.4% 5.6% 6.2% 6.6% Berri & Barmera (DC) – Berri 7.3% 6.8% 6.1% 6.8% 7.0% Murray Bridge (RC) 8.0% 7.3% 6.4% 6.9% 7.1%
Source: Small Area Labour Markets – December Quarter 2009: Table 3 Number of unemployed and unemployment rates, states/territories and statistical local areas, December quarter 2008 to December quarter 2009: Smoothed Series Dec-06 Dec-07 Dec-08 Dec-09 RDA M&R 5.2% 4.8% 5.5% 6.1% South Australia 5.1% 5.0% 4.9% 5.6%
Unemployment Rates
0.0%1.0%2.0%3.0%4.0%5.0%6.0%7.0%
2006 2007 2008 2009
RDA M&RSouth Australia
Source: Small Area Labour Markets – Table 3 Number of unemployed and unemployment rates, states/territories and statistical local areas December Quarter 2009, September Quarter 2007, June Quarter 2008.
37

RDA M&R Regional Road Map June 2010 38
7. Participation Rates Labour Force Participation Rates, 2006 Riverland ESF Region South Australia % % Males 66.3% 65.0% Females 54.2% 53.3% Youth (15-24) Full-time 35.2% 30.4% Mature (45-64) 71.9% 67.7% Aboriginal 41.6% 48.1% People with Disabilities 19.2% 19.7% Total Participation 60.3% 59.0% Source: Australian Bureau of Statistics, Population Census 2006 Labour Force Participation Rates, 2006 Murraylands ESF Region South Australia % % Males 61.4% 65.0% Females 51.3% 53.3% Youth (15-24) Full-time 35.6% 30.4% Mature (45-64) 65.3% 67.7% Aboriginal 47.9% 48.1% People with Disabilities 18.3% 19.7% Total Participation 56.4% 59.0% Source: Australian Bureau of Statistics, Population Census 2006 Source: DFEEST Regional Profile 2009 Murraylands and Riverland
RDA M&R Regional Road Map June 2010 39
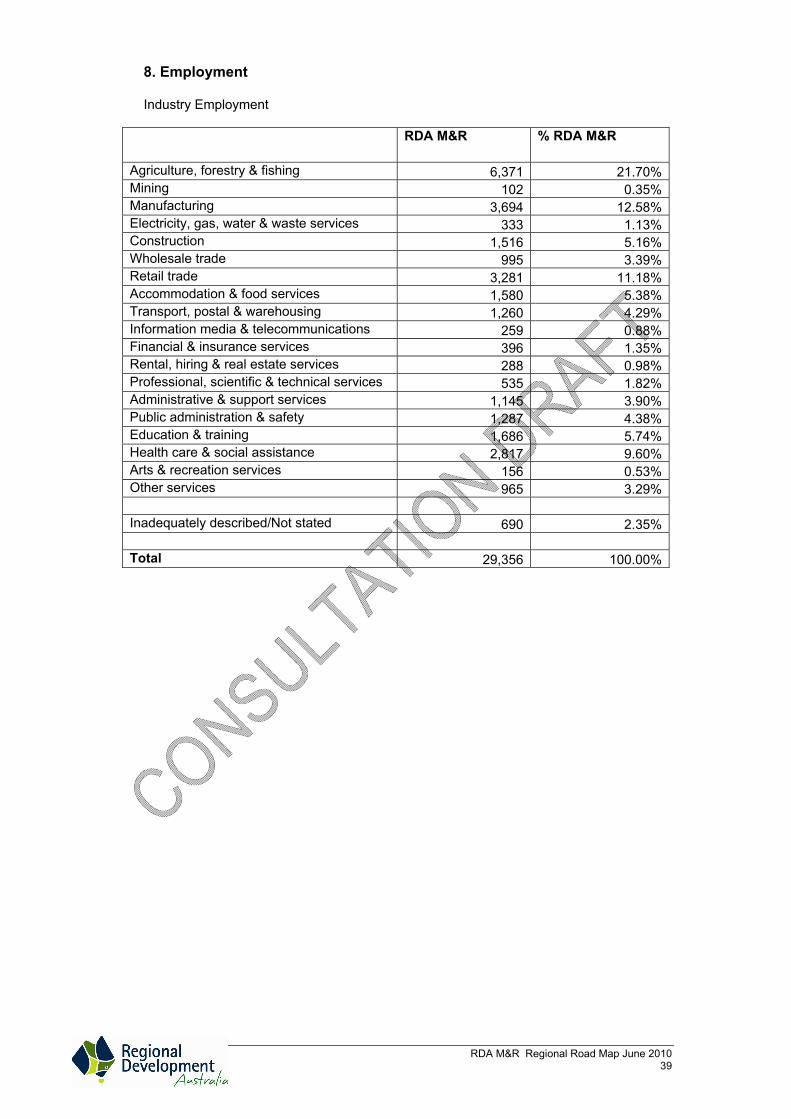
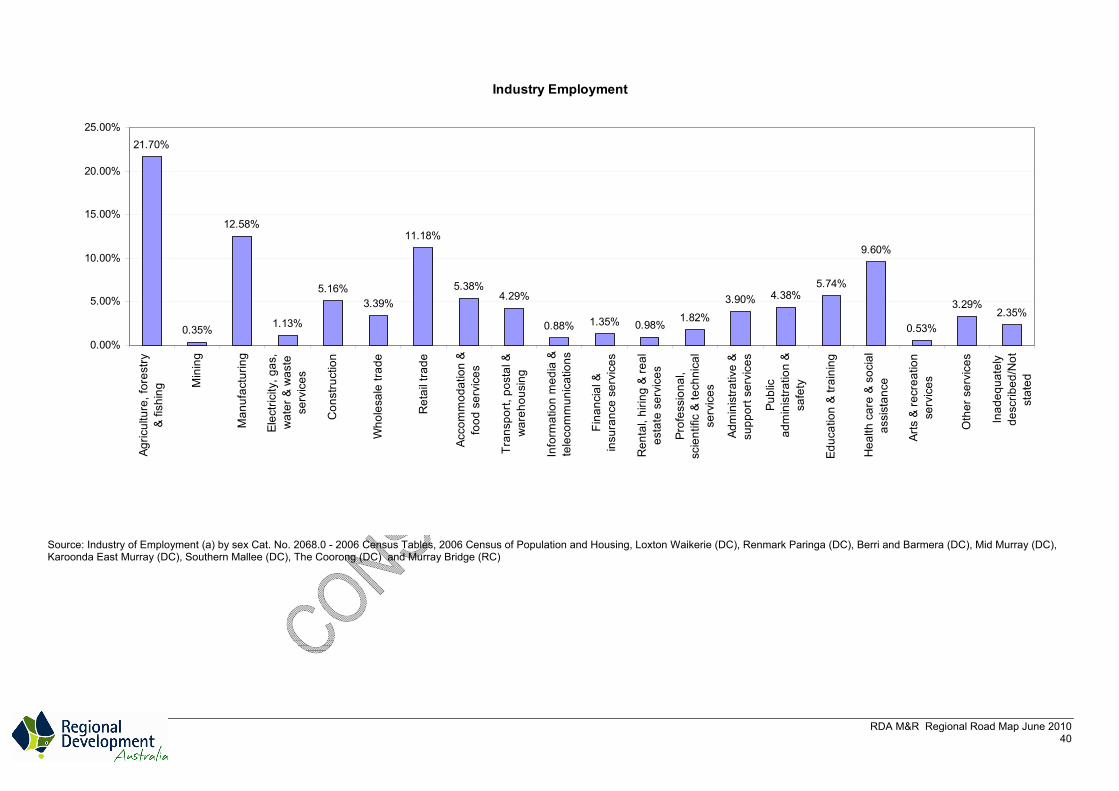
8. Employment Industry Employment
RDA M&R % RDA M&R
Agriculture, forestry & fishing 6,371 21.70%Mining 102 0.35%Manufacturing 3,694 12.58%Electricity, gas, water & waste services 333 1.13%Construction 1,516 5.16%Wholesale trade 995 3.39%Retail trade 3,281 11.18%Accommodation & food services 1,580 5.38%Transport, postal & warehousing 1,260 4.29%Information media & telecommunications 259 0.88%Financial & insurance services 396 1.35%Rental, hiring & real estate services 288 0.98%Professional, scientific & technical services 535 1.82%Administrative & support services 1,145 3.90%Public administration & safety 1,287 4.38%Education & training 1,686 5.74%Health care & social assistance 2,817 9.60%Arts & recreation services 156 0.53%Other services 965 3.29% Inadequately described/Not stated 690 2.35% Total 29,356 100.00%
RDA M&R Regional Road Map June 2010
Industry Employment
21.70%
0.35%
12.58%
1.13%
5.16%3.39%
11.18%
5.38%4.29%
0.88% 1.35% 0.98%1.82%
3.90% 4.38%5.74%
9.60%
0.53%
3.29%2.35%
0.00%
5.00%
10.00%
15.00%
20.00%
25.00%Ag
ricul
ture
, for
estry
& fis
hing
Min
ing
Man
ufac
turin
g
Elec
trici
ty, g
as,
wat
er &
was
tese
rvic
es
Con
stru
ctio
n
Who
lesa
le tr
ade
Ret
ail t
rade
Acco
mm
odat
ion
&fo
od s
ervi
ces
Tran
spor
t, po
stal
&w
areh
ousi
ng
Info
rmat
ion
med
ia &
tele
com
mun
icat
ions
Fina
ncia
l &in
sura
nce
serv
ices
Ren
tal,
hirin
g &
real
esta
te s
ervi
ces
Prof
essi
onal
,sc
ient
ific
& te
chni
cal
serv
ices
Adm
inis
trativ
e &
supp
ort s
ervi
ces
Publ
icad
min
istra
tion
&sa
fety
Educ
atio
n &
train
ing
Hea
lth c
are
& so
cial
assi
stan
ce
Arts
& re
crea
tion
serv
ices
Oth
er s
ervi
ces
Inad
equa
tely
desc
ribed
/Not
stat
ed
Source: Industry of Employment (a) by sex Cat. No. 2068.0 - 2006 Census Tables, 2006 Census of Population and Housing, Loxton Waikerie (DC), Renmark Paringa (DC), Berri and Barmera (DC), Mid Murray (DC), Karoonda East Murray (DC), Southern Mallee (DC), The Coorong (DC) and Murray Bridge (RC)
40

RDA M&R Regional Road Map June 2010
9. Occupations
RDA M&R RDA M&R SA SA % Managers 6,349 22% 92,580 13%Professionals 2,882 10% 127,151 18%Technicians and trades workers(b) 3,580 12% 97,741 14%Community and personal service workers 2,437 8% 65,098 9%Clerical and administrative workers 2,807 10% 100,240 15%Sales workers 2,259 8% 66,444 10%Machinery operators and drivers 1,982 7% 44,090 6%Labourers 6,566 22% 85,883 12%Inadequately described/Not stated 484 2% 10,669 2%Total 29,346 100% 689,896 100%
Occupations
22%
10%12%
8% 10%8% 7%
22%
2%0%
5%
10%
15%
20%
25%
Man
ager
s
Pro
fess
iona
ls
Tech
nici
ans
and
trade
sw
orke
rsC
omm
unity
and
pers
onal
serv
ice
wor
kers
Cle
rical
and
adm
inis
trativ
ew
orke
rs
Sal
es w
orke
rs
Mac
hine
ryop
erat
ors
and
driv
ers
Labo
urer
s
Inad
equa
tely
desc
ribed
/Not
stat
ed
Source: Occupation by sex for time series, Cat. No. 2068.0 - 2006 Census Tables, 2006 Census of Population and Housing, Loxton Waikerie (DC), Renmark Paringa (DC), Berri and Barmera (DC), Mid Murray (DC), Karoonda East Murray (DC), Southern Mallee (DC), The Coorong (DC), Murray Bridge (RC) and South Australia
41

RDA M&R Regional Road Map June 2010
10. Education Highest Level of Schooling Complete – RDA M&R
RDA M&R Years 15-19 20-24 25-34 35-44 45-54 55-64 65-74 75-84 85+ Total Total % Year 12 or equivalent 767 1,337 3,273 2,662 2,113 1,450 738 359 63 12,762 24.0% Year 11 or equivalent 1,089 775 1,529 2,830 2,787 1,191 445 224 36 10,906 20.5% Year 10 or equivalent 1,113 583 1,144 2,286 2,578 2,463 1,201 468 116 11,952 22.5% Year 9 or equivalent 618 167 339 653 956 1,083 760 321 98 4,995 9.4% Year 8 or below 141 72 169 305 611 1,787 1,867 1,671 572 7,195 13.5% Did not go to school 3 8 32 46 38 61 86 58 8 340 0.6% Highest year of school not stated 419 246 523 737 639 658 678 758 340 4,998 9.4% Total 4,150 3,188 7,009 9,519 9,722 8,693 5,775 3,859 1,233 53,148 100.0%
South Australia Years 15-19 20-24 25-34 35-44 45-54 55-64 65-74 75-84 85+ Total % Total Year 12 or equivalent 27,605 62,748 112,364 95,015 78,814 50,691 24,909 15,643 4,076 471,865 38.3% Year 11 or equivalent 23,953 16,227 33,173 58,535 56,669 28,660 11,942 6,350 1,534 237,043 19.2% Year 10 or equivalent 23,962 10,639 20,673 37,633 45,049 47,656 25,104 13,407 3,778 227,901 18.5% Year 9 or equivalent 13,338 2,811 5,032 8,903 12,930 14,557 12,028 8,274 2,872 80,745 6.5% Year 8 or below 2,539 996 2,355 3,892 8,205 21,920 25,719 25,212 10,140 100,978 8.2% Did not go to school 123 230 642 1,140 1,429 1,597 2,043 1,705 524 9,433 0.8% Highest year of school not stated 9,236 6,457 11,509 13,945 13,789 12,741 13,350 16,845 7,674 105,546 8.6% Total 100,756 100,108 185,748 219,063 216,885 177,822 115,095 87,436 30,598 1,233,511
100.0%
42

RDA M&R Regional Road Map June 2010 43
Highest Level of Schooling Complete
24%21% 22%
9%14%
1%
9%
0%5%
10%15%20%25%30%
Year 12 orequivalent
Year 11 orequivalent
Year 10 orequivalent
Year 9 orequivalent
Year 8 orbelow
Did not goto school
Highestyear of
school notstated
Source: Highest Year of School Completed by Age by Sex - Cat. No. 2068.0 - 2006 Census Tables, 2006 Census of Population and Housing, Loxton Waikerie (DC), Renmark Paringa (DC), Berri and Barmera (DC), Mid Murray (DC), Karoonda East Murray (DC), Southern Mallee (DC), The Coorong (DC), Murray Bridge (RC) and South Australia (State)
RDA M&R

RDA M&R Regional Road Map June 2010
11. Qualification Level
RDA M&R RDA M&R SA SA Australia AustraliaPostgraduate Degree 202 0.98% 22,897 4% 413,101 4.9% Graduate Diploma and Graduate Certificate
320 1.55% 16,098 3% 228,550 2.7%
Bachelor Degree 2318 11.24% 120,979 20% 1,840,660 22.0% Advanced Diploma and Diploma
2258 10.95% 79,698 13% 1,130,464 13.5%
Certificate: Certificate 797 3.86% 21,172 4% 264,341 3.2% Certificate III & IV 7375 35.75% 176,066 30% 2,218,366 26.5% Certificate I & II 666 3.23% 15,343 3% 180,073 2.2% Total 8838 42.84% 212,581 36% 2,662,780 31.8% Level of education inadequately described
687 3.33% 15,940 3% 234,977 2.8%
Level of education not stated 6007 29.12% 127,186 21% 1,851,282 22.1%
Qualification Level
0.98% 1.55%
11.24% 10.95%
3.86%
35.75%
3.23% 3.33%
29.12%
0.00%
10.00%
20.00%
30.00%
40.00%
Pos
tgra
duat
e D
egre
e
Gra
duat
e D
iplo
ma
and
Gra
duat
eC
ertif
icat
e
Bac
helo
r Deg
ree
Adv
ance
d D
iplo
ma
and
Dip
lom
a
C
ertif
icat
e nf
d
C
ertif
icat
e III
& IV
(c)
C
ertif
icat
e I &
II(d
)
Leve
l of e
duca
tion
inad
equa
tely
desc
ribed
Leve
l of e
duca
tion
not s
tate
d
Source: Non-School Qualification: Level of Education (a) by age by sex Cat. No. 2068.0 - 2006 Census Tables, 2006 Census of Population and Housing, Loxton Waikerie (DC), Renmark Paringa (DC), Berri and Barmera (DC), Mid Murray (DC), Karoonda East Murray (DC), Southern Mallee (DC), The Coorong (DC), Murray Bridge (RC)and South Australia
44
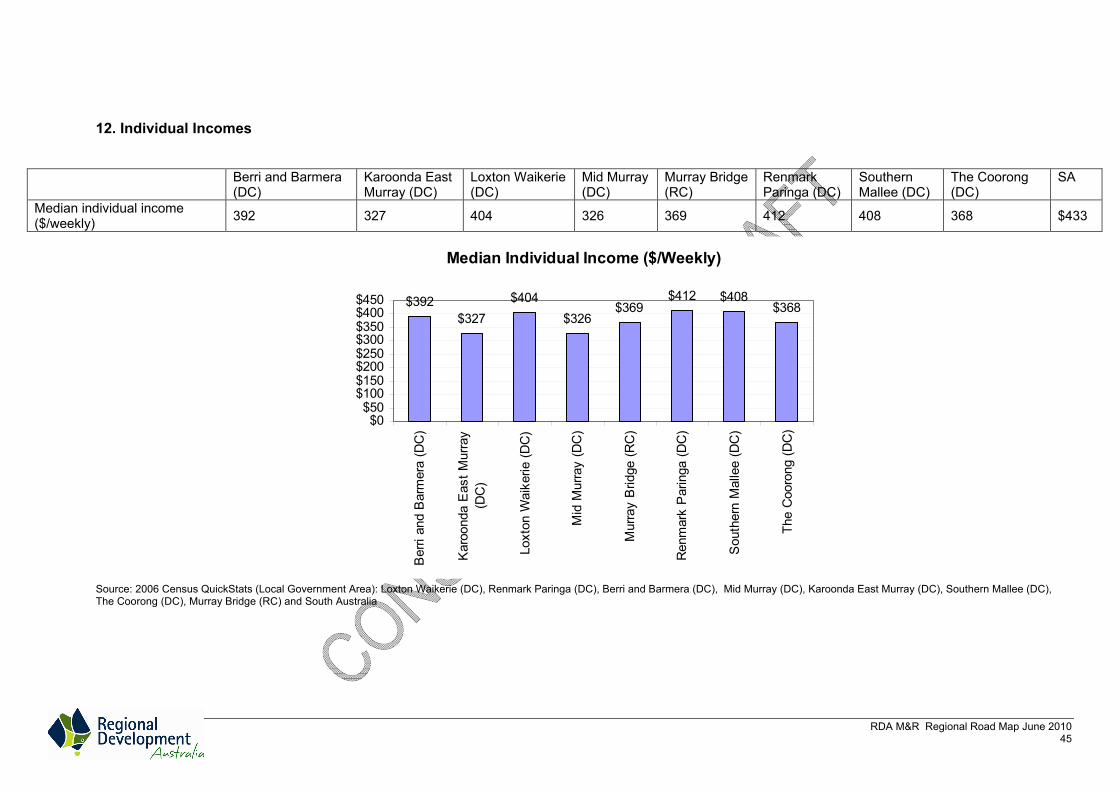
12. Individual Incomes
Berri and Barmera (DC)
Karoonda East Murray (DC)
Loxton Waikerie (DC)
Mid Murray (DC)
Murray Bridge (RC)
Renmark Paringa (DC)
Southern Mallee (DC)
The Coorong (DC)
SA
Median individual income ($/weekly) 392 327 404 326 369 412 408 368 $433
Median Individual Income ($/Weekly)
$392$327
$404$326
$369$412 $408
$368
$0$50
$100$150$200$250$300$350$400$450
Ber
ri an
d B
arm
era
(DC
)
Kar
oond
a E
ast M
urra
y(D
C)
Loxt
on W
aike
rie (D
C)
Mid
Mur
ray
(DC
)
Mur
ray
Brid
ge (R
C)
Ren
mar
k P
arin
ga (D
C)
Sou
ther
n M
alle
e (D
C)
The
Coo
rong
(DC
)
Source: 2006 Census QuickStats (Local Government Area): Loxton Waikerie (DC), Renmark Paringa (DC), Berri and Barmera (DC), Mid Murray (DC), Karoonda East Murray (DC), Southern Mallee (DC), The Coorong (DC), Murray Bridge (RC) and South Australia
RDA M&R Regional Road Map June 2010 45
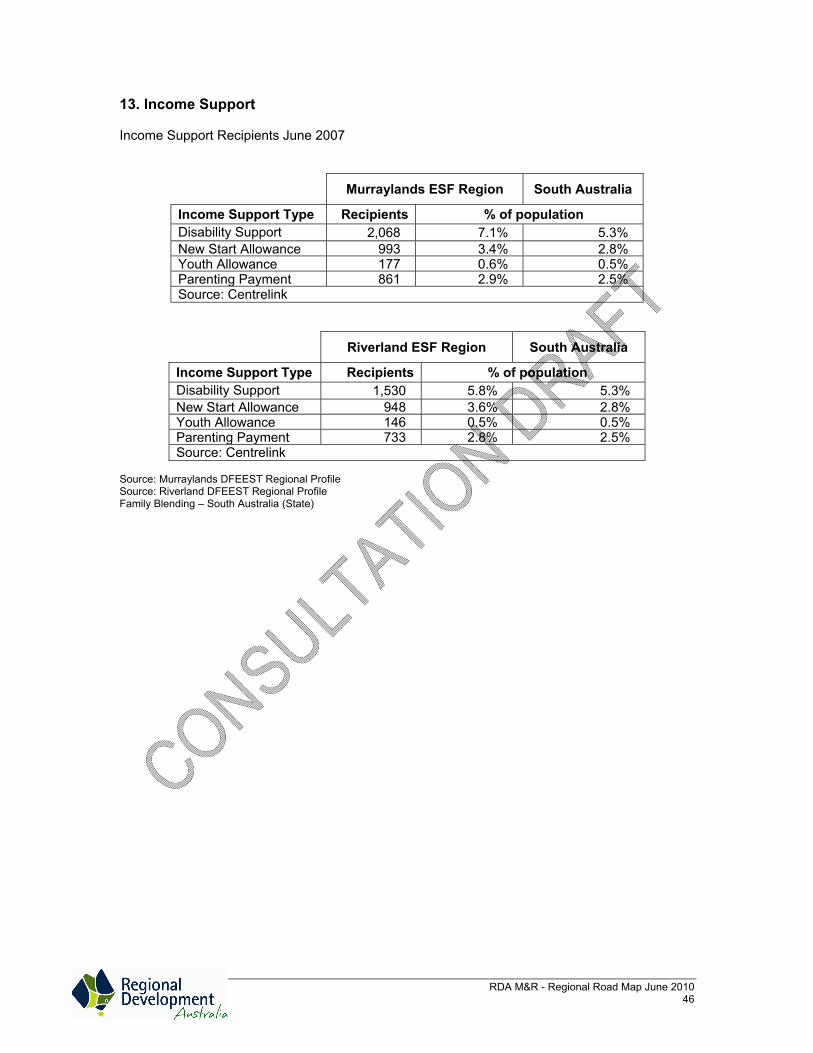
13. Income Support Income Support Recipients June 2007
Murraylands ESF Region South Australia
Income Support Type Recipients % of population Disability Support 2,068 7.1% 5.3% New Start Allowance 993 3.4% 2.8% Youth Allowance 177 0.6% 0.5% Parenting Payment 861 2.9% 2.5% Source: Centrelink
Riverland ESF Region South Australia
Income Support Type Recipients % of population Disability Support 1,530 5.8% 5.3% New Start Allowance 948 3.6% 2.8% Youth Allowance 146 0.5% 0.5% Parenting Payment 733 2.8% 2.5% Source: Centrelink
Source: Murraylands DFEEST Regional Profile Source: Riverland DFEEST Regional Profile Family Blending – South Australia (State)
RDA M&R - Regional Road Map June 2010 46

RDA M&R Regional Road Map June 2010 47
14. Home Ownership
RDA M&R No. dwellings
RDA M&R %
SA No. dwellings
SA %
Fully owned 10040 37.2% 44,758 26.0%Being purchased (includes being purchased under rent/buy scheme) 7827 29.0% 99,053 57.5%Rented (includes rent-free) 7185 26.6% 26,131 15.2%Other tenure type 416 1.5% 544 0.3%Not stated 1548 5.7% 1,916 1.1%Total 27016 100.0% 172,402
Source: 2006 Census QuickStats (Local Government Area): Loxton Waikerie (DC), Renmark Paringa (DC), Berri and Barmera (DC), Mid Murray (DC), Karoonda East Murray (DC), Southern Mallee (DC), The Coorong (DC), Murray Bridge (RC) and South Australia

RDA M&R - Regional Road Map June 2010 48
Stakeholder Strategy Matrix Stakeholder Strategy Matrix
RDA M&R - Regional Road Map June 2010 48

Nexus with the State Strategic Plan
South Australian Strategic Plan Reference
RDA Strategic Plan Reference
Comment
Growing Prosperity Economic growth T1.1 Goal (G) 2, 3.
Competitive business climate T1.2 Strategy (S) 2.2.1.
Credit rating T1.3 Not applicable
Industrial relations T1.4 Limited opportunity for influence
Business investment T1.5 S2.1.1, 2.1.2, 2.1.3
Labour productivity T1.6 S2.3.1.
Performance in the public sector –
customer & client satisfaction T1.7,
1.8, 1.9
Not applicable
Jobs T1.10 G 2, 3.
Unemployment T1.11 S2.3.1.
Employment participation T1.12 S2.3.1.
Employment in the defence industry
T1.13
S.3.7.1.
Total exports T1.14 S.2.2.1.
Tourism industry T1.15 S.3.1.
Share of overseas students T1.16 S.3.4.
Minerals T1.17, 1.18, 1.19 S2.1.2. Some opportunities through Australian Zircon
investment
Defence industry T1.20 S3.7.1.
Strategic infrastructure T1.21 S.3.5.1.
Total population T1.22 S.3.6.
Interstate migration T1.23 S.3.6. In part influenced by the activities of the MRDB
Overseas migration T1.24 S.3.6. In part influenced by the activities of the MRDB
Population fertility rate T1.25 Not applicable
Aboriginal unemployment T1.26 S.2.3.1.
Improving Wellbeing
Smoking T2.1 In part influenced by the activities of the RDA
Healthy weight T2.2 In part influenced by the activities of the RDA
Sport and recreation T2.3 S.3.6.1. Some influence
Healthy South Australians T2.4 S.3.6.1. Some influence
Aboriginal healthy life expectancy T2.5 Limited influence
Chronic diseases T2.6 Limited influence
Psychological wellbeing T2.7 In part influenced by the activities of the RDA
Statewide crime rates T2.8 In part influenced by the activities of the RDA
Road safety T2.9, 2.10 Limited influence
Greater safety at work T2.11 Supported through business education
Work-life balance T2.12 In part influenced by the activities of the RDA
RDA M&R - Regional Road Map June 2010 49

South Australian Strategic Plan Reference
RDA Strategic Plan
Reference
Comment
Attaining Sustainability
Lose no species T3.1 Limited influence (facilitate volunteer networking)
Land biodiversity T3.2 Limited influence (facilitate volunteer networking)
Soil protection T3.3 Limited influence (facilitate volunteer networking)
Marine biodiversity T3.4 Limited influence
Greenhouse gas emissions reduction
T3.5
S.3.5.1. Some influence
Use of public transport T3.6 S.3.5.1.
Ecological footprint T3.7 Limited influence
Zero Waste T3.8 S.3.5.1.
Sustainable water supply T3.9 Limited influence
River Murray T3.10, 3.11 Limited influence
Renewable energy T3.12 S.3.5.1.
Energy efficiency T3.13, 3.14 Limited influence
Aboriginal lands – access & management
T3.15
Not applicable
Fostering Creativity & Innovation
Creative industries T4.1 Limited influence
Film industry T4.2 Not applicable
Cultural engagement T4.3, 4.4 Not applicable
Understanding of Aboriginal culture T4.5 Not applicable
Commercialisation of research T4.6 Limited influence
Business innovation T4.7 S.2.2.1.
Broadband usage T4.8 S.3.5.1.
Public expenditure T4.9 Not applicable
Australian Government resources T4.10 Not applicable
Business expenditure T4.11 S.2.1./S.2.2.
Venture capital T4.12 S.2.1/S.2.2.
Building Communities Boards & committees T5.1, 5.2 Limited influence
Members of Parliament T5.3 Not applicable
Enrolment to vote T5.4 Not applicable
Local government elections T5.5 Not applicable
Volunteering T5.6 S.3.6.
Aboriginal leadership T5.7 Leadership is a core RDA principle.
Multiculturalism T5.8 S.3.6.2.
Regional population levels T5.9 S.3.6.2.
RDA M&R Regional Road Map June 2010 50

RDA M&R Regional Road Map June 2010 51
South Australian Strategic Plan
Reference Murraylands
Strategic Plan Reference
Comment
Expanding Opportunity Aboriginal wellbeing T6.1 Limited influence
Early childhood T6.2, 6.3, 6.4 Limited influence
Economic disadvantage T6.5 S.2.3.1.
Homelessness T6.6 Limited influence
Affordable housing T6.7 S.3.3.2.
Housing stress T6.8 Limited influence
Aboriginal housing T6.9 Not applicable
Housing for people with disabilities T6.10 Not applicable
Participation for people with disabilities
T6.11
Limited influence
Education (Years 3,5,7) T6.12, 6.13, 6.14 Not applicable
Learning or earning T6.15 S.3.4./S.2.3.1.
SACE or equivalent T6.16 Not applicable
Science and maths T6.17 Not applicable
Aboriginal education T6.18 Not applicable
Workforce development & training T6.19,
6.20, 6.21
S.2.3.1/S.3.4
People with disabilities T6.22 Limited influence
Women T6.23 Limited influence
Aboriginal employees T6.24 Limited influence

Bibliography Documents Small Area Labour Markets - Australia, Department of Education, Employment and Workplace Relations, December Quarters for 2006 – 2009 Small Area Labour Markets- Australia, Department of Education, Employment and Workplace Relations, March Quarters for 2007 – 2010 2009 Murraylands Employment & Skills Formation Regional Profile, Department of Further Education, Employment, Science and Technology, 2009 2009 Riverland Employment & Skills Formation Regional Profile, Department of Further Education, Employment, Science and Technology, 2009 Berri Barmera Council Draft Strategic Plan, 2010-2015 Coorong District Council Strategic Management Plan 2008-2012, Adopted by Council 13 May 2008 District Council Karoonda East Murray Strategic Plan 2008 -2012, Roger Sanderson & Associates, 13 May 2008 District Council of Loxton Waikerie, Road Map to the Future, Strategic Plan 2004 – 2009 Mid Murray Council Strategic Management Plan 2006 – 2011, Revised and Adopted 8 December 2008 Rural City of Murray Bridge Strategic Management Plan 2005 -2013, Amended 2008 Renmark Paringa Council Strategic Plan 2009 -2014, URPS, August 2009 Southern Mallee District Council Strategic Management Plan 2008 – 2011, Jennifer Repper and Associates Riverland Development Corporation Strategic Plan, 2008 – 2013 Murraylands Regional Development Board Strategic Plan 2008 – 2013, Dynamic Project Delivery, 2008 Riverland Futures Taskforce, Regional Investment Strategy Report, Hudson Howells, May 2010 Murraylands Investment Attraction Plan – Strategic Directions Snapshots, Regional Investment Opportunities, 2007 South Australias Strategic Plan 2007, Government of South Australia, 2007
RDA M&R - Regional Road Map June 2010 52
RDA M&R Regional Road Map June 2010 53
Websites Murray Mallee Local Government Association, http://www.lga.sa.gov.au/site/page.cfm?u=776, 14/6/10. Population Projections Enquiry System, Planning SA – Murraylands Statistical Division, http://www.planning.sa.gov.au/index.cfm?objectid=1EAEEDC0-F203-0D46-ADDE3AB8A1CA2487, 08/06/10. http://www.berribarmera.sa.gov.au/site/page.cfm?u=143, 1/07/10 http://www.coorong.sa.gov.au/site/page.cfm, 1/07/10 http://www.dckem.sa.gov.au/site/page.cfm?u=114, 1/07/10 http://www.loxtonwaikerie.sa.gov.au/site/page.cfm?u=260, 1/07/10 http://www.mid-murray.sa.gov.au/site/page.cfm?u=349, 1/07/10 http://www.murraybridge.sa.gov.au/site/page.cfm, 1/07/10 http://www.renmarkparinga.sa.gov.au/site/page.cfm?u=101, 1/07/10 http://www.southernmallee.sa.gov.au/site/page.cfm, 1/07/10 Australian Bureau of Statistics (ABS) 2006 Census Website - http://abs.gov.au/ 7/06/10 – 11/06/10
• QuickStats • Estimated Resident Population, Local Government Areas, South Australia • Core activity need for assistance Cat. No. 2068.0 • Family Composition Cat. No. 2068.0 • Industry of Employment (a) by sex Cat. No. 2068.0 • Occupation by sex for time series, Cat. No. 2068.0 • Highest Year of School Completed by Age by Sex - Cat. No. 2068.0 • Non-School Qualification: Level of Education (a) by age by sex Cat. No.
2068.0
For Areas: Loxton Waikerie (DC LGA), Renmark Paringa (DC LGA), Berri and Barmera (DC LGA), Gerard, Mid Murray (DC LGA), Karoonda East Murray (DC LGA), Southern Mallee (DC LGA), the Coorong (DC LGA), Murray Bridge (RC LGA), South Australia and Australia.
Regional Development Australia South Australia Regions Maps, http://www.rda.gov.au/resources/maps.aspx#sa_maps, 7/06/10

RDA M&R - Regional Road Map June 2010 54
References i Regional Development Australia South Australia Regions ii LGA x 8 Council Websites iii Murray Mallee Local Government Association, http://www.lga.sa.gov.au/site/page.cfm?u=776, 14/6/10. iv ABS 2006 Census, for Regional Development Australia Murraylands & Riverland v Ibid. vi Ibid. vii Ibid. viii Ibid. ix ABS Statistics Estimated Resident Population, Local Government Areas, South Australia. x Population Projections Enquiry System, Planning SA – Murraylands Statistical Division. xi Small Area Labour Markets – December Quarter 2009. xii Small Area Labour Markets – December Quarter 2009, for Regional Development Australia Murraylands & Riverland xiii Murraylands and Riverland DFEEST Regional Profiles, for Regional Development Australia Murraylands & Riverland xiv ABS 2006 Census, for Regional Development Australia Murraylands & Riverland xv ABS 2006 Census, for Regional Development Australia Murraylands & Riverland xvi ABS 2006 Census, Highest year of school completed for Regional Development Australia Murraylands & Riverland. xvii ABS 2006 Census, for Regional Development Australia Murraylands & Riverland xviii Ibid. xix Centrelink, from the Murraylands and Riverland DFEEST Regional Profiles. (2009) xx ABS 2006 Census, for Regional Development Australia Murraylands & Riverland xxi ABS 2006 Census, for Regional Development Australia Murraylands & Riverland xxii Murraylands and Riverland DFEEST Regional Profiles, for Regional Development Australia Murraylands & Riverland xxiii Berri Barmera Council Strategic Plan 2006-2016 xxiv Coorong District Council Strategic Management Plan 2008-2012 xxv District Council Karoonda East Murray Strategic Plan 2008 -2012 xxvi District Council of Loxton Waikerie Strategic Plan 2004 - 2009 xxvii Mid Murray Council Strategic Management Plan 2006 – 2011 xxviii Rural City of Murray Bridge Strategic Management Plan 2005 -2013 xxix Renmark Paringa Council Strategic Plan 2009 -2014 xxx Southern Mallee District Council Strategic Management Plan 2008 - 2011 xxxi Riverland Development Corporation Strategic Plan 2008 - 2013 xxxii Murraylands Regional Development Board Strategic Plan 2008 - 2013 xxxiii Riverland Futures Taskforce, Regional Investment Strategy Report, May 2010 xxxiv Murraylands Investment Attraction Plan – Strategic Directions Snapshot xxxv South Australias Strategic Plan 2007