regional value chains in east africa · 5/28/2015 · agenda agenda 1. overview of gvc framework...
TRANSCRIPT

Regional Value Chains in East Africa:
What Can We Learn from the Latin American
and Asian Experiences?
Gary GereffiDuke [email protected]
May 28, 2015
MINICOM, IGC
Ministry of Trade & Industry
Kigali, Rwanda

Agenda
AGENDA
1. Overview of GVC Framework
– Holistic View of Global Industries
– Strategic Benchmarking through International Comparisons
– Moving Up the Value Chain – From Commodities to High Value Activities
2. Medical Devices GVC in Costa Rica
3. Offshore Services GVC in Chile
4. GVCs and Regional Value Chains in East Africa
– GVC Participation: Forward and Backward Linkages (Integration)
– Wheat and Maize GVCs: Black Sea Region and East Africa
– Tourism in East Africa
– Policy Issues and Opportunities/Challenges for Upgrading
2

Global Value Chains
and Competitiveness
3

DUKE UNIVERSITY, CENTER ON GLOBALIZATION, GOVERNANCE & COMPETITIVENESS (DUKE CGGC)
Source: http://cggc.duke.edu/
4

GLOBALIZATION & DEVELOPMENT:
KEY TRENDS
• Post-Washington Consensus world – Global economic recession of 2008-09 and rise of “middle powers” has changed export-oriented model
• Large emerging economies like China, India and Brazil are both export platforms and turning inward
• Small economies are seeking specialized niches in the global economy and regional economic blocs
• Lead firms in global value chains are streamlining and consolidating their sourcing and production networks
5

© 2014 Duke CGGC
CLUSTERS & GLOBAL VALUE CHAINS
6

© 2014 Duke CGGC
GLOBAL VALUE CHAINS: A HOLISTIC APPROACH
7
Global value chain analysis provides both conceptual and
methodological tools for examining the global economy
• Top-down: a focus on lead firms and inter-firm
networks, using varied typologies of industrial
“governance”
• Bottom-up: a focus on countries and regions, which
are analyzed in terms of various trajectories of
economic and social “upgrading”

© 2014 Duke CGGC
DIMENSIONS OF GLOBAL VALUE CHAIN ANALYSIS
8
1. Value Chain Mapping
2. Geographic Scope
3. Governance Structures: Lead
Firms, Suppliers & Standards
4. Upgrading Trajectories
5. Local Institutional Context
6. Industry Stakeholders
GLOBAL
LOCAL

Where Are the High-Value Activities in GVCs?
9

Drivers of GVC Competitiveness
1. Role of the state
2. Types of FDI
3. Public-private collaboration
4. International benchmarking
5. Regional value chains
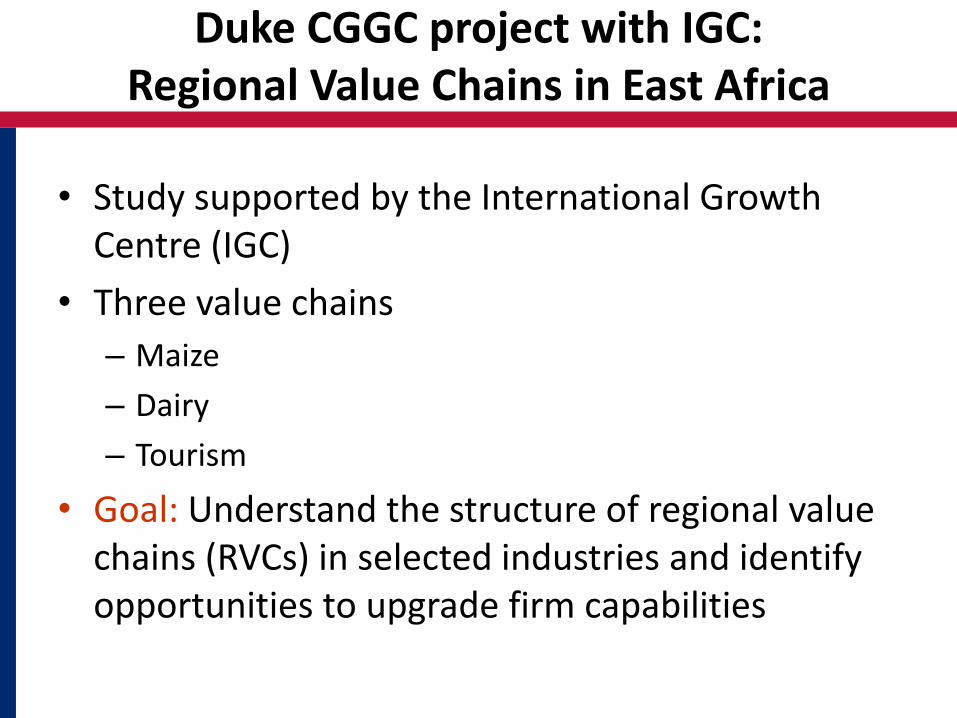
Duke CGGC project with IGC: Regional Value Chains in East Africa
• Study supported by the International Growth Centre (IGC)
• Three value chains
– Maize
– Dairy
– Tourism
• Goal: Understand the structure of regional value chains (RVCs) in selected industries and identify opportunities to upgrade firm capabilities

Why are Regional Value ChainsImportant for East Africa?
• Lead firms in GVCs prefer “one-stop shopping”• Regional value chains allow smaller economies to create new
forward and backward value adding stages across neighboring countries
• Mechanisms for regional value chains:– Trade– FDI– Regulations and standards– Labor markets
• Economic benefits of regional value chains:– Exports– Employment– Poverty reduction– Improve capabilities of local firms– Workforce development: adding skills and increasing wages

COSTA RICA IN THE MEDICAL DEVICES GLOBAL VALUE CHAIN
13

GVCs in Costa Rica
• Study for Costa Rica’s Ministry of International Trade (2013) (http://www.cggc.duke.edu/gvc/project.php?proj=180)
• 3 Manufacturing GVCs: Economic Diversification– Medical devices
– Electronics
– Aerospace
• Research questions: How well positioned is Costa Rica to upgrade in these GVCs, and what factors contribute to positive or negative outcomes?
73
Components
Manufacturing
Plastics extrusion
& molding
Precision metal
works
Electronics
development
Software
Development
Weaving/Knittin
g Textiles
Assembly
Packaging
Sterilization
Assembly /
ProductionDistribution &
Marketing
Resin Metals
Chemicals Textiles
Input Suppliers
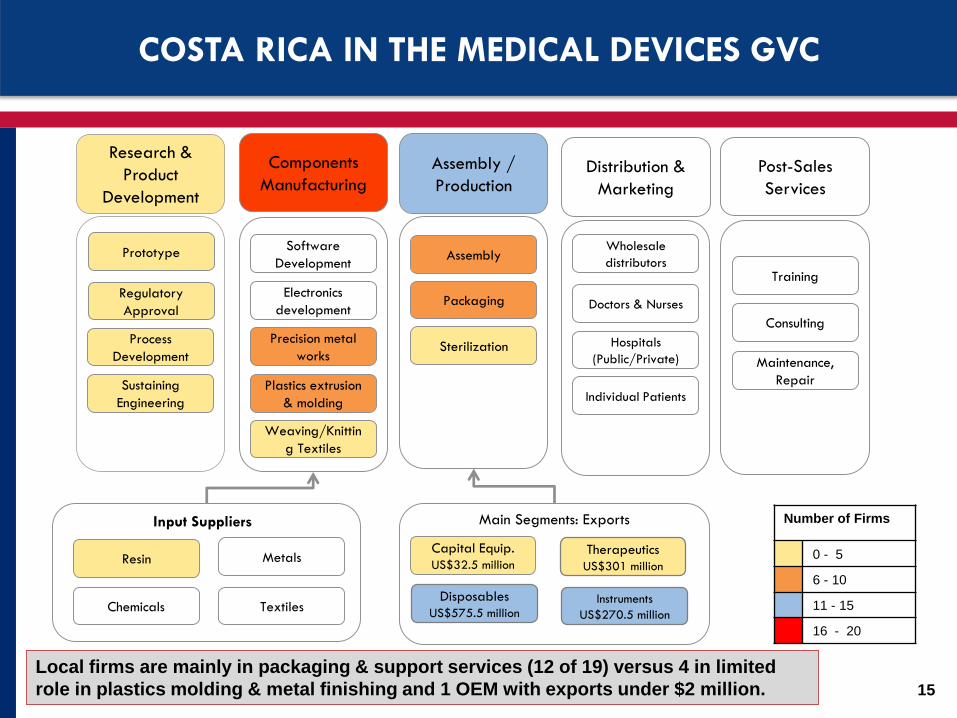
Disposables
US$575.5 millionInstruments
US$270.5 million
Capital Equip.
US$32.5 million
Therapeutics
US$301 million
Main Segments: Exports
Post-Sales
Services
Consulting
Maintenance,
Repair
Training
Research &
Product
Development
Regulatory
Approval
Process
Development
Sustaining
Engineering
Prototype
Local firms are mainly in packaging & support services (12 of 19) versus 4 in limited
role in plastics molding & metal finishing and 1 OEM with exports under $2 million.
Number of Firms
0 - 5
6 - 10
11 - 15
16 - 20
COSTA RICA IN THE MEDICAL DEVICES GVC
Wholesale
distributors
Individual Patients
Doctors & Nurses
Hospitals
(Public/Private)
15

0
200
400
600
800
1,000
1,20019
98
19
99
20
00
20
01
20
02
20
03
20
04
20
05
20
06
20
07
20
08
20
09
20
10
20
11
Exp
ort
Valu
es (
$U
S M
ilio
n)
Year
Costa Rica's Medical Exports by Product Category: 1998-2011
Disposables Therapeutics Instruments Capital Equipment
EVOLUTION OF COSTA RICAN MEDICAL DEVICE EXPORTS
• Disposables still the largest product category exported, but no longer a
strong growth area.
• Exports in surgical instruments have grown steadily since 2005.
• Therapeutics has become 2nd largest category since 2008; likely to increase
as newly established firms complete transfer of new product lines.
• Limited export of highest value capital equipment (eg. Electronic/software
devices) 16

© 2013 Duke CGGC
Entry Year Firm
Characteristics
Main Product
Export Category
Core Market
Segments
Product
Examples
Select
Firms
Up to 2000
24 firms:
8 US
15 CR
1 German
4 OEMs
8 Components
1 Input distributor
7 Packaging
1 Finishing
3 Support services
Disposables
Drug delivery;
Women’s health
Intravenous tubing (I)
Mastectomy bra (I)
Hospira;
Baxter;
Amoena;
Corbel
2001–2004
13 firms:
9 US
3 CR
1 Colombian
3 OEMS
6 Components
1 Finishing
1 Logistics provider
2 Support services
Instruments Endoscopic surgery Biopsy forceps (II)
Arthrocare;
Boston Scientific;
Oberg Industries
2005–2008
8 firms:
7 US
1 Puerto Rico
2 OEM
4 Components
1 Packaging
1 Finishing
Therapeutics
Cosmetic surgery;
Women’s health &
urology
Breast implants (III)
Minimally invasive
devices for uterine
surgery (II)
Allergan;
Tegra Medical;
Specialty Coating
Systems
2009–2012
21 firms:
16 US
1 CR
1 Ireland
1 Japan
2 Joint ventures
(US-CR)
5 OEMS
7 Components
2 Non-OEM
assemblers
1 Input Distributor
2 Sterilization
2 Packaging
Therapeutics
Disposables
Instruments
Cardiovascular
Drug delivery
Heart valves (III)
Dialysis catheters (III)
Guide wires (III)
Compression socks (I)
Abbott Vascular
St. Jude Medical
Covidien
Moog
Synergy Health
Volcano Corp.
FIRMS IN COSTA RICA MEDICAL DEVICES SECTOR
17

© 2013 Duke CGGC
2010
Initial plant reopens after restructuring
• 2004: Manufacturing functions
• 2012: Engineering for process improvements Focused on cardiology segment; strategy – to alleviate R&D costs in the US.
Functional Upgrading
• Biopsy forceps Labor intensive, basic metal works & extrusion.
• Urethral stent Thermoforming, laser marking, coating capabilities.
• Guide Wires Sophisticated Laser cutting & welding.
• Today – CR facilities cover 42 manufacturing processes.
Product & Process Upgrading
• Gastroenterology segment Urology CardiovascularMarket Diversification
• Recent co-location of sterilization vendors will allow the firm to export directly to global distribution centers
Forward Linkages
UPGRADING SUCCESS: A LEADING MEDICAL DEVICES MNC
IN COSTA RICA
2004
First production plant opens in Costa Rica
(10,000m2)
2008
Second plant opens.(32,000m2)
First plant restructuring
2005 2011
Exports:
US$18 million
Exports:
US$120 million
18
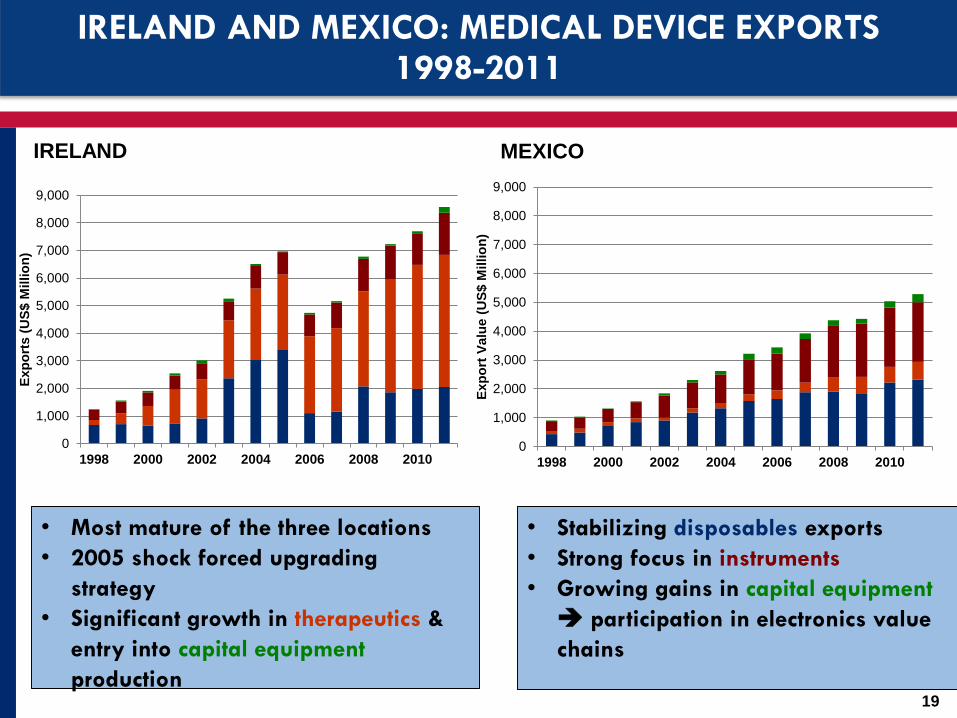
IRELAND AND MEXICO: MEDICAL DEVICE EXPORTS1998-2011
0
1,000
2,000
3,000
4,000
5,000
6,000
7,000
8,000
9,000
1998 2000 2002 2004 2006 2008 2010
Exp
ort
s (
US
$ M
illio
n)
IRELAND
0
1,000
2,000
3,000
4,000
5,000
6,000
7,000
8,000
9,000
1998 2000 2002 2004 2006 2008 2010
Exp
ort
Valu
e (
US
$ M
illio
n)
MEXICO
• Most mature of the three locations
• 2005 shock forced upgrading
strategy
• Significant growth in therapeutics &
entry into capital equipment
production
• Stabilizing disposables exports
• Strong focus in instruments
• Growing gains in capital equipment
participation in electronics value
chains
19

OFFSHORE SERVICES GVC IN CHILE
20

OFFSHORE SERVICES IN CHILE
• Study for Chile’s Economic Development Agency (CORFO)
(http://www.cggc.duke.edu/pdfs/CGGC-
CORFO_Chiles_Offshore_Services_Value_Chain_March_1_2010.pdf)
• Four questions:
What does the offshore services GVC look like?
What is Chile’s position in the offshore services GVC?
What are viable upgrading niches for Chile in this GVC?
What workforce development strategy does Chile need
to follow to develop this niche (engineering services)?

OFFSHORE SERVICES:
GLOBAL SUPPLY AND DEMAND, 2008
Demand for Offshore Services (%)
51.1% US & Canada
30.6%
EU-15
16.2%
Asia-
Pacific
50
30 15
2.1% Rest of the World
Source: CGGC based on Everest & Datamonitor
45% of the industry
market
Same number of call
centers employees
than India

OFFSHORE SERVICES: A SIMPLIFIED VIEW OF UPGRADING
ITO – Information technology outsourcing
BPO – Business process outsourcing
KPO – Knowledge process outsourcing
Upgrading trajectory: ITO BPO KPO

OFFSHORE SERVICES GLOBAL VALUE CHAIN

MAPPING SELECTED COUNTRIES IN THE OFFSHORE SERVICES GVC

OFFSHORE SERVICES UPGRADING: INDIA, PHILIPPINES & CHILE

EAST AFRICA IN GLOBAL AND REGIONAL VALUE CHAINS
27

Africa’s Participation in GVCs in International Perspective
• Africa captures a small share (2.2%) of global GVC trade
• …but GVC trade is growing faster in Africa than in any other major region (80% growth 1995-2011)
• In spite of a low share of global GVC trade, participation is high compared to other regions
• …and participation is shifting from forward to backward integration in GVCs (i.e., more local value added)
• South Africa is playing a leading role in coordinating GVC exports from Africa

Integration of Global Regions into GVCs
Note: Forward integration is measured by the share of a country’s exported value added that is
further exported by the importing country. Backward integration is measured by the share of
foreign value added embedded in a country’s exports.
Source: AfDB/OECD/UNDP (2014) African Economic Outlook, based on UNCTAD EORA database

East Africa in GVCs
• East Africa is relatively less integrated in global-scale GVCs than other regions of Africa
• EAC and COMESA agreements are enabling greater vertical specialization in value chain niches, promoting efficiencies– Intra-African and intra-regional value added is more
prevalent than in East Africa than other African sub-regions, indicating high participation in RVCs
• GVC participation in East Africa is driven by primary sectors, rather than manufacturing and services

Integration of African Regions into GVCs
Note: Forward integration is measured by the share of a country’s exported value added that is
further exported by the importing country. Backward integration is measured by the share of
foreign value added embedded in a country’s exports.
Source: AfDB/OECD/UNDP (2014) African Economic Outlook, based on UNCTAD EORA database

THE WHEAT AND MAIZE GVCS:
CONSTRAINTS AND OPPORTUNITIES IN RUSSIA
AND UKRAINE VERSUS EAST AFRICA
32
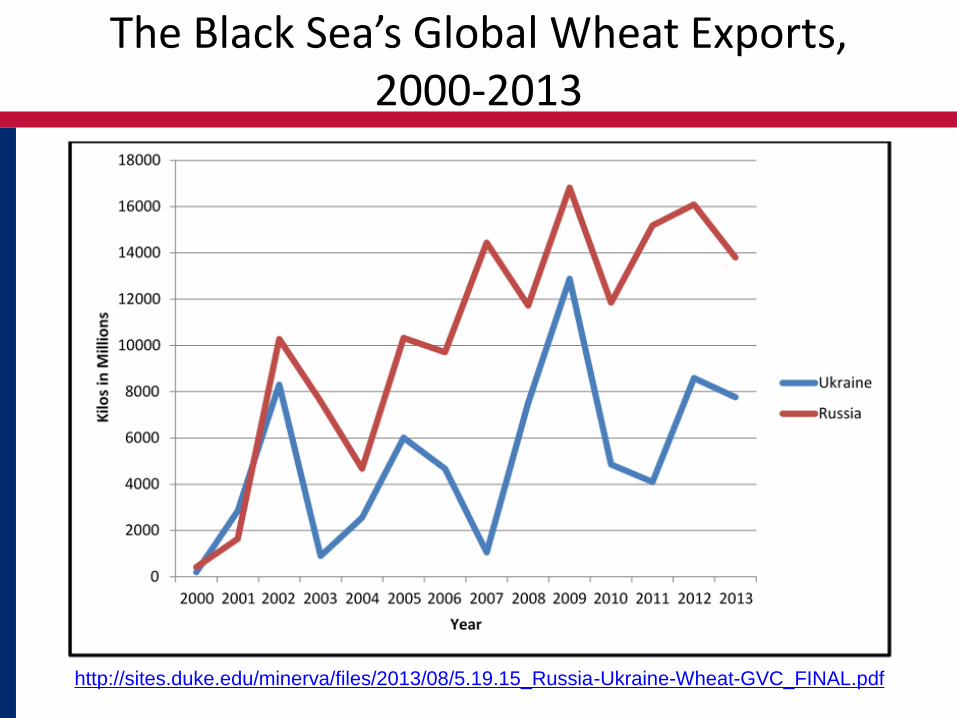
The Black Sea’s Global Wheat Exports, 2000-2013
http://sites.duke.edu/minerva/files/2013/08/5.19.15_Russia-Ukraine-Wheat-GVC_FINAL.pdf
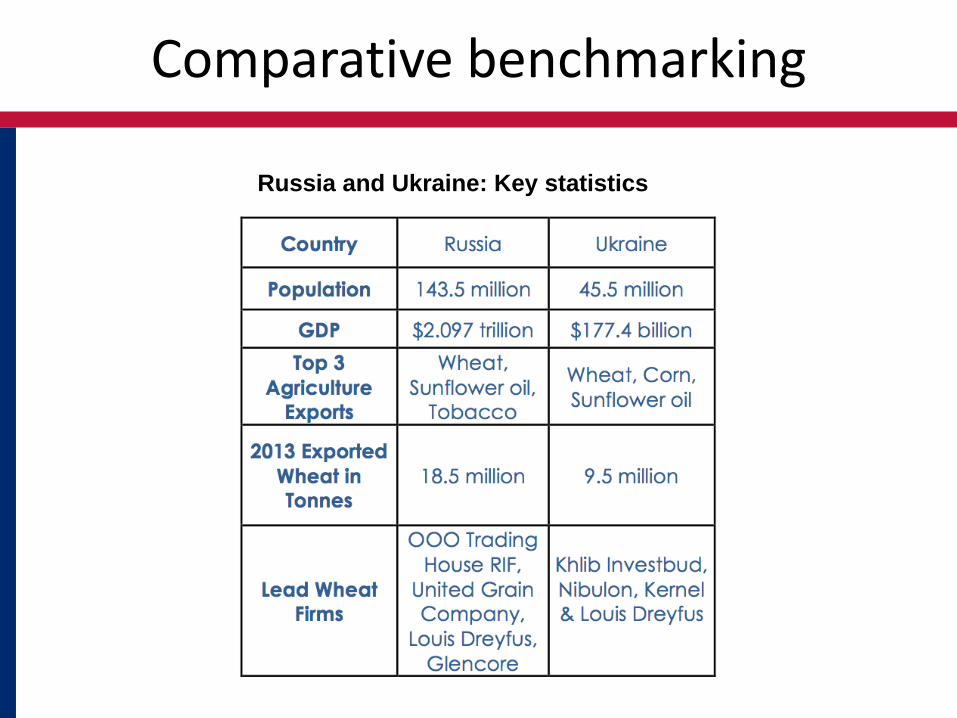
Comparative benchmarking
Russia and Ukraine: Key statistics

Comparative benchmarking: export markets
Russia’s top 4 export markets: 2000-2013
Ukraine’s top 4 export markets: 2000-2013

Identifying Disruption Points in the GVC

The Maize Value Chain in East Africa
Smallholders
Commercial
farms
Small traders
Breweries
Retail and food
service
Poultry
production
Food
manufacturers
Production Processing Marketing
Mills
Flour
Bran
Grits
Aggregation
Collection
centers
Large traders
NGOs
Local storage
Cleaning,
drying, grading
Primary processing
and warehousing
Inputs
R&D
Seeds
Land
Water
Fertilizer
Pesticide
Machines
Labor
Some key issues
• Informal domestic and regional trade.
• Storage as a bottleneck: undermines quality and generates waste.
• Access to high-quality inputs.
• Role of the state in sector coordination and enforcement of standards.

THE TOURISM VALUE CHAIN:
VALUE ADDITION THROUGH LOCAL LINKAGES
38
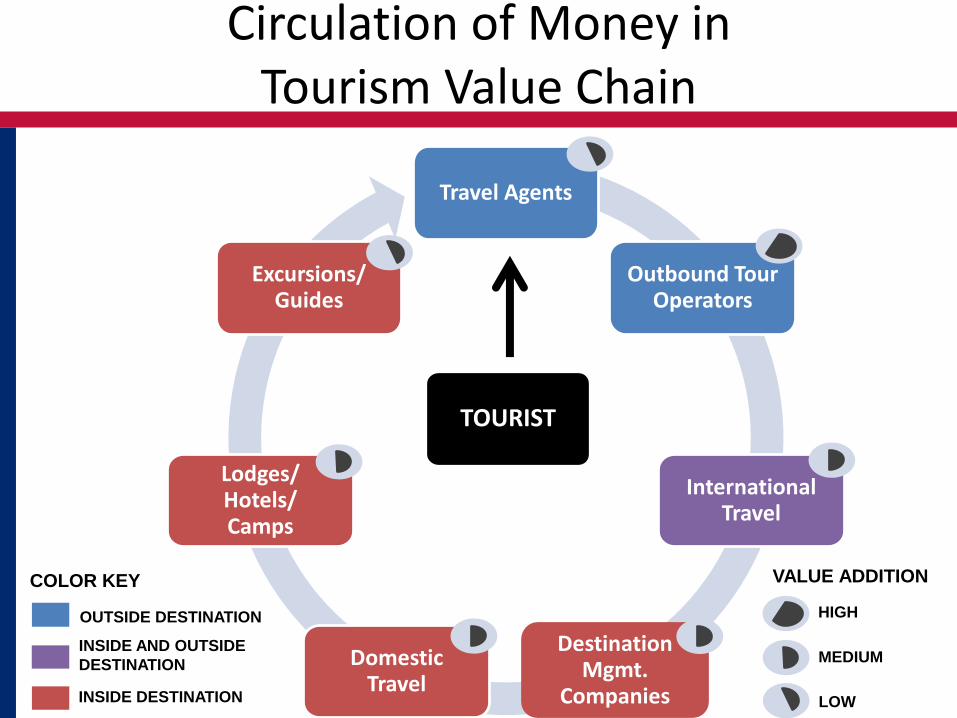
Circulation of Money in Tourism Value Chain
Travel Agents
Outbound Tour Operators
International Travel
Destination Mgmt.
Companies
Domestic Travel
Lodges/Hotels/Camps
Excursions/Guides
COLOR KEY
OUTSIDE DESTINATION
INSIDE AND OUTSIDE
DESTINATION
INSIDE DESTINATION
VALUE ADDITION
HIGH
MEDIUM
LOW
TOURIST
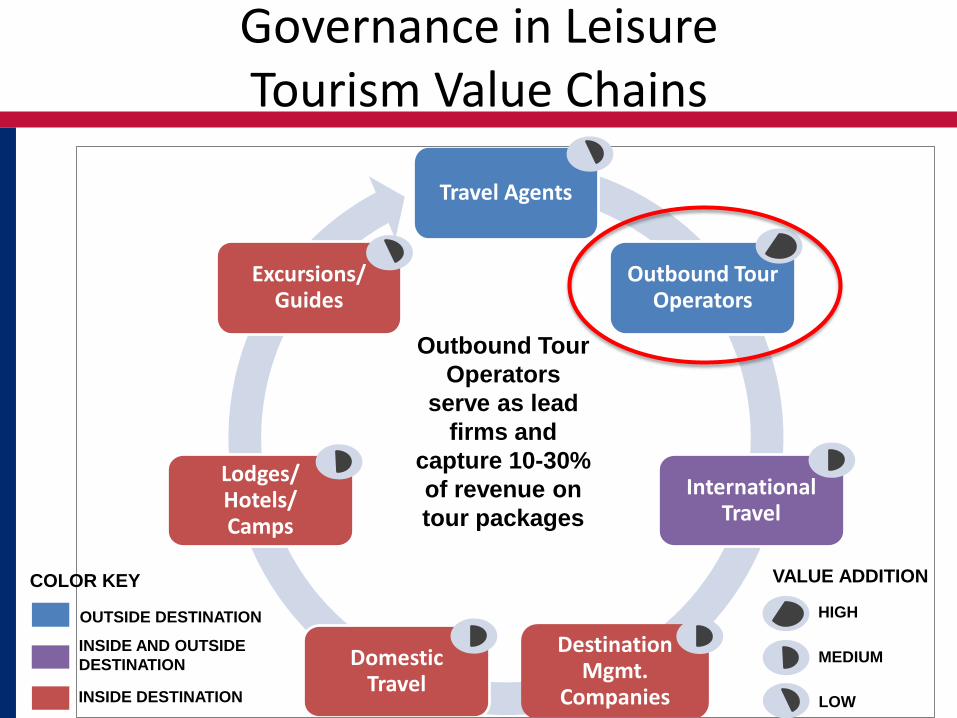
Governance in Leisure Tourism Value Chains
Travel Agents
Outbound Tour Operators
International Travel
Destination Mgmt.
Companies
Domestic Travel
Lodges/Hotels/Camps
Excursions/Guides
COLOR KEY
OUTSIDE DESTINATION
INSIDE AND OUTSIDE
DESTINATION
INSIDE DESTINATION
VALUE ADDITION
HIGH
MEDIUM
LOW
Outbound Tour
Operators
serve as lead
firms and
capture 10-30%
of revenue on
tour packages

Governance in Leisure Tourism Value Chains
Travel Agents
Outbound Tour Operators
International Travel
Destination Mgmt.
Companies
Domestic Travel
Lodges/Hotels/Camps
Excursions/Guides
COLOR KEY
OUTSIDE DESTINATION
INSIDE AND OUTSIDE
DESTINATION
INSIDE DESTINATION
VALUE ADDITION
HIGH
MEDIUM
LOW
Outbound tour
operators
develop strong
links with DMCs
and are
reluctant to
change

Local Linkages in Leisure Tourism Value Chains
Travel Agents
Outbound Tour Operators
International Travel
Destination Mgmt.
Companies
Domestic Travel
Lodges/Hotels/Camps
Excursions/Guides
COLOR KEY
OUTSIDE DESTINATION
INSIDE AND OUTSIDE
DESTINATION
INSIDE DESTINATION
VALUE ADDITION
HIGH
MEDIUM
LOW
DMCs
coordinate
downstream
actors
located
inside
country

Functional Upgrading in Regional Tourism Value Chains
Travel Agents
Outbound Tour Operators
International Travel
Destination Mgmt.
Companies
Domestic Travel
Lodges/Hotels/Camps
Excursions/Guides
COLOR KEY
OUTSIDE DESTINATION
INSIDE AND OUTSIDE
DESTINATION
INSIDE DESTINATION
VALUE ADDITION
HIGH
MEDIUM
LOW
Great Lakes
Safaris (S. Africa)
upgrades from
being tour
operator to owning
vehicles to
becoming DMC …

One Pathway to Regional Tourism Value Chains
Travel Agents
Outbound Tour Operators
International Travel
Destination Mgmt.
Companies
Domestic Travel
Lodges/Hotels/Camps
Excursions/Guides
COLOR KEY
OUTSIDE DESTINATION
INSIDE AND OUTSIDE
DESTINATION
INSIDE DESTINATION
VALUE ADDITION
HIGH
MEDIUM
LOW
Great Lakes
Safaris upgrades
from being tour
operator to owning
vehicles to
becoming DMC to
building lodges
and camps
In Rwanda

Policy Issues for East African Value Chains
1. Role of the state– Infrastructure, trade & FDI policy, regulation
2. Type of FDI– Ownership and up/downstream linkages
3. Public-private collaboration– Identifying strategic focus areas in the value chain
4. International benchmarking– National and regional comparisons
5. Regional value chains– Spillovers, division of labor, common challenges
