regional workforce study - srscro.org · srs community reuse organization regional workforce study...
TRANSCRIPT

THEORY INTO PRACTICE PAG
REGIONAL WORKFORCE STUDY PREPARED FOR THE SRS COMMUNITY REUSE ORGANIZATION
APRIL 2015
AIKEN ● ALLENDALE ● BARNWELL ● COLUMBIA ● RICHMOND

CONTENTS
Introduction ................................................................................................................................................. 1
Approach ................................................................................................................................................ 1
Key Findings ............................................................................................................................................ 1
The Response ........................................................................................................................................... 4
Regional Workforce Strategy ......................................................................................................................... 6
1. Collect ............................................................................................................................................. 7
2. Convene ....................................................................................................................................... 10
3. Connect ......................................................................................................................................... 12
4. Inform ............................................................................................................................................ 14
5. Market ........................................................................................................................................... 16
Implementation .......................................................................................................................................... 18
Appendix A: Labor Market Profile ................................................................................................................ 21
Laborshed and Labor Mobility ................................................................................................................. 21
Labor Force Characteristics ...................................................................................................................... 26
Demand Factors ..................................................................................................................................... 29
Industry & Workforce Alignment .............................................................................................................. 37
Appendix B: Industry Profiles ....................................................................................................................... 40
Nuclear ........................................................................................................................................... 42
Manufacturing ................................................................................................................................. 56
CyberSecurity/IT .............................................................................................................................. 71
Medical .......................................................................................................................................... 82
Other Resources ..................................................................................................................................... 95
Appendix C: Data & Methodology ............................................................................................................... 97
Classification systems .............................................................................................................................. 97
PAGE | I

SRS COMMUNITY REUSE ORGANIZATION REGIONAL WORKFORCE STUDY
INTRODUCTION Over the next five years, the region is projected to have more than 37,000 job openings. Filling those openings will require the regional talent pipeline to be well aligned with high-demand jobs and will require the recruitment of key talent from outside the region. In an effort to position the region to do this, the Savannah River Site Community Reuse Organization (SRSCRO) assembled an internal task force to look at strategies the region could implement. The intent of the project was to support the region’s economic growth and competitiveness. It was also to provide valuable tools for regional educational institutions and economic developers to use in their work aligning industry and education, attracting talent, and recruiting businesses to the region.
APPROACH
The SRSCRO hired TIP Strategies, an economic and workforce development strategy consultancy, to assist in conducting a detailed labor study and developing a regional workforce strategy with deep dives into four of the region’s key economic drivers—nuclear, manufacturing, cybersecurity/IT, and healthcare.
Over the course of the last six months, we have visited with stakeholders in each of the five counties that compose the Community Reuse Organization (CRO) Region—Aiken, Allendale, Barnwell, Columbia, and Richmond. We have gathered input through one-on-one interviews, employer and educator roundtable discussions, and an employer survey. We have conducted a comprehensive analysis of the region’s labor force, factors driving demand, and an examination of the alignment between educational output and industry requirements. For each of the four industries, we have developed detailed profiles that include staffing patterns, regional labor supply, job posting analytics, relevant educational output, and regional resources.
KEY FINDINGS
The laborshed of the CRO Region includes the surrounding counties of Lexington, Edgefield, Burke, and McDuffie. These counties each contribute at least 1 percent of the individuals who work in the CRO Region. The entire nine-county laborshed has a civilian labor force of just over 400,000.
The labor force within the CRO Region is highly mobile with strong commuter connections across county boundaries. Though about 70 percent of residents work in the county in which they live, almost 50,000 residents work in a different county. The cities of Augusta, Aiken, Martinez, Evans, and North Augusta are the largest centers of employment in the region.
Workforce characteristics vary widely across the region with pronounced differences between the urban/suburban and rural counties. In the more urban and suburban counties, educational attainment is more in line with the national average, with Columbia and Lexington counties having the highest percentage of residents who have earned a bachelor’s degree or higher. The more rural counties, including Allendale, Barnwell, McDuffie, and Burke, have populations with much lower educational attainment—more than half of their residents over 25 have a high school degree or less. Labor force participation rates also follow a similar pattern with much higher participation rates in urban and suburban counties and lower participation rates in rural counties.
THEORY INTO PRACTICE PAGE | 1

SRS COMMUNITY REUSE ORGANIZATION REGIONAL WORKFORCE STUDY
FIGURE 1. LABORSHED AND COMMUTER INFLOW/OUTFLOW
The CRO Region is a net importer of labor, drawing in 1,687 m ore w ork ers in 2011 than it exported to
surrounding areas.
Source: US Bureau of Labor Statistics, Local Area Unemployment Statistics (state and county labor market data); US Census Bureau, Current Population Survey (national labor market data). Note: Overlay arrows are for illustrative purposes and do not indicate directionality of worker flow between home and employment locations.
51,032 124,544Live and workin CRO Region
49,345
Commute to jobs in CRO Region from outside
Live in CRO Region and commute to
jobs outside
Of the 175,576 workers that held jobs in the CRO Region in 2011, just over 51,000 (29 percent) lived outside the 5-county area.
Of the 173,889 CRO Region residents employed in 2011, almost 50,000 (28 percent)
commuted to jobs outside the 5-county region.
THEORY INTO PRACTICE PAGE | 2

SRS COMMUNITY REUSE ORGANIZATION REGIONAL WORKFORCE STUDY
The CRO Region is expected to average about 7,500 job openings annually between 2014 and 2019. These openings include both new jobs and replacement jobs. About 18 percent of these openings are in occupations considered to be high-skill, while one-third is in middle-skill occupations. The high- and middle-skill occupations with the most annual openings in the CRO Region are registered nurses, accountants, nursing assistants, teacher assistants, elementary school teachers, general and operations managers, civil engineers, supervisors, and maintenance and repair workers. Many critical occupations are shared across industries. In particular, there is a high degree of overlap between the nuclear and manufacturing industries. Information technology and cybersecurity also cut across the nuclear, healthcare, and manufacturing sectors. Many of the occupations that were reported hardest-to-fill are positions that have been facing a difficult staffing environment for many years.
Post-secondary education institutions in the nine-county laborshed produce just over 7,000 graduates on average. The most popular fields of study among graduates of the regional postsecondary institutions are registered nursing, liberal arts, business administration, medical prep programs, and auto mechanics technology.
The region’s K-12 institutions all have programs to support career clusters and do offer some vocational training. However, a regional inventory of programs does not exist. Therefore, it is difficult to draw conclusions about how well the programs are aligned with the region’s industry needs.
Employers rate the overall regional workforce as good or excellent. Respondents to the employer survey reported the regional workforce was particularly strong in terms of their teamwork skills, attitude, trainability,
FIGURE 2. OCCUPATIONAL GROWTH BY SKILL-LEVEL OPENINGS, 2014-19
Source: QCEW Employees, Non-QCEW Employees & Self-Employed - EMSI 2013.4 Class of Worker.
FIGURE 3. COMPLETIONS BY YEAR, INSTITUTION, AND AWARD LEVEL
Source: Natl. Center for Education Statistics, Integrated Postsecondary Education Data System (IPEDS). Note: IPEDS data include only schools eligible to participate in federal financial aid programs. Figures shown include first and second majors. *Associate’s-degree-level completions include awards categorized by IPEDS as "Award of at least two but less than four academic years." **Advanced-level completions represent all awards above the bachelor’s-degree level.
2,528
2,392
2,758
15,126
10,495
4,457
Low
Middle
High
New Replacement
25.3% 24.4% 24.4%
11.1% 9.5% 9.7%
28.4% 29.6% 28.7%
21.2% 22.3% 24.1%
14.1% 14.2% 13.1%
0%
25%
50%
75%
100%
2011(n=7,522)
2012(n=7,248)
2013(n=7,360)
Advanced**
Bachelor's
Associate's*
At least 1 but < 2years
Less than 1academic year
THEORY INTO PRACTICE PAGE | 3

SRS COMMUNITY REUSE ORGANIZATION REGIONAL WORKFORCE STUDY
productivity, and reliability. The regional workforce’s entry-level skills, computer skills, and math skills were rated the areas that most need improvement.
Some employers report that finding enough competent, reliable workers with adequate basic skills is difficult. Employers report that workers with strong soft skills and basic hard skills that can pass a background check and drug test are difficult to find. While this is a national issue, local approaches to address the challenge are needed. The WorkKeys assessment is available on both the Georgia and South Carolina sides and could be a valuable tool in improving the regional workforce’s basic skills and employability.
Additionally, the regional nuclear and manufacturing industries have difficulty attracting young people. A number of different programs in the region have been initiated to raise awareness of career opportunities in the nuclear and manufacturing sectors.
An aging workforce exacerbates the workforce challenges of regional employers. A number of key occupations are filled by a group of workers in which more than 25 percent are 55 years of age or older. Employers report that many of the workers that fill key occupations are already 65 years old and are currently eligible for retirement. These occupations include mechanical, electrical, and nuclear engineers as well as maintenance and repair workers, truck drivers, and technical occupations such as industrial machinery mechanics and hazardous materials removal workers. Many employers report that they are worried about the loss of this institutional knowledge and that they struggle to find solutions to prepare for the potential loss of this expertise.
Employers report that recruiting talent from other areas of the country is sometimes difficult. For some of the higher-skill positions, regional HR managers report difficulty attracting talent—in some cases young talent and in other cases talent from urban areas.
Education and training providers report that they need better information about employers’ needs to ensure their programs are well-aligned with the region’s key industry sectors. Education and training providers report that there are gaps in knowledge across the region regarding what employers require and what kind of programs are needed. Educational institutions must have validated data about job demand to create new programs, but a mechanism for collecting this data does not currently exist. In addition, maintaining connections with employers is difficult, given that the rotation of plant managers and other management positions commonly occurs every 2 or 3 years.
THE RESPONSE
Addressing these challenges will require a collaborative, regional effort. It will also require a great deal of coordination to ensure that information is shared and connections are made consistently across the region. The result of these efforts should yield a more demand-driven workforce system that is responsive to the needs of both existing and future employers in the region. The workforce strategy that follows lays out a common vision to guide the region’s collective efforts, it identifies the primary goal of the initiative, and it defines the roles and strategies that, if implemented, will propel the region forward towards this goal.
THEORY INTO PRACTICE PAGE | 4

SRS COMMUNITY REUSE ORGANIZATION REGIONAL WORKFORCE STUDY
THEORY INTO PRACTICE PAGE | 5
“More qualified workers with different and more technical skillsets are also critical to the future competitiveness of [advanced industry]. However, the skills prerequisites of modern advanced industries have been changing faster than the country’s ability to train the needed workers. Now that the economy is heating up and firms are beginning to expand again, both private- and public-sector actors—often in partnership—need to bear down on improving the availability of skilled workers by developing smart, industry-led, sector-specific, regional skills initiatives. Overall, firms need to get much more involved in developing the skills pipeline and the public sector must become much more responsive to their needs.”
–American’s Advanced Industries: What They Are, Where They Are, and Why They Matter Brookings Institution, February 2015
Image Credit: Electrician by Garry Knight via Flickr (CC BY 2.0)

SRS COMMUNITY REUSE ORGANIZATION REGIONAL WORKFORCE STUDY
REGIONAL WORKFORCE STRATEGY
The regional workforce strategy provides a playbook to help the region better align its education and training resources with employer needs and to strengthen its talent pipeline. This, in turn, will better position employers in the region to fill the more than 37,000 openings that are projected over the next five years.
VISION Establishing a common vision provides direction for the many stakeholders who participate in and contribute to the CRO Region’s workforce development system. For this reason, the regional strategy begins with a vision statement:
The CRO Region is an economically competitive region where existing and new business can flourish.
The vision statement’s focus on competitiveness implicitly recognizes that workforce is a critical element of economic success. It also recognizes that the region’s success depends on its ability to both support its existing businesses and continue to attract and support new businesses.
GOAL With this vision in mind, the primary goal of the regional workforce strategy becomes clear:
To create a more demand-driven workforce system that supports the recruitment, retention, and development of talent.
FRAMEWORK Over the course of the project, five distinct roles emerged as necessary components of the regional workforce strategy. These are:
1. COLLECT. Serve as the regional clearinghouse of information and resources to support the regional workforce system.
2. CONVENE. Be a regional convener around workforce topics.
3. CONNECT. Create networks that partners can leverage to build a more responsive workforce system.
4. INFORM. Coordinate activities to raise awareness of opportunities in the region and to change perceptions.
5. MARKET. Develop an external marketing campaign to assist regional employers in attracting talent.
THEORY INTO PRACTICE PAGE | 6

SRS COMMUNITY REUSE ORGANIZATION REGIONAL WORKFORCE STUDY
COLLECT. Serve as the regional clearinghouse of information and resources to support the regional workforce system.
1. Collect A workforce development system consists of many stakeholders—employers, education and training providers, and workers. One of the primary functions of a workforce intermediary is sharing information and resources that can enhance the decision-making of these stakeholders in the regional labor market.
Because the CRO Region stretches across state and county lines and across workforce development regions, it does not have a single clearinghouse of information. As a result, there are knowledge and information gaps that reduce the efficiency of the regional labor market.
Assembling and maintaining databases that will be the foundation of the clearinghouse will require the combined efforts of multiple partners with the assistance of a single coordinator to collect, aggregate, and normalize the data and information. The coordinator will be responsible for taking the following steps:
Create a template to collect the information with input from the relevant partners
Distribute the template
Gather the filled templates
Aggregate the information on the templates and scrub the data to improve the quality and consistency of the information
Analyze, summarize, and share the information
Conduct periodic updates and reach out to new partners to gather input
This will be an ongoing process as updates must be made regularly, and new information will be added periodically. However, it is not likely that the databases will ever be complete as it is not likely that 100 percent of the relevant partners will ever provide 100 percent of the needed information. That said, some information is better than no information, and starting small and growing the number of database participants over time will still provide value to the partners.
The databases, once assembled, must be made widely accessible and must be widely used to have an impact on the regional labor market. This is why creating a sustainable collection and distribution system in collaboration with partners is of the utmost importance. Having partner buy-in from the beginning greatly improves the likelihood of their participation in the collection process and use of the databases.
PRIORITY PROJECT
Database of education and training resources
1
THEORY INTO PRACTICE PAGE | 7

SRS COMMUNITY REUSE ORGANIZATION REGIONAL WORKFORCE STUDY
1.1. Develop and maintain an inventory of regional training and education resources, including state programs, K-12, postsecondary, workforce development, apprenticeship, and nonprofits. This database should include everything from career and technical education programs in regional high schools to registered apprenticeship programs to certificate programs offering nonprofit career training programs. Start with programs critical to the region’s key industries. The database template can include a brief program description, the type of program (industry certificate, postsecondary certificate, associate’s degree, etc.), enrollment and graduation, and what constrains the program growth—is it a lack of students, a lack of instructors, a lack of equipment, a lack of classroom space? (See case study page 9.)
1.2. Develop and maintain a catalog of work-based learning opportunities and employer volunteers that educators can tap into a mechanism for engaging students, counselors, and parents in hands-on industry experience. Work-based learning includes plant tours, career days, job shadowing, internships, and classroom projects or demonstrations that integrate industry principles or concepts. These experiences give students the opportunity to test-drive careers and workplaces. It is also a great way for employers to increase the relevancy of education programs to their businesses and generally improve industry-education alignment. The database template can include a description, type of experience, related academic subject(s), grade level that it is appropriate for, time commitment, times available, and contact name. (See case study page 9.)
1.3. Assemble and maintain a regional database of area employers to be a resource for education providers. Education and training providers need industry input to create and maintain relevant programs. Through industry advisory councils and relationships with employers, education providers can gain this input. However, education providers only reach the employers that they know, which likely leaves out many employers. Having a central database of employers that can be sorted by industry and that is regularly updated can greatly enhance the connections between industry and education. The database template should include employer name, industry, description of business, headcount range, and a primary contact. The partners should initially share their contacts to populate the database. As partners make new contacts or obtain updated information, they should share this information with the database coordinator. The coordinator should not be responsible for assembling and maintaining the employer data by contacting the employers themselves, but should manage the database with input of partners who are regularly in contact with employers.
1.4. Conduct a periodic survey of employers’ needs to aggregate results and report back to education and training providers. An employer survey provides a systematic way for employers to report workforce needs. The most effective surveys are those that focus on the most critical occupations to industries. Taking a more focused approach can increase employer participation, make the survey length more manageable, and improve the quality of the input received. The survey template should ask employers to estimate their hiring needs for these critical occupations, the skills they are seeking for each occupation, and education and training requirements.
THEORY INTO PRACTICE PAGE | 8

SRS COMMUNITY REUSE ORGANIZATION REGIONAL WORKFORCE STUDY
CASE STUDIES
TECH VALLEY CONNECTION FOR EDUCATION AND JOBS
The Tech Valley Connection for Education and Jobs was launched in 2009 by a partnership of the Center for Economic Growth (CEG) and GLOBALFOUNDRIES, a semiconductor foundry with a large manufacturing facility in Saratoga County, New York. The initiative aims to bring together the most innovative practices in a large-scale regional educational laboratory that covers 13 counties in eastern New York State. The laboratory model serves as a way to “connect the dots” between all the players in this arena: students, teachers, educational institutions, government agencies, and business and industry. One of the first projects of the initiative was to conduct a survey of over 100 school districts about their existing and desired programs and roadblocks to achieving them. Another project was to create an online connection point for educators, businesses, students, and parents. One of the features of the website is a database of “shovel-ready projects,” which are ready-to-implement projects at schools. The intention of this database is to provide businesses with information on how they could participate in projects that provide students with innovative, work-based learning experiences. The most recent project was the launch of a series of videos highlighting local companies that offer STEM careers in the region.
For more information, visit: www.techvalleyed.org
EXXONMOBIL COMMUNITY COLLEGE PETROCHEMICAL INITIATIVE
In 2013, ExxonMobil initiated a workforce training program to enable the Greater Houston Region’s nine community colleges to collaborate more closely in an effort to prepare local residents for jobs in the petrochemical sector. The initiative brought together the community colleges to identify occupations critical to the industry, inventory training resources available to support those occupations, document the skills and certifications required for the critical occupations, ascertain training gaps, and share expertise and curricula to fill the training gaps.
The Community College Petrochemical Initiative has evolved into EnergizeHouston in partnership with the Greater Houston Partnership’s Upskill Houston and with additional support from ExxonMobil. EnergizeHouston has expanded its collaboration to include school districts in the region as well as scholarships to support training in the key occupations. In addition, the initiative provides in-service training and curriculum development assistance for all instructors that support the critical occupations in the community colleges. In both spring and fall, they hold a Career and Technical Education Conference for school counselors, career and technical education directors, and teachers of career and technical education courses.
For more information, visit: www.gulfcoastcc.org/ccpi.php
THEORY INTO PRACTICE PAGE | 9

SRS COMMUNITY REUSE ORGANIZATION REGIONAL WORKFORCE STUDY
CONVENE. Be a regional convener around workforce topics.
2. Convene
Creating mechanisms for information sharing is the next step to enhancing the efficiency of the regional workforce system. We recommend a three-pronged approach:
An annual, region-wide summit
Periodic, sub-regional roundtable discussions
Issue-oriented task forces
Each of these approaches provides distinct touch points to gather information that can help identify trends. They also provide avenues for raising awareness of the region’s workforce challenges and educating stakeholders about what is being done to address these challenges. Finally, they provide opportunities for stakeholders to come together to network and cultivate relationships.
2.1. Organize an annual workforce summit. Workforce summits create opportunities to share best practices and lessons learned. They also provide opportunities for stakeholders to make connections with each other and exchange information. This type of forum enhances the dissemination of ideas and can play a pivotal role in increasing industry and education alignment. The summit should include presentations on best practices from inside and outside of the region and leave time for breakout sessions where participants can work on tackling challenges together. (See case study page 11.)
2.2. Host roundtables for educators and for employers to provide an ongoing forum for sharing information on resources and programs, employers’ needs and challenges, and best practices. These roundtables can be organized in partnership with the region’s economic development organizations or in sub-regional groups. They should feature pertinent topics such as succession planning to fill talent gaps left by retiring workers, workplace modifications and other strategies to improve employee retention, work-ready programs to support entry-level workers, and management training programs. The roundtables could be industry sector-based (healthcare, nuclear, or cyber) or talent cluster-based (skilled trades, information technology, or management). They could also target particular groups such as school counselors and career and technical education teachers.
2.3. For any widespread issues, assemble a task force to identify solutions and manage the implementation. Through the summit and roundtable discussions, region-wide challenges may be identified. Task forces organized around these challenges can provide a mechanism for resolving some of these issues. The task forces should be composed of key decision-makers from the organizations and employers that are critical to implementation. Having a project orientation and a finite existence can make it easier to recruit people to serve on the task forces.
PRIORITY PROJECT
Workforce Summit
2
THEORY INTO PRACTICE PAGE | 10

SRS COMMUNITY REUSE ORGANIZATION REGIONAL WORKFORCE STUDY
CASE STUDIES
TOPSKILLS: WORKFORCE SUMMIT FOR OUR REGIONAL ECONOMY
The North Louisiana Economic Partnership (NLEP) covers the 14-parish region that encompasses Shreveport, Monroe, and Natchitoches. The region has a diverse economy anchored by 12 higher education institutions, a historically strong manufacturing sector, and a burgeoning technology sector. Like many regions of the US, North Louisiana’s employers face challenges finding talent with the skills they need. The “skills gap” in North Louisiana is further complicated by explosive growth along the Gulf Coast (which attracted talent out of the region) coupled with high profile relocations and expansions with large workforce needs. These projects included the Benteler International Steel Mill, the CSC Technology Center, and Century Link’s Technology Center of Excellence.
In an effort to build awareness of the region’s key workforce challenges and provide a forum for information exchange, the NLEP organized and held TOPskills: a Workforce Summit for our Regional Economy. The format of the summit took a sector-based approach, bringing together industry leaders from the healthcare, technology, manufacturing, and construction sectors. In addition, the summit shared information on industry-education partnerships, career exploration tools, and WorkKeys. The Louisiana Superintendent of Education served as the keynote speaker to discuss the Department of Education’s career-ready initiative called JumpStart.
For more information, visit: nlep.org
THEORY INTO PRACTICE PAGE | 11
SRS COMMUNITY REUSE ORGANIZATION REGIONAL WORKFORCE STUDY
CONNECT. Create networks that partners can leverage to build a more responsive workforce system.
3. Connect While the annual summit and the periodic roundtables will provide opportunities for stakeholders to network, having a central point of contact that can serve as a regional connector between employers, education and training providers, and the regional labor force will provide ongoing, systemic support.
An effective connector must have access to networks. Strategy 1 makes recommendations for building these networks. This strategy is about using those networks to facilitate communication across them and to help stakeholders find what they need from each other’s networks. In some ways, this is about being a concierge—listening to stakeholders’ needs one at a time and making recommendations using the information clearinghouse and knowledge of the networks.
3.1. Serve as the liaison between employer and education providers to communicate needs and foster greater collaboration. Both employers and education providers have limited time to devote to forging relationships with each other. Yet, these employer-education relationships are essential to a demand-driven workforce system. Creating mechanisms for communication between many employers and many education providers simultaneously can hasten the exchange of needed information. This can be done through the summit and roundtables. Once the information is collected, the connector can distribute the pertinent findings to all relevant parties—not just the parties who attended. In addition, the connector can introduce stakeholders with complementary needs and resources.
3.2. Encourage employers to engage with educational institutions and training providers to create opportunities for work-based learning and for potential employees to be exposed to work environments. Exposure to work environments through plant tours, job shadowing, career days, internships, and apprenticeships can help students and prospective employees gain a better understanding of the industry and develop skills to enhance their career readiness. In addition, work-based learning opportunities can also help pique student interest in STEM careers or in a particular industry while enhancing the relevancy of the subject the students are learning. Both of these types of activities can provide employers with opportunities to develop relationships with students and prospective employees. The role of the connector is to encourage employers to work with educational institutions in defining and organizing these types of activities.
3.3. Assist employers in connecting with prospective employees using the inventory of training resources and programs. Often employers know only of a fraction of the programs that exist to train students and incumbent workers. And many students and incumbent workers know of only a few employers and training programs. Yet, the region has many internship, apprenticeship, and scholarship programs that provide great opportunities for workers to upskill and improve their employment opportunities. Helping employers find the programs that suit their needs will help them strengthen their regional pipeline of talent.
PRIORITY PROJECTS
Employer engagement in career exploration activities
Network of alumni networks
3
THEORY INTO PRACTICE PAGE | 12

SRS COMMUNITY REUSE ORGANIZATION REGIONAL WORKFORCE STUDY
3.4. Forge relationships with alumni groups from regional high schools and higher education institutions to reach alumni currently living outside the region. Employers noted that recruiting people to the region who already had a connection with the area was much easier. It is not uncommon for a resident of the CRO Region to graduate from high school or college, move to a larger metropolitan area for a few years, and then move back home. These “boomerangers” can be a great source of talent for regional employers, but they are currently difficult to identify. Working with alumni groups from high schools and colleges in the area can help create a network of people with connections to the region, some of whom may be looking for the right opportunity to return to the region. (See case study page 13.)
3.5. Provide access to a network of employers to help find employment for trailing spouses. Workers that employers recruit from outside of the region and many of the soldiers at Fort Gordon have spouses that are seeking employment in the region. Creating a database of these “trailing spouses” and helping them find employment through the network of regional employers can strengthen the region’s ability to both attract and retain talent.
CASE STUDIES
BATON ROUGE AREA CHAMBER OF COMMERCE – TALENT DEVELOPMENT
The Baton Rouge Area Chamber of Commerce (BRAC) launched its Talent Development Program in 2011 as part of its five-year strategic plan. The program focuses on talent retention and talent attraction. The program consists of a talent database, regional relocation resources (R3), and the Baton Rouge Area Intern Network (BRAIN). The talent database is a catalog of resumes of professionals who are seeking to further their careers in the Baton Rouge Area. To populate the database, BRAC works closely with the alumni associations from the region’s universities and high schools, including Louisiana State University, Southern University, the University Laboratory School, Baton Rouge High School, Episcopal High School, and McKinley High School. R3 assists area employers with their talent attraction efforts by connecting them with out-of-market candidates, creating tailor-made regional awareness presentations to aid in talent recruitment, leading tours of the region for recruits, and making out-of-market recruitment trips. BRAIN works to increase the number of internships available to students in the area by providing resources to support the employers that create them and the students that are seeking them. An internship job board is one of the resources provided. In addition, BRAC recently launched www.livecapitalized.com, which is designed to be a resource for newcomers to connect and grow roots in the community.
For more information, visit: www.brac.org/ecocomp/talentdev.asp
THEORY INTO PRACTICE PAGE | 13

SRS COMMUNITY REUSE ORGANIZATION REGIONAL WORKFORCE STUDY
INFORM. Coordinate activities to raise awareness of opportunities in the region and to change perceptions.
4. Inform One of the most significant barriers that employers in the manufacturing and nuclear industries face is that students are often not choosing careers that support those industries. The reasons for this are many—they hold a negative perception of work in those sectors, their parents encourage them to pursue a different career, they are not aware of the career opportunities available to them in those sectors, they are encouraged to pursue a four-year degree. For these sectors to continue to flourish in the CRO Region, more local students need to choose careers in manufacturing and nuclear. This will take a multi-faceted outreach campaign that involves hands-on activities and even a regional media campaign.
Another challenge employers in the region face is a lack of basic skills. Employers reported that many entry-level workers lack soft skills necessary for a successful career. There are many that cannot pass a drug test or a criminal background check. Others lack basic math and reading skills. Informing students and those who are advising students (parents and career counselors) about what skills and attributes are essential to career success can potentially help students make better choices and find value in learning basic skills.
4.1. Expand STEM Career Connections to reach more students and raise awareness of STEM career opportunities in the region. The Nuclear Workforce Initiative has done a great job organizing multiple events to build awareness of the opportunities in the nuclear industry during National Nuclear Science Week. One of the activities—STEM Career Connections—was expanded to include some manufacturers as well as the nuclear employers. Continuing the expansion to cover all STEM careers, not just those in the nuclear and manufacturing industries, would help the region strengthen its pipeline of STEM talent.
4.2. Plan a regional Manufacturing Day event to raise awareness of all that is made in the CRO Region and to inspire the next generation of manufacturers. The National Association of Manufacturers, the Manufacturing Institute, and its partners organize an annual event to address common misperceptions of manufacturing by giving manufacturers an opportunity to open their doors and show what 21st century manufacturing is. Manufacturing Day will be held on October 2, 2015 (www.mfgday.com). Planning guides and tool kits are available as resources to support the organization of successful events. The CRO Region would benefit from having a coordinate effort to showcase how important the sector is in the region.
4.3. Partner with local media to feature profiles–“Made Here”–that could help change the negative perception that manufacturing and nuclear employers face. Local media outlets could showcase and celebrate what is made in the CRO Region. This would help build residents’ awareness of which employers are in the region and what their work environments are like. The “Made Here” series could be print-based or video-based and could be incorporated into education curricula in the region as well.
PRIORITY PROJECTS
Expand STEM Career Connections Manufacturing Day
4
THEORY INTO PRACTICE PAGE | 14

SRS COMMUNITY REUSE ORGANIZATION REGIONAL WORKFORCE STUDY
4.4. Create a teachers/professors in industry program to improve the delivery of STEM education. Exposing teachers and professors to industry can help them better contextualize their lessons and content, making their curriculum delivery more relevant to both industry and students. This type of program is another way to improve industry-education alignment in the region. (See case study on page 15.)
4.5. Organize summer opportunities for students to gain soft skills and work experience in a camp-type format. Summer camps can be valuable tools to expose both students and teachers to various work environments and to promote STEM education through hands-on, project-based learning. The National Integrated Cyber Education Research Center has developed a camp to foster interest in cyber education. (See case study on page 15.) The Cyber Discovery Model could help the CRO Region support the nascent cybersecurity sector by raising awareness of what the sector is and what skills are needed for a cyber career.
CASE STUDIES
TEACHERS IN INDUSTRY INTERNSHIP
Created through a partnership with North Dakota State University, South East Educational Cooperative, and Greater Fargo Moorhead Economic Development Corporation, the Teachers in Industry program places K-12 teachers in a corporate work environment for a four week internship. The internship gives classroom teachers the opportunity to further develop their understanding and appreciation of the engineering design process through practical work experience. Participation in this course strengthens the teacher’s ability to make curriculum content more relevant and applicable when returning to the classroom. The teacher will then deliver content in a more meaningful approach that aligns with the goals of engineering and STEM education as well as state and national standards. Each teacher receives a $2,000 stipend, which is funded by the sponsoring company, the South East Education Cooperative and the ESTEEM Institute. Teachers in the program have been placed at Microsoft, Sanford Health, John Deere Electronic Solutions, Bobcat Company, Ulteig, and Moore Engineering.
For more information, visit: www.gfmedc.com/teachers-connect-industry-four-week-internship
NATIONAL INTEGRATED CYBER EDUCATION RESEARCH CENTER – CYBER DISCOVERY
Part of the Louisiana-based Cyber Innovation Center’s mission is to develop a sustainable knowledge-based workforce. To further that mission, the CIC has created the National Integrated Cyber Education Research Center (NICERC).
NICERC has created a professional development program called the Cyber Discovery Model that engages and empowers teachers around cyber and other topics pertaining to science, technology, engineering, and mathematics (STEM). The culmination of the program is a one-week camp in which the participating teachers lead a team of their students in various challenges that involve analysis and investigation. The result of the camp is a heightening of participants’ enthusiasm about cyber and STEM fields. The participants then take this enthusiasm and knowledge back to their home campus where it spreads. The Cyber Discovery Model has been so successful that it was awarded a grant from the Department of Homeland Security to be rolled out as a national model.
For more information, visit: www.nicerc.org
THEORY INTO PRACTICE PAGE | 15

SRS COMMUNITY REUSE ORGANIZATION REGIONAL WORKFORCE STUDY
MARKET. Develop an external marketing campaign to assist regional employers in attracting talent.
5. Market Employers depend on recruitment from outside of the region to fill many of their management, professional, engineering, and cyber positions. This is necessary to avoid widespread poaching among employers.
The need to recruit from outside labor markets means that most of the regional employers are involved in marketing the region in some way. Providing them with a tool kit and encouraging collaboration among employers around co-marketing opportunities can improve the effectiveness of the external campaign.
5.1. Create and distribute talking points and marketing collateral to regional HR professionals to use for recruiting purposes. The collateral should highlight regional assets, including recreational, cultural, entertainment, and housing. This will provide regional HR professionals with a common base of knowledge and a valuable set of tools to sell the region to prospective employees. (See case study on page 17.)
5.2. Create a campaign that communicates the region’s job opportunities and highlights its assets/advantages to alumni. As mentioned in Strategy 3.4, regional alumni can be viewed as a group of prospective recruits. Regular communication with this group through a newsletter and through social media can help strengthen alumni connections to the region and help employers identify prospective recruits from this talent pool. This kind of campaign would most likely be implemented in partnership with the regional alumni groups as sharing contact information of alumni could raise privacy concerns.
5.3. Organize a group of digital ambassadors that promote the region as a great place for career opportunities and a great place to live. Digital media provides outlets for hundreds of influencers to affect the perceptions that followers hold of the CRO Region. Connecting with these influencers through a digital ambassadors program provides a mechanism for pushing out information to target audiences within and outside of the region. (See case study page 17.)
5.4. Organize groups of regional employers to jointly attend select career fairs and other recruitment events at targeted higher education institutions. Joint marketing at career fairs can provide prospective employees with better knowledge of the range of career opportunities that exist in the region. This kind of collaboration can also reduce employers’ recruitment costs. Including a representative that can sell the region and its assets can also be a great value-add to the collaboration.
PRIORITY PROJECTS
Shared marketing collateral Digital ambassadors program
5
THEORY INTO PRACTICE PAGE | 16

SRS COMMUNITY REUSE ORGANIZATION REGIONAL WORKFORCE STUDY
CASE STUDIES
WORKIT NASHVILLE
To address a shortage of information technology workers in the region, the Nashville Area Chamber of Commerce launched WorkIT Nashville, a recruiting campaign designed to attract technology workers from cities across the country. An important goal of the campaign is creating a more thorough, consistent marketing message that area companies can use to attract out-of-town workers. A 40-page “guidebook” to Nashville has been prepared, outlining key economic indicators, profiling various neighborhoods, and highlighting the city’s emerging tech scene. WorkIT Nashville also created a job-matching website and a digital media marketing strategy. The campaign emphasizes Nashville’s below-average cost of living and touts the city’s well-known entertainment and cultural offerings. To provide the longer-term solution of growing talent within the Nashville area, a further initiative, the “Five Pillars” program, was developed to add tech-related curriculum in area middle and high schools and to create internships for local college students.
For more information, visit: www.talent.workitnashville.com
DIGITAL AMBASSADORS
The Northwest Arkansas Council created the Digital Ambassadors initiative as a way to improve the region’s image and to disseminate information about the region in a cost-effective way. The program currently boasts more than 400 individual Digital Ambassadors. Each Digital Ambassador receives emails with new, exciting content to share on Facebook, Twitter, Instagram, and LinkedIn. The content includes information about regional job growth, quality of life amenities, educational achievements, the local economy, and other ways the metro area stands out. Digital Ambassadors are encouraged to share the content so that they can have a positive impact on how the outside world views Northwest Arkansas. The ambassadors earn points based on how often they’re active and how they share their messages, and top participants are eligible to win monthly prizes. The program is a good avenue for enhancing the internal image of Northwest Arkansas. It also helps local residents and businesspeople become more aware of the positive aspects of living and working in Northwest Arkansas.
For more information, visit: www.nwacouncil.org/pages/digital-ambassadors
THEORY INTO PRACTICE PAGE | 17

SRS COMMUNITY REUSE ORGANIZATION REGIONAL WORKFORCE STUDY
IMPLEMENTATION
While the SRSCRO and their task force led the planning efforts that resulted in the strategy outlined here, the implementation of these strategies requires region-wide involvement. Education, industry, workforce development, and economic development partners must come together to collaborate and move these strategic initiatives forward. Below, we have made recommendations of which group of partners could take the lead on implementing each strategy. We have also suggested a time frame for initiating the projects. The SRSCRO will lead this effort by evaluating their role and responsibilities over the next several months. A plan of action will be developed with the hopes that other partners will roll up their sleeves and help get these regional strategies moving forward.
FIGURE 4. IMPLEMENTATION MATRIX
LEAD
PARTNER
TIMEFRAME Year
1 Year
2 Year
3 Year
4 Year
5 On-
Going 1.0 COLLECT: Serve as a regional clearinghouse of information and resources to support the
regional workforce system. 1.1. Develop and maintain an inventory of
regional training and education resources, including state programs, K-12, post-secondary, workforce development, apprenticeship, and non-profits.
SRSCRO
1.2. Develop and maintain a catalog of
work-based learning opportunities and employer volunteers that educators can tap into as mechanisms for engaging students, counselors, and parents in hands-on industry experience.
Education Partners
1.3. Assemble and maintain a regional
database of area employers to be a resource for education providers.
Economic Development
Partners
1.4. Conduct a periodic survey of employers’ needs to aggregate results and report back to education and training providers.
SRSCRO
2.0 CONVENE: Be a regional convener around workforce topics.
2.1. Organize an annual workforce summit. SRSCRO 2.2. Host roundtables for educators and for
employers to provide an ongoing forum for sharing information on resources and programs, employers’ needs and challenges, and best practices.
Education Partners
2.3. For any widespread issues, assemble a task force to identify solutions and manage the implementation.
SRSCRO + Partners
THEORY INTO PRACTICE PAGE | 18

SRS COMMUNITY REUSE ORGANIZATION REGIONAL WORKFORCE STUDY
FIGURE 4. IMPLEMENTATION MATRIX (continued)
LEAD
PARTNER
TIMEFRAME Year
1 Year
2 Year
3 Year
4 Year
5 On-
Going 3.0 CONNECT: Create networks that partners can leverage to build a more responsive
workforce system. 3.1. Serve as the liaison between employer
and education providers to communicate needs and foster greater collaboration.
SRSCRO + Partners
3.2. Encourage employers to engage with educational institutions and training providers to create opportunities for work-based learning and for potential employees to be exposed to work environments.
SRSCRO + Partners
3.3. Assist employers in connecting with
prospective employees using the inventory of training resources and programs.
Economic Development
Partners
3.4. Forge relationships with alumni groups from regional high schools and higher-education institutions to reach alumni currently living outside the region.
SRSCRO
3.5. Provide access to a network of employers to help find employment for trailing spouses.
Economic Development
Partners
4.0 INFORM: Coordinate activities to raise awareness of opportunities in the region and to
change perceptions. 4.1. Expand STEM Career Connections to
reach more students and raise awareness of STEM career opportunities in the region.
SRSCRO
4.2. Plan a regional Manufacturing Day event to raise awareness of all that is made in the SRSCRO Region and to inspire the next generation of manufacturers.
SRSCRO
4.3. Partner with local media to feature
profiles–Made Here–that could help change the negative perception that manufacturing and nuclear employers face.
Economic Development
Partners
4.4. Create a teachers/professors in
industry program to improve the delivery of STEM education.
Education Partners
4.5. Organize summer opportunities for students to gain soft skills and work experience in a camp-type format.
Education Partners
THEORY INTO PRACTICE PAGE | 19

SRS COMMUNITY REUSE ORGANIZATION REGIONAL WORKFORCE STUDY
FIGURE 4. IMPLEMENTATION MATRIX (continued)
LEAD
PARTNER
TIMEFRAME Year
1 Year
2 Year
3 Year
4 Year
5 On-
Going 5.0 MARKET: Develop an external marketing campaign to assist regional employers in
attracting talent. 5.1. Create and distribute talking points and
marketing collateral to regional HR professionals to use for recruiting purposes.
SRSCRO + Partners
5.2. Create a campaign that communicates
the region’s job opportunities and highlights its assets/advantages to alumni.
Economic Development
Partners
5.3. Organize a group of digital
ambassadors that promote the region as a great place for career opportunities and a great place to live.
SRSCRO + Partners
5.4. Organize groups of regional employers to jointly attend select career fairs and other recruitment events at targeted higher education institutions.
Economic Development
Partners
THEORY INTO PRACTICE PAGE | 20

SRS COMMUNITY REUSE ORGANIZATION REGIONAL WORKFORCE STUDY
APPENDIX A: LABOR MARKET PROFILE
This section will provide an overview of the local labor market, with comparisons to the states of Georgia and South Carolina and to the US. Topics addressed in this section include commuting patterns, migration flows, labor force statistics, population trends, educational attainment, age distribution, and factors driving the demand for labor. The quantitative analysis is supplemented by findings from a survey of employers in the region, as well as input from roundtable discussions and interviews with regional stakeholders knowledgeable about the local workforce. Additional details regarding the employer survey are presented in Appendix B: Industry Profiles.
LABORSHED AND LABOR MOBILITY
The CRO Region includes five counties—Aiken, Allendale, Barnwell, Columbia, and Richmond counties. Workers commute across county lines within the region, but the region also draws in thousands of workers from surrounding counties.
To define the true laborshed of the five-county region, commuting patterns data were compiled from the US Census Bureau’s Local Employment Dynamics (LED) program. This state-federal partnership combines data from state administrative records with federal data products, such as censuses and surveys, to provide a comprehensive picture of the labor force.
A look at commuting flows (Figure 5) reveals that about 70 percent of the jobs in the CRO Region were filled by local residents in 2011, the most recent year for which data were available at the time of analysis. In addition, the area “imports” more workers than it “exports” with 51,032 people commuting to work from communities outside the region, compared with roughly 49,345 residents of the region commuting to jobs outside the five counties.
FIGURE 5. FLOW OF WORKERS TO/FROM CRO REGION
The CRO Region is a net importer of labor, drawing in 1,687 m ore
w ork ers in 2011 than it exported to surrounding areas.
Source: US Bureau of Labor Statistics, Local Area Unemployment Statistics (state and county labor market data); US Census Bureau, Current Population Survey (national labor market data). Note: Overlay arrows are for illustrative purposes and do not indicate directionality of worker flow between home and employment locations.
51,032 124,544Live and workin CRO Region
49,345
Commute to jobs in CRO Region from outside
Live in CRO Region and commute to
jobs outside
Of the 175,576 workers that held jobs in the CRO Region in 2011, just over 51,000 (29 percent) lived outside the 5-county area.
Of the 173,889 CRO Region residents employed in 2011, almost 50,000 (28 percent)
commuted to jobs outside the 5-county region.
THEORY INTO PRACTICE PAGE | 21

SRS COMMUNITY REUSE ORGANIZATION REGIONAL WORKFORCE STUDY
FIGURE 6. LABORSHED
Within the CRO Region, Richmond, Aiken, and Columbia counties are the most populous and are the primary source of labor for employers in the region. Together, these three counties supply 67 percent of the workers employed in the region. The five counties supply about 71 percent. The total civilian labor force for the five-county CRO Region is just over 245,000.
Lexington, Edgefield, McDuffie, and Burke counties are the source of a majority of workers commuting into the region for work. These counties each account for more than one percent of the workers employed in the CRO region. As sources of workers in the region, these counties are included as part of the greater regional laborshed, which has a civilian labor force of 411,311.
FIGURE 7. SHARE OF EMPLOYED WORKERS COUNTY OF RESIDENCE
Source: US Census Bureau, Local Employment Dynamics.
THEORY INTO PRACTICE PAGE | 22
SRS COMMUNITY REUSE ORGANIZATION REGIONAL WORKFORCE STUDY
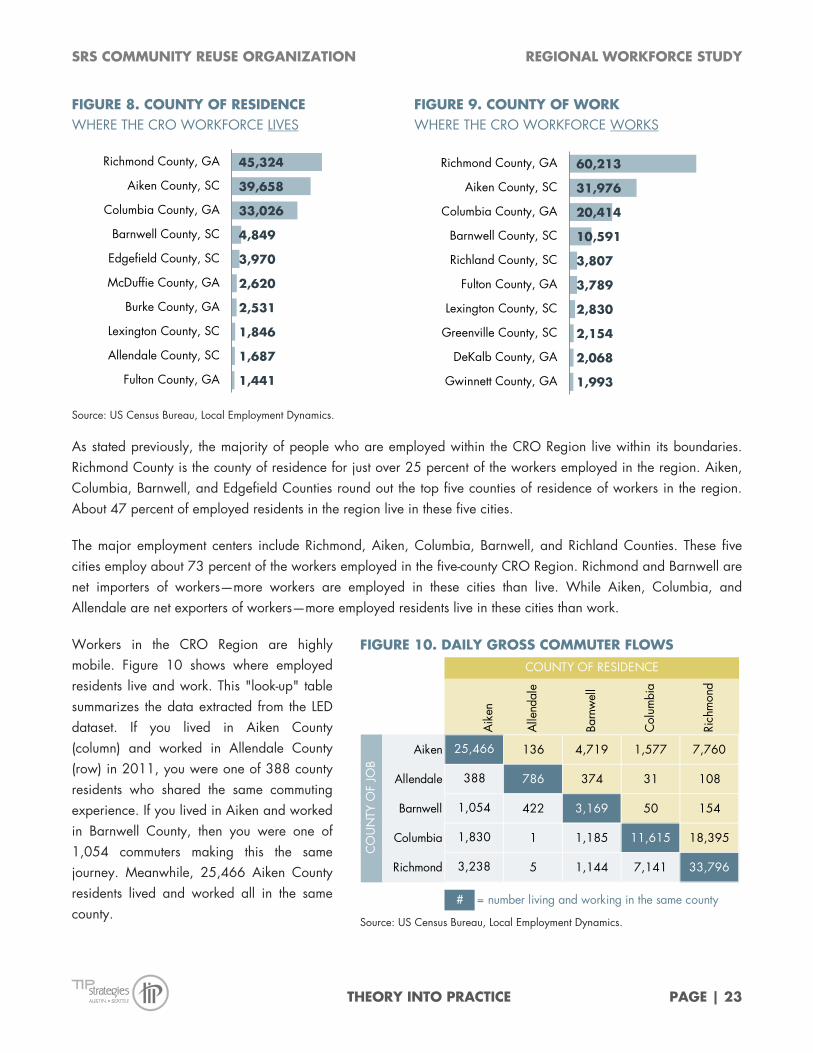
As stated previously, the majority of people who are employed within the CRO Region live within its boundaries. Richmond County is the county of residence for just over 25 percent of the workers employed in the region. Aiken, Columbia, Barnwell, and Edgefield Counties round out the top five counties of residence of workers in the region. About 47 percent of employed residents in the region live in these five cities.
The major employment centers include Richmond, Aiken, Columbia, Barnwell, and Richland Counties. These five cities employ about 73 percent of the workers employed in the five-county CRO Region. Richmond and Barnwell are net importers of workers—more workers are employed in these cities than live. While Aiken, Columbia, and Allendale are net exporters of workers—more employed residents live in these cities than work.
Workers in the CRO Region are highly mobile. Figure 10 shows where employed residents live and work. This "look-up" table summarizes the data extracted from the LED dataset. If you lived in Aiken County (column) and worked in Allendale County (row) in 2011, you were one of 388 county residents who shared the same commuting experience. If you lived in Aiken and worked in Barnwell County, then you were one of 1,054 commuters making this the same journey. Meanwhile, 25,466 Aiken County residents lived and worked all in the same county.
FIGURE 8. COUNTY OF RESIDENCE WHERE THE CRO WORKFORCE LIVES
FIGURE 9. COUNTY OF WORK WHERE THE CRO WORKFORCE WORKS
Source: US Census Bureau, Local Employment Dynamics.
FIGURE 10. DAILY GROSS COMMUTER FLOWS
Source: US Census Bureau, Local Employment Dynamics.
45,324
39,658
33,026
4,849
3,970
2,620
2,531
1,846
1,687
1,441
Richmond County, GA
Aiken County, SC
Columbia County, GA
Barnwell County, SC
Edgefield County, SC
McDuffie County, GA
Burke County, GA
Lexington County, SC
Allendale County, SC
Fulton County, GA
60,213
31,976
20,414
10,591
3,807
3,789
2,830
2,154
2,068
1,993
Richmond County, GA
Aiken County, SC
Columbia County, GA
Barnwell County, SC
Richland County, SC
Fulton County, GA
Lexington County, SC
Greenville County, SC
DeKalb County, GA
Gwinnett County, GA
Aik
en
Alle
ndal
e
Barn
wel
l
Col
umbi
a
Rich
mon
d
Aiken 136 4,719 1,577 7,760
Allendale 786 374 31 108
Barnwell 422 3,169 50 154
Columbia 1 1,185 11,615 18,395
Richmond 5 1,144 7,141 33,796
# = number living and working in the same county
CO
UN
TY O
F JO
B
25,466
388
1,054
1,830
3,238
COUNTY OF RESIDENCE
THEORY INTO PRACTICE PAGE | 23

SRS COMMUNITY REUSE ORGANIZATION REGIONAL WORKFORCE STUDY
Not only is labor in the region mobile in terms of commuting patterns, it is also highly mobile in terms of intra-regional migration. Figure 11 shows the county-to-county migration patterns for each county in the CRO Region. Columbia, Richmond, and Aiken have very strong migratory connections as residents move from county-to-county. Aiken, Allendale, and Barnwell also have fairly strong connections.
In Aiken and Richmond Counties, more new residents are moving in from out of state. In Columbia, Allendale, and Barnwell, new residents tend to be from the same state.
Overall, the CRO Region’s average net in-migration was positive. However, only Columbia and Aiken Counties had a positive net in-migration for the three years analyzed. Richmond, Allendale, and Barnwell Counties have been losing residents, on average.
FIGURE 11. COUNTY-TO-COUNTY MIGRATION, THREE-YEAR AVERAGE 2009-2011 COLUMBIA COUNTY Gross Migration Flows
Top Migration Flows
RICHMOND COUNTY Gross Migration Flows
Top Migration Flows
2,169 2,055
158
-1,722 -1,803
-117
SameState
DifferentState
Foreign*
OU
TBO
UN
DTO
INBO
UN
D Inbound OutboundCounty State from to Net Loss/GainRichmond County GA 1,440 1,103 +337Aiken County SC 152 174 -22McDuffie County GA 76 81 -5Monterey County CA 34 11 +23Fulton County GA 34 67 -33Mecklenburg County NC 20 18 +2Bell County TX 45 16 +29Honolulu County HI 32 20 +12Anne Arundel County MD 35 18 +17Cumberland County NC 29 16 +13Gwinnett County GA 35 35 +0Lincoln County GA 49 31 +18
2,7173,711
243
-2,999-3,670
-328
SameState
DifferentState
Foreign*
OU
T BO
UN
DTO
INBO
UN
D Inbound OutboundCounty State from to Net Loss/GainColumbia County GA 1,117 1,508 -390Aiken County SC 438 507 -69Burke County GA 215 181 +34Fulton County GA 126 162 -37Dekalb County GA 98 123 -25Monterey County CA 97 18 +79Chatham County GA 68 86 -18McDuffie County GA 86 71 +15Bell County TX 68 80 -12Cobb County GA 80 78 +2Richland County SC 63 77 -14Jefferson County GA 77 52 +25
THEORY INTO PRACTICE PAGE | 24

SRS COMMUNITY REUSE ORGANIZATION REGIONAL WORKFORCE STUDY
AIKEN COUNTY Gross Migration Flows
Top Migration Flows
ALLENDALE COUNTY Gross Migration Flows
Top Migration Flows
BARNWELL COUNTY Gross Migration Flows
Top Migration Flows
Source: Internal Revenue Service. *Foreign migration was significantly higher in the initial year of the analysis. Figures reflect the effect of averaging across subsequent years where data were suppressed and/or no migration was shown.
1,026
2,272
29
-1,061-1,823
-26
SameState
DifferentState
Foreign*
OU
TBO
UN
DTO
INBO
UN
D Inbound OutboundCounty State from to Net Loss/Gain
Richmond County GA 507 438 +69Edgefield County SC 237 229 +8Lexington County SC 145 184 -38Columbia County GA 177 150 +27Richland County SC 102 133 -31Barnwell County SC 89 64 +25Charleston County SC 41 55 -14Saluda County SC 38 45 -6Greenville County SC 34 42 -8Orangeburg County SC 40 32 +8Mecklenburg County NC 24 32 -8Beaufort County SC 24 21 +3
109 50 0
-170 -56
0
SameState
DifferentState
Foreign*
OU
TBO
UN
DTO
INBO
UN
D Inbound OutboundCounty State from to Net Loss/GainBarnwell County SC 25 37 -12Hampton County SC 21 28 -7Richland County SC 12 25 -14
SameState
DifferentState
Foreign*
OU
T BO
UN
DTO
INBO
UN
D Inbound OutboundCounty State from to Net Loss/GainAiken County SC 64 89 -25Allendale County SC 37 25 +12Bamberg County SC 34 33 +1Orangeburg County SC 23 29 -6
THEORY INTO PRACTICE PAGE | 25
SRS COMMUNITY REUSE ORGANIZATION REGIONAL WORKFORCE STUDY
LABOR FORCE CHARACTERISTICS
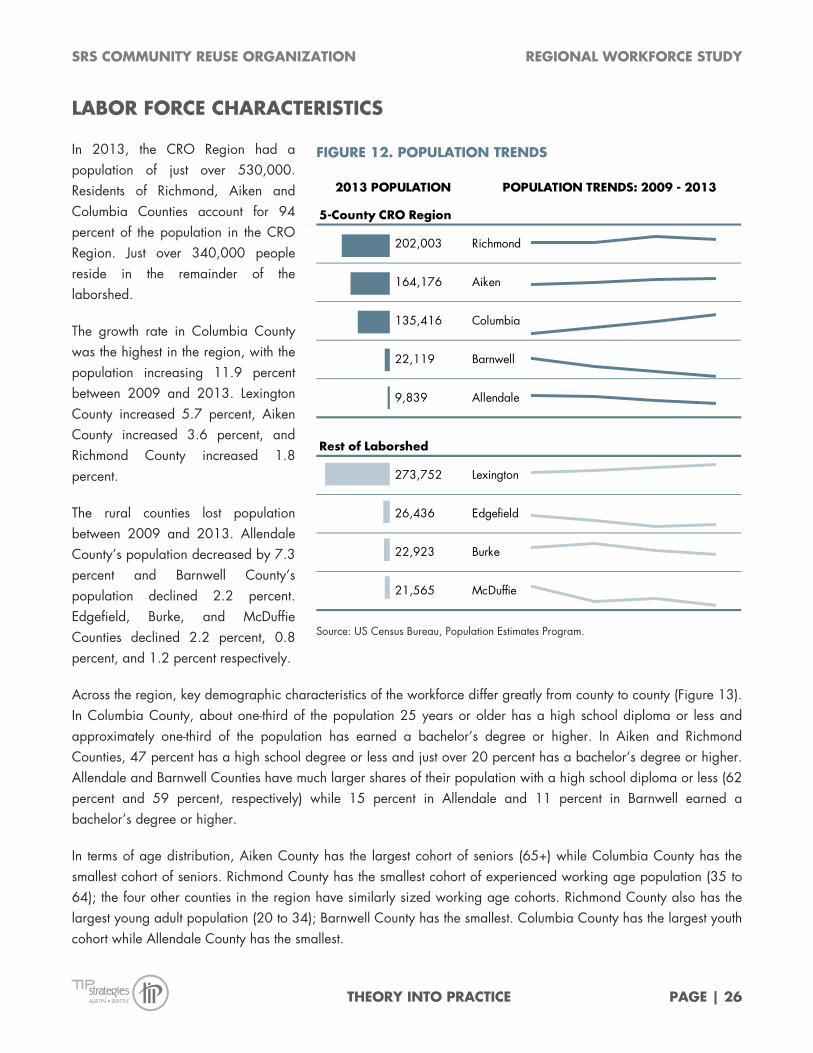
In 2013, the CRO Region had a population of just over 530,000. Residents of Richmond, Aiken and Columbia Counties account for 94 percent of the population in the CRO Region. Just over 340,000 people reside in the remainder of the laborshed.
The growth rate in Columbia County was the highest in the region, with the population increasing 11.9 percent between 2009 and 2013. Lexington County increased 5.7 percent, Aiken County increased 3.6 percent, and Richmond County increased 1.8 percent.
The rural counties lost population between 2009 and 2013. Allendale County’s population decreased by 7.3 percent and Barnwell County’s population declined 2.2 percent. Edgefield, Burke, and McDuffie Counties declined 2.2 percent, 0.8 percent, and 1.2 percent respectively.
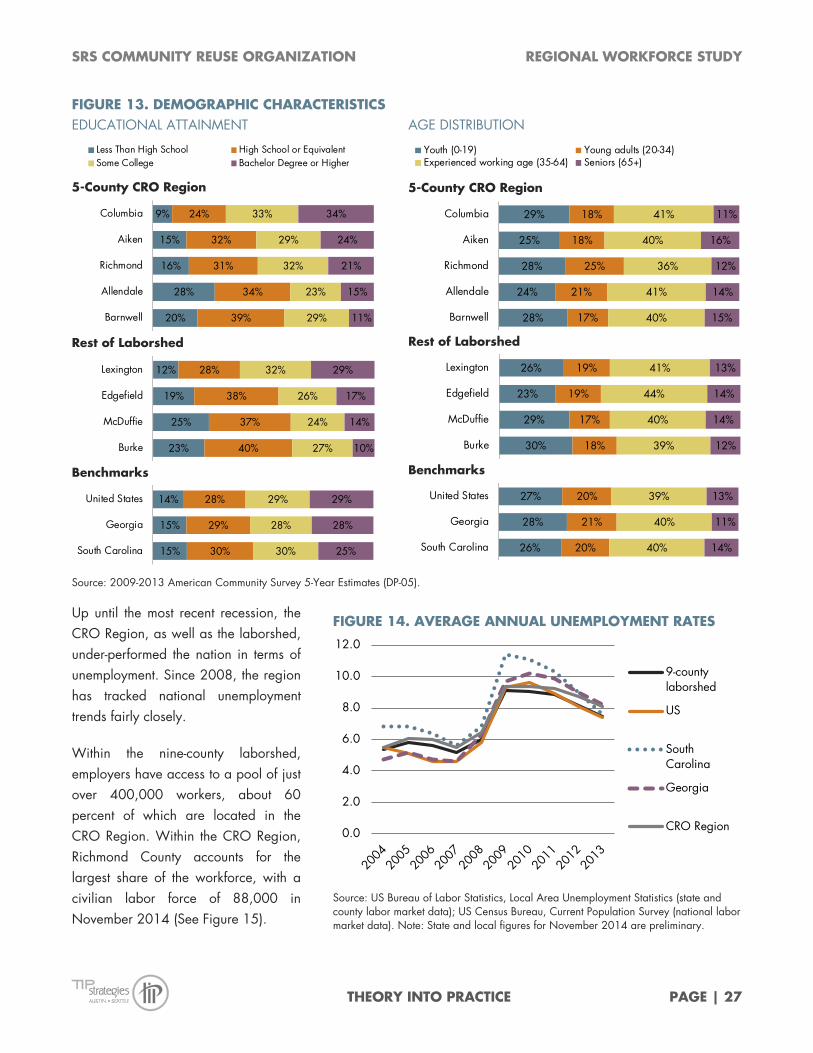
Across the region, key demographic characteristics of the workforce differ greatly from county to county (Figure 13). In Columbia County, about one-third of the population 25 years or older has a high school diploma or less and approximately one-third of the population has earned a bachelor’s degree or higher. In Aiken and Richmond Counties, 47 percent has a high school degree or less and just over 20 percent has a bachelor’s degree or higher. Allendale and Barnwell Counties have much larger shares of their population with a high school diploma or less (62 percent and 59 percent, respectively) while 15 percent in Allendale and 11 percent in Barnwell earned a bachelor’s degree or higher.
In terms of age distribution, Aiken County has the largest cohort of seniors (65+) while Columbia County has the smallest cohort of seniors. Richmond County has the smallest cohort of experienced working age population (35 to 64); the four other counties in the region have similarly sized working age cohorts. Richmond County also has the largest young adult population (20 to 34); Barnwell County has the smallest. Columbia County has the largest youth cohort while Allendale County has the smallest.
FIGURE 12. POPULATION TRENDS
Source: US Census Bureau, Population Estimates Program.
POPULATION TRENDS: 2009 - 2013
202,003 Richmond
164,176 Aiken
135,416 Columbia
22,119 Barnwell
9,839 Allendale
273,752 Lexington
26,436 Edgefield
22,923 Burke
21,565 McDuffie
5-County CRO Region
Rest of Laborshed
2013 POPULATION
THEORY INTO PRACTICE PAGE | 26
SRS COMMUNITY REUSE ORGANIZATION REGIONAL WORKFORCE STUDY
FIGURE 13. DEMOGRAPHIC CHARACTERISTICS EDUCATIONAL ATTAINMENT AGE DISTRIBUTION
5-County CRO Region
Rest of Laborshed
Benchmarks
5-County CRO Region
Rest of Laborshed
Benchmarks
Source: 2009-2013 American Community Survey 5-Year Estimates (DP-05).
Up until the most recent recession, the CRO Region, as well as the laborshed, under-performed the nation in terms of unemployment. Since 2008, the region has tracked national unemployment trends fairly closely.
Within the nine-county laborshed, employers have access to a pool of just over 400,000 workers, about 60 percent of which are located in the CRO Region. Within the CRO Region, Richmond County accounts for the largest share of the workforce, with a civilian labor force of 88,000 in November 2014 (See Figure 15).
Less Than High School High School or EquivalentSome College Bachelor Degree or Higher
9%
15%
16%
28%
20%
24%
32%
31%
34%
39%
33%
29%
32%
23%
29%
34%
24%
21%
15%
11%
Columbia
Aiken
Richmond
Allendale
Barnwell
12%
19%
25%
23%
28%
38%
37%
40%
32%
26%
24%
27%
29%
17%
14%
10%
Lexington
Edgefield
McDuffie
Burke
14%
15%
15%
28%
29%
30%
29%
28%
30%
29%
28%
25%
United States
Georgia
South Carolina
Youth (0-19) Young adults (20-34)Experienced working age (35-64) Seniors (65+)
29%
25%
28%
24%
28%
18%
18%
25%
21%
17%
41%
40%
36%
41%
40%
11%
16%
12%
14%
15%
Columbia
Aiken
Richmond
Allendale
Barnwell
26%
23%
29%
30%
19%
19%
17%
18%
41%
44%
40%
39%
13%
14%
14%
12%
Lexington
Edgefield
McDuffie
Burke
27%
28%
26%
20%
21%
20%
39%
40%
40%
13%
11%
14%
United States
Georgia
South Carolina
FIGURE 14. AVERAGE ANNUAL UNEMPLOYMENT RATES
Source: US Bureau of Labor Statistics, Local Area Unemployment Statistics (state and county labor market data); US Census Bureau, Current Population Survey (national labor market data). Note: State and local figures for November 2014 are preliminary.
0.0
2.0
4.0
6.0
8.0
10.0
12.0
9-countylaborshed
US
SouthCarolina
Georgia
CRO Region
THEORY INTO PRACTICE PAGE | 27

SRS COMMUNITY REUSE ORGANIZATION REGIONAL WORKFORCE STUDY
In November 2014, the most recent period for which data were available at the time of this analysis, unemployment in the CRO Region and laborshed was 6.7 and 6.3 percent respectively, compared with 5.5 nationally (Figure 15). Rates within the nine-county laborshed varied widely, with Lexington County reporting the lowest rate (5.2 percent) and Allendale County having the highest rate (11.2 percent).
The CRO Region has a labor force participation rate (LFPR) of 58.7 percent and the laborshed has a LFPR of 60.9 percent. Both of these are below the national average of 63.8 percent. These rates are affected by a number of socioeconomic and demographic factors including the number of retirees in the community, stay-at-home spouses, and discouraged workers who are no longer looking for employment. Often, low LFPRs are a signal of slack in the labor market. A low LFPR indicates that a number of working-age residents are choosing not to work and could be available if the right job comes along.
Like unemployment, the LFPRs in the region and laborshed vary widely. Lexington County has the highest rate (67.4 percent). Allendale County has the lowest rate (42.9 percent).
FIGURE 15. LABOR MARKET OVERVIEW AS OF NOVEMBER 2014
Source: US Bureau of Labor Statistics, Local Area Unemployment Statistics (state and county labor market data); US Census Bureau, Current Population Survey (national labor market data). Note: State and local figures for November 2014 are preliminary.
FIGURE 16. LABOR FORCE PARTICIPATION RATES SHARE OF POPULATION AGE 16 YEARS AND OVER
Source: Rough estimates calculated by TIP Strategies using 2009-2013 American Community Survey 5-Year Estimates (DP-03).
GeographyCivilian
labor force Employed Unemployed UE rate
US 156,297,000 147,666,000 8,630,000 5.5
South Carolina 2,184,935 2,046,200 138,735 6.3
Georgia 4,754,214 4,437,458 316,756 6.7
5-County CRO Region 245,186 228,744 16,442 6.7
9-County Laborshed 411,311 385,599 25,712 6.3
Counties in Laborshed
Aiken County 77,329 72,641 4,688 6.1
Allendale County 3,256 2,892 364 11.2
Barnwell County 8,284 7,495 789 9.5
Columbia County 68,212 64,486 3,726 5.5
Richmond County 88,105 81,230 6,875 7.8
Burke County 9,416 8,676 740 7.9
Edgefield County 11,010 10,255 755 6.9
Lexington County 135,688 128,673 7,015 5.2
McDuffie County 10,011 9,251 760 7.6
58.7%
60.9%
64.2%
58.4%
56.8%
55.9%
42.9%
67.4%
54.8%
53.7%
50.9%
63.8%
63.2%
60.8%
5-County CRO Region
9-County Laborshed
Columbia County
Aiken County
Richmond County
Barnwell County
Allendale County
Lexington County
McDuffie County
Burke County
Edgefield County
United States
Georgia
South Carolina
THEORY INTO PRACTICE PAGE | 28

SRS COMMUNITY REUSE ORGANIZATION REGIONAL WORKFORCE STUDY
DEMAND FACTORS
The CRO Region has a non-military employment base of just over 210,000. In addition, approximately 15,000 active duty soldiers are employed at Fort Gordon.
Like the US, healthcare and social assistance is the largest source of employment in the CRO Region, accounting for 12.4 percent of the total, which is 26,564 jobs. Retail and hospitality together account for 20.6 percent of the total jobs in the region, or 44,186 jobs. The administrative and support services and manufacturing sectors are also significant; each account for about nine percent of total employment (≈ 20,000 jobs). The region’s robust nuclear industry falls under the federal government and professional services (contractors) and represents approximately 10,000 jobs.
FIGURE 17. EMPLOYMENT BY INDUSTRY, 2014
FIGURE 18. DISTRIBUTION OF EMPLOYMENT BY INDUSTRY, 2014 COMPARISON OF CRO REGION WITH LABORSHED, STATES, AND NATION Shading indicates three largest sectors for each geography
Source: QCEW Employees, Non-QCEW Employees & Self-Employed - EMSI 2013.4 Class of Worker. Note: Excludes military and unclassified employment.
NAICS Code & Description CRO Region62 Healthcare & social assistance 26,564
44-45 Retail trade 23,588 72 Lodging, restaurants, & bars 20,598 56 Administrative & support services 20,535
31-33 Manufacturing 19,839 903 Local govt. (incl. public ed. & hospitals) 18,688 902 State govt. (incl. higher ed.) 14,563
23 Construction 12,029 81 Personal & other services 10,608 54 Professional services 9,962
9011 Federal govt. (civilian) 8,272 52 Finance & insurance 5,461
48-49 Transportation & warehousing 4,532 42 Wholesale trade 4,204 71 Arts, entertainment, & recreation 3,761 51 Information 2,991 61 Educational services (private) 2,521 53 Property sales & leasing 2,056 11 Agriculture & forestry 1,075 22 Utilities 789 55 Corporate & regional offices 732 21 Mining (incl. oil & gas) 212
NAICS Code & Description CRO Region Laborshed South Georgia US62 Healthcare & social assistance 12.4% 10.9% 9.3% 10.3% 12.6%
44-45 Retail trade 11.0% 11.7% 11.7% 11.0% 10.6%72 Lodging, restaurants, & bars 9.6% 9.1% 10.0% 8.8% 8.4%56 Administrative & support services 9.6% 8.6% 8.0% 7.6% 6.4%
31-33 Manufacturing 9.3% 9.4% 11.2% 8.3% 8.2%903 Local govt. (incl. pub. ed. & hospitals) 8.8% 10.9% 10.3% 8.9% 9.3%902 State govt. (incl. higher ed.) 6.8% 4.9% 4.8% 4.0% 3.5%
23 Construction 5.6% 5.8% 5.3% 4.7% 5.2%81 Personal & other services 5.0% 5.1% 5.0% 4.5% 4.8%54 Professional services 4.7% 4.0% 4.6% 6.3% 6.4%
9011 Federal govt. (civilian) 3.9% 2.7% 1.6% 2.3% 1.9%52 Finance & insurance 2.6% 2.5% 3.5% 4.0% 4.1%
48-49 Transportation & warehousing 2.1% 3.4% 2.9% 4.2% 3.3%42 Wholesale trade 2.0% 3.0% 3.3% 4.8% 4.0%71 Arts, entertainment, & recreation 1.8% 1.4% 1.5% 1.3% 1.7%51 Information 1.4% 1.1% 1.3% 2.4% 1.9%61 Educational services (private) 1.2% 1.0% 1.7% 2.0% 2.5%53 Property sales & leasing 1.0% 1.3% 1.6% 1.6% 1.7%11 Agriculture & forestry 0.5% 1.3% 0.8% 0.9% 1.2%22 Utilities 0.4% 1.3% 0.6% 0.4% 0.4%55 Corporate & regional offices 0.3% 0.6% 0.8% 1.4% 1.4%21 Mining (incl. oil & gas) 0.1% 0.1% 0.1% 0.1% 0.6%
THEORY INTO PRACTICE PAGE | 29

SRS COMMUNITY REUSE ORGANIZATION REGIONAL WORKFORCE STUDY
The staffing patterns of the regional industry base yield the occupational structure shown in Figure 19. Office and administrative support is the largest occupational group in the region, followed by sales and related occupations and food preparation occupations. Healthcare practitioners and production occupations round out the top 5 occupational groups. These top 5 occupational groups account for 49 percent of all non-military employment.
Of the 210,000 jobs in the region, 19 percent are considered high skill, requiring a bachelor’s degree or higher. Thirty-eight percent of the jobs are considered middle-skill jobs, requiring at least a high school diploma and some training but less than a four-year degree. The remaining 43 percent of the jobs are low-skill.
Over the last five years, growth in low-skill occupations outpaced that of middle- and high- skill occupations. Low-skill occupations grew by over 1,800 jobs, middle-skill occupations fell by 1,377, and high-skill occupations fell by 299. The share of these segments stayed relatively constant over the five-year period.
FIGURE 19. EMPLOYMENT BY OCCUPATION, 2014
Source: QCEW Employees, Non-QCEW Employees & Self-Employed - EMSI 2013.4 Class of Worker. Note: Excludes military and unclassified employment.
FIGURE 20. JOBS BY SKILL LEVEL TOTAL EMPLOYMENT,
2014 CHANGE IN JOBS,
2008-14
Source: QCEW Employees, Non-QCEW Employees & Self-Employed - EMSI 2013.4 Class of Worker.
SOC Code & Description CRO Region43 Office and Administrative Support 31,187 41 Sales and Related 21,487 35 Food Preparation and Serving Related 19,665 29 Healthcare Practitioners and Technical 16,898 51 Production 15,446 25 Education, Training, and Library 13,886 53 Transportation and Material Moving 13,445 47 Construction and Extraction 10,784 49 Installation, Maintenance, and Repair 9,382 37 Building & Grnds. Cleaning & Maint. 9,042 11 Management 8,949 39 Personal Care and Service 7,442 13 Business and Financial Operations 6,937 31 Healthcare Support 6,164 33 Protective Service 5,391 17 Architecture and Engineering 5,194 15 Computer and Mathematical 3,327 21 Community and Social Service 3,056 27 Arts, Design, Ent., Sports, and Media 2,501 19 Life, Physical, and Social Science 1,854 23 Legal 982 45 Farming, Fishing, and Forestry 763
Low43%
Middle38%
High19%
+1,842
-1,377
-299
Low Middle High
THEORY INTO PRACTICE PAGE | 30

SRS COMMUNITY REUSE ORGANIZATION REGIONAL WORKFORCE STUDY
As a result of the current industry and occupational structure, the CRO Region demonstrates significant occupational strengths. Figure 21 highlights those occupations with a location quotient (LQ) above 2.00. The occupations listed in this figure are those that have at least 50 jobs and pay more than the region’s median hourly wage of $17.96. These 27 occupations demonstrate the region’s strengths in nuclear, healthcare, and a number of manufacturing niches, including chemical, paper products, and rubber products manufacturing.
Though the median hourly wage for the CRO Region as a whole is lower than that of the nation ($17.96
ABOUT LOCATION QUOTIENTS (LQS)
Location quotient analysis is a statistical technique used to suggest areas of relative advantage based on a region’s employment base. LQs are calculated as an occupation’s share of total local employment divided by the same occupation’s share of employment at the national level:
(local employment in occupation x / total local employment-all occupations) (national employment in occupation x /
total national employment-all occupations) If the local industry and national industry are perfectly proportional, the LQ will be 1.00. LQs greater than 1.25 are presumed to indicate a comparative advantage; those below 0.75 suggest areas of weakness but also point to opportunities for expansion or attraction.
FIGURE 21. OCCUPATIONAL STRENGTHS TOP LOCATION QUOTIENTS FOR THE CRO REGION LEGEND: Median hourly earnings: Within +/- 10% of US median 10% below US 10% above US
Source: QCEW Employees, Non-QCEW Employees & Self-Employed - EMSI 2013.4 Class of Worker. Notes: Occupations with at least 50 jobs. Occupations paying below the regional median wage ($17.96) were excluded.
SOC Description2014 Jobs
2014 LQ
(US = 1.00)
Median Hourly
Earnings
Wage Premium
> 10% over US Average
2014 Jobs
2014 LQ
(US = 1.00)
Median Hourly
Earnings
Wage Premium
> 10% over US Average
51-9197 Tire Builders 380 14.71 $22.28 1,153 27.62 $20.76 47-4041 Hazardous Materials Removal Workers 532 8.77 $23.19 567 5.78 $22.87 29-1029 Dentists, All Other Specialists 73 7.43 $45.44 77 4.87 $46.79 53-7032 Excavating & Loading Machine & Dragline Operators 470 5.94 $33.24 524 4.09 $31.57 51-8091 Chemical Plant and System Operators 324 5.56 $27.34 349 3.71 $26.49 53-2022 Airfield Operations Specialists 52 4.57 $24.28 56 3.07 $23.89 17-2161 Nuclear Engineers 127 4.56 $37.49 249 5.55 $41.37 19-4091 Environmental Sci. & Protection Technicians, Incl. Health 236 4.40 $34.30 258 2.97 $33.28 51-9196 Paper Goods Machine Setters, Operators, and Tenders 597 4.26 $19.62 709 3.13 $20.38 25-9021 Farm and Home Management Advisors 57 3.67 $22.77 61 2.44 $22.60 47-2221 Structural Iron and Steel Workers 321 3.45 $26.89 370 2.46 $25.48 17-2111 H&S Engrs, Ex. Mining Safety Engrs & Inspectors 123 3.41 $40.28 147 2.52 $39.90 17-3025 Environmental Engineering Technicians 91 3.37 $29.01 103 2.36 $28.87 17-2051 Civil Engineers 1,413 3.36 $41.80 1,617 2.38 $40.41 19-3099 Social Scientists and Related Workers, All Other 156 3.10 $39.51 171 2.10 $39.17 17-2081 Environmental Engineers 249 3.08 $35.73 308 2.35 $35.42 29-1124 Radiation Therapists 76 3.01 $31.44 88 2.15 $32.06 51-8031 Water & Wastewater Treatment Plant & Sys. Operators 458 2.80 $32.32 558 2.11 $30.71 47-2171 Reinforcing Iron and Rebar Workers 68 2.49 $26.39 88 1.99 $24.56 19-3039 Psychologists, All Other 72 2.45 $44.27 82 1.73 $43.65 29-2011 Medical and Clinical Laboratory Technologists 573 2.37 $23.40 731 1.87 $23.42 27-4099 Media & Communication Equipment Workers, All Other 64 2.29 $38.48 70 1.53 $37.89 51-9023 Mixing & Blending Mach. Setters, Operators, & Tenders 393 2.22 $18.79 517 1.81 $17.84 49-2091 Avionics Technicians 58 2.17 $26.56 65 1.51 $26.23 51-9011 Chemical Equipment Operators and Tenders 195 2.15 $29.23 215 1.46 $28.23 29-1069 Physicians and Surgeons, All Other 1,083 2.10 $56.89 1,293 1.55 $62.44 17-2141 Mechanical Engineers 815 2.06 $47.94 1,178 1.84 $45.17
CRO Region Laborshed
THEORY INTO PRACTICE PAGE | 31
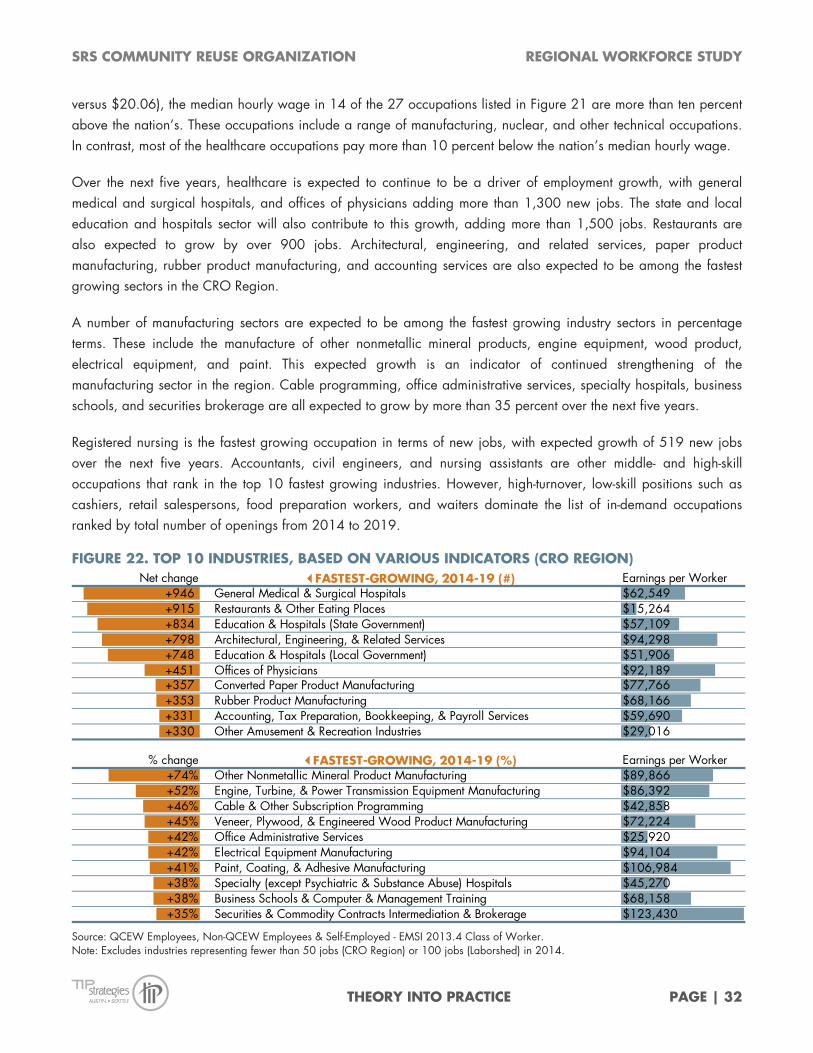
SRS COMMUNITY REUSE ORGANIZATION REGIONAL WORKFORCE STUDY
versus $20.06), the median hourly wage in 14 of the 27 occupations listed in Figure 21 are more than ten percent above the nation’s. These occupations include a range of manufacturing, nuclear, and other technical occupations. In contrast, most of the healthcare occupations pay more than 10 percent below the nation’s median hourly wage.
Over the next five years, healthcare is expected to continue to be a driver of employment growth, with general medical and surgical hospitals, and offices of physicians adding more than 1,300 new jobs. The state and local education and hospitals sector will also contribute to this growth, adding more than 1,500 jobs. Restaurants are also expected to grow by over 900 jobs. Architectural, engineering, and related services, paper product manufacturing, rubber product manufacturing, and accounting services are also expected to be among the fastest growing sectors in the CRO Region.
A number of manufacturing sectors are expected to be among the fastest growing industry sectors in percentage terms. These include the manufacture of other nonmetallic mineral products, engine equipment, wood product, electrical equipment, and paint. This expected growth is an indicator of continued strengthening of the manufacturing sector in the region. Cable programming, office administrative services, specialty hospitals, business schools, and securities brokerage are all expected to grow by more than 35 percent over the next five years.
Registered nursing is the fastest growing occupation in terms of new jobs, with expected growth of 519 new jobs over the next five years. Accountants, civil engineers, and nursing assistants are other middle- and high-skill occupations that rank in the top 10 fastest growing industries. However, high-turnover, low-skill positions such as cashiers, retail salespersons, food preparation workers, and waiters dominate the list of in-demand occupations ranked by total number of openings from 2014 to 2019.
FIGURE 22. TOP 10 INDUSTRIES, BASED ON VARIOUS INDICATORS (CRO REGION)
Source: QCEW Employees, Non-QCEW Employees & Self-Employed - EMSI 2013.4 Class of Worker. Note: Excludes industries representing fewer than 50 jobs (CRO Region) or 100 jobs (Laborshed) in 2014.
Net change FASTEST-GROWING, 2014-19 (#) Earnings per Worker+946 General Medical & Surgical Hospitals $62,549+915 Restaurants & Other Eating Places $15,264+834 Education & Hospitals (State Government) $57,109+798 Architectural, Engineering, & Related Services $94,298+748 Education & Hospitals (Local Government) $51,906+451 Offices of Physicians $92,189+357 Converted Paper Product Manufacturing $77,766+353 Rubber Product Manufacturing $68,166+331 Accounting, Tax Preparation, Bookkeeping, & Payroll Services $59,690+330 Other Amusement & Recreation Industries $29,016
% change FASTEST-GROWING, 2014-19 (%) Earnings per Worker+74% Other Nonmetallic Mineral Product Manufacturing $89,866+52% Engine, Turbine, & Power Transmission Equipment Manufacturing $86,392+46% Cable & Other Subscription Programming $42,858+45% Veneer, Plywood, & Engineered Wood Product Manufacturing $72,224+42% Office Administrative Services $25,920+42% Electrical Equipment Manufacturing $94,104+41% Paint, Coating, & Adhesive Manufacturing $106,984+38% Specialty (except Psychiatric & Substance Abuse) Hospitals $45,270+38% Business Schools & Computer & Management Training $68,158+35% Securities & Commodity Contracts Intermediation & Brokerage $123,430
THEORY INTO PRACTICE PAGE | 32

SRS COMMUNITY REUSE ORGANIZATION REGIONAL WORKFORCE STUDY
This projected industry growth is expected to generate 7,678 new jobs in the CRO Region between 2014 and 2019. In addition, there are expected to be 30,078 replacement jobs over the same period. Replacement jobs are those openings which occur due to turnover, including attrition and retirement. This implies a total number of openings of 37,756, or 7,551 annually, over the next five years.
To better understand the CRO Region’s specific occupational needs, a deeper dive into occupational drivers was necessary. The drivers examined were new job growth, replacement demand, wage premiums, and the percent of workers over 55 years of age working in that occupation. New jobs and replacement demand were used as indicators of current volume. Wage premiums were used as an indicator that the position may currently be hard to fill. The percent of workers greater than 55 years old was used to indicate a possible wave of retirements in the near to medium term. The resulting list was sorted by skill level in Figure 26 and Figure 27.
FIGURE 23. TOP 10 OCCUPATIONS, BASED ON VARIOUS INDICATORS
Source: QCEW Employees, Non-QCEW Employees & Self-Employed - EMSI 2013.4 Class of Worker. Note: Excludes occupations representing fewer than 50 jobs (CRO Region) or 100 jobs (Laborshed) in Jobs.
FIGURE 24. OCCUPATIONAL GROWTH BY SKILL-LEVEL OPENINGS, 2014-19
Source: QCEW Employees, Non-QCEW Employees & Self-Employed - EMSI 2013.4 Class of Worker.
k Net change FASTEST-GROWING, 2014-19 (New Jobs) Median hourly earnings+519 Registered Nurses $30.98+426 Combined Food Preparation & Serving Workers, Including Fast Food $8.63+385 Customer Service Representatives $11.80+224 Personal Care Aides $8.57+212 Secretaries & Administrative Assistants, Except Legal, Medical, & Executive $14.71+178 Accountants & Auditors $26.12+174 Waiters & Waitresses $8.76+173 Civil Engineers $41.80+170 Cooks, Restaurant $9.75+160 Nursing Assistants $10.94
Net change IN-DEMAND, 2014-19 (# OPENINGS) Median hourly earnings+1,546 Cashiers $8.58+1,541 Retail Salespersons $9.30+1,534 Combined Food Preparation and Serving Workers, Including Fast Food $8.63+1,155 Waiters and Waitresses $8.76+1,119 Registered Nurses $30.98
+960 Customer Service Representatives $11.80+726 Office Clerks, General $11.68+699 Laborers and Freight, Stock, and Material Movers, Hand $10.96+522 Janitors and Cleaners, Except Maids and Housekeeping Cleaners $9.22+453 Secretaries & Administrative Assistants, Except Legal, Medical, & Executive $14.71
2,528
2,392
2,758
15,126
10,495
4,457
Low
Middle
High
New Replacement
THEORY INTO PRACTICE PAGE | 33

SRS COMMUNITY REUSE ORGANIZATION REGIONAL WORKFORCE STUDY
In all, the list of high-demand occupations included 93 occupations. The marketing occupations, which include customer service representatives, have the highest number of expected openings. Hospitality and tourism and business management and administration are the next highest-demand career clusters. The demand in these top career clusters is driven by growth in low-skill occupations.
Education and training, health science, and manufacturing are the highest-demand career clusters that require training. Growth in these three clusters is driven by openings in middle- and high-skill occupations.
Figure 26 lists the high-demand, high-skill occupations. This list includes 33 different occupations. The list is dominated by education-related occupations. Healthcare-related occupations include physicians and surgeons, veterinarians, and dentists. Engineering and technical positions include civil, mechanical, electrical, environmental, nuclear, and health and safety engineers. Various types of managers are also included, such as administrative services managers, chief executives, architectural and engineering managers, and industrial production managers.
All but five of these occupations are facing a wave of retirements in the next five to ten years. Civil engineers, chief executives, environmental engineers, and electrical engineers have some of the highest percentages of workers over the age of 55. For the most part, these high-demand, high-skill occupations are not experiencing wage pressures. Notable exceptions are mechanical engineers, industrial production managers, and all other engineers.
FIGURE 25. HIGH-DEMAND JOBS BY SKILL LEVEL AND CAREER CLUSTER
Source: QCEW Employees, Non-QCEW Employees & Self-Employed - EMSI 2013.4 Class of Worker. TIP Calculations. Note: Excludes occupations with fewer than 100 jobs and fewer than 10 openings.
Career ClusterAnnual
Openings
Marketing 634 Hospitality & Tourism 538 Business Management & Administration 495 Education & Training 326 Health Science 289 Manufacturing 250 Transportation, Distribution & Logistics 225 Architecture & Construction 162 Finance 114 Human Services 108 Law, Public Safety, Corrections & Security 103 Science, Technology, Engineering & Mathematics 77 Agriculture, Food & Natural Resources 66 Government & Public Adminstration 51 Arts, Audio/Video Technology & Communications 20
Low Middle High
THEORY INTO PRACTICE PAGE | 34

SRS COMMUNITY REUSE ORGANIZATION REGIONAL WORKFORCE STUDY
The list of high-demand, middle-skill occupations (Figure 27) includes 41 different occupations. This list is dominated by those occupations typically considered blue collar—construction, maintenance, production, and transportation. However, registered nursing does top the list in terms of total openings and new demand. Other healthcare-related occupations include medical transcriptionists, and cardiovascular technologists. Office-related occupations include bookkeeping, executive secretaries, purchasing agents, tax preparers, paralegals, and legal secretaries.
Almost half of the high-demand, middle-skill occupations are facing wage pressures. All of these occupations are in blue collar occupational categories. In 26 occupations, more than 25 percent of the workers are 55 or older. The occupations with the highest percentage of workers over 55 include hazardous materials removal workers, excavating machine operators, and water and wastewater treatment plant operators.
FIGURE 26. HIGH-DEMAND, HIGH-SKILL OCCUPATIONS LEGEND: Median hourly earnings: Within +/- 10% of US median 10% below US 10% above US
Source: QCEW Employees, Non-QCEW Employees & Self-Employed - EMSI 2013.4 Class of Worker. TIP Calculations. Note: Excludes occupations with fewer than 100 jobs and fewer than 10 openings.
SOC Description2014 Jobs
Annual Openings (2014-19)
New Demand (2014-19)
Replace-ment
Demand (2014-19) New
Replaceme
nt
Median Hourly
Earnings
Wage Premium > 10%
over US Average
25-1099 Postsecondary Teachers 2,487 67 28 39 0 1 $27.90 25-2021 Elementary School Teachers, Except Specia 2,004 79 32 46 0 1 $25.91 25-2022 Middle Sch.Teachers, Excpt. Special 1,553 64 27 36 0 1 $26.14 17-2051 Civil Engineers 1,413 72 35 38 0 1 $41.80 25-3098 Substitute Teachers 1,109 32 12 20 0 1 $8.40 29-1069 Physicians & Surgeons, All Other 1,083 36 6 30 0 1 $56.89 25-2031 Secndry Sch.Teachers, Excpt. Special 961 35 7 27 0 1 $24.51 17-2141 Mechanical Engineers 815 39 9 30 0 1 $47.94 39-9032 Recreation Workers 622 18 10 8 1 0 $16.37 11-3011 Administrative Services Managers 570 14 5 10 0 1 $41.93 25-3099 Teachers & Instructors, All Other 546 14 4 11 0 1 $33.95 23-1011 Lawyers 544 11 (2) 13 0 1 $36.43 21-2011 Clergy 440 15 6 9 0 1 $24.92 11-1011 Chief Executives 439 12 0 11 0 1 $61.75 11-9032 Edu. Administrators, Elementary & Second… 333 13 3 9 0 1 $40.35 21-1012 Edu.al, Guidance, School, & Vocational C…325 11 3 7 0 1 $23.62 41-3031 Securities, Commodities, & Financial Svces 320 24 15 9 1 0 $37.42 13-1051 Cost Estimators 305 15 4 11 0 1 $29.27 11-9041 Architectural & Engineering Managers 296 14 6 8 0 1 $61.77 11-3051 Industrial Production Managers 275 6 (1) 7 0 1 $52.28 25-2052 Special Edu. Teachers, Kindergarten & Ele…273 8 3 5 0 1 $24.14 17-2071 Electrical Engineers 250 13 6 6 0 1 $34.83 17-2081 Environmental Engineers 249 6 (2) 8 0 1 $35.73 21-2021 Directors, Religious Activities & Edu. 247 12 3 9 0 1 $17.04 25-9031 Instructional Coordinators 240 5 3 2 1 0 $29.59 29-1131 Veterinarians 157 11 5 6 0 1 $47.23 17-2199 Engineers, All Other 157 5 2 3 0 1 $52.75 29-1021 Dentists, General 155 8 3 5 0 1 $87.77 27-3042 Tech. Writers 141 6 1 5 0 1 $32.71 17-2161 Nuclear Engineers 127 3 (1) 4 0 1 $37.49 17-2111 H&S Engineers, Excpt. Mining Safety Engin 123 4 (0) 4 0 1 $40.28 21-2099 Religious Workers, All Other 122 4 2 3 0 1 $13.13 27-2041 Music Directors & Composers 116 5 1 3 0 1 $21.21
NewReplacement
THEORY INTO PRACTICE PAGE | 35

SRS COMMUNITY REUSE ORGANIZATION REGIONAL WORKFORCE STUDY
FIGURE 27. HIGH-DEMAND, MIDDLE-SKILL OCCUPATIONS LEGEND: Median hourly earnings: Within +/- 10% of US median 10% below US 10% above US
Source: QCEW Employees, Non-QCEW Employees & Self-Employed - EMSI 2013.4 Class of Worker. TIP Calculations. Note: Excludes occupations with fewer than 100 jobs and fewer than 10 openings.
SOC Description2014 Jobs
Annual Openings (2014-19)
New Demand (2014-19)
Replace-ment
Demand (2014-19) New
Replaceme
nt
Median Hourly
Earnings
Wage Premium > 10%
over US Average
29-1141 Registered Nurses 5,821 224 104 120 0.46 0.54 $30.98 49-9071 Maint. & Repair Workers, General 2,836 68 3 65 0.04 0.96 $16.32 53-3032 Heavy & Tractor-Trailer Truck Drivers 2,347 46 (7) 52 0.00 1.00 $18.50 43-3031 Bookkeeping, Acct., & Auditing Clerks 2,126 51 29 22 0.56 0.44 $15.17 47-2031 Carpenters 1,796 39 (27) 66 0.00 1.00 $20.77 51-1011 First-Line Supervisors of Production & Op… 1,109 19 (9) 28 0.00 1.00 $29.19 33-3051 Police & Sheriff's Patrol Officers 979 36 4 32 0.10 0.90 $16.25 33-3012 Correctional Officers & Jailers 946 32 3 29 0.09 0.91 $14.01 43-6011 Executive Secretaries & Executive Admin. 844 14 3 11 0.24 0.76 $20.88 41-3021 Insurance Sales Agents 708 30 11 18 0.39 0.61 $21.15 51-9111 Packaging & Filling Machine Operators… 671 17 (14) 31 0.00 1.00 $15.24 49-9041 Industrial Machinery Mechanics 619 24 5 19 0.22 0.78 $21.84 51-9196 Paper Goods Machine Setters, Operators… 597 18 11 6 0.64 0.36 $19.62 51-9041 Extruding, Forming, Pressing, & Compactin 587 25 (0) 25 0.00 1.00 $17.36 47-4041 Hazardous Materials Removal Workers 532 11 (17) 28 0.00 1.00 $23.19 33-2011 Firefighters 511 17 1 16 0.06 0.94 $15.90 47-2073 Operating Engineers & Other Construction…483 12 (3) 14 0.00 1.00 $17.18 41-9022 Real Estate Sales Agents 481 6 (8) 14 0.00 1.00 $15.30 53-7032 Excavating & Loading Machine & Dragline 470 4 (14) 19 0.00 1.00 $33.24 51-8031 Water & Wastewater Treatment Plant… 458 16 (6) 22 0.00 1.00 $32.32 51-9023 Mixing and Blending Machine Setters… 393 14 0 14 0.02 0.98 $18.79 51-9197 Tire Builders 380 22 10 12 0.47 0.53 $22.28 49-3031 Bus & Truck Mechanics & Diesel Engine… 365 9 (1) 10 0.00 1.00 $17.81 47-2221 Structural Iron & Steel Workers 321 14 (2) 16 0.00 1.00 $26.89 13-1023 Purchasing Agents, Except Wholesale, Reta 319 8 1 7 0.14 0.86 $27.85 49-3042 Mobile Heavy Equipment Mechanics, Exce 253 7 (5) 12 0.00 1.00 $29.15 19-4091 Environmental Science and Protection Tech 236 9 (5) 14 0.00 1.00 $34.30 11-9141 Property, Real Estate, & Community Assoc… 235 6 (2) 8 0.00 1.00 $20.02 27-2042 Musicians & Singers 231 10 2 8 0.19 0.81 $19.58 51-6064 Textile Winding, Twisting, & Drawing Out… 219 3 (14) 17 0.00 1.00 $12.15 13-2082 Tax Preparers 203 9 4 5 0.44 0.56 $15.94 23-2011 Paralegals & Legal Assistants 202 4 (0) 5 0.00 1.00 $19.43 51-9011 Chemical Equipment Operators & Tenders… 195 8 (1) 9 0.00 1.00 $29.23 43-6012 Legal Secretaries 185 3 (3) 6 0.00 1.00 $15.70 19-4031 Chemical Technicians 160 5 0 5 0.01 0.99 $24.00 31-9094 Medical Transcriptionists 148 5 1 3 0.32 0.68 $17.71 29-2031 Cardiovascular Technologists & Technician 147 6 4 2 0.66 0.34 $28.39 53-3021 Bus Drivers, Transit & Intercity 128 8 6 3 0.67 0.33 $10.25 11-9013 Farmers, Ranchers, & Other Agricultural… 128 5 (0) 5 0.00 1.00 $13.99 17-3022 Civil Engineering Technicians 113 5 3 3 0.50 0.50 $25.27 51-3092 Food Batchmakers 104 5 (2) 6 0.00 1.00 $15.23
NewReplacement
THEORY INTO PRACTICE PAGE | 36

SRS COMMUNITY REUSE ORGANIZATION REGIONAL WORKFORCE STUDY
INDUSTRY & WORKFORCE ALIGNMENT
While the prior sections examined characteristics of the labor force and drivers of demand, this section looks at the alignment between the region’s industry needs and workforce.
A comparison of the educational requirements of the CRO Region’s job base and the educational attainment of the population 25 years and older suggests a mismatch. Though 38 percent of the population has a bachelor’s degree or higher, only 20 percent of the jobs typically require a four-year degree. This type of mismatch can be an indicator of under-employment if people with degrees take jobs that do not require a degree. It can also signal extra capacity in the labor force, especially if residents with a postsecondary education are currently not working.
To understand the supply of potential graduates in the region, data on for-credit completions were compiled for all schools within the nine-county laborshed from the National Center for Education Statistics’ Integrated Postsecondary Data System (IPEDS). For more information on IPEDS and this analysis, see Appendix B: Industry Profiles.
FIGURE 28. COMPARISON: LABOR FORCE VS. JOBS TYPICAL EDUCATION REQUIREMENTS OF REGIONAL JOBS COMPARED TO EDUCATIONAL ATTAINMENT OF POP. > 25
Source: EMSI 2014.3 – QCEW Employees, Non-QCEW, and Self-Employed; 2009-2013 American Community Survey 5-Year Est.
FIGURE 29. REGIONAL INSTITUTIONS
INSTITUTION CITY TYPE LEVEL
Aiken Technical College Graniteville Public 2-year
Augusta School of Massage Evans Private for-profit less-than 2-year
Augusta Technical College Augusta Public 2-year
Georgia Military College-Augusta Campus Martinez Public 2-year
Georgia Regents University Augusta Public 4-year or above
Midlands Technical College West Columbia Public 2-year
Miller-Motte Technical College-Augusta Augusta Private for-profit 2-year
Paine College Augusta Private not-for-profit 4-year or above
University of Phoenix-Augusta Campus Augusta Private for-profit 4-year or above
University of South Carolina-Aiken Aiken Public 4-year or above
University of South Carolina-Salkehatchie Allendale Public 2-year
Virginia College-Augusta Augusta Private for-profit 4-year or above
Source: National Center for Education Statistics, Integrated Postsecondary Education Data System (IPEDS) Notes: IPEDS data include only schools eligible to participate in federal financial aid programs. In August 2012, Augusta State University merged with Georgia Health Sciences University to form Georgia Regents University (Wikipedia). Augusta Area Dietetic Internship-University Hospital is listed as a program of Georgia Regents University on the insitutions website (http://www.gru.edu/alliedhealth/dip/).Miller-Motte Technical College-Augusta is included in the file in each year, but only recorded completions in 2012-2013 academic year.
8%
47%53%
34%
38%20%
Educational Attainmentof Population > 25 y.o.
Skills Requirementsof Jobs
Bachelor's orabove
At least HS,< Bachelor's
Less thanhigh school
THEORY INTO PRACTICE PAGE | 37

SRS COMMUNITY REUSE ORGANIZATION REGIONAL WORKFORCE STUDY
The list included 12 institutions—11 in the CRO Region and 1 in West Columbia. Five institutions are 4-year and seven are 2-year or less. Seven institutions are public.
The 12 institutions included in the analysis conferred an average of more than 7,300 for-credit awards annually during the three-year period analyzed. Midland Technical College awards, on average, 2,000 degrees each year. Georgia Regents University awards just under 2,000, and Augusta Technical College awards about 1,300. These three institutions account for just over 70 percent of the region’s completions.
Just over one-third of the awards were issued at the four-year level or above (Figure 30). Slightly less than 30 percent were associate’s degrees, and about one-third of the awards were less than two-year certificates and awards.
FIGURE 30. COMPLETIONS BY YEAR, INSTITUTION, AND AWARD LEVEL
Source: Natl. Center for Education Statistics, Integrated Postsecondary Education Data System (IPEDS). Note: IPEDS data include only schools eligible to participate in federal financial aid programs. Figures shown include first and second majors. *Associate’s-degree-level completions include awards categorized by IPEDS as "Award of at least two but less than four academic years." **Advanced-level completions represent all awards above the bachelor’s-degree level.
UNIT ID INSTITUTION 2011 2012 2013THREE-YEAR AVERAGE
218353 Midlands Technical College 1,914 2,161 1,935 2,003
482149 Georgia Regents University* 1,927 1,870 1,889 1,895
138956 Augusta Technical College 1,577 1,192 1,357 1,375
217615 Aiken Technical College 740 687 678 702
218645 University of South Carolina-Aiken 507 544 552 534
458256 Virginia College-Augusta 240 347 308 298
384360 Georgia Military College-Augusta Campus 209 209
450474 University of Phoenix-Augusta Campus 135 142 215 164
218681 University of South Carolina-Salkehatchie 146 147 172 155
140720 Paine College 98 100 91 96
447917 Augusta School of Massage 29 58 65 51460826 Miller-Motte Technical College-Augusta** 0 0 98 33
Total 7,522 7,248 7,360 7,377
25.3% 24.4% 24.4%
11.1% 9.5% 9.7%
28.4% 29.6% 28.7%
21.2% 22.3% 24.1%
14.1% 14.2% 13.1%
0%
25%
50%
75%
100%
2011(n=7,522)
2012(n=7,248)
2013(n=7,360)
Advanced**
Bachelor's
Associate's*
At least 1 but < 2years
Less than 1academic year
THEORY INTO PRACTICE PAGE | 38
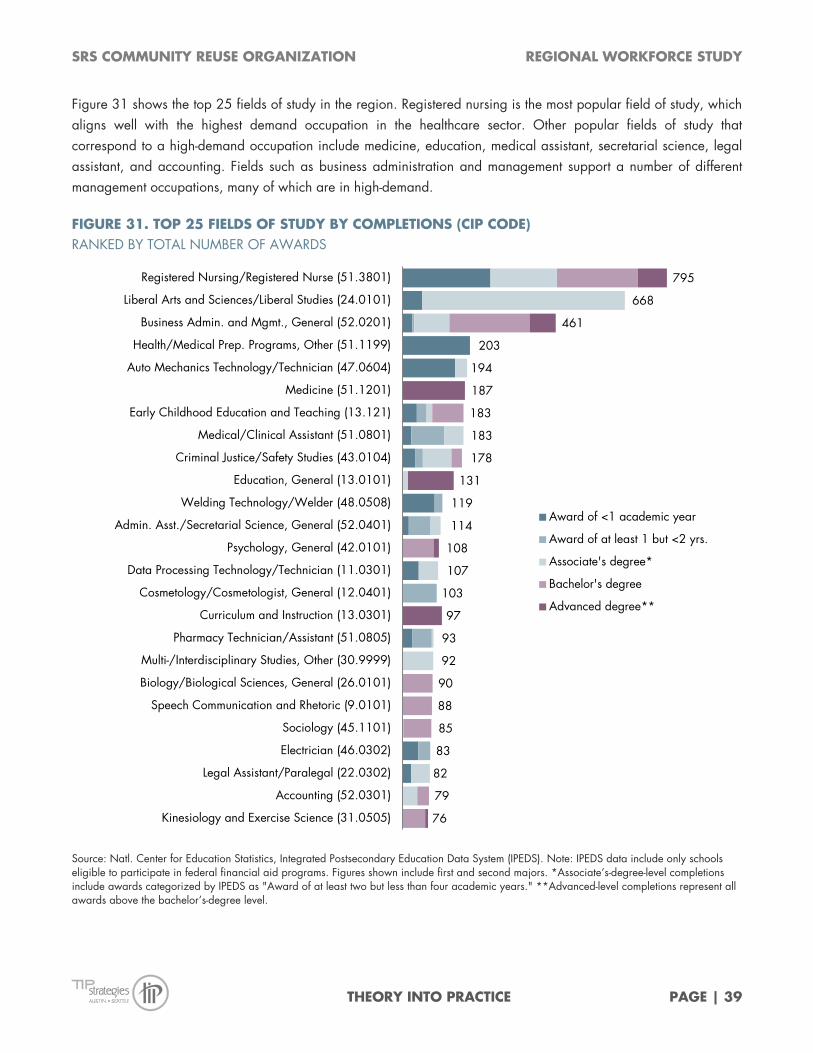
SRS COMMUNITY REUSE ORGANIZATION REGIONAL WORKFORCE STUDY
Figure 31 shows the top 25 fields of study in the region. Registered nursing is the most popular field of study, which aligns well with the highest demand occupation in the healthcare sector. Other popular fields of study that correspond to a high-demand occupation include medicine, education, medical assistant, secretarial science, legal assistant, and accounting. Fields such as business administration and management support a number of different management occupations, many of which are in high-demand.
FIGURE 31. TOP 25 FIELDS OF STUDY BY COMPLETIONS (CIP CODE) RANKED BY TOTAL NUMBER OF AWARDS
Source: Natl. Center for Education Statistics, Integrated Postsecondary Education Data System (IPEDS). Note: IPEDS data include only schools eligible to participate in federal financial aid programs. Figures shown include first and second majors. *Associate’s-degree-level completions include awards categorized by IPEDS as "Award of at least two but less than four academic years." **Advanced-level completions represent all awards above the bachelor’s-degree level.
795
668
461
203
194
187
183
183
178
131
119
114
108
107
103
97
93
92
90
88
85
83
82
79
76
Registered Nursing/Registered Nurse (51.3801)
Liberal Arts and Sciences/Liberal Studies (24.0101)
Business Admin. and Mgmt., General (52.0201)
Health/Medical Prep. Programs, Other (51.1199)
Auto Mechanics Technology/Technician (47.0604)
Medicine (51.1201)
Early Childhood Education and Teaching (13.121)
Medical/Clinical Assistant (51.0801)
Criminal Justice/Safety Studies (43.0104)
Education, General (13.0101)
Welding Technology/Welder (48.0508)
Admin. Asst./Secretarial Science, General (52.0401)
Psychology, General (42.0101)
Data Processing Technology/Technician (11.0301)
Cosmetology/Cosmetologist, General (12.0401)
Curriculum and Instruction (13.0301)
Pharmacy Technician/Assistant (51.0805)
Multi-/Interdisciplinary Studies, Other (30.9999)
Biology/Biological Sciences, General (26.0101)
Speech Communication and Rhetoric (9.0101)
Sociology (45.1101)
Electrician (46.0302)
Legal Assistant/Paralegal (22.0302)
Accounting (52.0301)
Kinesiology and Exercise Science (31.0505)
Award of <1 academic year
Award of at least 1 but <2 yrs.
Associate's degree*
Bachelor's degree
Advanced degree**
THEORY INTO PRACTICE PAGE | 39

SRS COMMUNITY REUSE ORGANIZATION REGIONAL WORKFORCE STUDY
APPENDIX B: INDUSTRY PROFILES
Organizing around industry sectors has proven to be one of the most effective ways to address workforce challenges. The SRSCRO has identified four sectors that are primary economic drivers for the region. Organizing around these sectors will provide the SRSCRO with a mechanism to facilitate employer engagement as well as provide a vehicle for interfacing with the region’s workforce training intermediaries, community colleges, school districts, and the many community-based organizations that offer workforce services. This structure can help the region better align its workforce and education assets with industry needs.
The priority sectors identified for this work are:
NUCLEAR
CYBERSECURITY/IT
MANUFACTURING
MEDICAL
The industry profiles that follow provide a base of knowledge and a common language to support a sector-based approach. Each profile includes a description of how the sector is defined, an overview of employment trends, a list of major employers in the region, key occupations and staffing patterns, demographics (age), regional education and training programs, and regional initiatives and resources.
In addition, real-time labor market information was compiled for each sector and for selected occupations. This labor market information provides insight into the types of job openings that employers are seeking to fill through online recruitment tools. This section documents the top employers posting in the region, the top occupations, the top skills, and the top certifications.
In order to supplement our quantitative analysis, we worked with the SRSCRO and its partners to conduct an online survey of regional employers. The survey asked question about current head count, hiring and training needs, and impressions of the regional workforce.
In all, 57 employers responded to the survey. Almost 70 percent of the responses were from employers in Columbia, Aiken, and Richmond counties.
FIGURE 32. RESPONDENTS BY COUNTY
Source: TIP Strategies Employer Survey.
THEORY INTO PRACTICE PAGE | 40
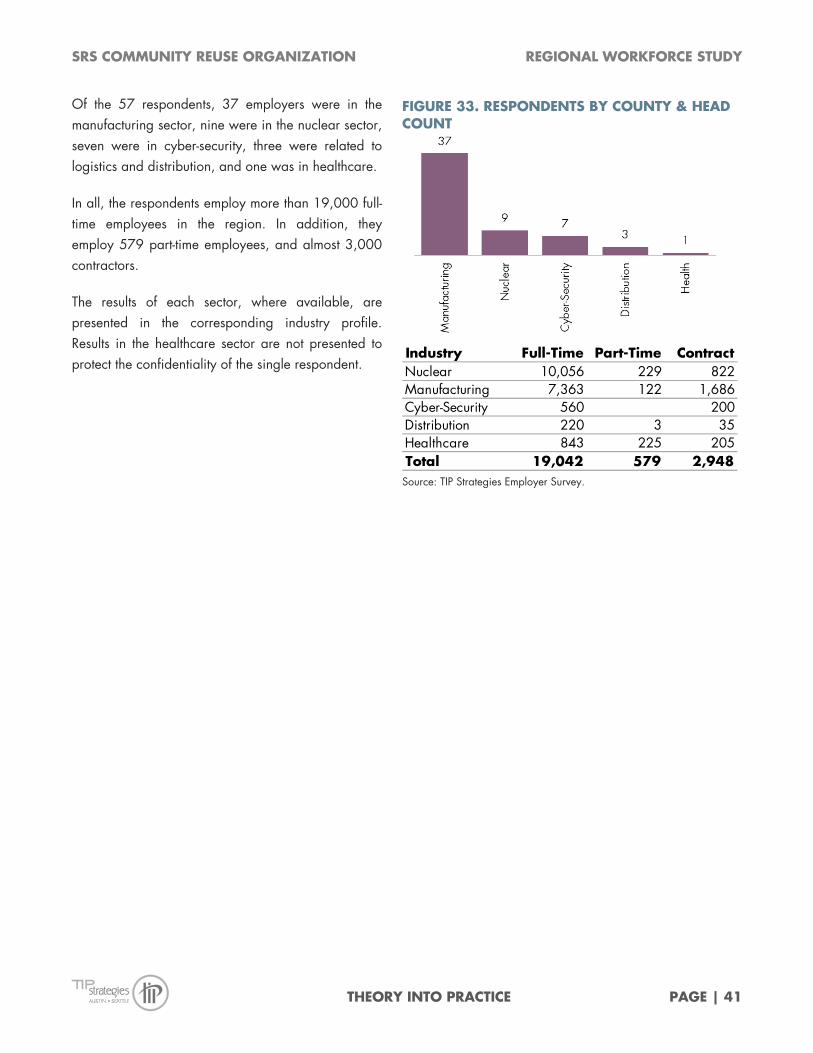
SRS COMMUNITY REUSE ORGANIZATION REGIONAL WORKFORCE STUDY
Of the 57 respondents, 37 employers were in the manufacturing sector, nine were in the nuclear sector, seven were in cyber-security, three were related to logistics and distribution, and one was in healthcare.
In all, the respondents employ more than 19,000 full-time employees in the region. In addition, they employ 579 part-time employees, and almost 3,000 contractors.
The results of each sector, where available, are presented in the corresponding industry profile. Results in the healthcare sector are not presented to protect the confidentiality of the single respondent.
FIGURE 33. RESPONDENTS BY COUNTY & HEAD COUNT
Source: TIP Strategies Employer Survey.
Industry Full-Time Part-Time ContractNuclear 10,056 229 822Manufacturing 7,363 122 1,686Cyber-Security 560 200Distribution 220 3 35Healthcare 843 225 205Total 19,042 579 2,948
THEORY INTO PRACTICE PAGE | 41

SRS COMMUNITY REUSE ORGANIZATION REGIONAL WORKFORCE STUDY
NUCLEAR
OVERVIEW. The nuclear industry plays an important role in the region surrounding the Savannah River Site (SRS). Employers in the industry reported employing 10,056 full-time employees, 822 contractors, and 229 part-time employees.
However, industry classification systems do not adequately capture nuclear-related activities, making it difficult to document employment in the sector. Studies conducted by Booz Allen Hamilton for the SRSCRO have helped define the workforce needs for the industry along four categories: professional, engineers, technicians, and craft workers. In the absence of specific industry data, these occupational categories were used in this analysis. Figures do not represent workers in the nuclear industry, but rather provide a sense of the workforce that is available to support the sector.
FIGURE 34. SELECTED EMPLOYERS - NUCLEAR Company
CB&I AREVA MOX Services
Department of Energy – Environmental Management – Savannah River Operations Office
Department of Energy – National Nuclear Security Administration
EnergySolutions
Parsons
Savannah River Nuclear Solutions
Savannah River Remediation
Southern Nuclear Company
Source: SRSCRO, TIP Strategies research.
FIGURE 35. EMPLOYMENT TRENDS, 2004 TO 2014 - NUCLEAR (OCCUPATION-BASED)
TOTAL EMPLOYMENT IN RELATED OCCUPATIONS GAINS/LOSSES BY GROUP (2004 = 1.00)
Source: EMSI 2014.3 – QCEW Employees, Non-QCEW Employees, and Self-Employed.
0
10,000
20,000
30,000
40,000
50,000
2004
2005
2006
2007
2008
2009
2010
2011
2012
2013
2014
TechniciansEngineersProfessional (mgmt./scientists/IT)Craft (skilled trades)
0.50
0.75
1.00
1.25
1.50
1.75
2004
2005
2006
2007
2008
2009
2010
2011
2012
2013
2014
2004
= 1
.00
TechniciansEngineersProfessional (mgmt./scientists/IT)Craft (skilled trades)
THEORY INTO PRACTICE PAGE | 42

SRS COMMUNITY REUSE ORGANIZATION REGIONAL WORKFORCE STUDY
NUCLEAR (CONTINUED) KEY OCCUPATIONS. Figure 36 provides an overview of the occupations that support the regional nuclear industry. In the professional category, the region has a high concentration of production clerks and nuclear power reactor operators in comparison to the nation. Industrial production managers is the only occupation in which the median hourly earnings is more than ten percent above the national median. In the technicians category, the region has a high concentration of inspectors, environmental engineering technicians, and nuclear technicians. Chemical technicians, environmental engineering technicians, and control/valve installation and repairers are occupations in which the median hourly earnings is more than ten percent of the US median.
FIGURE 36. SHARE OF EMPLOYMENT IN SELECTED INDUSTRIES – NUCLEAR OCCUPATIONS INCLUDES 2014 LOCATION QUOTIENT (LQ) AND WAGE RATE COMPARISON RELATIVE TO US
Source: EMSI 2014.3 – QCEW Employees, Non-QCEW Employees, and Self-Employed. Notes: Indicates occupation was identified as a high demand occupation (HDO), see page 35. LQs greater than 1.25 are highlighted, as are wage rates above the regional average ($17.96). Marker indicates median hourly wages ≥110% of US () or ≤80% of US (). Continued next page
HD
O SOC Code Description N
ucl
ear
Pow
er G
en.
NA
ICS
2211
13
Hea
vy C
onst
ruct
ion
NA
ICS
2371
Mis
c. F
ab. M
etal
NA
ICS
3329
Fed. G
ovt
., C
ivilia
nN
AIC
S 90
11
PROFESSIONAL49-1011 First-Line Supvsr., Mechanics, Install, & Repair 1,320 1.23 $26.10 0.89 2.3% 1.9% 0.2% -
13-1111 Management Analysts 1,245 0.70 $30.58 0.84 0.8% - 0.1% 1.9%
43-5061 Production, Planning, & Expediting Clerks 909 1.29 $20.68 0.96 0.3% 0.1% 0.6% -
11-9021 Construction Managers 750 0.85 $27.25 0.88 0.1% 1.7% - -
13-1151 Training & Development Specialists 479 0.85 $24.22 0.88 0.4% - 0.1% -
11-3051 Industrial Production Managers 432 1.06 $49.16 1.14 0.5% - 1.3% -
15-1152 Computer Network Support Specialists 307 0.71 $29.97 1.04 0.1% 0.1% - -
17-2072 Electronics Engineers, Except Computer 295 0.88 $44.02 0.97 0.1% 0.1% - 1.1%
15-1133 Software Developers, Systems Software 294 0.31 $31.82 0.66 0.1% - - -
29-9011 Occupational Health & Safety Specialists 163 1.05 $28.14 0.86 0.3% 0.1% 0.1% -
17-3026 Industrial Engineering Technicians 107 0.65 $21.28 0.85 - - 0.3% -
19-2031 Chemists 104 0.49 $34.29 0.99 0.1% - - -
51-8011 Nuclear Power Reactor Operators 84 4.44 $35.74 0.95 2.3% - - -
11-9161 Emergency Management Directors 23 0.98 $25.48 0.84 - - - -
19-2012 Physicists 17 0.39 $47.97 0.91 - - - -
TECHNICIANS51-9061 Inspectors, Testers, Sorters, Samplers, & Weighers 1,580 1.33 $16.23 0.96 0.5% 0.1% 7.0% -
17-3023 Electrical & Electronics Eng. Technicians 291 0.84 $29.26 1.04 0.9% - 0.1% -
19-4031 Chemical Technicians 190 1.21 $23.51 1.13 0.2% - 0.1% -
17-3013 Mechanical Drafters 176 1.12 $21.53 0.87 - - 0.5% -
17-3025 Environmental Engineering Techs. 103 2.36 $28.87 1.30 0.1% - - -
17-3029 Engineering Techs., Except Drafters, All Other 96 0.58 $30.40 1.05 0.1% - 0.1% -
49-9012 Control/Valve Install. & Repair, Except Mech.Door 95 0.96 $28.69 1.13 2.2% 0.2% 0.2% -
19-4051 Nuclear Technicians 39 2.43 $35.90 1.03 1.1% - - -
Jobs in CRO 9-County
Laborshed (2014)
Median Hourly
Earnings
Relative to US
(US=1.00)20
14
Em
p.
LQ
(US
= 1.
00)
Share of employment in:
THEORY INTO PRACTICE PAGE | 43

SRS COMMUNITY REUSE ORGANIZATION REGIONAL WORKFORCE STUDY
NUCLEAR (CONTINUED) In the engineering category, the region has a high concentration of civil, mechanical, nuclear, and health and safety engineers. Only mechanical engineers earn a wage premium more than ten percent over the US median. In the craft and skill trade category, the region has a high concentration of sheet metal workers, structural metal workers, insulation workers, millwrights, reinforcing iron workers, and boilermakers. Only structural iron metal workers earn a wage premium of more than ten percent.
FIGURE 36. SHARE OF EMPLOYMENT IN SELECTED INDUSTRIES – NUCLEAR OCCUPATIONS (CONT.) INCLUDES 2014 LOCATION QUOTIENT (LQ) AND WAGE RATE COMPARISON RELATIVE TO US
Source: EMSI 2014.3 – QCEW Employees, Non-QCEW Employees, and Self-Employed. Notes: Indicates occupation was identified as a high demand occupation (HDO), see page 35. LQs greater than 1.25 are highlighted, as are wage rates above the regional average ($17.96). Marker indicates median hourly wages ≥110% of US () or ≤80% of US ().
HD
O SOC Code Description N
ucl
ear
Pow
er G
en.
NA
ICS
2211
13
Hea
vy C
onst
ruct
ion
NA
ICS
2371
Mis
c. F
ab. M
etal
NA
ICS
3329
Fed. G
ovt
., C
ivilia
nN
AIC
S 90
11
ENGINEERS 17-2051 Civil Engineers 1,617 2.38 $40.41 1.05 1.2% 0.5% 0.2% -
17-2141 Mechanical Engineers 1,178 1.84 $45.17 1.15 0.9% - 5.4% 0.6%
17-2071 Electrical Engineers 498 1.20 $37.30 0.87 4.9% 0.3% 0.3% -
17-2081 Environmental Engineers 308 2.35 $35.42 0.90 0.4% - 0.1% -
17-2161 Nuclear Engineers 249 5.55 $41.37 0.87 9.7% - 0.4% -
17-2111 Health & Safety Eng., Except Mine Safety 147 2.52 $39.90 1.05 0.1% 0.5% 0.1% -
17-2041 Chemical Engineers 72 0.87 $38.14 0.83 0.1% - - -
17-2131 Materials Engineers 37 0.63 $38.15 0.91 - - 0.1% -
17-2061 Computer Hardware Engineers 35 0.18 $44.14 0.89 - - - -
CRAFT/SKILLED TRADES 53-3032 Heavy & Tractor-Trailer Truck Drivers 4,593 1.04 $18.32 1.00 - 1.9% 0.1% -
47-2061 Construction Laborers 3,618 1.22 $12.93 0.91 0.2% 25.0% 0.1% -
47-2031 Carpenters 2,728 1.12 $18.92 1.09 0.1% 2.4% 0.1% -
47-2111 Electricians 1,465 0.97 $18.17 0.78 1.4% 3.1% 0.4% -
53-7051 Industrial Truck & Tractor Operators 1,406 1.12 $12.92 0.87 0.1% 0.3% 0.3% -
47-2152 Plumbers, Pipefitters, & Steamfitters 1,015 1.02 $17.86 0.77 0.1% 1.9% 0.1% -
51-4121 Welders, Cutters, Solderers, & Brazers 936 1.01 $17.57 1.00 0.2% 1.7% 3.0% -
47-2073 Operating Eng. & Other Constr. Equip. Operators 829 0.93 $16.69 0.82 0.1% 9.0% - -
51-4041 Machinists 653 0.67 $17.99 0.95 0.1% - 4.4% -
47-2211 Sheet Metal Workers 513 1.46 $21.18 1.01 - - 0.8% -
47-2221 Structural Iron & Steel Workers 370 2.46 $25.48 1.16 - 1.6% 0.1% -
47-2051 Cement Masons & Concrete Finishers 344 0.91 $16.47 0.95 - 0.7% - -
47-2132 Insulation Workers, Mechanical 173 2.35 $14.60 0.75 - 0.4% - -
49-9044 Millwrights 149 1.53 $22.11 0.92 - 0.2% 0.1% -
47-2131 Insulation Workers, Floor, Ceiling, & Wall 101 1.61 $15.67 1.00 - - - -
47-2171 Reinforcing Iron & Rebar Workers 88 1.99 $24.56 1.00 - 0.1% - -
47-2011 Boilermakers 65 1.64 $24.53 0.88 - 0.5% 0.1% -
49-9096 Riggers 29 0.64 $19.69 0.97 - 0.1% - -
Jobs in CRO 9-County
Laborshed (2014)
Median Hourly
Earnings
Relative to US
(US=1.00)20
14
Em
p.
LQ
(US
= 1.
00)
Share of employment in:
THEORY INTO PRACTICE PAGE | 44

SRS COMMUNITY REUSE ORGANIZATION REGIONAL WORKFORCE STUDY
NUCLEAR (CONTINUED) DEMAND. Figure 37 details occupational demand and selected demographic characteristics for each of the key occupations that support the nuclear sector.
In the professional category, first-line supervisors, management analysts, and production clerks are the occupations with the largest number of projected openings. In the technicians category, inspectors, electrical technicians, and chemical technicians are the occupations with the largest number of projected openings. Physicists, emergency management directors, and nuclear technicians are the occupations with the largest share of workers 65 and older.
FIGURE 37. DEMAND FACTORS & DEMOGRAPHICS – NUCLEAR OCCUPATIONS INCLUDES ESTIMATED ANNUAL OPENINGS, 2014 TO 2019
Source: EMSI 2014.3 – QCEW Employees, Non-QCEW Employees, and Self-Employed. Notes: Indicates occupation was identified as a high demand occupation (HDO), see page 35. Annual openings are an estimate of job openings due to net change in employment and replacement needs (e.g., turnover, retirement). Indicates significant share of workforce is reaching retirement age (defined here as ≥ 25% age 55+ and/or ≥ 5% age 65+). Continued next page
Annual Openings (2014-19) N
ew jobs
Rep
lace
men
t
% 5
5+ Y
ears
% 6
5+ Y
ears
% M
ale
PROFESSIONAL
49-1011 First-Line Supvsr., Mechanics, Install, & Repair 1,320 54 29% 71% 27% 3% 94%
13-1111 Management Analysts 1,245 38 45% 55% 31% 9% 57%
43-5061 Production, Planning, & Expediting Clerks 909 30 19% 81% 22% 3% 48%
11-9021 Construction Managers 750 19 - 100% 26% 6% 92%
13-1151 Training & Development Specialists 479 19 50% 50% 20% 3% 33%
11-3051 Industrial Production Managers 432 10 - 100% 23% 1% 87%
15-1152 Computer Network Support Specialists 307 9 41% 59% 13% 2% 70%
17-2072 Electronics Engineers, Except Computer 295 11 27% 73% 24% 4% 92%
15-1133 Software Developers, Systems Software 294 13 67% 33% 12% 2% 79%
29-9011 Occupational Health & Safety Specialists 163 6 19% 81% 26% 3% 64%
17-3026 Industrial Engineering Technicians 107 3 - 100% 25% 5% 82%
19-2031 Chemists 104 4 18% 82% 26% 5% 66%
51-8011 Nuclear Power Reactor Operators 84 6 53% 47% 30% 6% 88%
11-9161 Emergency Management Directors 23 - - - 43% 21% 52%
19-2012 Physicists 17 - - - 59% 29% 82%
TECHNICIANS
51-9061 Inspectors, Testers, Sorters, Samplers, & Weighers 1,580 47 12% 88% 26% 4% 58%
17-3023 Electrical & Electronics Eng. Technicians 291 10 34% 66% 24% 2% 83%
19-4031 Chemical Technicians 190 6 5% 95% 28% 3% 68%
17-3013 Mechanical Drafters 176 4 - 100% 21% 3% 84%
17-3025 Environmental Engineering Techs. 103 3 - 100% 35% 5% 85%
17-3029 Engineering Techs., Except Drafters, All Other 96 3 25% 75% 26% 5% 83%
49-9012 Control/Valve Install. & Repair, Except Mech.Door 95 6 44% 56% 31% 5% 92%
19-4051 Nuclear Technicians 39 3 36% 64% 25% 13% 67%
Demand Factors Demographics
HD
O SOC Code Description
Jobs in CRO 9-County
Laborshed (2014)
THEORY INTO PRACTICE PAGE | 45

SRS COMMUNITY REUSE ORGANIZATION REGIONAL WORKFORCE STUDY
NUCLEAR (CONTINUED) In the engineers category, civil, mechanical, and electrical engineers are the occupations with the highest number of openings. In the skilled trades category, truck drivers, construction laborers, and carpenters are the occupations with the highest number of openings. Riggers, computer hardware engineers, and materials engineers are the occupations with the largest share of workers who are 65 and older.
FIGURE 6. DEMAND FACTORS & DEMOGRAPHICS – NUCLEAR OCCUPATIONS (CONT.) INCLUDES ESTIMATED ANNUAL OPENINGS, 2014 TO 2019
Source: EMSI 2014.3 – QCEW Employees, Non-QCEW Employees, and Self-Employed. Notes: Indicates occupation was identified as a high demand occupation (HDO), see page 35. Annual openings are an estimate of job openings due to net change in employment and replacement needs (e.g., turnover, retirement). Indicates significant share of workforce is reaching retirement age (defined here as ≥25% age 55+ and/or ≥ 5% age 65+).
Annual Openings (2014-19) N
ew jobs
Rep
lace
men
t
% 5
5+ Y
ears
% 6
5+ Y
ears
% M
ale
ENGINEERS
17-2051 Civil Engineers 1,617 81 47% 53% 32% 7% 88%
17-2141 Mechanical Engineers 1,178 52 17% 83% 24% 4% 94%
17-2071 Electrical Engineers 498 27 54% 46% 28% 4% 92%
17-2081 Environmental Engineers 308 9 - 100% 27% 2% 76%
17-2161 Nuclear Engineers 249 11 31% 69% 30% 4% 85%
17-2111 Health & Safety Eng., Except Mine Safety 147 5 - 100% 32% 3% 82%
17-2041 Chemical Engineers 72 3 35% 65% 30% 7% 89%
17-2131 Materials Engineers 37 - - - 27% 13% 89%
17-2061 Computer Hardware Engineers 35 2 54% 46% 29% 14% 86%
CRAFT/SKILLED TRADES
53-3032 Heavy & Tractor-Trailer Truck Drivers 4,593 107 12% 88% 27% 6% 96%
47-2061 Construction Laborers 3,618 85 - 100% 15% 3% 96%
47-2031 Carpenters 2,728 52 - 100% 19% 3% 98%
47-2111 Electricians 1,465 30 - 100% 18% 3% 97%
53-7051 Industrial Truck & Tractor Operators 1,406 50 11% 89% 15% 2% 92%
47-2152 Plumbers, Pipefitters, & Steamfitters 1,015 60 65% 35% 15% 3% 98%
51-4121 Welders, Cutters, Solderers, & Brazers 936 27 - 100% 18% 2% 95%
47-2073 Operating Eng. & Other Constr. Equip. Operators 829 24 1% 99% 26% 6% 97%
51-4041 Machinists 653 25 37% 63% 26% 5% 95%
47-2211 Sheet Metal Workers 513 24 48% 52% 15% 2% 97%
47-2221 Structural Iron & Steel Workers 370 16 - 100% 20% 1% 97%
47-2051 Cement Masons & Concrete Finishers 344 5 - 100% 14% 1% 98%
47-2132 Insulation Workers, Mechanical 173 7 43% 57% 13% 3% 94%
49-9044 Millwrights 149 5 42% 58% 33% 3% 97%
47-2131 Insulation Workers, Floor, Ceiling, & Wall 101 - - - 18% 5% 94%
47-2171 Reinforcing Iron & Rebar Workers 88 2 - 100% 11% 6% 99%
47-2011 Boilermakers 65 3 - 100% 28% 8% 97%
49-9096 Riggers 29 - - - 35% 17% 97%
Demand Factors Demographics
HD
O SOC Code Description
Jobs in CRO 9-County
Laborshed (2014)
THEORY INTO PRACTICE PAGE | 46
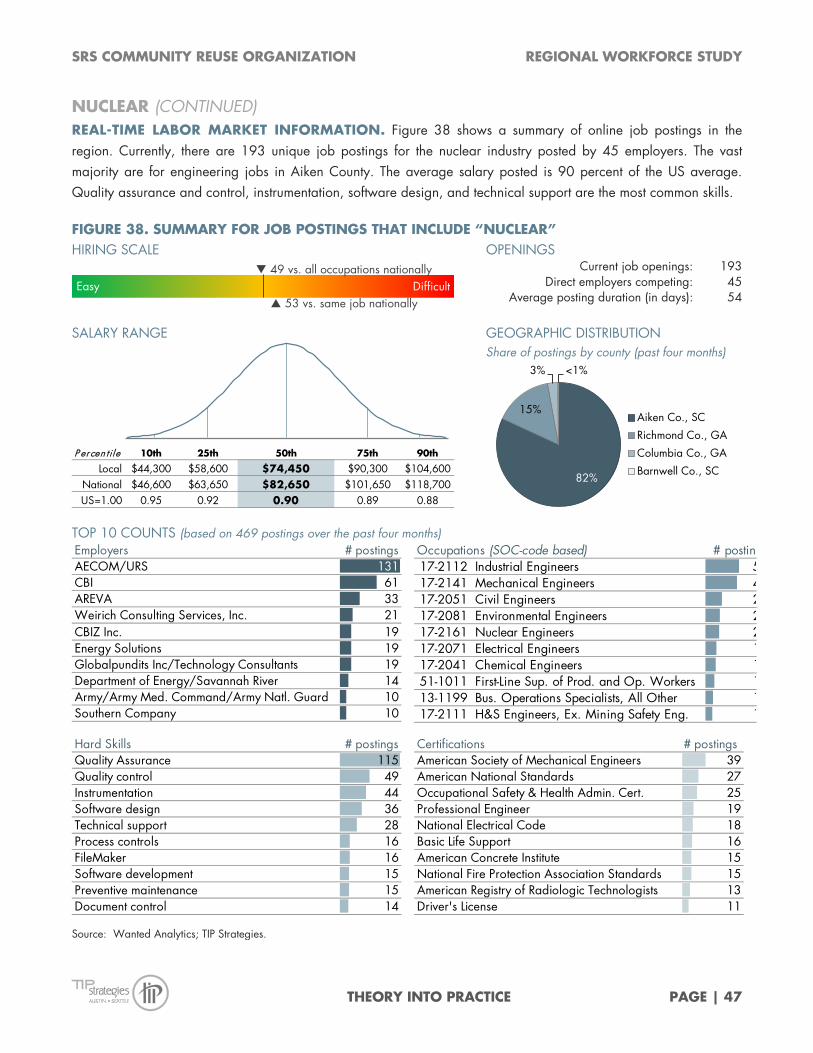
SRS COMMUNITY REUSE ORGANIZATION REGIONAL WORKFORCE STUDY
NUCLEAR (CONTINUED) REAL-TIME LABOR MARKET INFORMATION. Figure 38 shows a summary of online job postings in the region. Currently, there are 193 unique job postings for the nuclear industry posted by 45 employers. The vast majority are for engineering jobs in Aiken County. The average salary posted is 90 percent of the US average. Quality assurance and control, instrumentation, software design, and technical support are the most common skills.
FIGURE 38. SUMMARY FOR JOB POSTINGS THAT INCLUDE “NUCLEAR” HIRING SCALE OPENINGS
Current job openings: 193 Direct employers competing: 45
Average posting duration (in days): 54
SALARY RANGE GEOGRAPHIC DISTRIBUTION
Share of postings by county (past four months)
TOP 10 COUNTS (based on 469 postings over the past four months)
Source: Wanted Analytics; TIP Strategies.
Easy Difficult 53 vs. same job nationally
49 vs. all occupations nationally
P ercen tile 10th 25th 50th 75th 90th
Local $44,300 $58,600 $74,450 $90,300 $104,600National $46,600 $63,650 $82,650 $101,650 $118,700US=1.00 0.95 0.92 0.90 0.89 0.88
82%
15%
3% <1%
Aiken Co., SC
Richmond Co., GA
Columbia Co., GA
Barnwell Co., SC
Employers # postingsAECOM/URS 131CBI 61AREVA 33Weirich Consulting Services, Inc. 21CBIZ Inc. 19Energy Solutions 19Globalpundits Inc/Technology Consultants 19Department of Energy/Savannah River 14Army/Army Med. Command/Army Natl. Guard 10Southern Company 10
Occupations (SOC-code based) # posting17-2112 Industrial Engineers 517-2141 Mechanical Engineers 417-2051 Civil Engineers 217-2081 Environmental Engineers 217-2161 Nuclear Engineers 217-2071 Electrical Engineers 117-2041 Chemical Engineers 151-1011 First-Line Sup. of Prod. and Op. Workers 113-1199 Bus. Operations Specialists, All Other 117-2111 H&S Engineers, Ex. Mining Safety Eng. 1
Hard Skills # postingsQuality Assurance 115Quality control 49Instrumentation 44Software design 36Technical support 28Process controls 16FileMaker 16Software development 15Preventive maintenance 15Document control 14
Certifications # postingsAmerican Society of Mechanical Engineers 39American National Standards 27Occupational Safety & Health Admin. Cert. 25Professional Engineer 19National Electrical Code 18Basic Life Support 16American Concrete Institute 15National Fire Protection Association Standards 15American Registry of Radiologic Technologists 13Driver's License 11
THEORY INTO PRACTICE PAGE | 47

SRS COMMUNITY REUSE ORGANIZATION REGIONAL WORKFORCE STUDY
NUCLEAR (CONTINUED) FIGURE 39. REAL-TIME LMI, SELECTED NUCLEAR OCCUPATIONS
17-2051 CIVIL ENGINEERS HIRING SCALE OPENINGS
Current job openings: 22 Direct employers competing: 12
Average posting duration (in days): 53
SALARY RANGE TOP SKILLS
P ercen t ile 10th 25th 50th 75th 90th Local $49,100 $65,000 $82,150 $99,300 $115,150
National $59,150 $70,600 $83,350 $96,100 $107,600 US=1.00 0.83 0.92 0.99 1.03 1.07
Inspect buildings |Quality assurance | Structural Eng. | Computer-aided design (CAD)/3-D CAD| Technical support | Bentley Microstation | Instrumentation | Non-conformances | Data reduction | Environmental consulting
17-2081 ENVIRONMENTAL ENGINEERS HIRING SCALE OPENINGS
Current job openings: 19 Direct employers competing: —
Average posting duration (in days): 45
SALARY RANGE TOP SKILLS
P ercen t ile 10th 25th 50th 75th 90th Local $61,650 $69,200 $77,300 $85,400 $92,950
National $56,600 $68,950 $82,600 $96,300 $108,600 US=1.00 1.09 1.00 0.94 0.89 0.86
Bechtel Software SETROUTE | Equip. maint. | C sharp | Bentley Microstation | System develop- ment | ESRI ArcGIS/ArcGIS Geostatistical Analyst | Technical support | MS Access| C/C++
17-2161 NUCLEAR ENGINEERS HIRING SCALE OPENINGS
Current job openings: 7 Direct employers competing: 4
Average posting duration (in days): 41
SALARY RANGE TOP SKILLS
P ercen t ile 10th 25th 50th 75th 90th Local $98,300 $102,550 $106,850 $111,150 $115,400
National $90,050 $97,550 $105,850 $114,150 $121,650 US=1.00 1.09 1.05 1.01 0.97 0.95
Technical support | Quality assurance | Risk assessment | Software design | Hazard assess- ment | Probabilistic risk assessment software | Preventive maintenance | Performance testing | Instrumentation | Failure rate database
17-2071 ELECTRICAL ENGINEERS HIRING SCALE OPENINGS
Current job openings: 25 Direct employers competing: 15
Average posting duration (in days): 50
SALARY RANGE TOP SKILLS
P ercen t ile 10th 25th 50th 75th 90th Local $69,750 $74,700 $80,100 $85,500 $90,500
National $64,100 $73,800 $84,600 $95,350 $105,100 US=1.00 1.09 1.01 0.95 0.90 0.86
Instrumentation | Process controls | Technical sup-port | Electrical systems | Computer aided design (CAD)\Autodesk AutoCAD | Good Manufacturing Practice | Power system modeling | Quality assurance | Bentley Microstation | Lean mfg.
Source: Wanted Analytics; TIP Strategies.
Easy Difficult 7 vs. same job nationally
34 vs. all occupations nationally
Easy Difficult—insufficient data to calculate local hiring scale
49 vs. all occupations nationally
Easy Difficult 56 vs. same job nationally
48 vs. all occupations nationally
Easy Difficult74 vs. same job nationally
63 vs. all occupations nationally
THEORY INTO PRACTICE PAGE | 48

SRS COMMUNITY REUSE ORGANIZATION REGIONAL WORKFORCE STUDY
NUCLEAR (CONTINUED) Seven nuclear employers participated in the survey. Of those participants, 86 percent plan to hire additional employees over the next two years. These employers estimated that they will add almost 800 workers. The majority of these workers (67 percent) will be in professional and skilled craft occupations.
Respondents indicated that most positions take between one and three months to fill. Management and engineering positions take four to six months for some employers.
FIGURE 40. FINDINGS FROM EMPLOYER SURVEY – NUCLEAR FIRMS
OVER THE NEXT 2 YEARS, DO YOU PLAN TO HIRE ADDITIONAL EMPLOYEES WITHIN THE CRO REGION?
APPROXIMATELY HOW MANY WORKERS DO YOU PLAN TO ADD IN EACH OF THE FOLLOWING CATEGORIES?
APPROXIMATELY HOW LONG DOES IT TYPICALLY TAKE TO FILL A VACANCY FOR EACH OF THE FOLLOWING CLASSIFICATIONS OF WORKERS?
Not sure14%
Yes86%
n=7
288244
83 8253 45
Prof
essi
onal
Skill
ed C
raft
Engi
neer
Oth
er
Tech
nici
an
Man
agem
ent
40% 20%
20%
60%
100%
83%
80%
40%
40%
17%
0% 20% 40% 60% 80% 100%
Management
Professional
Engineer
Technician
Skilled Craft
Not applicable
Less than 2 weeks
2 to 4 weeks
1 to 3 months
4 to 6 months
More than 6 months
THEORY INTO PRACTICE PAGE | 49

SRS COMMUNITY REUSE ORGANIZATION REGIONAL WORKFORCE STUDY
NUCLEAR (CONTINUED) FIGURE 41. FINDINGS FROM EMPLOYER SURVEY—NUCLEAR FIRMS Few respondents had positions that they could not fill. Though many employers reported that there were occupations and skills that are difficult to find, there was little agreement about which ones. Engineers were cited as difficult to fill for four employers, and information technology was reported difficult to find for three employers. Quality assurance expertise was cited as difficult to find by two respondents.
Overall, nuclear employers rate the regional workforce as fair to good. The reliability of the workforce was ranked highest. The math skills of the workforce received mixed ratings. Job readiness, trainability, and computer skills were ranked lowest.
ARE THERE SPECIFIC OCCUPATIONS WHICH YOU HAVE BEEN UNABLE TO FILL AT ALL?
Information System Security Officer
WHICH OCCUPATIONS ARE DIFFICULT TO RECRUIT IN YOUR INDUSTRY?
WHICH SKILLS ARE DIFFICULT TO FIND IN YOUR INDUSTRY?
Construction Field Engineers/Planners Cyber Security Specialists Engineers (4) - Civil, Electrical Fire Protection Engineers Scientists System Operators Training Instructors Welders Welding Engineers
Contracting Engineering Fire Protection Specialists Human Resources Information Technology (3) Nuclear Criticality Specialists Soft Skills in Entry Level Positons Piping Design Planners Qual. Assurance (2) - NQA-1 Expertise
HOW WOULD YOU RATE THE REGIONAL WORKFORCE OVERALL ON THE FOLLOWING CHARACTERISTICS?
No86%
Yes14%
n=7
17%
17%
33%17%
33%67%67%33%67%67%67%
50%67%
50%17%
33%
50%33%33%
50%33%33%
17%33%
50%17%
33%
17%17%
33%
33%17%
0% 20% 40% 60% 80% 100%
Job readinessEntry-level skills
AdaptibilityTrainability
Employee attitudesProfessionalismTeamwork skills
ProductivityReliability
Communication skillsMath skills
Computer skills
No opinion Poor Fair Good Excellent
THEORY INTO PRACTICE PAGE | 50

SRS COMMUNITY REUSE ORGANIZATION REGIONAL WORKFORCE STUDY
NUCLEAR (CONTINUED) EDUCATION & TRAINING. Figure 42 and Figure 43 show the wages, the typical requirements for entry into specific occupations, and the for-credit completions from regional postsecondary institutions in fields of study relevant to the nuclear industry’s key occupations.
Occupations that support the nuclear industry are, for the most part, relatively high-wage occupations with even the bottom 10th percentile making hourly earnings more than the regional median of $17.96.
Almost all of the occupations are considered to be middle- or high-skill occupations. Middle-skill occupations are those that require a high school diploma and some training but less than a bachelor’s degree. High-skill occupations require a bachelor’s degree or higher. Even those jobs that do not require a high school diploma require short to moderate-term on-the-job training or apprenticeships.
FIGURE 42. EDUCATION & TRAINING REQUIREMENTS – NUCLEAR OCCUPATIONS WITH HOURLY EARNINGS FOR SELECTED PERCENTILES, INCLUDING MEDIAN (50TH)
Source: EMSI 2014.3 – QCEW Employees, Non-QCEW Employees, and Self-Employed. Continued next page
10th 50th 90th Education Experience
PROFESSIONAL49-1011 First-Line Supvsr., Mechanics, Install, & Repair $16.36 $26.10 $41.07 HS or equivalent < 5 years None
13-1111 Management Analysts $18.29 $30.58 $49.67 Bachelor's < 5 years None
43-5061 Production, Planning, & Expediting Clerks $12.89 $20.68 $35.04 HS or equivalent None Moderate-term OJT
11-9021 Construction Managers $19.14 $27.25 $40.08 Bachelor's None Moderate-term OJT
13-1151 Training & Development Specialists $15.00 $24.22 $40.55 Bachelor's < 5 years None
11-3051 Industrial Production Managers $30.05 $49.16 $84.21 Bachelor's 5+ years None
15-1152 Computer Network Support Specialists $17.93 $29.97 $44.54 Associate's None None
17-2072 Electronics Engineers, Except Computer $29.53 $44.02 $65.36 Bachelor's None None
15-1133 Software Developers, Systems Software $19.14 $31.82 $48.57 Bachelor's None None
29-9011 Occupational Health & Safety Specialists $18.42 $28.14 $44.88 Bachelor's None Short-term OJT
17-3026 Industrial Engineering Technicians $15.44 $21.28 $29.52 Associate's None None
19-2031 Chemists $20.59 $34.29 $49.12 Bachelor's None None
51-8011 Nuclear Power Reactor Operators $26.38 $35.74 $45.45 HS or equivalent None Long-term OJT
11-9161 Emergency Management Directors $16.84 $25.48 $42.19 Bachelor's 5+ years None
19-2012 Physicists $34.84 $47.97 $63.92 Advanced degree None None
TECHNICIANS51-9061 Inspectors, Testers, Sorters, Samplers, & Weighers $10.30 $16.23 $24.56 HS or equivalent None Moderate-term OJT
17-3023 Electrical & Electronics Eng. Technicians $17.99 $29.26 $39.29 Associate's None None
19-4031 Chemical Technicians $15.79 $23.51 $33.05 Associate's None Moderate-term OJT
17-3013 Mechanical Drafters $15.82 $21.53 $34.75 Associate's None None
17-3025 Environmental Engineering Techs. $15.28 $28.87 $42.23 Associate's None None
17-3029 Engineering Techs., Except Drafters, All Other $16.37 $30.40 $41.82 Associate's None None
49-9012 Control/Valve Install. & Repair, Except Mech.Door $13.56 $28.69 $38.50 HS or equivalent None Moderate-term OJT
19-4051 Nuclear Technicians $27.27 $35.90 $43.07 Associate's None Moderate-term OJT
HD
O SOC Code Description
Training Required For Competency
Hourly Earnings (percentiles)
Typical Requirements for Entry into Occupation:
THEORY INTO PRACTICE PAGE | 51
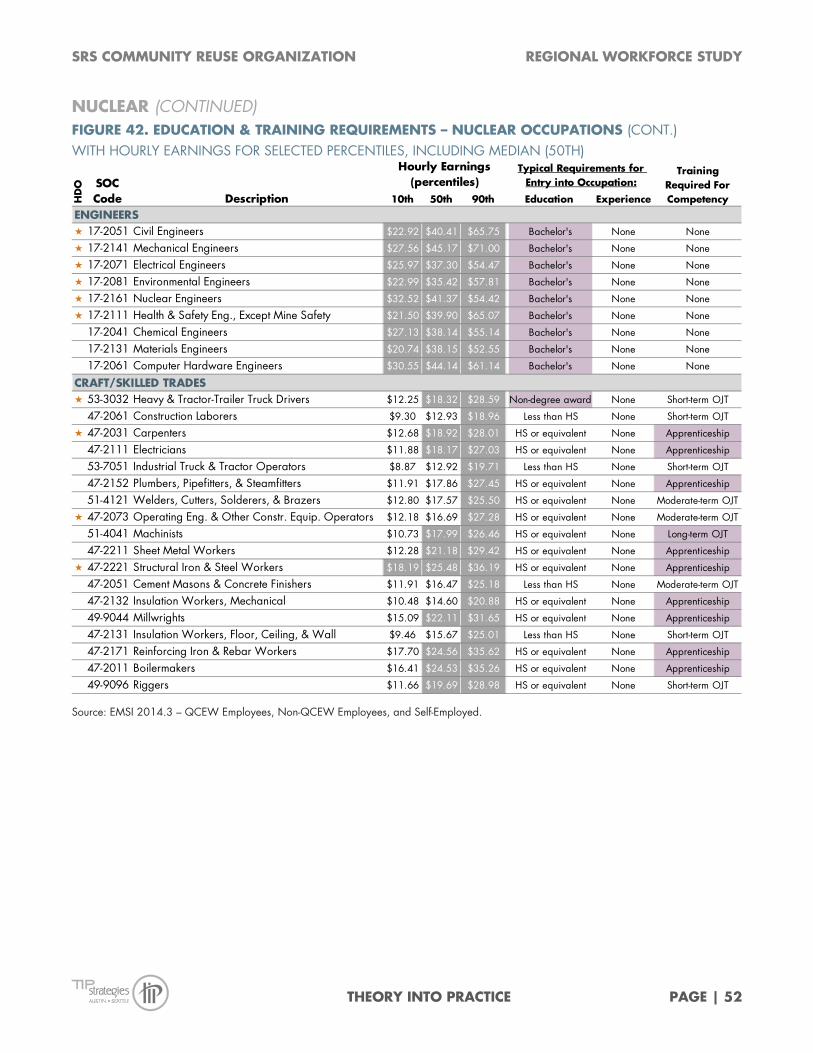
SRS COMMUNITY REUSE ORGANIZATION REGIONAL WORKFORCE STUDY
NUCLEAR (CONTINUED) FIGURE 42. EDUCATION & TRAINING REQUIREMENTS – NUCLEAR OCCUPATIONS (CONT.) WITH HOURLY EARNINGS FOR SELECTED PERCENTILES, INCLUDING MEDIAN (50TH)
Source: EMSI 2014.3 – QCEW Employees, Non-QCEW Employees, and Self-Employed.
10th 50th 90th Education Experience
ENGINEERS 17-2051 Civil Engineers $22.92 $40.41 $65.75 Bachelor's None None
17-2141 Mechanical Engineers $27.56 $45.17 $71.00 Bachelor's None None
17-2071 Electrical Engineers $25.97 $37.30 $54.47 Bachelor's None None
17-2081 Environmental Engineers $22.99 $35.42 $57.81 Bachelor's None None
17-2161 Nuclear Engineers $32.52 $41.37 $54.42 Bachelor's None None
17-2111 Health & Safety Eng., Except Mine Safety $21.50 $39.90 $65.07 Bachelor's None None
17-2041 Chemical Engineers $27.13 $38.14 $55.14 Bachelor's None None
17-2131 Materials Engineers $20.74 $38.15 $52.55 Bachelor's None None
17-2061 Computer Hardware Engineers $30.55 $44.14 $61.14 Bachelor's None None
CRAFT/SKILLED TRADES 53-3032 Heavy & Tractor-Trailer Truck Drivers $12.25 $18.32 $28.59 Non-degree award None Short-term OJT
47-2061 Construction Laborers $9.30 $12.93 $18.96 Less than HS None Short-term OJT
47-2031 Carpenters $12.68 $18.92 $28.01 HS or equivalent None Apprenticeship
47-2111 Electricians $11.88 $18.17 $27.03 HS or equivalent None Apprenticeship
53-7051 Industrial Truck & Tractor Operators $8.87 $12.92 $19.71 Less than HS None Short-term OJT
47-2152 Plumbers, Pipefitters, & Steamfitters $11.91 $17.86 $27.45 HS or equivalent None Apprenticeship
51-4121 Welders, Cutters, Solderers, & Brazers $12.80 $17.57 $25.50 HS or equivalent None Moderate-term OJT
47-2073 Operating Eng. & Other Constr. Equip. Operators $12.18 $16.69 $27.28 HS or equivalent None Moderate-term OJT
51-4041 Machinists $10.73 $17.99 $26.46 HS or equivalent None Long-term OJT
47-2211 Sheet Metal Workers $12.28 $21.18 $29.42 HS or equivalent None Apprenticeship
47-2221 Structural Iron & Steel Workers $18.19 $25.48 $36.19 HS or equivalent None Apprenticeship
47-2051 Cement Masons & Concrete Finishers $11.91 $16.47 $25.18 Less than HS None Moderate-term OJT
47-2132 Insulation Workers, Mechanical $10.48 $14.60 $20.88 HS or equivalent None Apprenticeship
49-9044 Millwrights $15.09 $22.11 $31.65 HS or equivalent None Apprenticeship
47-2131 Insulation Workers, Floor, Ceiling, & Wall $9.46 $15.67 $25.01 Less than HS None Short-term OJT
47-2171 Reinforcing Iron & Rebar Workers $17.70 $24.56 $35.62 HS or equivalent None Apprenticeship
47-2011 Boilermakers $16.41 $24.53 $35.26 HS or equivalent None Apprenticeship
49-9096 Riggers $11.66 $19.69 $28.98 HS or equivalent None Short-term OJT
HD
O SOC Code Description
Training Required For Competency
Hourly Earnings (percentiles)
Typical Requirements for Entry into Occupation:
THEORY INTO PRACTICE PAGE | 52

SRS COMMUNITY REUSE ORGANIZATION REGIONAL WORKFORCE STUDY
NUCLEAR (CONTINUED) FIGURE 43. RELEVANT COMPLETIONS – NUCLEAR OCCUPATIONS THREE-YEAR ANNUAL AVERAGE OF DEGREES/AWARDS CONFERRED, 2011-2013
Source: National Center for Education Statistics, Integrated Postsecondary Education Data System (IPEDS) surveys; National Crosswalk Service Center; TIP Strategies. IPEDS data include only schools eligible to participate in federal financial aid programs. Figures shown include first and second majors. *Associate’s-degree-level completions include awards categorized by IPEDS as "Award of at least two but less than four academic years." **Advanced-level completions represent all awards above the bachelor’s-degree level. ***No engineering related completions were reported by the analyzed schools, except a small number of Pre-Engineering (CIP 14.0102) awards at Aiken Technical College.
CIP Code Field of Study C
ertifi
cate
( < 1
yea
r)
Cer
tifi
cate
( ≥1
yr.,
< 2
yrs
.)
Ass
oci
ate
's*
Bach
elor'
s
Adva
nce
d** Annual average
degrees/awards conferred (all levels)
PROFESSIONAL52.0201 Business Administration and Management, General 29 5 106 241 79 46111.0901 Computer Systems Networking/Telecomm. 16 11 2711.1001 Network and System Administration/Administrator 31 9 1 4140.0501 Chemistry, General 18 1852.0101 Business/Commerce, General 18 1811.0201 Computer Programming/Programmer, General 8 9 1841.0205 Nuclear/Nuclear Power Technology/Technician 16 1611.0202 Computer Programming, Specific Applications 8 815.1001 Construction Engineering Technology/Technician 8 811.0103 Information Technology 6 640.0801 Physics, General 3 343.0301 Homeland Security 2 252.1001
g General 2 1 3
52.0205 Operations Management and Supervision 1 1 2
ENGINEERS14.0102 Pre-Engineering*** 6 6
TECHNICIAN15.0303 Electrical/Electronic and Comm. Engineering Tech. 18 24 4215.1401 Nuclear Engineering Technology/Technician 27 2751.0916 Radiation Protection/Health Physics Technician 6 17 2315.0101 Architectural Engineering Technology/Technician 12 10 2241.0205 Nuclear/Nuclear Power Technology/Technician 16 1615.1302 CAD/CADD Drafting and/or Design Tech. 5 515.0615 Chemical Engineering Technology/Technician 5 541.0301 Chemical Technology/Technician 3 1 415.1306 Mechanical Drafting and CAD/CADD 2 2
CRAFT48.0508 Welding Technology/Welder 96 23 11946.0302 Electrician 47 36 8347.0303 Industrial Mechanics and Maintenance Technology 15 18 19 5248.0501 Machine Tool Technology/Machinist 4 2 6 1248.0503 Machine Shop Technology/Assistant 8 2 1046.0201 Carpentry/Carpenter 1 1
Degrees/awards by level
THEORY INTO PRACTICE PAGE | 53
SRS COMMUNITY REUSE ORGANIZATION REGIONAL WORKFORCE STUDY
NUCLEAR (CONTINUED) SELECTED INITIATIVES & RESOURCES. The following resources were identified that could support the sector.
Nuclear Workforce Initiative (NWI®). The NWI was established in response to a 2009 survey of nuclear employers that identified the industry’s growing need for new workers. Recognizing the importance of the industry to the region, the initiative brings together the region’s private and government employers, educational institutions, and economic development entities. The initiative’s purpose is to ensure there is an adequately trained workforce to meet the demands of the industry. This is achieved by facilitating collaboration between NWI partners that foster regional educational attainment, economic growth, and job opportunities. The NWI’s goals include promoting nuclear and STEM career paths; aligning educational and training entity curricula and certification requirements to the job skill needs of nuclear employers; and advancing the mission of the initiative through outreach and collaborations at the regional and national level.
American Nuclear Society (ANS), Savannah River Section. The ANS is a not-for-profit, international, scientific, and educational membership organization established to unify the professional activities within the various fields of nuclear science and technology. The core purpose of the ANS Savannah River Section is to promote the awareness and understanding of the application of nuclear science and technology locally (in the Central Savannah River Area (CSRA)), nationally, and globally. Each year the Section awards the Benjamin Memorial Scholarship for $1,500 to a high school or first year technical student to use towards the pursuit of STEM education.
Nuclear Engineering Technology (NET), Augusta Technical College. The NET program is designed to address the nuclear industry's increasing need for a well-trained nuclear workforce. The program is a planned sequence of courses that meets the defined educational requirements of the Institute of Nuclear Power Operations (INPO) Uniform Curriculum Guide, a curriculum to standardize associate’s degree nuclear training across the nation.
Nuclear Quality Systems, Aiken Technical College. Aiken Tech offers an associate’s degree with a major in Nuclear Quality Systems. This provides the skills necessary to perform quality assurance and quality control duties for construction, operation, maintenance, and manufacturing activities. Quality control focuses on practices, techniques, and inspections in the fields of mechanical technology, electrical technology, and instruments and control technology. Quality assurance (QA) focuses on types of quality systems and standards, programmatic compliance audits, continuous improvement processes, management of QA records and documentation, and problem solving and critical thinking.
Manufacturing & Technology Training Center (MTTC), Aiken Technical College. The MTTC was created in 2007 in partnership with BAE Systems to provide a direct response to the needs of industry. Training is offered at the 30,000 square foot facility in a range of programs that support local sectors, including a blended learning program (web-delivered and hands-on training) in Maintenance & Plant Operations, which can also be applied towards an associate’s in Industrial Technology at Aiken Tech. Other options available through the MTTC include simulation and training for process operators, entry-level process technician training, customized lab technician training, fire and safety training, process improvement, and a range of tests designed to assess job applicants on their knowledge of basic systems.
Construction and Industrial Training, Aiken Technical College. Aiken Tech offers a number of continuing education programs that support the sector’s “craft” occupations, including formal programs (Forklift Operator and Welding
THEORY INTO PRACTICE PAGE | 54
SRS COMMUNITY REUSE ORGANIZATION REGIONAL WORKFORCE STUDY
Certification) and online options (Chemical Plant Operator, Chemical Lab Tech, Electrical/Mechanical Maintenance, Instrumentation and Controls).
Construction and Industrial Updates, Augusta Technical College. Continuing Education courses offered include: National Electrical Code Update, Residential/Light Commercial Contractors Update, Master Plumber Update, Welding Refresher Training, Master Electrician Update, and Conditioned Air Contractor Update.
Young Leadership Program, Associated General Contractors (AGC) of Georgia, Inc. AGC Georgia’s members represent over 500 of the top general contractors, residential/light commercial builders, construction managers, design builders, municipal-utility contractors, heavy and highway contractors, specialty contractors, service providers, and suppliers comprising the state's commercial construction industry. AGC Georgia’s Young Leadership Program (YLP) offers young people a platform to enhance their leadership skills, engage in new learning opportunities, and build relationships with others in the construction community.
Go Build Georgia. The Go Build Georgia Foundation is the private arm of the public-private partnership of the Go Build Georgia program undertaken by the Georgia Department of Economic Development’s Workforce division. The Foundation was established to support the Go Build Georgia program by rolling out an educational campaign using television, print, online and social media outlets, and promotional events. The goal is to educate students and the workforce at large about the program and drive them to the Go Build Georgia website where they can learn about opportunities in the skilled trades.
North American Young Generation in Nuclear (NAYGN). NAYGN is a networking organization for young professionals in the nuclear industry. It provides professional development, public information, knowledge transfer, and recruiting opportunities. The volunteer-based organization is facilitated by a board of directors and has over 100 local chapters in the US, Canada, and Mexico. There are five chapters based in South Carolina (AECOM, Fort Mill; Fluor Nuclear Power, Greenville; Virgil C Summer Nuclear Station, Jenkinsville; Westinghouse, Rock Hill; Westinghouse, Columbia).
Health Physics Society (HPS). HPS was founded in 1956 and is dedicated to ensuring health physicists have the information and capabilities required to manage the beneficial uses of ionizing radiation while protecting workers and the public from potential hazards. The Savannah River Chapter has over 300 members and 14 affiliate members in the CSRA. The group provides support to those interested in health physics and/or radiation protection by organizing meetings and technical seminars.
Citizens for Nuclear Technology Awareness (CNTA). Founded in the CSRA with over 400 members, CNTA is a nonprofit, grassroots organization dedicated to providing educational programs and factual information about the benefits and risks of nuclear technologies. CNTA works to inform elected officials and the public to support the development of new nuclear missions for the SRS and the CSRA. Their initiatives include using public meetings and a Speakers Bureau to inform the public about the economic importance of the SRS; participating in public hearings on issues related to SRS and formally commenting on Department of Energy (DOE) plans for the Site; sponsoring the annual Edward Teller Lecture, which provides internationally recognized experts an opportunity to speak about nuclear topics in Augusta, SC; and updating members on current nuclear issues through their Up and Atom Breakfast meetings and their periodic newsletter, Aware!.
THEORY INTO PRACTICE PAGE | 55

SRS COMMUNITY REUSE ORGANIZATION REGIONAL WORKFORCE STUDY
MANUFACTURING
OVERVIEW. The manufacturing sector accounted for nearly 33,000 jobs in the nine-county laborshed in 2014. Like the nation, the sector has been shedding jobs, with manufacturing employment down nearly 8,800 jobs from 2004. However, employment in the sector remains above the national average in the region, as evidenced by its LQ of 1.11. This figure rises to 1.27 if the five-county CRO Region is considered independently.
Employment in the sector is spread across multiple segments, with 12 industries (at the three-digit NAICS level) employing more than 1,000 workers each across the nine counties. The figures below profile trends in four of the largest: plastics and rubber products (NAICS 326), chemicals (NAICS 325), paper products (NAICS 322), and transportation equipment (NAICS 326). Together, these four industries accounted for more than 13,500 jobs, slightly more than 40 percent of manufacturing employment in the laborshed. Of these, two industry segments—plastics and rubber and transportation equipment—have experienced growth relative to their 2004 employment levels.
FIGURE 44. SELECTED EMPLOYERS – MANUFACTURING Company Location
Bridgestone Aiken
Club Car Columbia
Covidien Richmond
Collum’s Lumber Products Allendale
Craine Merchandising Systems Barnwell
EZ GO Textron Richmond
FPL Food LLC Richmond
Georgia Pacific Allendale
International Paper Richmond
John Deere Columbia
Kimberly Clark Aiken
Kronotex Barnwell
Morgan Thermal Ceramics Richmond
MTU America Aiken
Quad Graphics Columbia
Source: SRSCRO, TIP Strategies research.
FIGURE 45. EMPLOYMENT TRENDS, 2004 TO 2014 – MANUFACTURING (INDUSTRY–BASED)
TOTAL EMPLOYMENT, SELECTED INDUSTRIES GAINS/LOSSES, SELECTED INDUSTRIES (2004 = 1.00)
Source: EMSI 2014.3 – QCEW Employees, Non-QCEW Employees, and Self-Employed.
0
10,000
20,000
30,000
40,000
50,000
2004
2005
2006
2007
2008
2009
2010
2011
2012
2013
2014
Other Manufacturing IndustriesChemicalTransportation EquipmentPlastics & Rubber ProductsPaper Products
0.50
0.75
1.00
1.25
1.50
1.75
2004
2005
2006
2007
2008
2009
2010
2011
2012
2013
2014
2004
= 1
.00
Other Manufacturing IndustriesChemicalTransportation EquipmentPlastics & Rubber ProductsPaper Products
THEORY INTO PRACTICE PAGE | 56

SRS COMMUNITY REUSE ORGANIZATION REGIONAL WORKFORCE STUDY
MANUFACTURING (CONTINUED) KEY OCCUPATIONS. The manufacturing industry’s key occupations were categorized into four groups: production; installation, maintenance, and repair; transportation and material moving; and engineering and technical.
The region has considerably high concentrations of workers in a number of different key occupations, including tire builders, extruding machine operators, chemical plant operators, and health and safety engineers. The majority of the production and transportation and material moving occupations make less than the regional median hourly earnings. However, most of the installation, maintenance, and repair and all of the engineering and technical occupations have median hourly earnings above the regional average for all occupations. Seven of the key manufacturing occupations are earning wage premiums more than ten percent of the US average. These are packaging machine workers, paper goods machine workers, cutting machine workers, chemical equipment workers, mechanical engineers, all other engineers, and chemical technicians.
FIGURE 46. SHARE OF EMPLOYMENT IN SELECTED INDUSTRIES – MANUFACTURING OCCUPATIONS INCLUDES 2014 LOCATION QUOTIENT (LQ) AND WAGE RATE COMPARISON RELATIVE TO US
Source: EMSI 2014.3 – QCEW Employees, Non-QCEW Employees, and Self-Employed. Identified as a high demand occupation (HDO), see page 35. Marker indicates median hourly wages ≥110% of US () or ≤80% of US (). Continued next page
Paper
NA
ICS
322
Chem
icals
NA
ICS
325
Pla
stic
s/Rubber
NA
ICS
326
Transp
. Eq
uip
.N
AIC
S 33
6
PRODUCTION51-2092 Team Assemblers 4,798 1.81 $12.12 0.89 5.0% 1.8% 14.2% 26.4%
51-1011 First-Line Supvsr., Production & Operating Workers 1,918 1.33 $27.75 1.06 4.4% 4.3% 3.5% 3.9%
51-9061 Inspectors, Testers, Sorters, Samplers, & Weighers 1,580 1.33 $16.23 0.96 2.5% 1.7% 6.3% 2.4%
51-9197 Tire Builders 1,153 27.62 $20.76 1.09 - - 16.6% -
51-9198 Helpers--Production Workers 1,150 1.09 $9.23 0.83 3.2% 1.1% 0.4% 0.8%
51-9111 Packaging & Filling Machine Workers 937 1.02 $14.60 1.15 2.1% 7.1% 0.3% -
51-4121 Welders, Cutters, Solderers, & Brazers 936 1.01 $17.57 1.00 - 0.1% 0.1% 5.5%
51-9041 Extruding, Forming, & Compacting Machine 888 5.25 $16.17 1.06 1.8% 1.2% 13.4% 0.4%
51-9196 Paper Goods Machine Workers 709 3.13 $20.38 1.22 21.8% - - -
51-4041 Machinists 653 0.67 $17.99 0.95 0.4% 0.3% 0.7% 2.0%
51-9023 Mixing & Blending Machine Workers 517 1.81 $17.84 1.09 1.6% 7.5% 3.7% 0.0%
51-4031 Cutting, Punching, & Press Machine, Metal/Plastic 402 0.88 $12.43 0.86 0.7% 0.1% 1.5% 1.5%
51-9032 Cutting & Slicing Machine Workers 380 2.60 $17.95 1.17 2.8% - 1.2% -
51-6091 Extruding/Forming Machine, Synth. & Glass Fibers 367 8.02 $14.38 0.94 0.1% 1.1% 0.9% 0.1%
51-8091 Chemical Plant & System Operators 349 3.71 $26.49 1.01 0.7% 15.5% - -
51-4072 Molding, Coremaking, & Casting, Metal/Plastic 256 0.85 $13.50 0.99 0.3% 0.1% 2.9% 1.0%
51-9121 Coating, Painting, & Spraying Machine Workers 235 1.09 $15.62 1.05 1.3% 0.1% 0.5% 1.1%
51-9011 Chemical Equipment Workers 215 1.46 $28.23 1.23 0.4% 8.5% 0.1% -
51-2041 Structural Metal Fabricators & Fitters 186 0.98 $15.23 0.87 - - - 2.3%
51-4122 Welding, Soldering, & Brazing Machine 148 1.13 $17.64 1.07 - - - 2.3%
HD
O
Share of employment in:
SOC Code Description
Jobs in CRO 9-County
Laborshed (2014)
Median Hourly
Earnings
Relative to US
(US=1.00)20
14
Em
p.
LQ
(US
= 1.
00)
THEORY INTO PRACTICE PAGE | 57
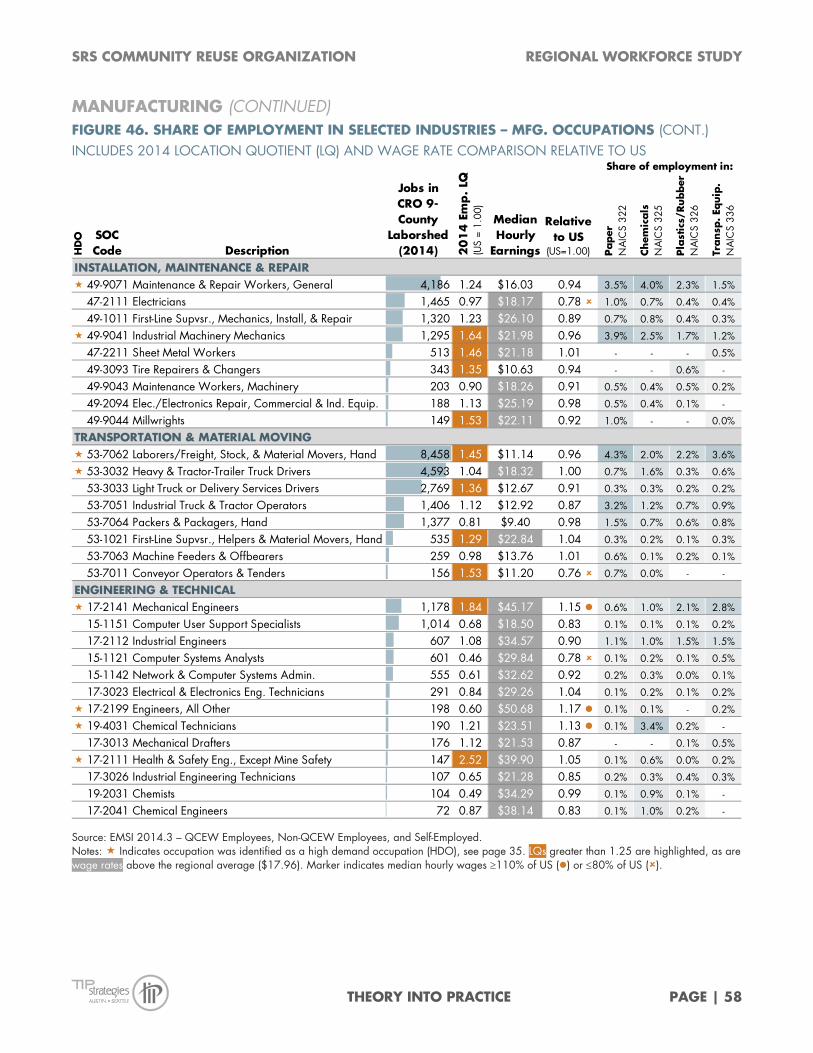
SRS COMMUNITY REUSE ORGANIZATION REGIONAL WORKFORCE STUDY
MANUFACTURING (CONTINUED) FIGURE 46. SHARE OF EMPLOYMENT IN SELECTED INDUSTRIES – MFG. OCCUPATIONS (CONT.) INCLUDES 2014 LOCATION QUOTIENT (LQ) AND WAGE RATE COMPARISON RELATIVE TO US
Source: EMSI 2014.3 – QCEW Employees, Non-QCEW Employees, and Self-Employed. Notes: Indicates occupation was identified as a high demand occupation (HDO), see page 35. LQs greater than 1.25 are highlighted, as are wage rates above the regional average ($17.96). Marker indicates median hourly wages ≥110% of US () or ≤80% of US ().
Paper
NA
ICS
322
Chem
icals
NA
ICS
325
Pla
stic
s/Rubber
NA
ICS
326
Transp
. Eq
uip
.N
AIC
S 33
6
INSTALLATION, MAINTENANCE & REPAIR 49-9071 Maintenance & Repair Workers, General 4,186 1.24 $16.03 0.94 3.5% 4.0% 2.3% 1.5%
47-2111 Electricians 1,465 0.97 $18.17 0.78 1.0% 0.7% 0.4% 0.4%
49-1011 First-Line Supvsr., Mechanics, Install, & Repair 1,320 1.23 $26.10 0.89 0.7% 0.8% 0.4% 0.3%
49-9041 Industrial Machinery Mechanics 1,295 1.64 $21.98 0.96 3.9% 2.5% 1.7% 1.2%
47-2211 Sheet Metal Workers 513 1.46 $21.18 1.01 - - - 0.5%
49-3093 Tire Repairers & Changers 343 1.35 $10.63 0.94 - - 0.6% -
49-9043 Maintenance Workers, Machinery 203 0.90 $18.26 0.91 0.5% 0.4% 0.5% 0.2%
49-2094 Elec./Electronics Repair, Commercial & Ind. Equip. 188 1.13 $25.19 0.98 0.5% 0.4% 0.1% -
49-9044 Millwrights 149 1.53 $22.11 0.92 1.0% - - 0.0%
TRANSPORTATION & MATERIAL MOVING 53-7062 Laborers/Freight, Stock, & Material Movers, Hand 8,458 1.45 $11.14 0.96 4.3% 2.0% 2.2% 3.6%
53-3032 Heavy & Tractor-Trailer Truck Drivers 4,593 1.04 $18.32 1.00 0.7% 1.6% 0.3% 0.6%
53-3033 Light Truck or Delivery Services Drivers 2,769 1.36 $12.67 0.91 0.3% 0.3% 0.2% 0.2%
53-7051 Industrial Truck & Tractor Operators 1,406 1.12 $12.92 0.87 3.2% 1.2% 0.7% 0.9%
53-7064 Packers & Packagers, Hand 1,377 0.81 $9.40 0.98 1.5% 0.7% 0.6% 0.8%
53-1021 First-Line Supvsr., Helpers & Material Movers, Hand 535 1.29 $22.84 1.04 0.3% 0.2% 0.1% 0.3%
53-7063 Machine Feeders & Offbearers 259 0.98 $13.76 1.01 0.6% 0.1% 0.2% 0.1%
53-7011 Conveyor Operators & Tenders 156 1.53 $11.20 0.76 0.7% 0.0% - -
ENGINEERING & TECHNICAL 17-2141 Mechanical Engineers 1,178 1.84 $45.17 1.15 0.6% 1.0% 2.1% 2.8%
15-1151 Computer User Support Specialists 1,014 0.68 $18.50 0.83 0.1% 0.1% 0.1% 0.2%
17-2112 Industrial Engineers 607 1.08 $34.57 0.90 1.1% 1.0% 1.5% 1.5%
15-1121 Computer Systems Analysts 601 0.46 $29.84 0.78 0.1% 0.2% 0.1% 0.5%
15-1142 Network & Computer Systems Admin. 555 0.61 $32.62 0.92 0.2% 0.3% 0.0% 0.1%
17-3023 Electrical & Electronics Eng. Technicians 291 0.84 $29.26 1.04 0.1% 0.2% 0.1% 0.2%
17-2199 Engineers, All Other 198 0.60 $50.68 1.17 0.1% 0.1% - 0.2%
19-4031 Chemical Technicians 190 1.21 $23.51 1.13 0.1% 3.4% 0.2% -
17-3013 Mechanical Drafters 176 1.12 $21.53 0.87 - - 0.1% 0.5%
17-2111 Health & Safety Eng., Except Mine Safety 147 2.52 $39.90 1.05 0.1% 0.6% 0.0% 0.2%
17-3026 Industrial Engineering Technicians 107 0.65 $21.28 0.85 0.2% 0.3% 0.4% 0.3%
19-2031 Chemists 104 0.49 $34.29 0.99 0.1% 0.9% 0.1% -
17-2041 Chemical Engineers 72 0.87 $38.14 0.83 0.1% 1.0% 0.2% -
HD
O
Share of employment in:
SOC Code Description
Jobs in CRO 9-County
Laborshed (2014)
Median Hourly
Earnings
Relative to US
(US=1.00)20
14
Em
p.
LQ
(US
= 1.
00)
THEORY INTO PRACTICE PAGE | 58

SRS COMMUNITY REUSE ORGANIZATION REGIONAL WORKFORCE STUDY
MANUFACTURING (CONTINUED) DEMAND. Figure 47 provides an overview of the demand for workers in the manufacturing industry as well as key demographic characteristics.
The key occupations with the highest number of expected openings are team assemblers, maintenance and repair workers, laborers, and truck drivers. Particularly in the key production occupations, most of the openings are replacement jobs.
Many of the key occupations in engineering and technical as well as maintenance and repair have large shares of workers who are 55 or older.
FIGURE 47. DEMAND FACTORS & DEMOGRAPHICS – MANUFACTURING OCCUPATIONS INCLUDES ESTIMATED ANNUAL OPENINGS, 2014 TO 2019
Source: EMSI 2014.3 – QCEW Employees, Non-QCEW Employees, and Self-Employed. Notes: Indicates occupation was identified as a high demand occupation (HDO), see page 35. Annual openings are an estimate of job openings due to net change in employment and replacement needs (e.g., turnover, retirement). Indicates significant share of workforce is reaching retirement age (defined here as ≥25% age 55+ and/or ≥ 5% age 65+). Continued next page
Annual Openings (2014-19) N
ew jobs
Rep
lace
men
t
% 5
5+ Y
ears
% 6
5+ Y
ears
% M
ale
PRODUCTION
51-2092 Team Assemblers 4,798 109 4% 96% 17% 2% 60%
51-1011 First-Line Supvsr., Production & Operating Workers 1,918 34 - 100% 23% 2% 83%
51-9061 Inspectors, Testers, Sorters, Samplers, & Weighers 1,580 47 12% 88% 26% 4% 58%
51-9197 Tire Builders 1,153 62 50% 50% 11% 0% 90%
51-9198 Helpers--Production Workers 1,150 34 9% 91% 15% 3% 79%
51-9111 Packaging & Filling Machine Workers 937 30 - 100% 16% 2% 46%
51-4121 Welders, Cutters, Solderers, & Brazers 936 27 - 100% 18% 2% 95%
51-9041 Extruding, Forming, & Compacting Machine 888 43 20% 80% 17% 1% 83%
51-9196 Paper Goods Machine Workers 709 19 40% 60% 20% 2% 77%
51-4041 Machinists 653 25 37% 63% 26% 5% 95%
51-9023 Mixing & Blending Machine Workers 517 21 15% 85% 17% 1% 91%
51-4031 Cutting, Punching, & Press Machine, Metal/Plastic 402 5 - 100% 19% 4% 76%
51-9032 Cutting & Slicing Machine Workers 380 11 27% 73% 22% 1% 79%
51-6091 Extruding/Forming Machine, Synth. & Glass Fibers 367 10 - 100% 24% 1% 67%
51-8091 Chemical Plant & System Operators 349 14 - 100% 25% 1% 95%
51-4072 Molding, Coremaking, & Casting, Metal/Plastic 256 7 44% 56% 20% 2% 76%
51-9121 Coating, Painting, & Spraying Machine Workers 235 5 - 100% 16% 2% 85%
51-9011 Chemical Equipment Workers 215 9 - 100% 24% 2% 91%
51-2041 Structural Metal Fabricators & Fitters 186 9 - 100% 19% 3% 93%
51-4122 Welding, Soldering, & Brazing Machine 148 6 19% 81% 17% 3% 93%
Demand Factors Demographics
HD
O SOC Code Description
Jobs in CRO 9-County
Laborshed (2014)
THEORY INTO PRACTICE PAGE | 59

SRS COMMUNITY REUSE ORGANIZATION REGIONAL WORKFORCE STUDY
MANUFACTURING (CONTINUED) FIGURE 47. DEMAND FACTORS & DEMOGRAPHICS – MANUFACTURING OCCUPATIONS (CONT.) INCLUDES ESTIMATED ANNUAL OPENINGS, 2014 TO 2019
Source: EMSI 2014.3 – QCEW Employees, Non-QCEW Employees, and Self-Employed. Notes: Indicates occupation was identified as a high demand occupation (HDO), see page 35. Annual openings are an estimate of job openings due to net change in employment and replacement needs (e.g., turnover, retirement). Indicates significant share of workforce ia reaching retirement age (defined here as ≥25% age 55+ and/or ≥ 5% age 65+).
Annual Openings (2014-19) N
ew jobs
Rep
lace
men
t
% 5
5+ Y
ears
% 6
5+ Y
ears
% M
ale
INSTALLATION, MAINTENANCE & REPAIR
49-9071 Maintenance & Repair Workers, General 4,186 120 20% 80% 27% 5% 96%
47-2111 Electricians 1,465 30 - 100% 18% 3% 97%
49-1011 First-Line Supvsr., Mechanics, Install, & Repair 1,320 54 29% 71% 27% 3% 94%
49-9041 Industrial Machinery Mechanics 1,295 58 28% 72% 26% 3% 97%
47-2211 Sheet Metal Workers 513 24 48% 52% 15% 2% 97%
49-3093 Tire Repairers & Changers 343 17 6% 94% 8% 1% 96%
49-9043 Maintenance Workers, Machinery 203 6 47% 53% 28% 2% 97%
49-2094 Elec./Electronics Repair, Commercial & Ind. Equip. 188 5 - 100% 24% 3% 97%
49-9044 Millwrights 149 5 42% 58% 33% 3% 97%
TRANSPORTATION & MATERIAL MOVING
53-7062 Laborers/Freight, Stock, & Material Movers, Hand 8,458 406 27% 73% 14% 3% 81%
53-3032 Heavy & Tractor-Trailer Truck Drivers 4,593 107 12% 88% 27% 6% 96%
53-3033 Light Truck or Delivery Services Drivers 2,769 73 26% 74% 24% 7% 94%
53-7051 Industrial Truck & Tractor Operators 1,406 50 11% 89% 15% 2% 92%
53-7064 Packers & Packagers, Hand 1,377 60 25% 75% 15% 3% 40%
53-1021 First-Line Supvsr., Helpers & Material Movers, Hand 535 25 31% 69% 18% 3% 81%
53-7063 Machine Feeders & Offbearers 259 13 55% 45% 15% 2% 59%
53-7011 Conveyor Operators & Tenders 156 7 31% 69% 16% 3% 87%
ENGINEERING & TECHNICAL
17-2141 Mechanical Engineers 1,178 52 17% 83% 24% 4% 94%
15-1151 Computer User Support Specialists 1,014 40 56% 44% 13% 1% 70%
17-2112 Industrial Engineers 607 23 12% 88% 26% 4% 82%
15-1121 Computer Systems Analysts 601 30 65% 35% 18% 2% 66%
15-1142 Network & Computer Systems Admin. 555 19 49% 51% 11% 1% 79%
17-3023 Electrical & Electronics Eng. Technicians 291 10 34% 66% 24% 2% 83%
17-2199 Engineers, All Other 198 6 33% 67% 31% 9% 89%
19-4031 Chemical Technicians 190 6 5% 95% 28% 3% 68%
17-3013 Mechanical Drafters 176 4 - 100% 21% 3% 84%
17-2111 Health & Safety Eng., Except Mine Safety 147 5 - 100% 32% 3% 82%
17-3026 Industrial Engineering Technicians 107 3 - 100% 25% 5% 82%
19-2031 Chemists 104 4 18% 82% 26% 5% 66%
17-2041 Chemical Engineers 72 3 35% 65% 30% 7% 89%
Demand Factors Demographics
HD
O SOC Code Description
Jobs in CRO 9-County
Laborshed (2014)
THEORY INTO PRACTICE PAGE | 60
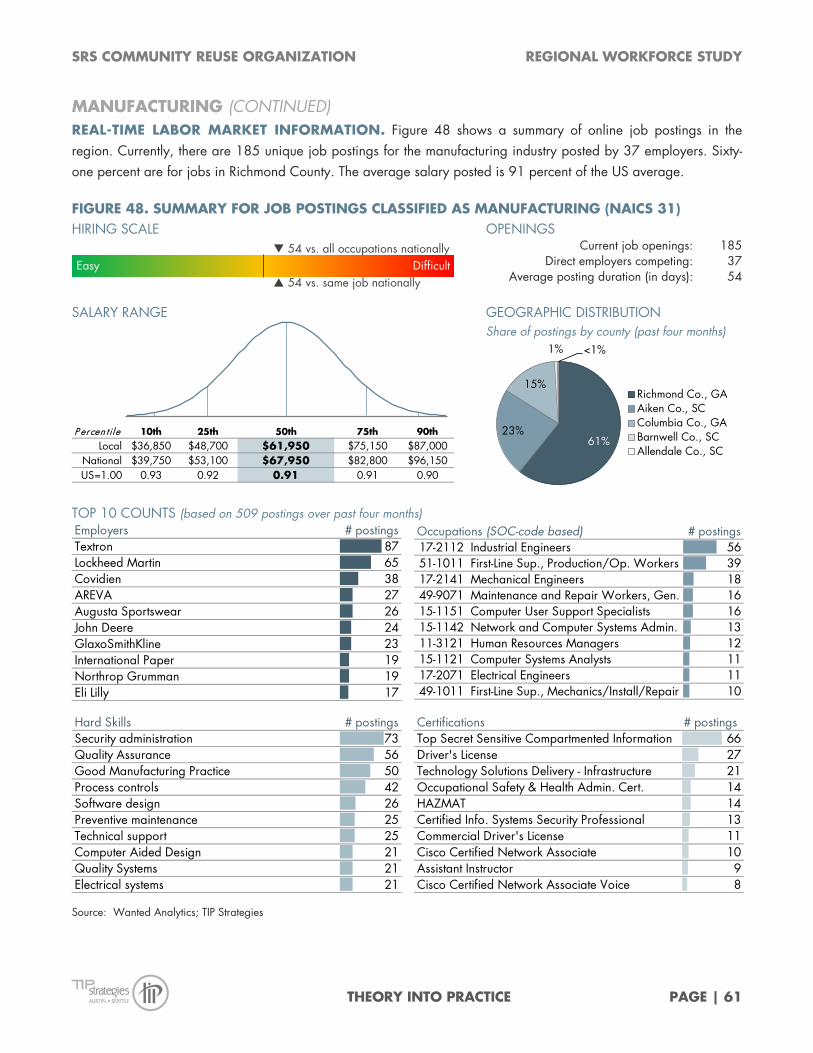
SRS COMMUNITY REUSE ORGANIZATION REGIONAL WORKFORCE STUDY
MANUFACTURING (CONTINUED) REAL-TIME LABOR MARKET INFORMATION. Figure 48 shows a summary of online job postings in the region. Currently, there are 185 unique job postings for the manufacturing industry posted by 37 employers. Sixty-one percent are for jobs in Richmond County. The average salary posted is 91 percent of the US average.
FIGURE 48. SUMMARY FOR JOB POSTINGS CLASSIFIED AS MANUFACTURING (NAICS 31) HIRING SCALE OPENINGS
Current job openings: 185 Direct employers competing: 37
Average posting duration (in days): 54
SALARY RANGE GEOGRAPHIC DISTRIBUTION
Share of postings by county (past four months)
TOP 10 COUNTS (based on 509 postings over past four months)
Source: Wanted Analytics; TIP Strategies
Easy Difficult 54 vs. same job nationally
54 vs. all occupations nationally
P ercen tile 10th 25th 50th 75th 90thLocal $36,850 $48,700 $61,950 $75,150 $87,000
National $39,750 $53,100 $67,950 $82,800 $96,150US=1.00 0.93 0.92 0.91 0.91 0.90
61%23%
15%
1% <1%
Richmond Co., GAAiken Co., SCColumbia Co., GABarnwell Co., SCAllendale Co., SC
Employers # postingsTextron 87Lockheed Martin 65Covidien 38AREVA 27Augusta Sportswear 26John Deere 24GlaxoSmithKline 23International Paper 19Northrop Grumman 19Eli Lilly 17
Occupations (SOC-code based) # postings17-2112 Industrial Engineers 5651-1011 First-Line Sup., Production/Op. Workers 3917-2141 Mechanical Engineers 1849-9071 Maintenance and Repair Workers, Gen. 1615-1151 Computer User Support Specialists 1615-1142 Network and Computer Systems Admin. 1311-3121 Human Resources Managers 1215-1121 Computer Systems Analysts 1117-2071 Electrical Engineers 1149-1011 First-Line Sup., Mechanics/Install/Repair 10
Hard Skills # postingsSecurity administration 73Quality Assurance 56Good Manufacturing Practice 50Process controls 42Software design 26Preventive maintenance 25Technical support 25Computer Aided Design 21Quality Systems 21Electrical systems 21
Certifications # postingsTop Secret Sensitive Compartmented Information 66Driver's License 27Technology Solutions Delivery - Infrastructure 21Occupational Safety & Health Admin. Cert. 14HAZMAT 14Certified Info. Systems Security Professional 13Commercial Driver's License 11Cisco Certified Network Associate 10Assistant Instructor 9Cisco Certified Network Associate Voice 8
THEORY INTO PRACTICE PAGE | 61

SRS COMMUNITY REUSE ORGANIZATION REGIONAL WORKFORCE STUDY
MANUFACTURING (CONTINUED) FIGURE 49. REAL-TIME LMI, SELECTED MANUFACTURING OCCUPATIONS
17-2112 INDUSTRIAL ENGINEERS HIRING SCALE OPENINGS
Current job openings: 101 Direct employers competing: 44
Average posting duration (in days): 54
SALARY RANGE TOP SKILLS
P ercen t ile 10th 25th 50th 75th 90th Local $67,800 $74,350 $81,650 $88,950 $95,550
National $59,350 $68,150 $77,900 $87,650 $96,400 US=1.00 1.14 1.09 1.05 1.01 0.99
Quality assurance | Process controls | Quality control | Instrumentation | Good Manufacturing Practice | Preventive maintenance | Technical support | Quality Systems | Computer aided design (CAD)/Autodesk AutoCAD
51-1011 FIRST-LINE SUPERVISORS, PRODUCTION AND OPERATING WORKERS HIRING SCALE OPENINGS
Current job openings: 51 Direct employers competing: 30
Average posting duration (in days): 44
SALARY RANGE TOP SKILLS
P ercen t ile 10th 25th 50th 75th 90th Local $47,450 $62,050 $78,200 $94,400 $108,950
National $34,900 $45,850 $58,000 $70,150 $81,100 US=1.00 1.36 1.35 1.35 1.35 1.34
Good Manufacturing Practice | Quality assurance Lean mfg. | Process controls | Quality control | Instrumentation | Enterprise resource planning software | Quality systems | Preventive maint. | Process control sys. software | Plant maintenance
17-2141 MECHANICAL ENGINEERS HIRING SCALE OPENINGS
Current job openings: 30 Direct employers competing: 17
Average posting duration (in days): 50
SALARY RANGE TOP SKILLS
P ercen t ile 10th 25th 50th 75th 90th Local $59,200 $68,050 $77,700 $87,300 $96,150
National $60,000 $68,600 $78,100 $87,600 $96,200
US=1.00 0.99 0.99 0.99 1.00 1.00
Comp. aided design (CAD)/Autodesk/SolidWorks | Instrumentation | Quality assurance | Mech. design | Preventive maint. | Electrical systems | Software design | Product eng. | Process controls | Compu-terized maint. mgmt. sys. | Bentley Microstation
49-9071 MAINTENANCE AND REPAIR WORKERS, GENERAL HIRING SCALE OPENINGS
Current job openings: 68 Direct employers competing: 50
Average posting duration (in days): 43
SALARY RANGE TOP SKILLS
P ercen t ile 10th 25th 50th 75th 90th Local $26,600 $30,800 $35,500 $40,200 $44,450
National $23,100 $29,150 $35,850 $42,550 $48,550
US=1.00 1.15 1.06 0.99 0.94 0.92
Excavators | Preventive maint./PM | PM inspections | Computerized maint. mgmt. system | Electrical systems | Traffic control | Good Manufacturing Practice | Sanders/FarmBooks Acctng. Software | Work order | Electrical repairs | Bldg. automation
Source: Wanted Analytics; TIP Strategies.
Easy Difficult87 vs. same job nationally
85 vs. all occupations nationally
Easy Difficult 43 vs. same job nationally
52 vs. all occupations nationally
Easy Difficult 55 vs. same job nationally
57 vs. all occupations nationally
Easy Difficult 9 vs. same job nationally
32 vs. all occupations nationally
THEORY INTO PRACTICE PAGE | 62

SRS COMMUNITY REUSE ORGANIZATION REGIONAL WORKFORCE STUDY
MANUFACTURING (CONTINUED) Thirty-seven manufacturers participated in the employer survey. Of those participants, 76 percent plan to hire additional employees over the next two years. These employers estimated that they will add more than 1,500 workers. The majority of these workers (82 percent) will be in unskilled (730) and skilled (515) occupations.
Respondents indicated that management, professional/technical, sales/marketing, and skilled labor can be hard to fill, with some employers reporting that openings in these classifications can take more than six months to fill. Most found that these positions could be filled in one to three months. Unskilled and clerical openings most often take less than a month to fill, but not more than three months.
FIGURE 50. FINDINGS FROM EMPLOYER SURVEY – MANUFACTURING FIRMS OVER THE NEXT 2 YEARS, DO YOU PLAN TO HIRE ADDITIONAL EMPLOYEES WITHIN THE CRO REGION?
APPROXIMATELY HOW MANY WORKERS DO YOU PLAN TO ADD IN EACH OF THE FOLLOWING CATEGORIES?
APPROXIMATELY HOW LONG DOES IT TYPICALLY TAKE TO FILL A VACANCY FOR EACH OF THE FOLLOWING CLASSIFICATIONS OF WORKERS?
No5%
Not sure19%
Yes76%
n=37
730
515
105 62 39 39 35
Uns
kille
d/La
bore
r
Skill
ed L
abor
Oth
er
Prof
essi
onal
/Te
chni
cal
Sale
s/M
arke
ting
Man
agem
ent
Cle
rical
/A
dmin
istra
tive
11%
9%
17%
11%
12%
5%
6%
17%
17%
20%
50%
3%
3%
17%
25%
37%
26%
41%
49%
17%
39%
31%
12%
22%
20%
17%
14%
19%
14%
17%
6%
0% 20% 40% 60% 80% 100%
Management
Professional/Technical
Sales/Marketing
Skilled Labor
Clerical/Administrative
Unskilled/Laborer
Not applicable Less than 2 weeks 2 to 4 weeks1 to 3 months 4 to 6 months More than 6 months
THEORY INTO PRACTICE PAGE | 63

SRS COMMUNITY REUSE ORGANIZATION REGIONAL WORKFORCE STUDY
MANUFACTURING (CONTINUED) FIGURE 51. FINDINGS FROM EMPLOYER SURVEY—MANUFACTURING FIRMS Nine respondents reported that they had occupations they were unable to fill and many respondents reported they had difficulty recruiting for certain occupations and finding certain skills. Professional/technical positions, engineering, and management were cited as the most difficult positions to recruit in manufacturing. Knowledge of engineering and enterprise software as well as mechanics/machinery are skills that were most often cited as difficult to find.
The respondents in the manufacturing industry rate the regional workforce as good to excellent. Employee attitudes, professionalism, trainability, and reliability ranked the highest. Computer and math skills were ranked the lowest.
ARE THERE SPECIFIC OCCUPATIONS WHICH YOU HAVE BEEN UNABLE TO FILL AT ALL?
Industrial Electrician Field Service Manager Ammonia Refrigeration Tech Technicians Materials Roles Marketing Saw Filer Millwright Maintenance Planner
WHICH OCCUPATIONS ARE DIFFICULT TO RECRUIT IN YOUR INDUSTRY?
WHICH SKILLS ARE DIFFICULT TO FIND IN YOUR INDUSTRY?
CNC Prog.—Mac. Set Up Plant Manager Electrician (2) Professional/Technical (15) Engineer (9)—Automotive, Elec., R & D Engine
Quality Control (4)
Machine Operators (2) Sales (3) Maintenance (4) Skilled Assemblers Maintenance Technician (3) Supply Chain Management (8) Technical Sales Materials Mgmt./Planning Welder/Fabricator Metallurgist
Accounting/Payroll Product Specific Skills/ Knowledge (2)
Ammonia/Refrigeration Professional/Technical (4) Chemistry Quality Inspectors Competent, Reliable Worker (3)
Read & Interpret Drawings (Correctly) (GD&T)
Elec. (Indust./ Instrumentation/Diagnostic/ Other) (6)
Recycling of metals
Engine Diagnostic Testing Rotocasting Engineering (2) Siemens Controls Forklift Operators Software (ERP, AutoCAD,
SAP, Sage, ProE) (5) General Computer/IT (3) Technical Programmer (3) Maintenance (2) Technical Skills Management Vibration analyst Mathematics (2) Weaving Mechanic/Machinery (7) Welding/Fabricating (3)
No74%
Yes26%
n=35
THEORY INTO PRACTICE PAGE | 64

SRS COMMUNITY REUSE ORGANIZATION REGIONAL WORKFORCE STUDY
HOW WOULD YOU RATE THE REGIONAL WORKFORCE OVERALL ON THE FOLLOWING CHARACTERISTICS?
3%
3%
25%31%
11%
14%17%17%
6%11%
26%33%34%
50%34%
46%44%
31%25%
31%44%36%
40%44%46%
22%34%
40%56%
50%50%
53%50%
53%34%
22%20%
6%8%
0% 20% 40% 60% 80% 100%
Job readinessEntry-level skills
AdaptibilityTrainability
Employee attitudesProfessionalismTeamwork skills
ProductivityReliability
Communication skillsMath skills
Computer skills
No opinion Poor Fair Good Excellent
THEORY INTO PRACTICE PAGE | 65

SRS COMMUNITY REUSE ORGANIZATION REGIONAL WORKFORCE STUDY
MANUFACTURING (CONTINUED) EDUCATION & TRAINING. Figure 52 shows the wages and the typical requirements for entry into specific occupations.
The production and transportation and material moving occupations are more likely to be lower-wage, lower-skill jobs. The maintenance and repair occupations and engineering and technical occupations, for the most part, make more than the regional median hourly earnings and are considered middle- or high-skill occupations.
FIGURE 52. EDUCATION & TRAINING REQUIREMENTS – MANUFACTURING OCCUPATIONS WITH HOURLY EARNINGS FOR SELECTED PERCENTILES, INCLUDING MEDIAN (50TH)
Source: EMSI 2014.3 – QCEW Employees, Non-QCEW Employees, and Self-Employed. Continued next page
10th 50th 90th Education Experience
PRODUCTION51-2092 Team Assemblers $8.60 $12.12 $18.74 HS or equivalent None Moderate-term OJT
51-1011 First-Line Supvsr., Production & Operating Workers $17.05 $27.75 $44.30 Non-degree award < 5 years None
51-9061 Inspectors, Testers, Sorters, Samplers, & Weighers $10.30 $16.23 $24.56 HS or equivalent None Moderate-term OJT
51-9197 Tire Builders $12.72 $20.76 $28.40 HS or equivalent None Moderate-term OJT
51-9198 Helpers--Production Workers $7.43 $9.23 $14.14 Less than HS None Short-term OJT
51-9111 Packaging & Filling Machine Workers $8.98 $14.60 $23.23 HS or equivalent None Moderate-term OJT
51-4121 Welders, Cutters, Solderers, & Brazers $12.80 $17.57 $25.50 HS or equivalent None Moderate-term OJT
51-9041 Extruding, Forming, & Compacting Machine $12.22 $16.17 $20.72 HS or equivalent None Moderate-term OJT
51-9196 Paper Goods Machine Workers $12.65 $20.38 $32.08 HS or equivalent None Moderate-term OJT
51-4041 Machinists $10.73 $17.99 $26.46 HS or equivalent None Long-term OJT
51-9023 Mixing & Blending Machine Workers $11.78 $17.84 $25.62 HS or equivalent None Moderate-term OJT
51-4031 Cutting, Punching, & Press Machine, Metal/Plastic $9.22 $12.43 $18.96 HS or equivalent None Moderate-term OJT
51-9032 Cutting & Slicing Machine Workers $11.62 $17.95 $23.16 HS or equivalent None Short-term OJT
51-6091 Extruding/Forming Machine, Synth. & Glass Fibers $9.13 $14.38 $21.86 HS or equivalent None Moderate-term OJT
51-8091 Chemical Plant & System Operators $20.75 $26.49 $34.87 HS or equivalent None Long-term OJT
51-4072 Molding, Coremaking, & Casting, Metal/Plastic $9.73 $13.50 $20.45 HS or equivalent None Moderate-term OJT
51-9121 Coating, Painting, & Spraying Machine Workers $10.97 $15.62 $21.96 HS or equivalent None Moderate-term OJT
51-9011 Chemical Equipment Workers $16.71 $28.23 $35.85 HS or equivalent None Moderate-term OJT
51-2041 Structural Metal Fabricators & Fitters $10.67 $15.23 $23.10 HS or equivalent None Moderate-term OJT
51-4122 Welding, Soldering, & Brazing Machine $12.75 $17.64 $23.64 HS or equivalent None Moderate-term OJT
Typical Requirements for Entry into Occupation:
Training Required For Competency
Hourly Earnings (percentiles)
HD
O SOC Code Description
THEORY INTO PRACTICE PAGE | 66

SRS COMMUNITY REUSE ORGANIZATION REGIONAL WORKFORCE STUDY
MANUFACTURING (CONTINUED) FIGURE 52. EDUCATION & TRAINING REQUIREMENTS – MANUFACTURING OCCUPATIONS (CONT.) WITH HOURLY EARNINGS FOR SELECTED PERCENTILES, INCLUDING MEDIAN (50TH)
Source: EMSI 2014.3 – QCEW Employees, Non-QCEW Employees, and Self-Employed.
10th 50th 90th Education Experience
INSTALLATION, MAINTENANCE & REPAIR 49-9071 Maintenance & Repair Workers, General $9.78 $16.03 $28.01 HS or equivalent None Long-term OJT
47-2111 Electricians $11.88 $18.17 $27.03 HS or equivalent None Apprenticeship
49-1011 First-Line Supvsr., Mechanics, Install, & Repair $16.36 $26.10 $41.07 HS or equivalent < 5 years None
49-9041 Industrial Machinery Mechanics $14.90 $21.98 $30.48 HS or equivalent None Long-term OJT
47-2211 Sheet Metal Workers $12.28 $21.18 $29.42 HS or equivalent None Apprenticeship
49-3093 Tire Repairers & Changers $8.20 $10.63 $14.42 HS or equivalent None Short-term OJT
49-9043 Maintenance Workers, Machinery $13.15 $18.26 $28.64 HS or equivalent None Moderate-term OJT
49-2094 Elec./Electronics Repair, Commercial & Ind. Equip. $17.49 $25.19 $37.58 Non-degree award None Long-term OJT
49-9044 Millwrights $15.09 $22.11 $31.65 HS or equivalent None Apprenticeship
TRANSPORTATION & MATERIAL MOVING 53-7062 Laborers/Freight, Stock, & Material Movers, Hand $8.18 $11.14 $19.47 Less than HS None Short-term OJT
53-3032 Heavy & Tractor-Trailer Truck Drivers $12.25 $18.32 $28.59 Non-degree award None Short-term OJT
53-3033 Light Truck or Delivery Services Drivers $8.21 $12.67 $28.20 HS or equivalent None Short-term OJT
53-7051 Industrial Truck & Tractor Operators $8.87 $12.92 $19.71 Less than HS None Short-term OJT
53-7064 Packers & Packagers, Hand $7.95 $9.40 $16.38 Less than HS None Short-term OJT
53-1021 First-Line Supvsr., Helpers & Material Movers, Hand $13.89 $22.84 $34.50 HS or equivalent < 5 years None
53-7063 Machine Feeders & Offbearers $9.23 $13.76 $19.71 Less than HS None Short-term OJT
53-7011 Conveyor Operators & Tenders $8.42 $11.20 $17.90 Less than HS None Short-term OJT
ENGINEERING & TECHNICAL 17-2141 Mechanical Engineers $27.56 $45.17 $71.00 Bachelor's None None
15-1151 Computer User Support Specialists $10.68 $18.50 $30.49 Some college None Moderate-term OJT
17-2112 Industrial Engineers $23.60 $34.57 $52.47 Bachelor's None None
15-1121 Computer Systems Analysts $18.42 $29.84 $46.37 Bachelor's None None
15-1142 Network & Computer Systems Admin. $20.61 $32.62 $51.63 Bachelor's None None
17-3023 Electrical & Electronics Eng. Technicians $17.99 $29.26 $39.29 Associate's None None
17-2199 Engineers, All Other $30.81 $50.68 $68.57 Bachelor's None None
19-4031 Chemical Technicians $15.79 $23.51 $33.05 Associate's None Moderate-term OJT
17-3013 Mechanical Drafters $15.82 $21.53 $34.75 Associate's None None
17-2111 Health & Safety Eng., Except Mine Safety $21.50 $39.90 $65.07 Bachelor's None None
17-3026 Industrial Engineering Technicians $15.44 $21.28 $29.52 Associate's None None
19-2031 Chemists $20.59 $34.29 $49.12 Bachelor's None None
17-2041 Chemical Engineers $27.13 $38.14 $55.14 Bachelor's None None
Typical Requirements for Entry into Occupation:
Training Required For Competency
Hourly Earnings (percentiles)
HD
O SOC Code Description
THEORY INTO PRACTICE PAGE | 67

SRS COMMUNITY REUSE ORGANIZATION REGIONAL WORKFORCE STUDY
MANUFACTURING (CONTINUED) Figure 53 shows the for-credit completions from regional postsecondary institutions in fields of study relevant to the manufacturing industry’s key occupations. Due to the absence of a four-year engineering program in the region, there are few graduates with a bachelor’s degree or higher in fields of study that support the key manufacturing occupations. Of the fields of study identified in this figure, welding, electrician, industrial mechanics, electrical engineering technician, and network administrator are the most popular fields of study relevant to the manufacturing industry. There are, however, non-credit programs offered at the region’s postsecondary institutions that support the industry that would not be captured in this dataset.
FIGURE 53. RELEVANT COMPLETIONS – MANUFACTURING OCCUPATIONS THREE-YEAR ANNUAL AVERAGE OF DEGREES/AWARDS CONFERRED, 2011-2013
Source: National Center for Education Statistics, Integrated Postsecondary Education Data System (IPEDS) surveys; National Crosswalk Service Center; TIP Strategies. IPEDS data include only schools eligible to participate in federal financial aid programs. Figures shown include first and second majors. *Associate’s-degree-level completions include awards categorized by IPEDS as "Award of at least two but less than four academic years." **Advanced-level completions represent all awards above the bachelor’s-degree level. ***No engineering related completions were reported by the analyzed schools, except a small number of Pre-Engineering (CIP 14.0102) awards at Aiken Technical College.
CIP Code Field of Study C
ertifi
cate
( < 1
yea
r)
Cer
tifi
cate
( ≥1
yr.,
< 2
yrs.
)
Ass
oci
ate
's*
Bach
elor'
s
Adva
nce
d** Annual average
degrees/awards conferred (all levels)
PRODUCTION
48.0508 Welding Technology/Welder 96 23 119
48.0503 Machine Shop Technology/Assistant 8 2 10
48.0501 Machine Tool Technology/Machinist 3 2 6 11
41.0301 Chemical Technology/Technician 3 1 4
52.0205 Operations Management and Supervision 1 1 2
INSTALLATION, MAINTENANCE & REPAIR
46.0302 Electrician 47 36 83
47.0303 Industrial Mechanics and Maint. Technology 15 18 19 52
47.0105 Industrial Electronics Technology/Technician 5 20 25
47.0104 Computer Installation and Repair Technology/Technician 14 14
52.0205 Operations Management and Supervision 1 1 2
ENGINEERING & TECHNICAL
14.0102 Pre-Engineering*** 6 6
15.0303 Electrical, Electronic and Comm. Engineering Tech. 18 24 42
11.0901 Computer Systems Networking and Telecommunications 16 11 27
11.1001 Network and System Administration/Administrator 31 9 1 41
40.0501 Chemistry, General 18 18
11.0101 Computer and Information Sciences, General 4 13 17
11.0103 Information Technology 6 6
15.1302 CAD/CADD Drafting and/or Design Technology/Technician 5 5
41.0301 Chemical Technology/Technician 3 1 4
15.1306 Mechanical Drafting and CAD/CADD 2 2
Degrees/awards by level
THEORY INTO PRACTICE PAGE | 68

SRS COMMUNITY REUSE ORGANIZATION REGIONAL WORKFORCE STUDY
MANUFACTURING (CONTINUED) SELECTED INITIATIVES & RESOURCES.
South Carolina Manufacturers Alliance (SCMA). The SCMA provides a vehicle for all manufacturers to advocate their interests at the legislative, regulatory, and executive levels in South Carolina. The SCMA has a number of divisions including an Automotive Council, Chemistry Council, and Textile Council, as well as two geographically oriented divisions: the ACE Basin Council (listed separately) and the Lowcountry Manufacturers Council.
ACE Basin Manufacturers Council. The ACE Basin Council is an initiative of the SCMA that provides a regional voice for manufacturers. Membership is open to manufacturers in Aiken, Allendale, Bamberg, Barnwell, Calhoun, Hampton, and Orangeburg Counties. The mission of the council is to enhance the competitiveness, promote development, and positively impact the manufacturing sector of the ACE Basin region of South Carolina.
Manufacturer's Exchange, Augusta Metro Chamber of Commerce. The Chamber's Manufacturer’s Exchange meets quarterly to share information about the needs of and conditions within the manufacturing sector and to share best practices. Recently, the exchange participated in a coalition headed by the Chamber to successfully oppose a proposed Energy Excise Tax on manufacturing in Augusta-Richmond County.
South Carolina Manufacturing Certification program, SC Technical College System. Offered at each of the state’s 16 technical schools, including Aiken Technical College, this program teaches advanced manufacturing skills and offers an industry-recognized national certification upon completion. Full funding is available for South Carolina residents who have a silver-level WorkKeys certification, are unemployed or underemployed or would like to change careers, and can pass a drug screening and background check.
Georgia Association of Manufacturers (GAM). GAM is the statewide trade association that represents all of Georgia's manufacturing businesses in legislative, regulatory, and public relations matters. Founded in 1900, GAM also provides seminars, services, and guidance to manufacturers on a wide range of issues, including human resources, workforce development, public utility rates and energy, safety and health, employee benefits, environmental quality, and taxation.
Southeast Lumber Manufacturers Association. The Southeastern Lumber Manufacturers Association (SLMA) is a trade association that represents solid sawn lumber manufacturing operations, lumber remanufacturing operations, lumber treating operations, and their suppliers in 17 states throughout the southeast.
Georgia Manufacturing Appreciation Week (April 13-17, 2015)—Student Design Competition. Created by the Technical College System of Georgia and the Georgia Department of Economic Development, Manufacturing Appreciation Week recognizes the contribution of manufacturing to the state’s economy. As part of the event, students throughout the state are invited to submit artwork depicting the importance of manufacturing to their lives and communities. Winners are announced at the Governor’s Award Luncheon and the top finalists in each group receive scholarships. The Manufacturer of the Year is also announced during the luncheon. The honor is given to companies in small, medium, and large manufacturer categories that exhibit a high degree of corporate responsibility, economic impact on Georgia, and workforce excellence.
THEORY INTO PRACTICE PAGE | 69

SRS COMMUNITY REUSE ORGANIZATION REGIONAL WORKFORCE STUDY
Industrial Training Programs, Augusta Technical College. Augusta Tech’s industrial training programs were designed to support local manufacturers. The programs include a Programmable Logic Controllers series as well as an Advanced Manufacturing Assessment and Training program, which includes an assessment of skills and individualized target training.
Manufacturing and Technology Center at Aiken Technical College. The MTTC was created in 2007 in partnership with BAE Systems to provide a direct response to the needs of industry. Training is offered at the 30,000 square foot facility in a range of programs that support local sectors, including a blended learning program (web-delivered and hands-on training) in Maintenance & Plant Operations, which can also be applied towards an associate’s in Industrial Technology at Aiken Tech. Other options available through the MTTC include simulation and training for process operators, entry-level process technician training, customized lab technician training, fire and safety training, process improvement, and a range of tests designed to assess job applicants on their knowledge of basic systems.
Georgia Skills Roadshow Initiative. This initiative is intended to highlight the skills employers need now and in the future, and discuss how businesses and schools can build partnerships that will allow students to get skills-based instruction in real-world settings. Presenters at a February 2015 event in Fayette County, GA included representatives of Grenzebach (a German–based manufacturer of automated systems with a facility in Newnan), Atlanta Technical College, and Go Build Georgia, as well as Christoph Sanders, General Consul of the Federal Republic of Germany. The Road Show will visit communities throughout Georgia in 2015 to promote discussions about work-based learning/apprenticeship programs, and their importance in building a future workforce to meet industry needs while helping to ensure the state’s economic success.
South Carolina Manufacturing Extension Partnership (SCMEP). A private, nonprofit group, the SCMEP provides resources to small and medium-size South Carolina businesses. Services include strategy coaching, training, and tools provided by a team of manufacturing specialists who average more than 20 years of experience. Their goal is to help businesses strengthen leadership, develop competencies, drive growth, and eliminate waste. The SCMEP is an affiliate of the National Institute of Standards & Technology and operates under the Department of Commerce. The organization is headquartered in Columbia and operates a Business Learning Center in Greenville.
South Carolina Lean Alliance (SCLA). The SCLA’s goal is to provide a place for companies to work together and expand access to and understanding of lean manufacturing principals. The membership-based organization is coordinated by the SCMEP and its 120 member companies which are broken into five regions including a CSRA chapter. Chapters organize monthly meetings at member facilities, providing an opportunity to benchmark and learn about improvement methodologies. The SCLA publishes a quarterly e-newsletter, conducts an annual benchmark survey, and sponsors Lean manufacturing training events for members. Alliance events consist of a facility presentation on recent improvement projects, a factory tour to showcase the improvements in action, and then an open discussion to further highlight successes and opportunities. Recent event topics include 5S Workplace Organization, Lean Leader Development, Six Sigma Project Management, and A3 Problem Solving.
THEORY INTO PRACTICE PAGE | 70

SRS COMMUNITY REUSE ORGANIZATION REGIONAL WORKFORCE STUDY
CYBERSECURITY/IT
OVERVIEW. The regional cybersecurity sector is anchored by activities at Fort Gordon, which include the National Security Agency’s joint service facility, the US Army Cyber Command, US Army Cyber Center of Excellence, the Seventh Signal Command, and the Aerial Intelligence, Surveillance, and Reconnaissance. With expected growth in each of these activities, the region’s cybersecurity sector, both defense and non-defense, is poised for growth.
Like other sub-sectors of information technology (IT), cybersecurity cuts across multiple industry sectors from retail to finance. While the regional cybersecurity sector is dominated by the aforementioned defense-related activities, the region’s nuclear, manufacturing and healthcare sectors also have cybersecurity needs.
FIGURE 54. SELECTED EMPLOYERS – CYBERSECURITY/IT
Company Location
Academy Solutions Group, LLC Columbia
Angelo Group Columbia
Booz-Allen Hamilton Columbia
Drayton, Drayton & Lamar (DDL) Columbia
JANUS Research Group, Inc. Columbia
L-3 Communications Columbia
NCI Information Systems Columbia
National Security Agency Columbia
Northrop Grumman Columbia
Sabre Systems, Inc. Columbia
Source: SRSCRO, TIP Strategies research.
Like the nuclear sector, industry classification systems do not adequately capture cyber-related activities. As a result, specific employment numbers are not available for the sector. However, key occupations were defined using the Council on Cybersecurity’s Cybersecurity Workforce Handbook. Figures presented in this profile do not represent workers in the cybersecurity industry, but rather provide a sense of the non-military workforce that is available to support the sector.
FIGURE 55. EMPLOYMENT TRENDS, 2004 TO 2014 – CYBERSECURITY/IT (OCCUPATION-BASED)
TOTAL EMPLOYMENT IN RELATED OCCUPATIONS GAINS/LOSSES BY GROUP (2004 = 1.00)
Source: EMSI 2014.3 – QCEW Employees, Non-QCEW Employees, and Self-Employed.
0
10,000
20,000
30,000
40,000
50,000
2004
2005
2006
2007
2008
2009
2010
2011
2012
2013
2014
MathematicalEngineeringBusiness & ManagementComputer/IT
0.50
0.75
1.00
1.25
1.50
1.75
2004
2005
2006
2007
2008
2009
2010
2011
2012
2013
2014
2004
= 1
.00
MathematicalEngineeringBusiness & ManagementComputer/IT
THEORY INTO PRACTICE PAGE | 71

SRS COMMUNITY REUSE ORGANIZATION REGIONAL WORKFORCE STUDY
CYBERSECURITY/IT (CONTINUED) KEY OCCUPATIONS. The cybersecurity occupational structure can be split into four categories: business/management, computer/IT, mathematical, and engineering. For the most part, the nine-county region has a fairly low concentration of workers in cybersecurity-related occupations in comparison to the US. However, the number of workers in many of the cyber occupations shows that there is an adequate supply of workers to accommodate growth in the sector. The more technical cyber occupations—computer and information systems managers, information security analysts, computer research scientists, statisticians, and computer hardware engineers—have low concentrations and low counts.
FIGURE 56. SHARE OF EMPLOYMENT IN SELECTED INDUSTRIES – CYBERSECURITY/IT OCCUPATIONS INCLUDES 2014 LOCATION QUOTIENT (LQ) AND WAGE RATE COMPARISON RELATIVE TO US
Source: EMSI 2014.3 – QCEW Employees, Non-QCEW Employees, and Self-Employed. Notes: Indicates occupation was identified as a high demand occupation (HDO), see page 35. LQs greater than 1.25 are highlighted, as are wage rates above the regional average ($17.96). Marker indicates median hourly wages ≥110% of US () or ≤80% of US (). Continued next page
Com
pute
r Sy
stem
sN
AIC
S 54
15
Fed. G
ovt
., C
ivilia
nN
AIC
S 90
11
Manufa
cturi
ng
NA
ICS
31-3
3
Finance
& Ins.
NA
ICS
52
BUSINESS/MANAGEMENT13-2011 Accountants & Auditors 2,257 0.70 $24.81 0.81 0.8% 0.5% 0.4% 1.2%
13-1111 Management Analysts 1,245 0.70 $30.58 0.84 1.7% 1.9% 0.1% 0.9%
11-3021 Computer & Info. Systems Managers 378 0.47 $44.31 0.75 2.6% 0.1% 0.1% 0.4%
COMPUTERS/IT15-1151 Computer User Support Specialists 1,014 0.68 $18.50 0.83 7.0% - 0.1% 0.5%
15-1131 Computer Programmers 625 0.77 $27.92 0.78 9.4% - 0.1% 0.3%
15-1121 Computer Systems Analysts 601 0.46 $29.84 0.78 8.7% - 0.1% 0.8%
15-1132 Software Developers, Applications 564 0.34 $37.30 0.84 9.6% - 0.1% 0.5%
15-1142 Network & Computer Systems Admin. 555 0.61 $32.62 0.92 3.5% - 0.2% 0.4%
15-1199 Computer Occupations, All Other 384 0.75 $34.59 0.88 1.3% 2.6% - 0.1%
15-1152 Computer Network Support Specialists 307 0.71 $29.97 1.04 2.2% - - 0.3%
15-1133 Software Developers, Systems Software 294 0.31 $31.82 0.66 4.6% - - 0.2%
15-1143 Computer Network Architects 209 0.59 $31.00 0.68 2.6% - - 0.2%
15-1134 Web Developers 188 0.52 $21.15 0.76 3.6% - - 0.1%
15-1141 Database Administrators 148 0.51 $31.67 0.84 1.1% - - 0.2%
15-1122 Information Security Analysts 106 0.54 $32.45 0.76 0.9% - - 0.3%
15-1111 Computer & Info. Research Scientists 21 0.33 $41.64 0.82 0.1% - - -
MATHEMATICAL15-2031 Operations Research Analysts 88 0.47 $23.80 0.66 0.3% 0.2% - 0.2%
15-2041 Statisticians 25 0.37 $29.35 0.77 0.1% - - -
15-2021 Mathematicians <10 0.49 — — - - - -
15-2099 Mathematical Science Occupations, All Other <10 0.67 — — - - - -
ENGINEERING17-2112 Industrial Engineers 607 1.08 $34.57 0.90 0.3% - 1.2% -17-2061 Computer Hardware Engineers 35 0.18 $44.14 0.89 0.6% - - -
Share of employment in:
HD
O SOC Code Description
Jobs in CRO 9-County
Laborshed (2014)
Median Hourly
Earnings
Relative to US
(US=1.00)20
14
Em
p.
LQ
(US
= 1.
00)
THEORY INTO PRACTICE PAGE | 72

SRS COMMUNITY REUSE ORGANIZATION REGIONAL WORKFORCE STUDY
CYBERSECURITY/IT (CONTINUED) DEMAND. Demand projections for cyber-related occupations are low, reflecting historic growth patterns rather than the significant growth that is scheduled to occur at Fort Gordon. Yet, a look at current trends in the regional workforce can be informative. In most of the computer/IT occupations, openings are from new growth rather than replacement jobs. This means that the sector is growing regionally in addition to the growth at Fort Gordon. In addition, a few key occupations are facing a wave of retirements in their existing pool of workers. These occupations include management analysts, operations research, industrial engineers, and computer hardware engineers. FIGURE 57. DEMAND FACTORS & DEMOGRAPHICS – CYBERSECURITY/IT OCCUPATIONS INCLUDES ESTIMATED ANNUAL OPENINGS, 2014 TO 2019
Source: EMSI 2014.3 – QCEW Employees, Non-QCEW Employees, and Self-Employed. Notes: Indicates occupation was identified as a high demand occupation (HDO), see page 35. Annual openings are an estimate of job openings due to net change in employment and replacement needs (e.g., turnover, retirement). Indicates significant share of workforce is reaching retirement age (defined here as ≥25% age 55+ and/or ≥ 5% age 65+).
Annual Openings (2014-19) N
ew jobs
Rep
lace
men
t
% 5
5+ Y
ears
% 6
5+ Y
ears
% M
ale
BUSINESS/MANAGEMENT
13-2011 Accountants & Auditors 2,257 127 39% 61% 22% 5% 38%
13-1111 Management Analysts 1,245 38 45% 55% 31% 9% 57%
11-3021 Computer & Info. Systems Managers 378 15 60% 40% 17% 1% 69%
COMPUTERS/IT
15-1151 Computer User Support Specialists 1,014 40 56% 44% 13% 1% 70%
15-1131 Computer Programmers 625 23 25% 75% 16% 2% 76%
15-1121 Computer Systems Analysts 601 30 65% 35% 18% 2% 66%
15-1132 Software Developers, Applications 564 26 69% 31% 11% 1% 79%
15-1142 Network & Computer Systems Admin. 555 19 49% 51% 11% 1% 79%
15-1199 Computer Occupations, All Other 384 8 - 100% 16% 1% 71%
15-1152 Computer Network Support Specialists 307 9 41% 59% 13% 2% 70%
15-1133 Software Developers, Systems Software 294 13 67% 33% 12% 2% 79%
15-1143 Computer Network Architects 209 7 47% 53% 11% 2% 78%
15-1134 Web Developers 188 8 60% 40% 11% 3% 71%
15-1141 Database Administrators 148 6 52% 48% 18% 3% 60%
15-1122 Information Security Analysts 106 7 70% 30% 22% 5% 73%
15-1111 Computer & Info. Research Scientists 21 - - - 48% 24% 71%
MATHEMATICAL
15-2031 Operations Research Analysts 88 5 55% 45% 26% 6% 55%
15-2041 Statisticians 25 - - - 41% 20% 52%
15-2021 Mathematicians <10 - - - - - -
15-2099 Mathematical Science Occupations, All Other <10 - - - - - -
ENGINEERING
17-2112 Industrial Engineers 607 23 12% 88% 26% 4% 82%
17-2061 Computer Hardware Engineers 35 2 54% 46% 29% 14% 86%
Demographics
HD
O SOC Code Description
Jobs in CRO 9-County
Laborshed (2014)
Demand Factors
THEORY INTO PRACTICE PAGE | 73

SRS COMMUNITY REUSE ORGANIZATION REGIONAL WORKFORCE STUDY
CYBERSECURITY/IT (CONTINUED) REAL-TIME LMI. Figure 58 shows a summary of online job postings in the region for cyber jobs. Currently, there are 159 unique job postings for the cybersecurity industry posted by 34 employers. The vast majority are for jobs in Columbia County. The average salary posted is 87 percent of the US average.
FIGURE 58. SUMMARY FOR JOB POSTINGS THAT INCLUDE “CYBER” HIRING SCALE OPENINGS
Current job openings: 159 Direct employers competing: 34
Average posting duration (in days): 51
SALARY RANGE GEOGRAPHIC DISTRIBUTION
Share of postings by county (past four months)
TOP 10 COUNTS (based on 341 postings over past four months)
Source: Wanted Analytics; TIP Strategies *C4ISR = Command, control, communications, computers, intelligence, surveillance, & reconnaissance
Easy Difficult 57 vs. same job nationally
72 vs. all occupations nationally
P ercen tile 10th 25th 50th 75th 90thLocal $46,700 $63,850 $82,900 $101,950 $119,100
National $52,700 $73,100 $95,750 $118,400 $138,800US=1.00 0.89 0.87 0.87 0.86 0.86
48%
40%
12%
<1%
Columbia Co., GA
Richmond Co., GA
Aiken Co., SC
Barnwell Co., SC
Employers # postingsL-3 Communications/L-3 Natl. Security Solutions 72TASC 45Army/Dept. of Defense/Army Installation Mgmt. 27Academy Solutions Group, LLC 17Booz Allen Hamilton 17Northrop Grumman 17Parsons Corporation 16NCI Information Systems, Inc. 11National Security Agency/NSA 10Engineering Solutions and Products, Inc. 9
# postings15-1122 Information Security Analysts 4625-3021 Self-Enrichment Education Teachers 2815-1143 Computer Network Architects 2815-1142 Network and Computer Systems Admin. 2833-3021 Detectives and Criminal Investigators 2615-2031 Operations Research Analysts 2427-3091 Interpreters and Translators 2015-1121 Computer Systems Analysts 1713-1199 Business Op. Specialists, All Other 1415-1151 Computer User Support Specialists 13
Occupations (SOC-code based)
Hard Skills # postingsSignals Intelligence 87Computer Network 86Cyber security 76Information assurance 31Information security 25Quality control 25Network Security 23Firewall 22C4ISR* 22Microsoft SharePoint 22
Certifications # postingsTop Secret Sensitive Compartmented Information 200National Security Agency 38Cisco Certified Network Associate 38Certified Ethical Hacker 24Teaching English as a Second Language 19Certified Info. Systems Security Professional 19CompTIA Security+ 16Cisco Certified Network Professional 13DoD 8570 Certification 12VMware Certified Professional 11
THEORY INTO PRACTICE PAGE | 74

SRS COMMUNITY REUSE ORGANIZATION REGIONAL WORKFORCE STUDY
CYBERSECURITY/IT (CONTINUED) FIGURE 59. REAL-TIME LMI, SELECTED CYBERSECURITY/IT OCCUPATIONS
15-1122 INFORMATION SECURITY ANALYST HIRING SCALE OPENINGS
Current job openings: 24 Direct employers competing: 18
Average posting duration (in days): 51
SALARY RANGE TOP SKILLS
P ercen t ile 10th 25th 50th 75th 90th Local $65,550 $73,350 $81,800 $90,250 $98,050
National $79,250 $91,700 $105,500 $119,350 $131,800 US=1.00 0.83 0.80 0.78 0.76 0.74
Info. security | Info. assurance | Network security | Cyber security | Computer Network | Firewall | Intrusion detection | Linux | Natl. Institute of Standards & Tech.| Computer forensic | Application security | Nessus | System admin.
15-1143 COMPUTER NETWORK ARCHITECTS
Hiring scale OPENINGS
Current job openings: 30 Direct employers competing: —
Average posting duration (in days): 52
SALARY RANGE TOP SKILLS
P ercen t ile 10th 25th 50th 75th 90th Local $52,050 $60,350 $69,400 $78,450 $86,750
National $58,800 $73,400 $89,600 $105,850 $120,450 US=1.00 0.89 0.82 0.77 0.74 0.72
Signals intelligence | Computer Network | Open source technology | Wide Area Network | Local Area Network | FS Poly | Voice over internet protocol | Network design | Avaya | Open Systems Interconnection | MS SharePoint
15-1142 NETWORK AND COMPUTER SYSTEMS ADMINISTRATORS HIRING SCALE OPENINGS
Current job openings: 91 Direct employers competing: 46
Average posting duration (in days): 54
SALARY RANGE TOP SKILLS
P ercen t ile 10th 25th 50th 75th 90th Local $57,550 $63,450 $70,000 $76,550 $82,450
National $58,250 $70,400 $83,950 $97,500 $109,700 US=1.00 0.99 0.90 0.83 0.79 0.75
Linux | VMware software | Structured query language | UNIX | System admin. | Tech. support | Storage Area Network | Info. assurance | MS SQL Server | Virtualization | MS Active Directory | Network security | Trans. Control Protocol
15-2031 OPERATIONS RESEARCH ANALYSTS HIRING SCALE OPENINGS
Current job openings: 16 Direct employers competing: —
Average posting duration (in days): 47
SALARY RANGE TOP SKILLS
P ercen t ile 10th 25th 50th 75th 90th Local $49,800 $54,850 $60,250 $65,650 $70,700
National $41,850 $53,300 $66,050 $78,800 $90,250 US=1.00 1.19 1.03 0.91 0.83 0.78
Computer Network | FS Poly | MS Visual Basic/ Visual Basic for Apps | Inspection Selection System | Work order | EDI X12 | File Transfer Protocol | Disk Operating System | Microsoft SQL Server | Structured query language | Technical support
Source: Wanted Analytics; TIP Strategies.
Easy Difficult94 vs. same job nationally
92 vs. all occupations nationally
Easy Difficult—insufficient data to calculate local hiring scale
77 vs. all occupations nationally
Easy Difficult76 vs. same job nationally
83 vs. all occupations nationally
Easy Difficult—insufficient data to calculate local hiring scale
71 vs. all occupations nationally
THEORY INTO PRACTICE PAGE | 75

SRS COMMUNITY REUSE ORGANIZATION REGIONAL WORKFORCE STUDY
CYBERSECURITY/IT (CONTINUED) Six cybersecurity firms participated in the employer survey. Of those participants, all plan to hire additional employees over the next two years. These employers estimated that they will add more than 150 workers. The majority of these workers (59 percent) will be in professional occupations, which include engineers, administrator, and analyst positions.
One respondent reported that they had an occupation they were unable to fill—a professional proposal writer. Many respondents reported they had difficulty recruiting for certain occupations and finding certain skills. Upper management was cited by two respondents as difficult to recruit. Engineering skills were most often mentioned as difficult to find.
FIGURE 60. FINDINGS FROM EMPLOYER SURVEY – CYBERSECURITY FIRMS OVER THE NEXT 2 YEARS, DO YOU PLAN TO HIRE ADDITIONAL EMPLOYEES WITHIN THE CRO REGION?
APPROXIMATELY HOW MANY WORKERS DO YOU PLAN TO ADD IN EACH OF THE FOLLOWING CATEGORIES?
WHICH OCCUPATIONS ARE DIFFICULT TO RECRUIT IN YOUR INDUSTRY?
WHICH SKILLS ARE DIFFICULT TO FIND IN YOUR INDUSTRY?
Computer Engineers Computer Scientist Cyber Expertise Digital Artist Intelligence IT Professionals Proposal Writers Sales Upper Management (2)
Computer Scientist Cyber Analysis Digital Artist Engineering Engineers - Communications Engineers - Electronic Warfare Engineers - Spectrum RF Sales Software Developers Management Writing
Yes100%
n=6
17
94
35
13
Man
agem
ent
Prof
essi
onal
(Eng
inee
r,A
dmin
istra
tor,
Ana
lyst)
Tech
nici
an /
Spec
ialis
t
Adm
inis
trativ
e &
Cle
rical
THEORY INTO PRACTICE PAGE | 76

SRS COMMUNITY REUSE ORGANIZATION REGIONAL WORKFORCE STUDY
CYBERSECURITY/IT (CONTINUED) FIGURE 61. FINDINGS FROM EMPLOYER SURVEY – CYBERSECURITY FIRMS The respondents in the cybersecurity industry rate the regional workforce as fair to good. Employee attitudes and professionalism ranked the highest. Computer and math skills as well as entry-level skills were ranked the lowest.
HOW WOULD YOU RATE THE REGIONAL WORKFORCE OVERALL ON THE FOLLOWING CHARACTERISTICS?
3%
3%
25%31%
11%
14%17%17%
6%11%
26%33%34%
50%34%
46%44%
31%25%
31%44%36%
40%44%46%
22%34%
40%56%
50%50%
53%50%
53%34%
22%20%
6%8%
0% 20% 40% 60% 80% 100%
Job readinessEntry-level skills
AdaptibilityTrainability
Employee attitudesProfessionalismTeamwork skills
ProductivityReliability
Communication skillsMath skills
Computer skills
No opinion Poor Fair Good Excellent
THEORY INTO PRACTICE PAGE | 77

SRS COMMUNITY REUSE ORGANIZATION REGIONAL WORKFORCE STUDY
CYBERSECURITY/IT (CONTINUED) EDUCATION & TRAINING. Figure 62 shows the wages and the typical requirements for entry into specific occupations.
All of the cyber-related occupations are considered high-skill, requiring a bachelor’s degree or higher. Many of the occupations have entry-level openings. Information security analysts and database administrators often require some work experience. Computer and information systems managers and computer network architects require five or more years of work experience.
FIGURE 62. EDUCATION & TRAINING REQUIREMENTS – CYBERSECURITY/IT OCCUPATIONS WITH HOURLY EARNINGS FOR SELECTED PERCENTILES, INCLUDING MEDIAN (50TH)
Source: EMSI 2014.3 – QCEW Employees, Non-QCEW Employees, and Self-Employed.
10th 50th 90th Education Experience
BUSINESS/MANAGEMENT11-3021 Computer & Info. Systems Managers $27.92 $44.31 $65.65 Bachelor's 5+ years None
13-1111 Management Analysts $18.29 $30.58 $49.67 Bachelor's < 5 years None
13-2011 Accountants & Auditors $16.06 $24.81 $40.71 Bachelor's None None
COMPUTERS/IT15-1111 Computer & Info. Research Scientists $24.01 $41.64 $61.66 Advanced degree None None
15-1121 Computer Systems Analysts $18.42 $29.84 $46.37 Bachelor's None None
15-1122 Information Security Analysts $20.89 $32.45 $50.93 Bachelor's < 5 years None
15-1131 Computer Programmers $17.73 $27.92 $44.37 Bachelor's None None
15-1132 Software Developers, Applications $21.99 $37.30 $54.41 Bachelor's None None
15-1133 Software Developers, Systems Software $19.14 $31.82 $48.57 Bachelor's None None
15-1134 Web Developers $14.12 $21.15 $34.75 Associate's None None
15-1141 Database Administrators $18.63 $31.67 $48.77 Bachelor's < 5 years None
15-1142 Network & Computer Systems Admin. $20.61 $32.62 $51.63 Bachelor's None None
15-1143 Computer Network Architects $21.06 $31.00 $46.72 Bachelor's 5+ years None
15-1151 Computer User Support Specialists $10.68 $18.50 $30.49 Some college None Moderate-term OJT
15-1152 Computer Network Support Specialists $17.93 $29.97 $44.54 Associate's None None
15-1199 Computer Occupations, All Other $23.56 $34.59 $49.91 Bachelor's None None
MATHEMATICAL15-2021 Mathematicians - - - Advanced degree None None
15-2031 Operations Research Analysts $15.92 $23.80 $36.45 Bachelor's None None
15-2041 Statisticians $19.54 $29.35 $45.60 Advanced degree None None
15-2099 Mathematical Science Occupations, All Other - - - Bachelor's None None
ENGINEERING17-2061 Computer Hardware Engineers $30.55 $44.14 $61.14 Bachelor's None None
17-2112 Industrial Engineers $23.60 $34.57 $52.47 Bachelor's None None
Typical Requirements for Entry into Occupation:
Training Required For Competency
Hourly Earnings (percentiles)
HD
O SOC Code Description
THEORY INTO PRACTICE PAGE | 78

SRS COMMUNITY REUSE ORGANIZATION REGIONAL WORKFORCE STUDY
CYBERSECURITY/IT (CONTINUED) In the region, there are few existing programs that support the cyber sector. Data processing technology and network and system administration are the most popular computer-related fields. Computer systems networking and computer programming also graduate about 20 students each year. The rest of the computer-related fields of study are very general and may not match well with the specific cyber-skills required by regional employers in the sector.
Accounting and general business fields of study are fairly popular in the region, but are also in high-demand in other industries and other regions as well. This implies that there may be a high degree of competition for top graduates in these fields.
FIGURE 63. RELEVANT COMPLETIONS – CYBERSECURITY/IT OCCUPATIONS THREE-YEAR ANNUAL AVERAGE OF DEGREES/AWARDS CONFERRED, 2011-2013
Source: National Center for Education Statistics, Integrated Postsecondary Education Data System (IPEDS) surveys; National Crosswalk Service Center; TIP Strategies. IPEDS data include only schools eligible to participate in federal financial aid programs. Figures shown include first and second majors. *Associate’s-degree-level completions include awards categorized by IPEDS as "Award of at least two but less than four academic years." **Advanced-level completions represent all awards above the bachelor’s-degree level.
CIP Code Field of Study C
ertifi
cate
( < 1
yea
r)
Cer
tifi
cate
( ≥1
yr.,
< 2
yrs.
)
Ass
oci
ate
's*
Bach
elor'
s
Adva
nce
d** Annual average
degrees/awards conferred (all levels)
COMPUTER AND MATHEMATICAL
11.0301 Data Processing Technology/Technician 48 58 106
11.1001 Network and System Administration/Administrator 31 9 1 41
11.0901 Computer Systems Networking/Telecomm. 16 11 27
11.0201 Computer Programming/Programmer, General 8 9 18
11.0101 Computer and Information Sciences, General 4 13 17
27.0301 Applied Mathematics, General 14 14
11.0202 Computer Programming, Specific Applications 8 8
27.0101 Mathematics, General 7 7
11.0103 Information Technology 6 6
26.1102 Biostatistics 4 4
30.0801 Mathematics and Computer Science 2 2
BUSINESS/MANAGEMENT
52.0301 Accounting 44 35 79
52.1201 Management Information Systems, General 21 21
52.0305 Accounting and Business/Management 3 3
52.0205 Operations Management and Supervision 1 1 2
Degrees/awards by level
THEORY INTO PRACTICE PAGE | 79

SRS COMMUNITY REUSE ORGANIZATION REGIONAL WORKFORCE STUDY
CYBERSECURITY/IT (CONTINUED) SELECTED INITIATIVES & RESOURCES.
CSRA Alliance for Fort Gordon. The CSRA Alliance is a nonprofit formed by business leaders and elected officials who intended to build on the strong bond already in existence between Fort Gordon and the surrounding communities. The Alliance’s mission is to enhance the economic value of the community by demonstrating the potential for Fort Gordon to grow existing missions and take on new missions. In addition, the Alliance promotes economic development through partnerships capitalizing on the information technology, communications, and medical expertise prominent at Fort Gordon.
Alliance for Cybersecurity Education (ACE). The goal of ACE is to promote cyber education in secondary schools and its integration into postsecondary education, so as facilitate a workforce directly achieving the needs of the cyber community. They do this by designing certified secondary education curricula. The partnership was developed by economic development entities including the Augusta Metro and Columbia County Chambers of Commerce; educational institutions including the Aiken Technical College, Georgia Regents University, and the Columbia and Richmond Counties School Systems; as well as the CSRA Alliance and Fort Gordon. ACE also positions the CSRA as a resource and partner with NSA-Georgia, the Cyber Center of Excellence, and Fort Gordon in cyber expertise.
Information Systems Security Association (ISSA). ISSA is a nonprofit, international organization providing educational forums, publications, and peer interaction opportunities to information security professionals and practitioners. Its mission is to enhance the knowledge, skills, and professional growth of its members. The Greater Augusta Chapter meets quarterly and provides security professionals with an opportunity to network, share ideas, and receive technical training.
Technology Association of Georgia (TAG). With over 26,000 members and 200 events per year, TAG’s mission is to educate, promote, influence, and unite those in the technology sector. Along with member networking events, the organization is an advocate for positive public policy change and works with government leaders to develop and enact polices and legislation that will bolster the growth of the technology community. In addition, TAG partners with city, regional, and state chambers of commerce to promote the companies and people that comprise the industry.
theClubhou.se. TheClubhou.se is a nonprofit which provides a space for technology professionals in Augusta, GA. Based out of a historic schoolhouse built in 1802, the space is divided into a wing for learning and prototyping and a space for co-working and business incubation. The organization believes in the power of businesses to impact the community; in the first two years of operation they housed over 25 start ups and created a $5 million annual economic impact in Greater Augusta.
Microsoft IT Academy (Georgia). Developed through a partnership between Microsoft and the Georgia Department of Education, the Academy is designed to provide students with technology skills necessary to acquire certification and be competitive in today’s workplace. This is achieved through curricula design, IT Readiness resources, and training opportunities.
THEORY INTO PRACTICE PAGE | 80

SRS COMMUNITY REUSE ORGANIZATION REGIONAL WORKFORCE STUDY
Computer Science Teachers Association (CSTA). CSTA supports and promotes the teaching of science and other computing disciplines through K-12 education using seminars and training. This is achieved by providing opportunities for teacher and students to better understand the computing disciplines and to more successfully prepare themselves to teach and learn.
THEORY INTO PRACTICE PAGE | 81

SRS COMMUNITY REUSE ORGANIZATION REGIONAL WORKFORCE STUDY
MEDICAL
OVERVIEW. The medical sector employs almost 33,000 workers in the nine-county region. The medical sector grew 20 percent between 2004 and 2014 and employs the largest number of workers of any industry sector in the region. Yet the relative concentration of employment in the industry is slightly less than that of the US as evidenced by an LQ of 0.91. The five-county CRO region has an LQ of 1.04, which means that the share of employment in this sector is slightly above that of the nation.
FIGURE 64. SELECTED EMPLOYERS – MEDICAL Company Location
Aiken Regional Medical Centers Aiken
Georgia Regents Health System Richmond/Columbia
HCA/Doctors Hospital Richmond
Trinity Hospital of Augusta Richmond
University Healthcare System Richmond/Columbia
VA Medical Center Richmond
Source: SRSCRO, TIP Strategies research.
The medical sector is comprised of three primary sectors: ambulatory health care services (NAICS 621); hospitals (NAICS 622); and nursing and residential (NAICS 623). The largest segment is ambulatory health care services, which accounts for 47 percent of all employment in the region. This segment is also the fastest growing.
FIGURE 65. EMPLOYMENT TRENDS, 2004 TO 2014 – MEDICAL (INDUSTRY–BASED)
TOTAL EMPLOYMENT BY MAJOR INDUSTRY GAINS/LOSSES BY MAJOR INDUSTRY (2004 = 1.00)
Source: EMSI 2014.3 – QCEW Employees, Non-QCEW Employees, and Self-Employed.
0
10,000
20,000
30,000
40,000
50,000
2004
2005
2006
2007
2008
2009
2010
2011
2012
2013
2014
Nursing and Residential Care FacilitiesHospitalsAmbulatory Health Care Services
0.50
0.75
1.00
1.25
1.50
1.75
2004
2005
2006
2007
2008
2009
2010
2011
2012
2013
2014
2004
= 1
.00
Nursing and Residential Care FacilitiesHospitalsAmbulatory Health Care Services
THEORY INTO PRACTICE PAGE | 82

SRS COMMUNITY REUSE ORGANIZATION REGIONAL WORKFORCE STUDY
MEDICAL (CONTINUED) KEY OCCUPATIONS. Healthcare occupations can be categorized as professional/technical, support, and management and administrative. The nine-county region has a higher than average concentration of workers in 15 different occupations (LQ>1.25). The occupations with the highest relative concentrations are ambulance drivers and EMTs (LQ>2.00). The concentrations of psychiatric aides and physical therapy aides is particularly low (LQ<0.65). There is also a low concentration of family and general practitioners (LQ = 0.78).
The wages in most of the occupations in the professional/technical category and in some of the occupations in the management and administrative category are higher than the regional median hourly earnings. Occupations in the healthcare support category are lower wage jobs with the exception of physical therapy aides and all other healthcare support workers.
FIGURE 66. SHARE OF EMPLOYMENT IN SELECTED INDUSTRIES – MEDICAL OCCUPATIONS INCLUDES 2014 LOCATION QUOTIENT (LQ) AND WAGE RATE COMPARISON RELATIVE TO US
Source: EMSI 2014.3 – QCEW Employees, Non-QCEW Employees, and Self-Employed. Notes: Indicates occupation was identified as a high demand occupation (HDO), see page 35. LQs greater than 1.25 are highlighted, as are wage rates above the regional average ($17.96). Marker indicates median hourly wages ≥110% of US () or ≤80% of US (). Continued next page
Outp
atien
t Sv
cs.
NA
ICS
621
Hosp
itals
NA
ICS
622
Res
iden
tial Care
NA
ICS
623
HEALTHCARE - PROFESSIONAL/TECHNICAL 29-1141 Registered Nurses 8,507 1.30 $30.48 0.96 8.9% 34.3% 7.6%
29-2061 Licensed Practical/Vocational Nurses 2,605 1.47 $18.70 0.93 4.7% 3.4% 11.2%
29-1069 Physicians & Surgeons, All Other 1,293 1.55 $62.44 0.71 4.5% 2.2% -
29-2041 Emergency Medical Techs. & Paramedics 1,234 2.12 $14.91 0.99 4.3% 0.7% -
29-2052 Pharmacy Technicians 1,232 1.39 $14.03 0.98 0.2% 1.1% -
29-1051 Pharmacists 879 1.25 $56.53 0.99 0.2% 1.1% -
29-2011 Medical & Clinical Laboratory Technologists 731 1.87 $23.42 0.83 1.7% 2.9% -
29-2034 Radiologic Technologists 631 1.33 $25.87 0.97 1.3% 2.2% -
29-2021 Dental Hygienists 506 1.07 $28.95 0.83 2.6% - -
29-1126 Respiratory Therapists 505 1.77 $25.28 0.93 0.2% 2.9% 0.2%
29-2012 Medical & Clinical Laboratory Technicians 463 1.21 $19.10 1.05 1.3% 1.2% -
29-2071 Medical Records & Health Info. Technicians 440 0.98 $17.37 1.03 0.9% 1.0% 0.5%
29-1123 Physical Therapists 430 0.85 $38.69 1.00 1.4% 1.1% 0.4%
29-2055 Surgical Technologists 422 1.75 $17.43 0.85 0.8% 2.1% -
29-1171 Nurse Practitioners 395 1.40 $42.50 0.95 1.9% 0.8% 0.1%
29-1021 Dentists, General 278 0.88 $85.03 1.17 1.5% - -
29-1062 Family & General Practitioners 256 0.78 $70.21 0.85 0.9% 0.1% -
29-2099 Health Technologists & Technicians, All Other 247 1.06 $18.48 0.90 0.8% 0.9% -
29-1031 Dietitians & Nutritionists 242 1.51 $17.27 0.64 0.4% 0.6% 0.3%
29-2031 Cardiovascular Technologists & Techs. 219 1.75 $26.03 1.02 0.3% 1.1% -
Share of employment in:
Relative to US
(US=1.00)HD
O SOC Code Description
Jobs in CRO 9-County
Laborshed (2014)
Median Hourly
Earnings20
14
Em
p.
LQ
(US
= 1.
00)
THEORY INTO PRACTICE PAGE | 83

SRS COMMUNITY REUSE ORGANIZATION REGIONAL WORKFORCE STUDY
FIGURE 66. SHARE OF EMPLOYMENT IN SELECTED INDUSTRIES –MEDICAL OCCUPATIONS (CONT.)
Source: EMSI 2014.3 – QCEW Employees, Non-QCEW Employees, and Self-Employed. Notes: Indicates occupation was identified as a high demand occupation (HDO), see page 35. LQs greater than 1.25 are highlighted, as are wage rates above the regional average ($17.96). Marker indicates median hourly wages ≥110% of US () or ≤80% of US ().
Outp
atien
t Sv
cs.
NA
ICS
621
Hosp
itals
NA
ICS
622
Res
iden
tial C
are
NA
ICS
623
HEALTHCARE SUPPORT31-1014 Nursing Assistants 3,999 1.12 $11.14 0.93 2.2% 8.4% 28.6%
31-1011 Home Health Aides 2,448 1.06 $9.59 0.96 2.3% 0.1% 9.9%
31-9092 Medical Assistants 1,417 0.99 $13.33 0.93 7.6% 1.2% 0.4%
31-9091 Dental Assistants 877 1.15 $15.87 0.95 5.3% - -
31-9099 Healthcare Support Workers, All Other 360 1.45 $17.97 1.09 0.5% 0.9% 0.2%
31-9097 Phlebotomists 281 1.06 $11.84 0.82 1.1% 0.5% -
31-9094 Medical Transcriptionists 232 1.20 $17.38 1.08 0.5% 0.5% -
31-1015 Orderlies 204 1.50 $10.92 0.94 0.1% 0.6% 0.7%
31-2021 Physical Therapist Assistants 155 0.87 $25.68 1.00 0.6% 0.4% 0.3%
31-9093 Medical Equipment Preparers 114 0.90 $13.92 0.91 0.2% 0.6% -
31-2022 Physical Therapist Aides 74 0.62 $11.64 1.00 0.3% 0.2% 0.1%
31-1013 Psychiatric Aides 57 0.31 $11.53 0.95 - 0.2% 0.2%
MANAGEMENT & ADMINISTRATIVE 43-9061 Office Clerks, General 7,686 0.99 $11.72 0.87 2.3% 1.0% 0.8%
43-4051 Customer Service Representatives 7,242 1.22 $12.11 0.81 0.7% 0.5% 0.1%
43-6014 Secretaries/Admin. Asst., Exc. Legal, Med., & Exec. 6,019 0.96 $14.32 0.91 1.2% 0.7% 0.5%
11-1021 General & Operations Managers 4,520 0.91 $37.50 0.81 0.6% 0.2% 0.6%
43-1011 First-Line Supvsr., Office & Admin. Support 3,472 1.01 $20.04 0.83 1.6% 0.5% 0.3%
43-3031 Bookkeeping, Accounting, & Auditing Clerks 3,444 0.80 $15.26 0.89 0.6% 0.2% 0.3%
43-4171 Receptionists & Information Clerks 2,471 0.98 $11.67 0.91 5.5% 0.6% 1.0%
43-3021 Billing & Posting Clerks 1,255 1.00 $13.83 0.85 2.0% 0.5% 0.1%
43-6011 Exec. Secretaries/Admin. Assistants 1,235 0.65 $20.93 0.88 0.3% 0.3% 0.1%
43-6013 Medical Secretaries 887 0.69 $15.44 1.01 3.3% 1.2% 0.1%
11-3011 Administrative Services Managers 774 1.14 $40.18 1.02 0.2% 0.3% 0.2%
11-9111 Medical & Health Services Managers 771 1.02 $39.03 0.90 1.4% 2.0% 0.9%
43-4111 Interviewers, Except Eligibility & Loan 293 0.56 $14.95 1.02 0.1% 0.7% -
Share of employment in:
Relative to US
(US=1.00)HD
O SOC Code Description
Jobs in CRO 9-County
Laborshed (2014)
Median Hourly
Earnings20
14
Em
p. LQ
(U
S =
1.00
)
THEORY INTO PRACTICE PAGE | 84

SRS COMMUNITY REUSE ORGANIZATION REGIONAL WORKFORCE STUDY
MEDICAL (CONTINUED) DEMAND. Figure 67 shows demand factors and select demographic characteristics for the key medical occupations.
Registered nurses and licensed practical/vocational nurses (LVNs) are by far the highest-demand occupations. With LVNs, this demand is largely driven by high turnover in the industry as 63 percent of the demand is for replacement jobs rather than new jobs. Physicians and surgeons was also identified as an area of high demand because a large number of doctors have reached or will reach retirement age in the next five to ten years. Family and general practitioners and dentists are facing a similar situation with the aging of their workforce. Surgical technologists, health technologists, pharmacy technicians, psychiatric aides, home health aides, and physical therapy aides are facing particularly high growth in new jobs.
FIGURE 67. DEMAND FACTORS & DEMOGRAPHICS – MEDICAL OCCUPATIONS INCLUDES ESTIMATED ANNUAL OPENINGS, 2014 TO 2019
Source: EMSI 2014.3 – QCEW Employees, Non-QCEW Employees, and Self-Employed. Notes: Indicates occupation was identified as a high demand occupation (HDO), see page 35. Annual openings are an estimate of job openings due to net change in employment and replacement needs (e.g., turnover, retirement). Indicates significant share of workforce ia reaching retirement age (defined here as ≥25% age 55+ and/or ≥ 5% age 65+). Continued next page
Annual Openings (2014-19) N
ew jobs
Rep
lace
men
t
% 5
5+ Y
ears
% 6
5+ Y
ears
% M
ale
HEALTHCARE - PROFESSIONAL/TECHNICAL
29-1141 Registered Nurses 8,507 346 49% 51% 24% 4% 7%
29-2061 Licensed Practical/Vocational Nurses 2,605 106 37% 63% 24% 4% 6%
29-1069 Physicians & Surgeons, All Other 1,293 45 21% 79% 27% 8% 62%
29-2041 Emergency Medical Techs. & Paramedics 1,234 85 55% 45% 8% 1% 59%
29-2052 Pharmacy Technicians 1,232 43 68% 32% 11% 2% 19%
29-1051 Pharmacists 879 42 44% 56% 22% 6% 42%
29-2011 Medical & Clinical Laboratory Technologists 731 30 32% 68% 22% 3% 23%
29-2034 Radiologic Technologists 631 22 56% 44% 17% 2% 23%
29-2021 Dental Hygienists 506 33 55% 45% 16% 1% 3%
29-1126 Respiratory Therapists 505 18 56% 44% 17% 1% 28%
29-2012 Medical & Clinical Laboratory Technicians 463 27 50% 50% 22% 3% 24%
29-2071 Medical Records & Health Info. Technicians 440 23 45% 55% 23% 5% 9%
29-1123 Physical Therapists 430 25 53% 47% 11% 1% 25%
29-2055 Surgical Technologists 422 16 72% 28% 12% 1% 19%
29-1171 Nurse Practitioners 395 19 57% 43% 23% 3% 6%
29-1021 Dentists, General 278 15 46% 54% 34% 12% 69%
29-1062 Family & General Practitioners 256 11 30% 70% 28% 9% 59%
29-2099 Health Technologists & Technicians, All Other 247 8 69% 31% 18% 2% 31%
29-1031 Dietitians & Nutritionists 242 7 57% 43% 19% 2% 7%
29-2031 Cardiovascular Technologists & Techs. 219 9 64% 36% 16% 2% 22%
Demand Factors Demographics
HD
O SOC Code Description
Jobs in CRO 9-County
Laborshed (2014)
THEORY INTO PRACTICE PAGE | 85

SRS COMMUNITY REUSE ORGANIZATION REGIONAL WORKFORCE STUDY
FIGURE 67. DEMAND FACTORS & DEMOGRAPHICS – MEDICAL OCCUPATIONS (CONT.)
Source: EMSI 2014.3 – QCEW Employees, Non-QCEW Employees, and Self-Employed. Notes: Indicates occupation was identified as a high demand occupation (HDO), see page 35. Annual openings are an estimate of job openings due to net change in employment and replacement needs (e.g., turnover, retirement). Indicates significant share of workforce ia reaching retirement age (defined here as ≥25% age 55+ and/or ≥ 5% age 65+).
Annual Openings (2014-19) N
ew jobs
Rep
lace
men
t
% 5
5+ Y
ears
% 6
5+ Y
ears
% M
ale
HEALTHCARE SUPPORT31-1014 Nursing Assistants 3,999 158 48% 52% 19% 4% 10%
31-1011 Home Health Aides 2,448 167 68% 32% 21% 6% 10%
31-9092 Medical Assistants 1,417 65 54% 46% 12% 2% 6%
31-9091 Dental Assistants 877 42 53% 47% 12% 1% 4%
31-9099 Healthcare Support Workers, All Other 360 10 23% 77% 19% 3% 20%
31-9097 Phlebotomists 281 15 61% 39% 13% 2% 15% 31-9094 Medical Transcriptionists 232 8 34% 66% 20% 2% 5%
31-1015 Orderlies 204 8 47% 53% 20% 5% 12%
31-2021 Physical Therapist Assistants 155 9 60% 40% 12% 3% 19%
31-9093 Medical Equipment Preparers 114 6 57% 43% 20% 4% 15%
31-2022 Physical Therapist Aides 74 5 62% 38% 13% 7% 19%
31-1013 Psychiatric Aides 57 5 73% 27% 17% 9% -
MANAGEMENT & ADMINISTRATIVE 43-9061 Office Clerks, General 7,686 242 29% 71% 25% 7% 18% 43-4051 Customer Service Representatives 7,242 386 44% 56% 14% 2% 28% 43-6014 Secretaries/Admin. Asst., Exc. Legal, Med., & Exec. 6,019 175 55% 45% 29% 7% 4%
11-1021 General & Operations Managers 4,520 144 36% 64% 22% 3% 72%
43-1011 First-Line Supvsr., Office & Admin. Support 3,472 148 40% 60% 22% 4% 30% 43-3031 Bookkeeping, Accounting, & Auditing Clerks 3,444 92 60% 40% 30% 8% 10%
43-4171 Receptionists & Information Clerks 2,471 109 35% 65% 23% 7% 7%
43-3021 Billing & Posting Clerks 1,255 51 51% 49% 20% 4% 9% 43-6011 Exec. Secretaries/Admin. Assistants 1,235 26 36% 64% 30% 7% 4%
43-6013 Medical Secretaries 887 48 74% 26% 27% 6% 3% 11-3011 Administrative Services Managers 774 23 41% 59% 29% 5% 62%
11-9111 Medical & Health Services Managers 771 38 47% 53% 28% 4% 25%
43-4111 Interviewers, Except Eligibility & Loan 293 10 38% 62% 22% 6% 18%
Demand Factors Demographics
HD
O SOC Code Description
Jobs in CRO 9-County
Laborshed (2014)
THEORY INTO PRACTICE PAGE | 86

SRS COMMUNITY REUSE ORGANIZATION REGIONAL WORKFORCE STUDY
MEDICAL (CONTINUED) REAL-TIME LMI. Figure 68 shows a summary of online job postings in the region for medical jobs. Currently, there are 1,572 unique job postings for the medical industry posted by 248 employers. The vast majority are for jobs in Richmond County. The average salary posted is 107 percent of the US average.
FIGURE 68. SUMMARY FOR JOB POSTINGS SPECIFIYING MEDICAL/HEALTH FUNCTIONAL AREA HIRING SCALE OPENINGS
Current job openings: 1,572 Direct employers competing: 248
Average posting duration (in days): 48
SALARY RANGE GEOGRAPHIC DISTRIBUTION
Share of postings by county (past four months)
TOP 10 COUNTS (based on 3,921 postings over past four months)
Source: Wanted Analytics; TIP Strategies.
Easy Difficult 39 vs. same job nationally
45 vs. all occupations nationally
P ercen tile 10th 25th 50th 75th 90thLocal $48,600 $66,850 $87,150 $107,400 $125,650
National $45,850 $62,550 $81,100 $99,650 $116,300US=1.00 1.06 1.07 1.07 1.08 1.08
76%
18%
5% 1% <1%
Richmond Co., GAAiken Co., SCColumbia Co., GABarnwell Co., SCAllendale Co., SC
Employers # postingsHCA - The Healthcare Company 397Doctors Hospital 350Dept. of Veterans Affairs/VA Medical Center 218University Health System, Inc. 217Community Health Systems Inc/CHS-Home Care 177MCG Health System 147Army/Army Install. Mgmt./Army Med. Command 111United Health Services 99WellStar 92Fresenius Medical Care 87
Occupations (SOC-code based) # postings29-1141 Registered Nurses 1,52211-9111 Medical and Health Services Managers 27029-2061 Licensed Practical/Licensed Voc. Nurses 18431-1014 Nursing Assistants 16031-9092 Medical Assistants 9943-6013 Medical Secretaries 9329-2071 Medical Records/Health Info. Techs. 8329-1051 Pharmacists 7829-1069 Physicians and Surgeons, All Other 7729-1123 Physical Therapists 72
Hard Skills # postingsPediatrics 350Behavioral health 300Critical care 298Geriatrics 290Robotic surgery 262Emergency room 170Patient Electronic Medical Record 158Medical information 145Quality Assurance 142Quality control 114
Certifications # postingsCertified Registered Nurse 1,721Basic Life Support 1,251Advanced Cardiac Life Support 507Certification in Cardiopulmonary Resuscitation 466Licensed Practical Nurse 294Board Certified 213Pediatric Advanced Life Support 211Certified in Nursing Administration 182Driver's License 144Basic Cardiac Life Support 136
THEORY INTO PRACTICE PAGE | 87

SRS COMMUNITY REUSE ORGANIZATION REGIONAL WORKFORCE STUDY
MEDICAL (CONTINUED) FIGURE 69. REAL-TIME LMI, SELECTED MEDICAL OCCUPATIONS
29-1141 REGISTERED NURSES HIRING SCALE OPENINGS
Current job openings: 573 Direct employers competing: 94
Average posting duration (in days): 48
SALARY RANGE TOP SKILLS
P ercen t ile 10th 25th 50th 75th 90th Local $63,800 $68,400 $73,500 $78,550 $83,150
National $58,850 $65,200 $72,300 $79,350 $85,750 US=1.00 1.08 1.05 1.02 0.99 0.97
Critical care | Behavioral health | Robotic surgery | Geriatrics | Pediatrics | Emergency room | Quality assurance | Hemodialysis | Medical info. | 20/20 software | Patient electronic med. record | Quality control | Utilization review | Cath lab
11-9111 MEDICAL AND HEALTH SERVICES MANAGERS HIRING SCALE OPENINGS
Current job openings: 105 Direct employers competing: 51
Average posting duration (in days): 46
SALARY RANGE TOP SKILLS
P ercen t ile 10th 25th 50th 75th 90th Local $74,550 $81,450 $89,100 $96,750 $103,650
National $68,300 $80,550 $94,100 $107,700 $119,950 US=1.00 1.09 1.01 0.95 0.90 0.86
Behavioral health | ICD-10/ICD-9 | Quality control | Geriatrics | Network reporting | Clinical review | Hemodialysis | Pediatrics | Critical care | Emergency room | Quality Assurance |Private Practice | Patient Electronic Medical Record
29-2061 LICENSED VOCATIONAL/LICENSED PRACTICAL NURSES HIRING SCALE OPENINGS
Current job openings: 59 Direct employers competing: 28
Average posting duration (in days): 48
SALARY RANGE TOP SKILLS
P ercen t ile 10th 25th 50th 75th 90th Local $41,600 $43,750 $46,150 $48,550 $50,750
National $37,100 $41,150 $45,700 $50,250 $54,350 US=1.00 1.12 1.06 1.01 0.97 0.93
Pediatrics | Hemodialysis | Quality control | Acute rehabilitation | Quality assurance | Geriatrics | 20/20 software | Clinical review | Equipment maintenance | IV Therapy | Critical care | Emergency room | ICD-10/ICD-9
31-1014 NURSING ASSISTANTS HIRING SCALE OPENINGS
Current job openings: 65 Direct employers competing: 28
Average posting duration (in days): 42
SALARY RANGE TOP SKILLS
P ercen t ile 10th 25th 50th 75th 90th Local $23,000 $24,250 $25,650 $27,050 $28,300
National $18,350 $21,550 $25,150 $28,700 $31,950 US=1.00 1.25 1.13 1.02 0.94 0.89
Geriatrics | Behavioral health | Medical info. | Critical care | Food preparation | Pediatrics| Resume processing | Emergency room | Equipment maintenance | Acute rehabilitation
Source: Wanted Analytics; TIP Strategies.
Easy Difficult 39 vs. same job nationally
45 vs. all occupations nationally
Easy Difficult 58 vs. same job nationally
76 vs. all occupations nationally
Easy Difficult 6 vs. same job nationally
21 vs. all occupations nationally
Easy Difficult 5 vs. same job nationally
9 vs. all occupations nationally
THEORY INTO PRACTICE PAGE | 88

SRS COMMUNITY REUSE ORGANIZATION REGIONAL WORKFORCE STUDY
MEDICAL (CONTINUED) EDUCATION & TRAINING. Figure 70 provides an overview of the earnings and typical training requirements for the key medical occupations.
The professional/technical healthcare occupations are largely middle- and high-skill and pay more than the regional median hourly earnings. On the other hand, many of the support and management and administrative occupations are low skill and pay less than the regional median hourly earnings. With the exception of management, most of the key medical occupations can be entry-level positions.
FIGURE 70. EDUCATION & TRAINING REQUIREMENTS – MEDICAL OCCUPATIONS WITH HOURLY EARNINGS FOR SELECTED PERCENTILES, INCLUDING MEDIAN (50TH)
Source: EMSI 2014.3 – QCEW Employees, Non-QCEW Employees, and Self-Employed. Continued next page
10th 50th 90th Education Experience
HEALTHCARE - PROFESSIONAL/TECHNICAL 29-1141 Registered Nurses $20.60 $30.48 $40.62 Associate's None None
29-2061 Licensed Practical/Vocational Nurses $13.54 $18.70 $23.84 Non-degree award None None
29-1069 Physicians & Surgeons, All Other $25.96 $62.44 $120.20 Advanced degree None Intern/residency
29-2041 Emergency Medical Techs. & Paramedics $9.69 $14.91 $21.75 Non-degree award None None
29-2052 Pharmacy Technicians $9.39 $14.03 $19.80 HS or equivalent None Moderate-term OJT
29-1051 Pharmacists $38.08 $56.53 $70.92 Advanced degree None None
29-2011 Medical & Clinical Laboratory Technologists $14.71 $23.42 $33.44 Bachelor's None None
29-2034 Radiologic Technologists $17.66 $25.87 $35.05 Associate's None None
29-2021 Dental Hygienists $20.78 $28.95 $36.30 Associate's None None
29-1126 Respiratory Therapists $17.17 $25.28 $32.69 Associate's None None
29-2012 Medical & Clinical Laboratory Technicians $11.93 $19.10 $29.36 Associate's None None
29-2071 Medical Records & Health Info. Technicians $11.24 $17.37 $27.17 Non-degree award None None
29-1123 Physical Therapists $24.99 $38.69 $52.51 Advanced degree None None
29-2055 Surgical Technologists $11.59 $17.43 $24.01 Non-degree award None None
29-1171 Nurse Practitioners $25.43 $42.50 $55.65 Advanced degree None None
29-1021 Dentists, General $47.38 $85.03 $143.86 Advanced degree None None
29-1062 Family & General Practitioners $33.56 $70.21 $126.47 Advanced degree None Intern/residency
29-2099 Health Technologists & Technicians, All Other $12.04 $18.48 $27.39 HS or equivalent None None
29-1031 Dietitians & Nutritionists $10.95 $17.27 $33.26 Bachelor's None Intern/residency
29-2031 Cardiovascular Technologists & Techs. $12.93 $26.03 $37.52 Associate's None None
Hourly Earnings (percentiles)
Typical Requirements for Entry into Occupation:
Training Required For CompetencyH
DO SOC
Code Description
THEORY INTO PRACTICE PAGE | 89
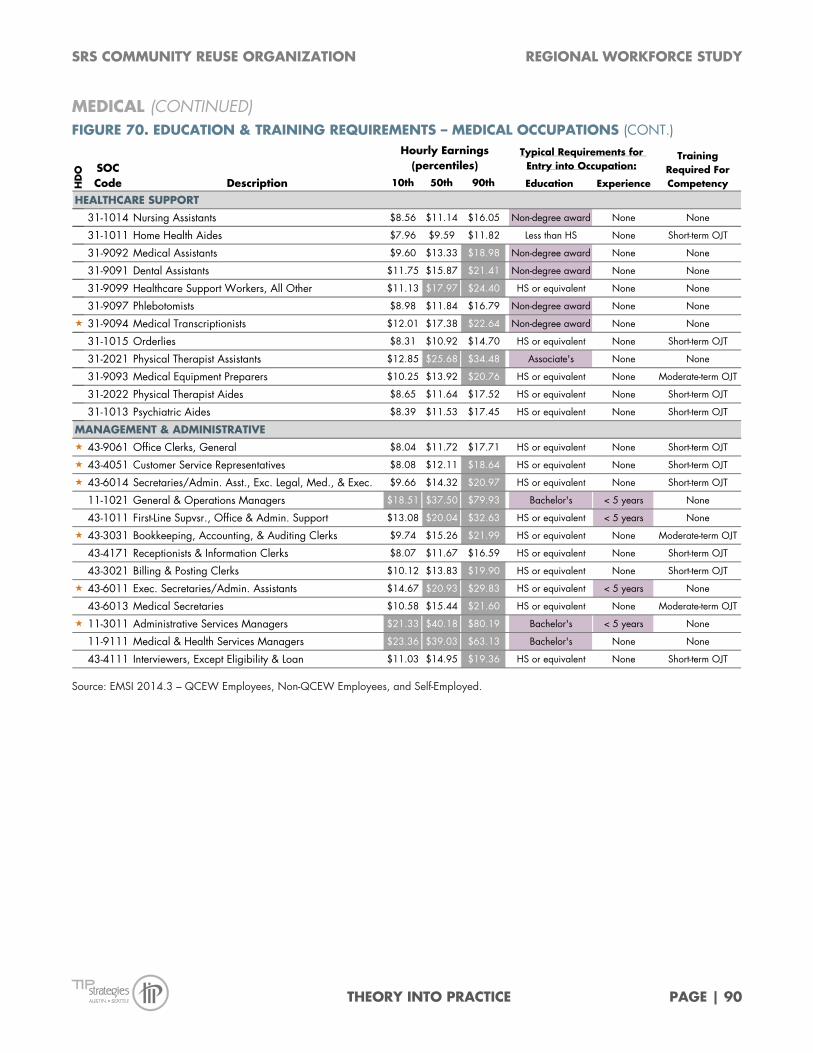
SRS COMMUNITY REUSE ORGANIZATION REGIONAL WORKFORCE STUDY
MEDICAL (CONTINUED) FIGURE 70. EDUCATION & TRAINING REQUIREMENTS – MEDICAL OCCUPATIONS (CONT.)
Source: EMSI 2014.3 – QCEW Employees, Non-QCEW Employees, and Self-Employed.
10th 50th 90th Education Experience
HEALTHCARE SUPPORT
31-1014 Nursing Assistants $8.56 $11.14 $16.05 Non-degree award None None
31-1011 Home Health Aides $7.96 $9.59 $11.82 Less than HS None Short-term OJT
31-9092 Medical Assistants $9.60 $13.33 $18.98 Non-degree award None None
31-9091 Dental Assistants $11.75 $15.87 $21.41 Non-degree award None None
31-9099 Healthcare Support Workers, All Other $11.13 $17.97 $24.40 HS or equivalent None None
31-9097 Phlebotomists $8.98 $11.84 $16.79 Non-degree award None None
31-9094 Medical Transcriptionists $12.01 $17.38 $22.64 Non-degree award None None
31-1015 Orderlies $8.31 $10.92 $14.70 HS or equivalent None Short-term OJT
31-2021 Physical Therapist Assistants $12.85 $25.68 $34.48 Associate's None None
31-9093 Medical Equipment Preparers $10.25 $13.92 $20.76 HS or equivalent None Moderate-term OJT
31-2022 Physical Therapist Aides $8.65 $11.64 $17.52 HS or equivalent None Short-term OJT
31-1013 Psychiatric Aides $8.39 $11.53 $17.45 HS or equivalent None Short-term OJT
MANAGEMENT & ADMINISTRATIVE
43-9061 Office Clerks, General $8.04 $11.72 $17.71 HS or equivalent None Short-term OJT
43-4051 Customer Service Representatives $8.08 $12.11 $18.64 HS or equivalent None Short-term OJT
43-6014 Secretaries/Admin. Asst., Exc. Legal, Med., & Exec. $9.66 $14.32 $20.97 HS or equivalent None Short-term OJT
11-1021 General & Operations Managers $18.51 $37.50 $79.93 Bachelor's < 5 years None
43-1011 First-Line Supvsr., Office & Admin. Support $13.08 $20.04 $32.63 HS or equivalent < 5 years None
43-3031 Bookkeeping, Accounting, & Auditing Clerks $9.74 $15.26 $21.99 HS or equivalent None Moderate-term OJT
43-4171 Receptionists & Information Clerks $8.07 $11.67 $16.59 HS or equivalent None Short-term OJT
43-3021 Billing & Posting Clerks $10.12 $13.83 $19.90 HS or equivalent None Short-term OJT
43-6011 Exec. Secretaries/Admin. Assistants $14.67 $20.93 $29.83 HS or equivalent < 5 years None
43-6013 Medical Secretaries $10.58 $15.44 $21.60 HS or equivalent None Moderate-term OJT
11-3011 Administrative Services Managers $21.33 $40.18 $80.19 Bachelor's < 5 years None
11-9111 Medical & Health Services Managers $23.36 $39.03 $63.13 Bachelor's None None
43-4111 Interviewers, Except Eligibility & Loan $11.03 $14.95 $19.36 HS or equivalent None Short-term OJT
Hourly Earnings (percentiles)
Typical Requirements for Entry into Occupation:
Training Required For CompetencyH
DO SOC
Code Description
THEORY INTO PRACTICE PAGE | 90

SRS COMMUNITY REUSE ORGANIZATION REGIONAL WORKFORCE STUDY
MEDICAL (CONTINUED) The medical sector is well-supported by the regional education and training institutions. Registered nursing is the top field of study and has graduates from programs across award levels from nursing prep to advanced degrees. Medicine, pharmacy technician, LVN, and dentistry round out the top five fields of study in the professional/technical category. Medical assistant, medical insurance coding specialist, dental assistant, and nursing assistant are the most popular fields of study in the support category.
FIGURE 71. RELEVANT COMPLETIONS – MEDICAL OCCUPATIONS THREE-YEAR ANNUAL AVERAGE OF DEGREES/AWARDS CONFERRED, 2011-2013
Source: National Center for Education Statistics, Integrated Postsecondary Education Data System (IPEDS) surveys; National Crosswalk Service Center; TIP Strategies. IPEDS data include only schools eligible to participate in federal financial aid programs. Figures shown include first and second majors. *Associate’s-degree-level completions include awards categorized by IPEDS as "Award of at least two but less than four academic years." **Advanced-level completions represent all awards above the bachelor’s-degree level. Continued next page
CIP Code Field of Study C
ertifi
cate
( < 1
yea
r)
Cer
tifi
cate
( ≥1
yr.,
< 2
yrs
.)
Ass
oci
ate
's*
Bach
elor'
s
Adva
nce
d** Annual average
degrees/awards conferred (all levels)
HEALTHCARE - PROFESSIONAL/TECHNICAL51.3801 Registered Nursing/Registered Nurse 264 200 243 87 79551.1201 Medicine 187 18751.0805 Pharmacy Technician/Assistant 28 60 5 9351.3901 Licensed Practical/Vocational Nurse Training 41 34 7551.0401 Dentistry 63 6351.0707 Health Information/Medical Records Tech. 41 3 17 6151.0713 Medical Insurance Coding Specialist/Coder 19 37 5651.0904 Emergency Medical Technician/Paramedic 51 4 5651.0602 Dental Hygiene/Hygienist 9 19 22 5151.0908 Respiratory Care Therapy/Therapist 2 22 22 4651.0909 Surgical Technology/Technologist 30 12 4251.2308 Physical Therapy/Therapist 34 3451.3805 Family Practice Nurse/Nursing 33 3351.0907 Medical Radiologic Technology/Science - Radiation Therapist 23 6 1 3051.1005 Clinical Laboratory Science/Medical Tech. 15 10 2551.1004 Clinical/Medical Laboratory Technician 2 21 2351.0911 Radiologic Technology/Science - Radiographer 17 1751.3808 Nursing Science 13 1351.3101 Dietetics/Dietitian 11 1151.0901 Cardiovascular Technology/Technologist 7 751.3809 Pediatric Nurse/Nursing 5 551.3814 Critical Care Nursing 4 451.3899 RN, Nursing Admin., Research/Clinical Nursing, Other 3 3
Degrees/awards by level
THEORY INTO PRACTICE PAGE | 91

SRS COMMUNITY REUSE ORGANIZATION REGIONAL WORKFORCE STUDY
MEDICAL (CONTINUED) FIGURE 71. RELEVANT COMPLETIONS – MEDICAL OCCUPATIONS (CONT.) THREE-YEAR ANNUAL AVERAGE OF DEGREES/AWARDS CONFERRED, 2011-2013
Source: National Center for Education Statistics, Integrated Postsecondary Education Data System (IPEDS) surveys; National Crosswalk Service Center; TIP Strategies. IPEDS data include only schools eligible to participate in federal financial aid programs. Figures shown include first and second majors. *Associate’s-degree-level completions include awards categorized by IPEDS as "Award of at least two but less than four academic years." **Advanced-level completions represent all awards above the bachelor’s-degree level.
CIP Code Field of Study C
ertifi
cate
( < 1
yea
r)
Cer
tifi
cate
( ≥1
yr.,
< 2
yrs
.)
Ass
oci
ate
's*
Bach
elor'
s
Adva
nce
d** Annual average
degrees/awards conferred (all levels)
HEALTHCARE - SUPPORT51.0801 Medical/Clinical Assistant 26 99 58 18351.0713 Medical Insurance Coding Specialist/Coder 19 37 5651.0601 Dental Assisting/Assistant 49 4951.3902 Nursing Assistant/Aide and Patient Care Assistant/Aide 47 4751.0806 Physical Therapy Technician/Assistant 4 12 1651.0716 Medical Admin./Exec. Assistant and Medical Secretary 13 1351.0708 Medical Transcription/Transcriptionist 1 1MANAGEMENT & ADMINISTRATIVE52.0201 Business Administration and Management, General 29 5 106 241 79 46152.0401 Admin. Assistant and Secretarial Science, General 18 66 30 11452.0302 Accounting and Bookkeeping 12 16 23 5151.0702 Hospital/Health Care Facilities Administration/Mgmt. 38 3852.0408 General Office Occupations and Clerical Services 36 1 3851.0714 Medical Insurance Specialist/Medical Biller 31 3151.0706 Health Info./Medical Records Admin./Administrator 14 12 2652.0101 Business/Commerce, General 18 1851.0705 Medical Office Management/Administration 18 1852.0801 Finance, General 13 1351.0716 Medical Admin./Exec. Assistant and Medical Secretary 13 1344.0401 Public Administration 12 1251.2201 Public Health, General 8 852.0701 Entrepreneurship/Entrepreneurial Studies 6 651.0718 Long Term Care Administration/Management 2 2
Degrees/awards by level
THEORY INTO PRACTICE PAGE | 92

SRS COMMUNITY REUSE ORGANIZATION REGIONAL WORKFORCE STUDY
MEDICAL (CONTINUED) SELECTED INITIATIVES & RESOURCES.
Richmond County Medical Society. The Richmond County branch of the Medical Association of Georgia (part of the American Medical Association) includes physicians from Richmond, Burke, Columbia, Jefferson, McDuffie, Taliaferro, Warren, Washington, and Wilkes Counties. Monthly meetings are held to address issues and exchange ideas. An Annual Legislative Meeting is also held by the organization and the Society created "Project Access" to provide temporary medical assistance to local residents.
Georgia Hospital Association (GNA). A nonprofit trade association, GNA aims to improve institutional health care services and patient care. They provide information and education on issues such as access to healthcare and clinical care updates, effective hospital management, and compliance with high-level accreditation. GNA is a member of the American Hospital Association and sponsors the Partnership for Health and Accountability (PHA), which is a statewide collaborative that brings together health care providers and community agencies and individuals. The PHA includes representation from groups like hospitals, physicians, state health officials, legislators and businesses. The organization’s goal is to support healthy communities.
South Carolina Hospital Association (SCHA). A private nonprofit organization, SCHA has around 100 member hospitals and health systems and about 900 personal members. The aim of the organization is to support the creation of a world-class healthcare delivery system by fostering high quality patient care and serving as advocates for the hospital community. They achieve this through numerous initiatives such as: AccessHealth SC, which supports communities in providing healthcare services for low-income uninsured people; myschospital.org, a resource for reliable, consistent information about hospitals; SCHA Solutions, which helps hospitals find the best price on business solutions and workforce solutions to meet hospitals' special needs; and advocacy at the state and federal level.
Life Sciences Business Development Center (LSBDC). The LSBDC is an incubator dedicated to supporting entrepreneurs and new companies. Based at Georgia Health Sciences University, the incubator provides entrepreneurial suites which include a wet laboratory, clean or culture room space, office space, and equipment. The incubator is supported by the Georgia Medical Center Authority and the OneGeorgia Authority and is managed by the Medical College of Georgia (MCG) Office of Technology Transfer and Economic Development. An Advisory Board of over 20 business leaders, scientists, and administrators provide advice and assistance on policies for running the incubator. In addition, the LSDBC Board of Business Counselors volunteers to assist tenant companies.
HOSA. HOSA (previously Health Occupations Students of America) is a national student organization that aims to promote career opportunities in the health care industry and enhance the delivery of quality healthcare to all people. HOSA is endorsed by the US Department of Education and the Health Science Education (HSE) Division of the Association for Career & Technical Education (ACTE). Both Georgia and South Carolina have state-level HOSA associations, which help members with career planning and readiness, developing leadership skills, participating in community service activities, and by providing networking opportunities with health professionals.
THEORY INTO PRACTICE PAGE | 93

SRS COMMUNITY REUSE ORGANIZATION REGIONAL WORKFORCE STUDY
Healthcare Science Technology Educators Association, Inc. (HSTEA). HSTEA’s mission is to serve as a resource and network for educators in healthcare science technology fields. They aim to have a positive impact in building the future of healthcare. They achieve this through advocacy, networking, professional development, awards, discounts on publications, and national representation.
THEORY INTO PRACTICE PAGE | 94

SRS COMMUNITY REUSE ORGANIZATION REGIONAL WORKFORCE STUDY
OTHER RESOURCES
Georgia Research Alliance (GRA). The GRA is a nonprofit organization founded in 1990 that partners with universities throughout the state (including Georgia Regents University in Augusta) and is "closely aligned” with Georgia's Department of Economic Development. GRA’s objective is to expand research and commercialization capacity in Georgia’s universities in order to launch new companies, create high-value jobs and transform lives. This is accomplished in four interrelated ways: 1) recruiting world-class scientists to Georgia universities, 2) investing in state-of-the-art research technology for university labs, 3) fueling the commercialization of university-based discoveries and inventions, and 4) forging and strengthening alliances among universities and industry to make Georgia more economically competitive. In 2013, GRA Ventures, the organization’s commercialization arm, created GRA Industry Fellows (an initiative to connect industry experts with university faculty) and the Commercialization Council (a group of successful entrepreneurs and economic development advisors helping to expand the GRA Ventures program).
Career, Technical, and Agricultural Education (CTAE), Georgia Department of Education (GaDOE). The CTAE Division of the GaDOE oversees the state’s career pathways program which encompasses 17 career clusters, including manufacturing. Career-related education begins with career awareness and exploration in middle school and culminates with work-based learning, providing students the opportunity to receive credit while working in an environment related to their career pathway. Educators are supported by the CTAE Resource Network, a nonprofit consortium operated by federal funds. Among the services offered through the network is Georgia C-NET, a statewide student database that allows work-based learning coordinators to create individual training plans utilizing the job titles and tasks lists available via ONET. In addition to facilitating the creation of customized training plans, C-NET allows users to track progress and keep complete histories of employer/student information, while streamlining performance reporting to the GaDOE.
ReadySC. Established in 1961, ReadySC is one of the oldest and most experienced workforce training programs in the US. They work with 16 technical colleges in South Carolina, to provide customized training for new and expanding business and industry at little or no cost to qualifying companies. Services include recruitment solutions, curriculum development, and training support. Qualified firms must be providing a sufficient number of jobs that are permanent, pay competitive wages, and provide health insurance benefits.
Apprenticeship Carolina. The aim of Apprenticeship Carolina is to ensure employers have access to the information and technical assistance they need to create demand-driven registered apprenticeship programs. They provide apprenticeship consultants, at no cost to the employer, to guide companies through the registered apprenticeship development process. Apprenticeship Carolina is a division of the SC Technical College System.
Project Lead the Way (PLTW). PLTW provides in-school STEM curriculum for middle and high school students. They help students develop the skills needed to succeed in the job market. Along with designing curricula that helps students develop critical-reasoning and problem-solving skills, PLTW fosters networking between students and professionals from local industries who supplement the real-world aspect of the curriculum through mentorships and workplace experience.
THEORY INTO PRACTICE PAGE | 95

SRS COMMUNITY REUSE ORGANIZATION REGIONAL WORKFORCE STUDY
ACT WorkKeys. In 2015 the South Carolina General Assembly passed a law requiring all 11th grade students to take the ACT WorkKeys assessment. The test measures reading, mathematics, and finding information skills, particularly real-world skills that employers seek in everyday situations. Students who successfully complete the assessment may earn a certificate that can help them find summer jobs, part-time work, and/or internships. The State of Georgia also promotes the use of WorkKeys as an assessment tool, though they have not mandated its use in schools. The WorkKeys assessment was widely used in the WorkReady Community program when it was launched in 2006, but is less actively promoted at this time.
THEORY INTO PRACTICE PAGE | 96

SRS COMMUNITY REUSE ORGANIZATION REGIONAL WORKFORCE STUDY
APPENDIX C: DATA & METHODOLOGY
CLASSIFICATION SYSTEMS
Much of the analysis presented in this report relies on three separate classification systems. A brief overview of each is presented below.
The Standard Occupational Classification (SOC) system is used by federal statistical agencies to classify workers into categories for the purpose of collecting, calculating, or disseminating data. This system groups all occupations in which work is performed for pay or profit according to the type of work performed and, in some cases, on the skills, education, or training needed to perform the work at a competent level. Under the 2010 SOC system, workers are classified into one of 840 detailed occupations, which are combined to form 461 broad occupations, 97 minor groups, and 23 major groups.
The North American Industry Classification System (NAICS, pronounced Nakes) was developed under the direction and guidance of the Office of Management and Budget (OMB) as the standard for use by Federal statistical agencies in classifying business establishments for the collection, tabulation, presentation, and analysis of statistical data describing the US economy. The classification system was developed jointly with government agencies in Canada and Mexico to allow for a high level of comparability in business statistics among the North American countries.
STANDARD OCCUPATIONAL CLASSIFICATION SYSTEM
SOC STRUCTURE SOC EXAMPLE
Major group 51-0000 Production occupations
Minor group 51-2000 Assemblers & fabricators
Broad occupation 51-2090 Miscellaneous assemblers & fabricators
Detailed occupation 51-2092 Team assemblers
NORTH AMERICAN INDUSTRIAL CLASS. SYSTEM
NAICS STRUCTURE NAICS EXAMPLE
Sector 31-33 Manufacturing
Subsector 336 Transportation equipment manufacturing
Industry group 3361 Motor vehicle manufacturing
Industry 33611 Automobiles & light duty motor vehicles, incl. chassis
Country-specific 336111 Automobiles & light duty motor vehicles, incl. chassis
CLASSIFICATION OF INSTRUCTIONAL PROGRAMS
CIP STRUCTURE CIP EXAMPLE
General 14. Engineering
Intermediate 14.08 Civil engineering
Specific 14.0802 Geotechnical engineering
Source: US Bureau of Labor Statistics (SOC); US Census Bureau (NAICS); National Center for Education Statistics; TIP Strategies.
2-digit/ general
4-digit/ inter-mediate
6-digit/ specific
THEORY INTO PRACTICE PAGE | 97
Major group
Minor group
Broad occupation
Detailed occupation
Sector
Subsector
Industry group
Industry
Country specific
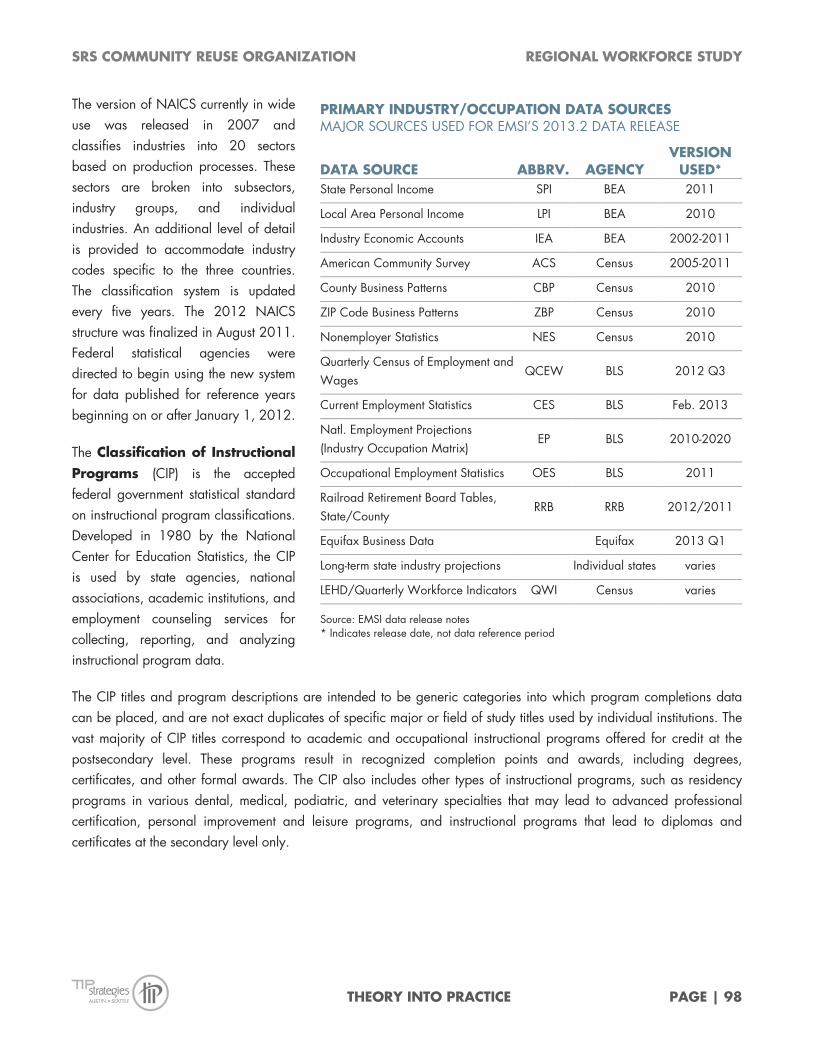
SRS COMMUNITY REUSE ORGANIZATION REGIONAL WORKFORCE STUDY
The version of NAICS currently in wide use was released in 2007 and classifies industries into 20 sectors based on production processes. These sectors are broken into subsectors, industry groups, and individual industries. An additional level of detail is provided to accommodate industry codes specific to the three countries. The classification system is updated every five years. The 2012 NAICS structure was finalized in August 2011. Federal statistical agencies were directed to begin using the new system for data published for reference years beginning on or after January 1, 2012.
The Classification of Instructional Programs (CIP) is the accepted federal government statistical standard on instructional program classifications. Developed in 1980 by the National Center for Education Statistics, the CIP is used by state agencies, national associations, academic institutions, and employment counseling services for collecting, reporting, and analyzing instructional program data.
The CIP titles and program descriptions are intended to be generic categories into which program completions data can be placed, and are not exact duplicates of specific major or field of study titles used by individual institutions. The vast majority of CIP titles correspond to academic and occupational instructional programs offered for credit at the postsecondary level. These programs result in recognized completion points and awards, including degrees, certificates, and other formal awards. The CIP also includes other types of instructional programs, such as residency programs in various dental, medical, podiatric, and veterinary specialties that may lead to advanced professional certification, personal improvement and leisure programs, and instructional programs that lead to diplomas and certificates at the secondary level only.
PRIMARY INDUSTRY/OCCUPATION DATA SOURCES MAJOR SOURCES USED FOR EMSI’S 2013.2 DATA RELEASE
DATA SOURCE ABBRV. AGENCY VERSION
USED* State Personal Income SPI BEA 2011
Local Area Personal Income LPI BEA 2010
Industry Economic Accounts IEA BEA 2002-2011
American Community Survey ACS Census 2005-2011
County Business Patterns CBP Census 2010
ZIP Code Business Patterns ZBP Census 2010
Nonemployer Statistics NES Census 2010
Quarterly Census of Employment and Wages
QCEW BLS 2012 Q3
Current Employment Statistics CES BLS Feb. 2013
Natl. Employment Projections (Industry Occupation Matrix)
EP BLS 2010-2020
Occupational Employment Statistics OES BLS 2011
Railroad Retirement Board Tables, State/County
RRB RRB 2012/2011
Equifax Business Data Equifax 2013 Q1
Long-term state industry projections Individual states varies
LEHD/Quarterly Workforce Indicators QWI Census varies
Source: EMSI data release notes * Indicates release date, not data reference period
THEORY INTO PRACTICE PAGE | 98