registrar-recorder/county clerk › voter › pdfs › post_election... · 2013-06-17 ·...
TRANSCRIPT


April 2009
Welcome to the Los Angeles County Registrar of Voters Post Election Report. The Report contains easy-to-read maps, charts and graphs of voter registration and turnout statistics for the 2008 Presidential Election and historical information compiled from past elections.
Voter participation in the historic Presidential contest was unprecedented in many ways here in Los Angeles County. The number of registered voters, returned Vote by Mail ballots, student poll workers and, of course, more Election Day phone calls surpassed all previous figures. Although voter turnout fell just shy of the record established in 1968, over 3 million voters either headed to the polls or mailed in their ballots. At our Norwalk headquarters, thousands of voters lined up to vote early, beginning two weeks before Election Day. Despite long lines, voters waited patiently and everyone got the chance to cast their ballot.
In my more than 20 years experience of working in elections, this November’s election was a proud moment for Los Angeles County. We hope that this report will provide an important snapshot of it. The Registrar’s team is proud to be of service to the citizens of Los Angeles County and it is our pledge to uphold an open, transparent and accessible elections process.
Sincerely,
Dean C. Logan Registrar-Recorder/County Clerk
DEAN C. LOGAN Registrar-Recorder/County Clerk
LETTER FROM THE REGISTRAR

Election Preparation
Election Day 2008
36
8
19
............................................................
...............................................................
Party Registration Map 11........................................................
New Registrants by Age Maps 12.................................................
Presidential Contest Results Maps 22...........................................
Presidential Contest Results by Age Maps 26..................................
Presidential Contest Results by Gender Maps 32..............................
Provisional Votes Cast Map 34..................................................
Ballot Box Mapping 38...........................................................
Voter Outreach and Education Campaign
Early Voting
Voter Registration 9.............................................................
....................................................................
...................................
Mail-In Votes Cast Map 35........................................................
Votes Cast at a Polling Place Map 36............................................
TABLE OF CONTENTS
Introduction 1

Los Angeles County is unique among the 3,068 counties in the United States. In terms of
gross domestic product its economy ranks within the 20 largest in the world. It has a
population between 9 and 10 million people living in 88 cities and unincorporated areas
that are located from the mountains in the east to the Pacific Coast in the west.
Los Angeles County is governed by a five member Board of Supervisors, elected by voters in
the county’s five Supervisorial Districts. Along with the Chief
Executive Officer, the board oversees the county’s $22.5
billion budget and its 39 agencies.
The Los Angeles County Registrar-Recorder/County Clerk
(RR/CC) serves as the county’s Chief of Elections,
responsible for conducting federal, state, and county
elections countywide, as well as many local municipal and
special district elections. L.A. County is the largest election
jurisdiction in the nation. It has more registered voters – 4.3 million - than 36 states, and its
execution of Election Day procedures mobilizes more than 25,000 volunteers and nearly
5,000 polling places in a single day, a logistical feat that can be compared to a “military
operation”.
The scope of that operation was clearly evident in the historic November 4, 2008 General
Election. During the national primary elections held during the winter and spring of 2008,
media and research organizations predicted a record-setting general election. Los Angeles
County did not disappoint. The RR/CC recorded almost five hundred thousand new voter
registrants from June 6 until October 20, the close of registration for the November election.
INTRODUCTION
1

After all registrations had been processed the County broke its first record, having over 4.3
million active voters on file.
These record-setting numbers and more are displayed in the following charts, graphs and
tables, along with maps of voter turnout and breakdowns of votes by party, gender and age.
Further, the enclosed CD contains interactive maps of varying demographics and statistics
by congressional and supervisorial districts.
2

ELECTION PREPARATION
ELECTION PREPARATION 3
Election Day preparation takes months of precise planning. Well before the November 4,
2008 General Election, supplies were ordered, sample ballot booklets were designed,
printed, and mailed, military and overseas voters began receiving their ballot materials, and
RR/CC employees were entering what turned out to be over 500,000 new voter registrations
since the last election held in June, 2008.
At the newly built Elections Operations Center, hundreds of employees were testing
equipment and assembling precinct materials to be transported to the County’s 69
distribution centers, where inspectors from 4,394 precincts gathered their Election Day
supplies.
In addition to logistics planning and poll worker recruitment and training, the Registrar-
Recorder/County Clerk took on another project – a massive voter outreach and education
campaign. The VOTE – YOU COUNT! campaign focused on multilingual services, voting
options for persons with disabilities, and voting equipment demonstrations. The goal of the
campaign was to ensure that all voters were prepared to successfully cast a ballot on
Election Day.
The RR/CC established a broad-based, multi-media, multicultural partnership with L.A.
media companies. Partners included, CBS and KCAL 9, the L.A. Dodgers, the UCLA Bruins
and many multilingual media outlets, including Univision KMEX 34 and La Opinion
newspaper (the largest Spanish language media companies in Los Angeles). Working
together, the department and its media partners educated the public about various voting

ELECTION PREPARATION 4
options and important deadlines through an intensive effort that involved television, radio,
print, and online resources. In the course of a month CBS Outdoor placed over 300 transit
posters, highway billboards, and bulletins throughout the county; the L.A. Dodgers and UCLA
Bruins sponsored voter registration booths, game-day announcements, and special events;
CBS 2, KCAL 9, and KMEX 34 produced public service announcements with local news
talent, and KMEX 34 hosted an all day telethon before the close of registration.
Inside the RR/CC’s Norwalk headquarters, the Information Technology team completed web
site enhancements that allowed voters to track their vote by mail ballots, verify their voter
registration status and view the progress of Election Night ballots being delivered from
precincts to Check In Centers and, finally, to Norwalk. These enhancements gave visitors
important information at the click of a mouse. The RR/CC web site had almost 700,000
visitors during the two weeks before the election and over 60,000 to the registration status
look-up function.
Early voting was one indication that the November election was going to be a record
breaker. Tens of thousands of early voters trekked to Norwalk to submit their Vote by Mail
Ballots before November 4th. Lines formed around the building during extended hours
beginning two weeks before Election Day. Over 30,000 voters cast their ballots in-person at
Norwalk headquarters during the early voting period - 16,000 in the last three days alone.
Another telling sign was the number of phone calls the RR/CC was receiving. On November
3rd alone, RR/CC, Internal Services Department (ISD) and City of Los Angeles employees
fielded over 55,000 telephone calls – a record number - and what one telephone company
representative likened to the phone call volume experienced during an earthquake.

All programs and policies were in place and RR/CC staff, poll workers, Inspectors, and
Coordinators were trained and ready to participate in one of the most historic elections in
United States History.
The following descriptive maps, charts and graphs have been created to provide a visual
picture of the November 2008 election and, in some cases, its comparison to past elections.
All data were derived from RR/CC files, interpreted and adapted for display in this report.
ELECTION PREPARATION 5

The Registrar's team trained thousands of poll workers, secured nearly 5,000 polling places, processed hundreds of thousands of voter registrations, undertook a massive voter outreach and education campaign and programmed nearly 10,000 voting machines.
5,000
10,000
15,000
20,000
25,000
30,000
35,000
40,000
E-4 E-3 E-2 E-1 E-Day
2004 PresidentialElection
45,000
45,000
50,000
55,000
60,000
2008 PresidentialElection
IVR Phone Calls Leading Up to Election Day2004 and 2008
ELECTION PREPARATION 6
LA COUNTY RECORD
The Registrar's Office experienced a recordnumber of phone calls during the week prior tothe election and on Election Day.

Voter Outreach and Education Campaign
ELECTION PREPARATION 7
The Registrar's Office created innovative partnerships with organizations such asCBS and KCAL 9, the Los Angeles Dodgers, the UCLA Bruins, and multiple television,
radio and print media organizations in an effort to educate Los Angeles Countycitizens about the many voter services available to them. The VOTE-YOU COUNT!outreach and education campaign highlighted the RR/CC's multilingual services,voting options for voters with specific needs, and voting equipment. In addition to
the television and radio presence, the campaign included highway billboards, public
transportation shelters and posters that alerted the public about Election Day andincluded Registrar contact information. The campaign reached millions of County
residents and engaged local community organizations.

5001,0001,5002,0002,5003,0003,5004,0004,5005,000
Student Pollworker Program
3,375
Number of Student Pollworkers Served(2000-2008)
3,750
617
2000 2008
1,185
311 568
1,870
All data taken from November elections
50
100
150
200
250
Participating High Schools
129
Number of Participating High Schools(2002-2008)
215
52
2002 2008
1844
87
All data taken from November elections
ELECTION PREPARATION 8
!LA COUNTY RECORD!
The Registrar's Office recruited more studentpoll workers for the November election than
ever before.
LA COUNTY RECORD
The Registrar's Office recruited more studentpoll workers for the November election than at
any time in the program's eight-year history.

Early Voting
Remote early voting sites were discontinued in 2007 due to voting equipment restrictions imposed by the Secretary of State but early voting at our Norwalk Headquarters during expanded hours two weeks before Election Day saw over 30,000 voters cast their ballots early.
ELECTION PREPARATION 9

Voter Registration
Voter registration occurs throughout the year. The Registrar's team attends community events, parades, naturalization ceremonies, and many other venues to offer registration services to the citizens of L.A. County. 2008 saw unprecedented numbers of registered voters.
LA COUNTY RECORD
Voter registration was up nationwide and it was no different in L.A.County. In October, voter
registration broke an all time record by nearly 200,000 voters, and more voters registered in
the last five months than ever before.
2.4
2.6
2.8
3.0
3.2
3.4
3.6
3.8
4.0
4.2
4.4
1968 1972 1976 1980 1984 1988 1992 1996 2000 2004
Vot
er
Re
gist
ratio
nin
Mill
ions
2008
Registered Voters
Voter Registration by Presidential Election Year(1968-2008)
AverageVoterRegistration
3.68
3.13 3.13
3.61
3.26
3.66
3.76 3.743.85
4.07
3.97
4.29
ELECTION PREPARATION 10

50k
100k
150k
200k
250k
300k
350k
400k
June July Aug Sept Oct
1999-2000
Monthly Registration TotalsBy Presidential Election Year
2003-2004 2007-2008
Vot
erR
egis
trat
ion
MayAprilMarchFebJanDecNov
64%
66%
68%
70%
72%
74%
76%
78%
80%
82%
84%
1968 1972 1976 1980 1984 1988 1992 1996 2000 2004
Tur
nou
tPe
rce
nta
ge
2008
Voter Turnout
Overall Voter Turnout for Presidential Elections(1968-2008)
86%
88%
76.55
81.08
80.43
86.24
73.87
72.55
64.95
67.97
79.1
81.92
75.61
Average Voter Turnout
76.39
ELECTION PREPARATION 11

PARTY REGISTRATIONThe map below shows L.A. County registration by majority party: Democrat,
Republican, Decline to State, and Non Partisan.
ELECTION PREPARATION 12

NEW REGISTRANTSThe major story this presidential election was the influx of new voters. In
L.A. County 50 percent of newly registered voters were between the ages of 18-29. The maps below show the distribution of voters registering for the
first time in Los Angeles County.
CountywideAges 18-29
ELECTION PREPARATION 13
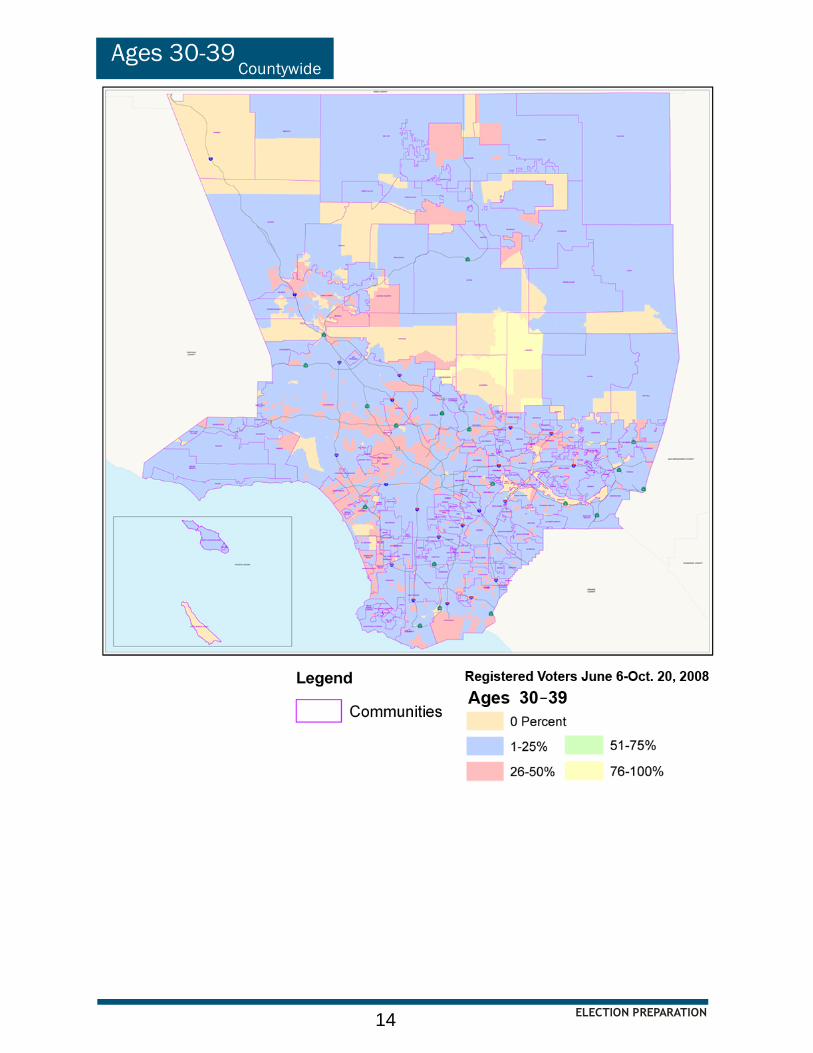
CountywideAges 30-39
ELECTION PREPARATION 14

CountywideAges 40-49
ELECTION PREPARATION 15

CountywideAges 50-59
ELECTION PREPARATION 16

CountywideAges 60-69
ELECTION PREPARATION 17

CountywideAges 70+
ELECTION PREPARATION 18
ELECTION DAY 2008
ELECTION DAY 2008 19
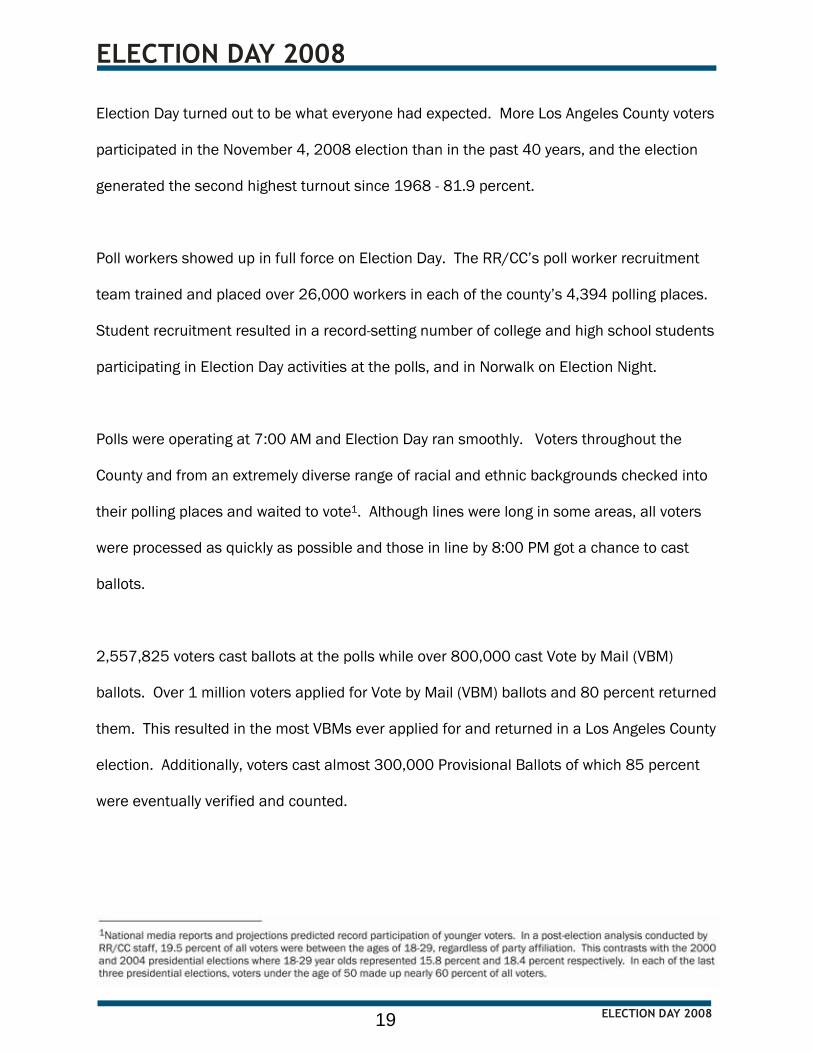
Election Day turned out to be what everyone had expected. More Los Angeles County voters
participated in the November 4, 2008 election than in the past 40 years, and the election
generated the second highest turnout since 1968 - 81.9 percent.
Poll workers showed up in full force on Election Day. The RR/CC’s poll worker recruitment
team trained and placed over 26,000 workers in each of the county’s 4,394 polling places.
Student recruitment resulted in a record-setting number of college and high school students
participating in Election Day activities at the polls, and in Norwalk on Election Night.
Polls were operating at 7:00 AM and Election Day ran smoothly. Voters throughout the
County and from an extremely diverse range of racial and ethnic backgrounds checked into
their polling places and waited to vote1. Although lines were long in some areas, all voters
were processed as quickly as possible and those in line by 8:00 PM got a chance to cast
ballots.
2,557,825 voters cast ballots at the polls while over 800,000 cast Vote by Mail (VBM)
ballots. Over 1 million voters applied for Vote by Mail (VBM) ballots and 80 percent returned
them. This resulted in the most VBMs ever applied for and returned in a Los Angeles County
election. Additionally, voters cast almost 300,000 Provisional Ballots of which 85 percent
were eventually verified and counted.

ELECTION DAY 2008 20
Election Day activity was not only seen at the polls but on the Internet as well. A total of
195,360 visitors utilized www.lavote.net on November 4th and thousands visited the newly
implemented VBM tracking and registration lookup functions.
The RR/CC’s IT team developed another web-based project: an enhanced security scanning
program that showed the progression of scanned ballots in a mapping format displayed
online. Visitors to the RR/CC web site viewed a county-wide map that gave a color depiction
and percentage display of precinct ballot boxes from polling places being logged into Check-
In Centers, and finally to Norwalk headquarters.
In terms of ballots cast, all ballots were delivered to Norwalk in record time for a presidential
election: VBM ballots were inventoried and all voted ballots cast at polling places were
scanned, batched and counted by 3:24 AM.
In the weeks after the election, the RR/CC conducted its public 1 percent Post-Election
Manual Audit Tally, entered over 670,000 remaining provisional and Vote by Mail ballots
returned at polling places, and finally presented its results to the Los Angeles County Board
of Supervisors for certification.
The certified totals gave candidate Barack Obama 69.2 percent of the vote in Los Angeles
County and total votes represented 14.5 percent of all votes cast in the State of California.
The election was successfully completed and RR/CC staff began regrouping for other
elections to be held in December, March and May.

When all polling place, Vote by Mail and provisional ballots were tallied and certified L.A. County processed 3,368,057 ballots, more than it ever had before. This number constitutes 14.5 percent of the entire number of ballots cast in the State of California.
Provisional Voting and VBM Trends
2008
2004
2000
1996
1992
85%
82%
61%
57.5%
60.6%
Provisional Ballots Cast Accepted
271,074
204,578
100,168
59,275
23,347
Note: The process for provisional voting was added to the California Election Code in 1983, however, statistical information is only available beginning in 1992.
Provisional Voting in Presidential Elections
The Election Code was amended by the State Assembly in 2003. Prior to that time, most provisional ballot contests were not counted. The current Election Code allows provisional voters whose registration status can be verified and who vote outside of their assigned precinct location to have their vote counted. Votes for statewide or presidential candidates and ballot measures will also be counted if they are cast outside of a voter's electoral jurisdiction.
ELECTION DAY 2008 21

PRESIDENTIAL CONTEST RESULTSBarack Obama won L.A. County with 69.2 percent of the vote. The following map shows where each Presidential candidate got 50+1 percent of the vote and is followed by maps giving a percentage breakdown for each candidate.
CountywideCandidates With Majority of the Vote
ELECTION DAY 2008 22

CountywideVotes for Barack Obama
ELECTION DAY 2008 23

CountywideVotes for John McCain
ELECTION DAY 2008 24

PRESIDENTIAL CONTEST RESULTS BY AGEAge was a factor in the November presidential contest both nationally and in L.A. County. 50 percent of new registrants were between the ages of 18-29
and of those, more than 56 percent were registered with the Democratic Party, while 15 percent were Republican and 27.9 percent were registered
as Decline to State or Non Partisan voters. The following map shows a breakdown of voters by age group.
10%
15%
20%
25%2000
Voters by Age Group
2004
2008
70+60-6950-5940-4930-3918-29
Data based on registered voters.
ELECTION DAY 2008 25

CountywideAges 18-29
ELECTION DAY 2008 26

CountywideAges 30-39
ELECTION DAY 2008 27

CountywideAges 40-49
ELECTION DAY 2008 28

CountywideAges 50-59
ELECTION DAY 2008 29

CountywideAges 60-69
ELECTION DAY 2008 30

CountywideAges 70+
ELECTION DAY 2008 31

PRESIDENTIAL CONTEST RESULTS BY GENDERMore females went to the polls than males in the November election. The
following map shows the communities where over 50 percent of voters were male or female.
CountywideVotes by Females
ELECTION DAY 2008 32

CountywideVotes by Males
ELECTION DAY 2008 33

PROVISIONAL VOTES CASTProvisional voters are those whose names do not appear on the Roster of Voters at the polls. These voters cast provisional ballots which are verified
after the election and counted if their registration can be confirmed. Voters cast 271,074 provisional ballots in the November election and 85 percent of
these were verified and counted. The map below shows where these provisional voters cast ballots.
ELECTION DAY 2008 34
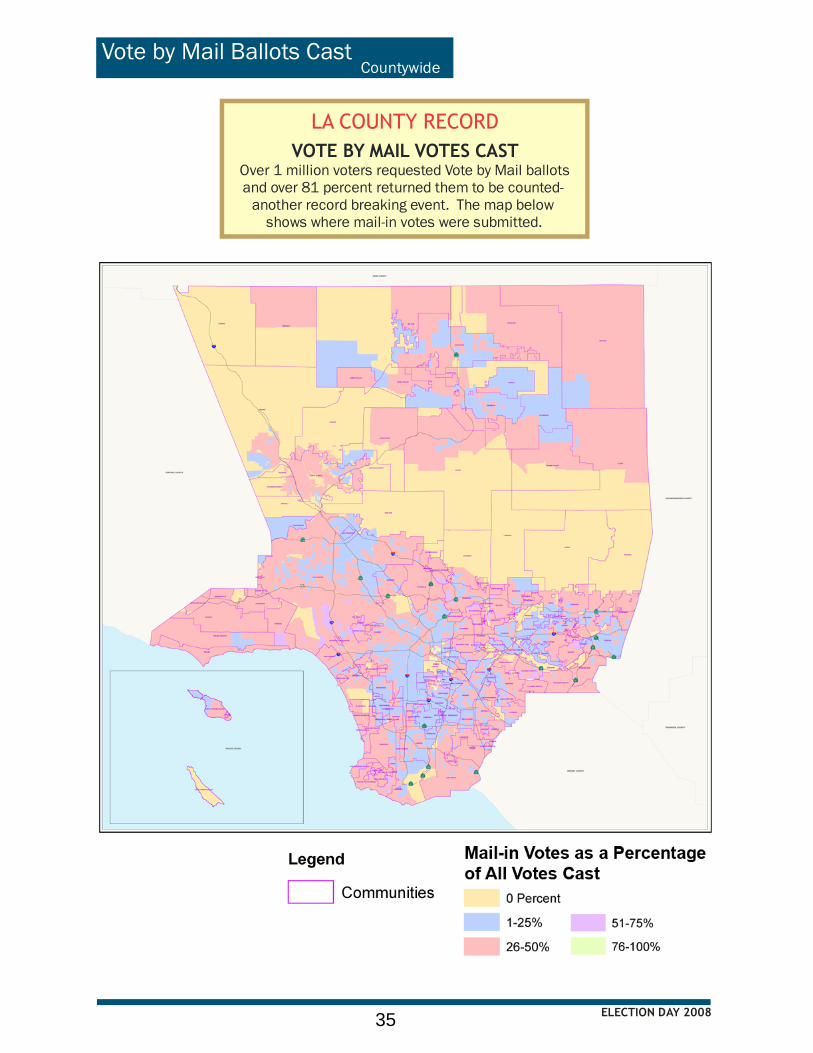
Vote by Mail Ballots CastCountywide
ELECTION DAY 2008 35
LA COUNTY RECORD
VOTE BY MAIL VOTES CASTOver 1 million voters requested Vote by Mail ballotsand over 81 percent returned them to be counted-
another record breaking event. The map belowshows where mail-in votes were submitted.

Votes Cast at Polling PlacesCountywide
ELECTION DAY 2008 36

Election Night is a spectacular event in L.A. County. Ballots are driven and flown into its Norwalk Headquarters from every corner of the county, including Catalina Island. Thousands of secured and sealed “red boxes” are delivered and millions of ballots are inspected and prepared for counting.
LA COUNTY RECORD
The Registrar's team collected, scanned and processed more ballots than ever and
finished counting in record time for ballots
cast in a presidential election. They also implemented an online ballot box tracking
program that allowed internet users to view the progress of collecting and transporting
ballot boxes from the precincts to Norwalk Headquarters.
1:00 am
2:00 am
3:00 am
4:00 am
5:00 am
6:00 am
7:00 am
8:00 am
1992 1996 2000 2004 2008
Final Press Bulletins Issued
Final Press Bulletin Reporting Times(1992-2008)
3:24
Midnight
7:10
3:35
4:13
3:24
2,632,616 Ballots Cast 2,695,894 Ballots Cast
ELECTION DAY 2008 37

Ballot Box Tracking10pm
ELECTION DAY 2008 38

Ballot Box Tracking11pm
ELECTION DAY 2008 39

Ballot Box Tracking12am
ELECTION DAY 2008 40

Ballot Box Tracking1am
ELECTION DAY 2008 41