regulated businesses december 15, 2014/media/files/i/iam-corp/presentations/en/...cost of capital =...
TRANSCRIPT

Regulated businesses
Suez Environnement
December 15, 2014
- 1 -

Regulated businesses
Suez Environnement
December 15, 2014
- 2 -
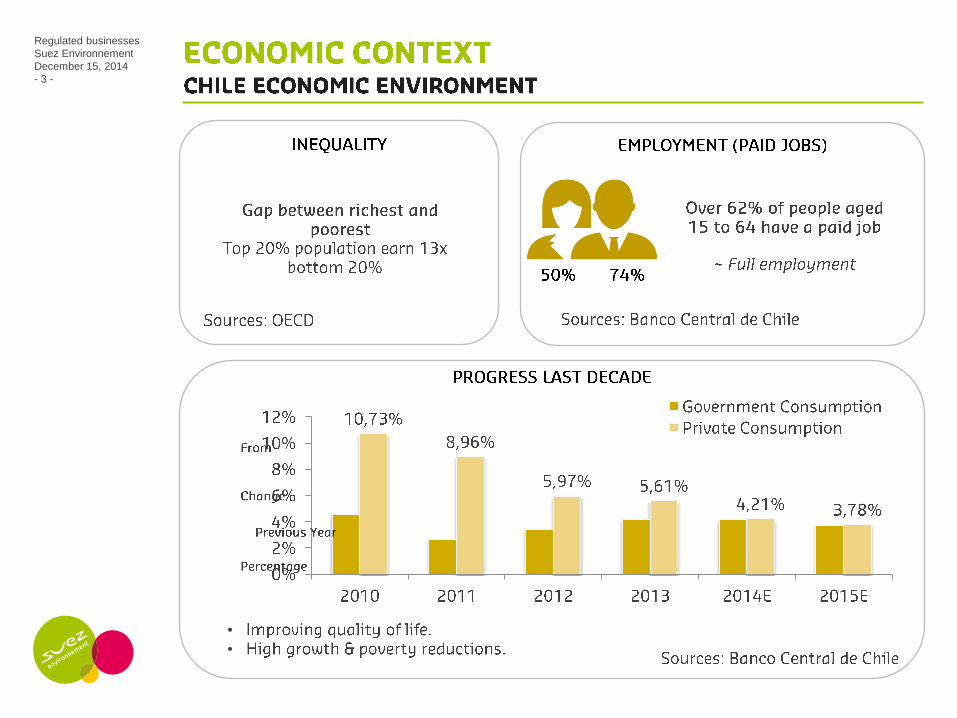
Source: INE
Sources: Central Bank of Chile
Source: Central Bank of Chile
Sources: Central Bank of Chile
Regulated businesses
Suez Environnement
December 15, 2014
- 3 -
•
•

Regulated businesses
Suez Environnement
December 15, 2014
- 4 -
VIII Region / Concepción
Essbio
Xii Region / Pta.Arenas
Aguas Magallanes
XV y I Region / Iquique Aguas Del Altiplano
V Region / Valparaíso Esval
VI Region / Rancagua Essel
VII Region / Talca Aguas Nuevo Sur
Los Ríos / Valdivia Aguas Décima
Xi Region / Coyhaique Aguas Patagonia
II Region / Antofagasta Aguas De Antofagasta
III Region / Copiapó Aguas De Chañar
IV Region / La Serena Aguas Del Valle
IX Region / Temuco Aguas Araucania
R.M. / Santiago Aguas Andinas
X Region de Los Lagos y XIV Region de Los Ríos / Pto.Montt Essal

Regulated businesses
Suez Environnement
December 15, 2014
- 5 -

Regulated businesses
Suez Environnement
December 15, 2014
- 6 -
SEOUL
ROME
SANTIAGO
ATHENS
STOCKHOLM
MADRID
WASHINGTON
MEXICO CITY
LONDON
PARIS
OTTOWA
COPENHAGEN
SYDNEY
BERLIN
OSLO
1,24
1,36
1,39
1,62
2,33
2,56
2,74
3,23
3,65
3,88
5,12
5,33
5,93
6,6
7,09

Regulated businesses
Suez Environnement
December 15, 2014
- 7 -

Regulated businesses
Suez Environnement
December 15, 2014
- 8 -
•
•

Regulated businesses
Suez Environnement
December 15, 2014
- 9 -

Regulated businesses
Suez Environnement
December 15, 2014
- 10 -

Regulated businesses
Suez Environnement
December 15, 2014
- 11 -
TOTAL LONG-TERM COSTS
(CTLP):
Annual revenues required by the
Model Company
Norms/regulations Demand projections
Geography Quality standards Other parameters
Expected demand (Q*)
Cost of Capital
Design and Valuation of Infrastructure
• Water production • Water distribution • Sewage collection • Sewage treatment/disposal • Commercial and
administration
Annual Return
on Investment
Annual Operating
Costs
Average Annual Tariff = Annual Return on Investment ($) + Annual Operating Costs ($) Demand Q*(m3)

Regulated businesses
Suez Environnement
December 15, 2014
- 12 -
COST OF CAPITAL = RISK FREE RATE + RISK PREMIUM
0%
1%
2%
3%
4%
2008 2009 2010 2011 2012 2013 2014
SECONDARY MARKET INTEREST RATES, UF 10-YEAR CHILEAN BOND (REAL)

Regulated businesses
Suez Environnement
December 15, 2014
- 13 -

Regulated businesses
Suez Environnement
December 15, 2014
- 14 -
1,06
1,35
1,62
1,72
1,95
1,99
2,00
2,03
2,08
2,14
2,29
2,35
2,38
2,50
3,02
3,29
Maipú
Gran Santiago
Concepción
Rancagua
La Serena
Temuco
Talca
Valdivia
Valparaíso
Arica
Copiapó
Punta Arenas
Puerto Montt
Iquique
Antofagasta
Coyhaique
Source: SISS Industry Report 2013. Tariffs to December 2013 considering US $1= $524

Regulated businesses
Suez Environnement
December 15, 2014
- 15 -
50,1%
24,2%
5,0%
2,2% 1,9%
16,6% IAM
International
CORFO
Workers
Pension Funds
Others
50.1%
100%
56.6%

Regulated businesses
Suez Environnement
December 15, 2014
- 16 -

Regulated businesses
Suez Environnement
December 15, 2014
- 17 -

Regulated businesses
Suez Environnement
December 15, 2014
- 18 -
CLIENTS/EMPLOYEES BILLING/EMPLOYEES Th. M3
RUPTURES X 100 KMS. RUPTURES X 1.000 CLIENTS
Source: SISS Industry Report 2013

Regulated businesses
Suez Environnement
December 15, 2014
- 19 -
0,200 0,180 0,185 0,190
0,162 0,148
0,131
0,00
0,10
0,20
2008 2009 2010 2011 2012 2013 2014
RUPTURE RATES (RUP./KM.YEAR)
REDUCTION by ~35% of the annual ruptures/km
rates in 6 years INCREASE IN AUTONOMY of
the potable water distribution system for 9 hours for when there is an emergency that
does not allow for the production of water
VALUATION OF RESIDUES IN WASTEWATER TREATMENT
PLANTS: • Water suitable for all types of
irrigation • Bio-methane at the Farfana Plant • Bio-solids • Biodiesel (R&D)
Implementation of arsenic abatement
treatments Company’s world class positioning in Health and
Safety standards
“10 Rules that Save Lives”

Regulated businesses
Suez Environnement
December 15, 2014
- 20 -
In US$m
REVENUES
+5% Growth (CAGR)
EBITDA
393 390435
463 472
0%
10%
20%
30%
40%
50%
60%
70%
80%
90%
100%
0
50
100
150
200
250
300
350
400
450
500
2009 2010 2011 2012 2013
EBITDA (MM$) EBITDA MARGIN
+5% Growth (CAGR)

Regulated businesses
Suez Environnement
December 15, 2014
- 21 -

Regulated businesses
Suez Environnement
December 15, 2014
- 22 -

Regulated businesses
Suez Environnement
December 15, 2014
- 23 -
50,0
70,0
90,0
110,0
130,0
150,0
170,0
190,0
avr.
-08
juil.
-08
oct.-0
8
janv.-
09
avr.
-09
juil.
-09
oct.-0
9
janv.-
10
avr.
-10
juil.
-10
oct.-1
0
janv.-
11
avr.
-11
juil.
-11
oct.-1
1
janv.-
12
avr.
-12
juil.
-12
oct.-1
2
janv.-
13
avr.
-13
juil.
-13
oct.-1
3
janv.-
14
avr.
-14
juil.
-14
oct.-1
4
Aguas Andinas IPSA INDEX

Regulated businesses
Suez Environnement
December 15, 2014
- 24 -

Regulated businesses
Suez Environnement
December 15, 2014
- 25 -

Regulated businesses
Suez Environnement
December 15, 2014
- 26 -

Regulated businesses
Suez Environnement
December 15, 2014
- 27 -

Regulated businesses
Suez Environnement
December 15, 2014
- 28 -
Hydraulic Efficiency Plan to reduce losses and
Energy Efficiency Plan

Regulated businesses
Suez Environnement
December 15, 2014
- 29 -
FLOW OF THE MAIPO RIVER (M3/S)
(1) Source: Dirección General de Aguas (DGA)
RAINFALL AT EMBALSE EL YESO
(mm)(1)
* Average calculated from 1983 to date.
0,00
50,00
100,00
150,00
200,00
Average Flow Mimimum Flow
Maximum Flow
0
200
400
600
800
1000
1200
1400
2000
2001
2002
2003
2004
2005
2006
2007
2008
2009
2010
2011
2012
2013
sep
t./1
4
Regulated businesses
Suez Environnement
December 15, 2014
- 30 -
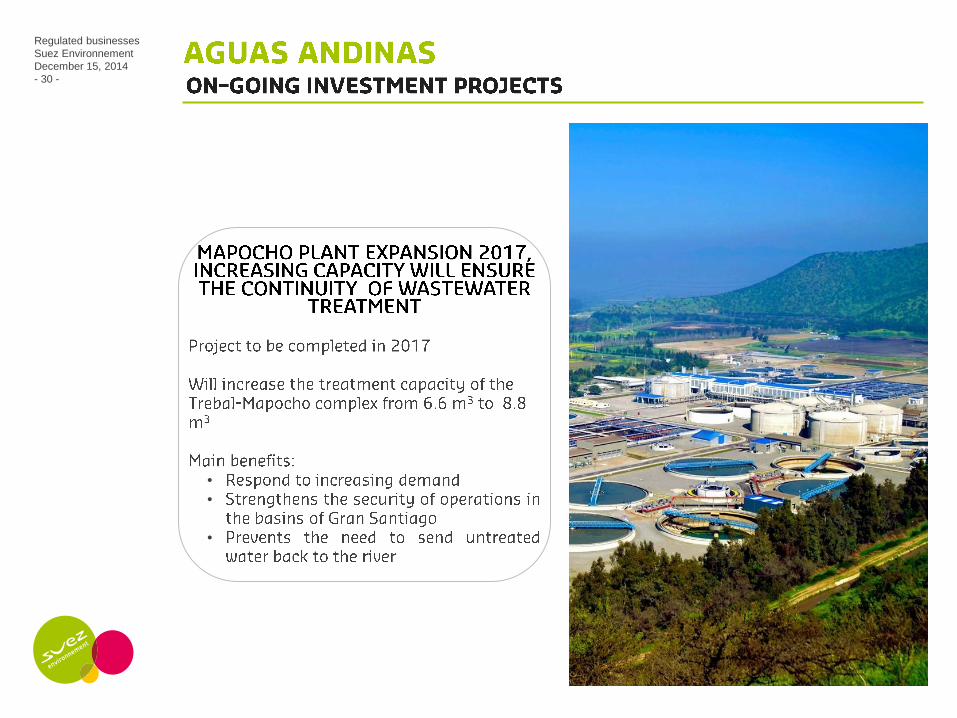
•
•
•

Regulated businesses
Suez Environnement
December 15, 2014
- 31 -