regulating personal data - world bank
TRANSCRIPT

Policy Research Working Paper 9596
Regulating Personal Data
Data Models and Digital Services Trade
Martina Francesca FerracaneErik van der Marel
World Development Report 2021 Team &Macroeconomics, Trade and Investment Global Practice March 2021
World Development Report 2021
Background Paper
Pub
lic D
iscl
osur
e A
utho
rized
Pub
lic D
iscl
osur
e A
utho
rized
Pub
lic D
iscl
osur
e A
utho
rized
Pub
lic D
iscl
osur
e A
utho
rized

Produced by the Research Support Team
Abstract
The Policy Research Working Paper Series disseminates the findings of work in progress to encourage the exchange of ideas about development issues. An objective of the series is to get the findings out quickly, even if the presentations are less than fully polished. The papers carry the names of the authors and should be cited accordingly. The findings, interpretations, and conclusions expressed in this paper are entirely those of the authors. They do not necessarily represent the views of the International Bank for Reconstruction and Development/World Bank and its affiliated organizations, or those of the Executive Directors of the World Bank or the governments they represent.
Policy Research Working Paper 9596
While regulations on personal data diverge widely between countries, it is nonetheless possible to identify three main models based on their distinctive features: one model based on open transfers and processing of data, a second model based on conditional transfers and processing, and third a model based on limited transfers and processing. These three data models have become a reference for many other countries when defining their rules on the cross-border transfer and domestic processing of personal data. The study reviews their main characteristics and systematically identifies for 116 countries worldwide to which model they adhere for the two components of data regulation (i.e. cross-border transfers and domestic processing of data). In a second step, using gravity analysis, the study
estimates whether countries sharing the same data model exhibit higher or lower digital services trade compared to countries with different regulatory data models. The results show that sharing the open data model for cross-border data transfers is positively associated with trade in digital services, while sharing the conditional model for domestic data processing is also positively correlated with trade in digital services. Country-pairs sharing the limited model, instead, exhibit a double whammy: they show negative trade correlations throughout the two components of data regulation. Robustness checks control for restrictions in digital services, the quality of digital infrastructure, as well as for the use of alternative data sources.
This paper is a product of the World Bank’s World Development Report 2021 Team in collaboration with the Macroeconomics, Trade and Investment Global Practice. It is part of a larger effort by the World Bank to provide open access to its research and make a contribution to development policy discussions around the world. Policy Research Working Papers are also posted on the Web at http://www.worldbank.org/prwp. The authors may be contacted at [email protected].

Regulating Personal Data: Data Models and Digital Services Trade
Martina Francesca Ferracane European University Institute (EUI)
Erik van der Marel ECIPE, Université Libre de Bruxelles (ULB)
Keywords: data protection, privacy, globalization, trade, WTO JEL codes: F13, F15, K20, K24, L86
This paper is a joint product of the WDR 2021 team and the International Trade Unit (ETIRI) of the Macroeconomics, Trade, and Investment GP. The study was commissioned as a background paper to the WDR 2021 “Data For Better Lives” and as an input to ETIRI’s work program on Digital Trade Regulation (P171481), under the guidance of Martín Molinuevo (Senior Counsel, ETIRI).
* The authors thank Lillyana Sophia Daza Jaller for excellent research assistance, and Martín Molinuevo forhelpful comments during the process. They especially thank Ben Shepherd, Sébastien Miroudot and HildegunnNordås for helpful comments and feedback while writing the paper, as well as Daria Taglioni, Sébastian Sáez,Vivien Foster, Gonzalo Varela, Mary Hallward-Driemeier, Bernard Hoekman and Matteo Fiorini for commentsand reviews on earlier drafts.

2
1. Introduction
Digital services are one of the fastest growing components of international trade, which creates large benefits for the global economy. The tradability of digital services relies heavily on the ability of companies to process and transfer data across borders (WTO, 2018) and, in turn, this ability is affected by rules governing data. Yet, these rules are increasingly fragmented across the globe. This paper focuses on rules on personal data, whose transfers and processing are treated differently across the globe. Rules governing personal data follow roughly three different regulatory models, based on different features: one model based on open transfers and processing of data, a second model based on conditional transfers and processing, and third a model based on limited transfers and processing. This regulatory divergence is likely to distort trade in digital services across the global economy.
This paper investigates empirically the question of whether sharing a regulatory approach towards the cross-border transfer and domestic processing of personal data is associated with trade in digital services. In other words, do country-pairs adhering to the same data model show positive or negative trade correlations in digital services? To shed light on this question, the analysis considers two components of data regulation for each of the three data models: one component related to rules on the cross-border transfers of personal data, and a second component related to rules governing the domestic processing of personal data. Digital services are defined as those that are classified as intensive users of software technologies over labour as shown in Ferracane and van der Marel (2018), and in particular focus on information and communication services.
The study's the first step is to systematically identify the data models followed by a large range of countries around the world, featuring 116 countries varying from developed to least developed countries.1 For each country, the study assesses the model implemented with regards to the two components of data regulation. In a second step, the analysis empirically estimates (a) which of the three data models is correlated with greater or lower trade in digital services; and (b) which of the two components is driving these correlations. To investigate this empirical question, a gravity model is used in order to estimate whether country-pairs sharing the same data model exhibit greater or lower digital services trade compared to the benchmark, which are countries that follow different data models.
This paper contributes to the broader literature on the economic impact of regulating personal data. In particular, the analysis combines the legal strand of this literature, such as Aaronson and Leblond (2018), Gao (2018) and Azmeh et al. (2019), that describes the data realms from a legal and political economy perspective; the economic literature that quantitatively estimates the impact of regulatory rules of data, such as Ferracane et al. (2020); as well as the literature that investigates the economics of privacy, such as Acquisti et al. (2016). As in Ferracane and van der Marel (2018), this paper assesses whether rules on data are associated with digital services trade. However, the novelty of this paper is that (a) it focuses on rules on personal data rather than more broadly on all types of data; (b) it deepens the analysis by describing and quantifying the three main global models for personal data to which countries are classified, and investigate their regulations regarding both cross-border transfers and domestic data processing; and (c) it uses a gravity model of trade, covering bilateral trade flows of digital services. As such, the paper investigates the relationship between sharing a regulatory model for personal data and digital services trade.
1 The selection of countries is performed in accordance with the World Bank World Development Report 2021 and driven by data availability.

3
The results show that, with regards to the component of rules governing data transfers, trading partners sharing the open model exhibit positive trade correlations in digital services, whereas country-pairs sharing the limited model show negative trade correlations. The result for the conditional model is mixed, with positive and negative trade correlations found for different sectors. A differing pattern appears when looking at regulatory rules for the domestic processing of personal data: country-pairs sharing the open model as well as the limited model reveal negative trade correlations in digital services, while countries sharing the conditional model show positive trade correlations. The results are especially significant for the IT and information services sector, which covers computer services, Business Processing Outsourcing (BPO) services, as well as database and data processing services.
The study’s findings are relevant for policy makers. These findings are especially relevant for developing countries given their potential to benefit from participating in global digital services trade. Many developing countries are able to trade digital services with trade costs that are considered to be lower thanks to the very nature of the internet which reduces the burden of distance (see e.g. Lendle et al., 2016). Countries that are in the process of defining their regulatory framework for personal data might therefore consider how each model correlates with trade in digital services in light of their ability to export.
The remainder of the paper is organized as follows. The next section discusses the previous literature and shows the link between this work and the work on the political economy and legal analysis of the three models for data regulation. Section 3 defines the three data models, provides a descriptive analysis of their implementation globally, and shows how this information links up with economic and development variables. Section 4 sets out the baseline gravity model and provides various robustness checks. Section 5 shows the results of the regressions, and the last section concludes by discussing the policy implications.
2 Literature Review
The existing literature on the relationship between data regulation and international trade is still very limited, especially when focussing on personal data. In part, this lack may be explained by the difficulty in collecting extensive policy information on the regulatory rules in different countries. In the case of data regulations, this difficulty is further amplified by the novelty of the topic. However, in the past years, some significant efforts have been made to categorize data-related regulatory policies, upon which this papers elaborates.
Earlier undertakings to collect regulatory data policies can be found in Ferracane et al. (2018), in which the authors created the Digital Trade Estimates Database and the Digital Trade Restrictiveness Index (DTRI). The database lists a wide range of policy restrictions in digital trade for 67 countries, including data-related policy measures. The analysis on data policies has been further refined with the development of the Data Restrictiveness Index presented in Ferracane et al. (2020), which looks at data restrictions that apply on cross-border data flows and on domestic data processing. Meanwhile, other databases have now also picked up data-related measures that affect digital trade, particularly with respect to digital services. Examples include the OECD’s Digital Services Trade Restrictiveness Index (DSTRI) as shown by Ferencz (2019) and the newly updated Services Trade Restrictiveness Index (STRI) developed by the World Bank-WTO (i.e. Borchert et al., 2019). These two

4
databases however only cover restrictions on cross-border data transfers.2 Moreover, none of these databases has a specific focus on personal data, although they do also list measures regulating personal data.
Another strand of the literature relevant for this analysis is the one discussing data-related regulations from a legal vantage point, and which identifies the defining features of the existing global data realms. Aaronson and Leblond (2018) show that data governance across the globe takes shape into three distinct models, namely the ones developed by the US, EU, and China. The authors discuss data-related governance with respect to trade policy, including a reference to the treatment of privacy. Gao (2018) presents the contrasting policy approaches between China and the US with respect to digital trade, while in Gao (2019) the author delves deeper into the features of the China model with regards to data regulations.
Other recent works also make note of the differing models of global data governance. These works either discuss the three data models in relation to the political economy of digital policies in the US (Azmeh et al., 2019) or from the perspective of the WTO (Hodson, 2018; Sen, 2018). In addition, another set of works does not explicitly distinguish between the models of global data governance but discusses aspects of the current state of play in data governance whilst proposing the potential for regulatory cooperation (Mattoo and Meltzer, 2018; Meltzer, 2019). These authors also point out to the separation between restrictive policies inhibiting trade and other associated regulatory policies that are related to data privacy. Other recent works such as Daza Jaller et al. (2020) make a distinction between data regulations that are likely to adversely affect digital trade and other types of regulatory policies that in fact can promote the development of digital markets by creating trust, such as regulatory policies related to data privacy and protection.
This study also contributes to the literature on the economic impact of data protection rules. Previous studies on this issue include Christensen et al. (2013), which uses calibration techniques to evaluate the impact of the GDPR proposal on small- and medium-sized enterprises (SMEs) and concludes that SMEs that use data rather intensively are likely to incur substantial costs in complying with these new rules. Another study by Bauer et al. (2013) uses a computable general equilibrium model to estimate the economic impact of the GDPR and finds a reduction of trade between the EU and the rest of the world. More generally, this strand of the literature covers the research on the economics of privacy, covering the economic value and consequences of protecting and disclosing personal data. Acquisti et al. (2016) provides a general overview of the theoretical and empirical research on the economics of privacy and shows how the economic analysis of privacy has evolved over time and has become increasingly nuanced and complex with the advancements of information technology.
This paper combines these varying strands of the literature regarding personal data, data restrictions and data governance. Specifically, it starts by developing a taxonomy to identify the various data models that regulate personal data on the basis of their specific features. Based on this taxonomy, which covers three data models, the study systematically categorizes the 116 countries to see to which of the three models they belong to. It does so by looking both at regulations related to cross-border data transfers and domestic data processing as two separate components. Then, as part of
2 Restrictions on domestic processing of data may not be considered as a direct trade restriction but do have an impact on the economic performance of firms as illustrated in Ferracane et al. (2020). Both the OECD and the World Bank-WTO indices omit this type of domestic regulatory data measures. Regulatory rules aiming at the domestic processing of data typically aim to achieve a non-economic policy goals as set out by governments, such as privacy and security. However, these rules can also create restrictions for trade.

5
the next step the study uses this categorization for the first time into a gravity model to study the relationship between data models and trade in digital services. In particular, the paper looks at whether sharing the same data model between country-pairs is positively or negatively correlated with trade in digital services among these countries.
3. Three Data Models
While regulations of personal data diverge widely between countries, it is nonetheless possible to identify three main approaches with some distinctive characteristics: one model based on open transfers and processing of data, a second model with conditional transfers and processing, and a third one that is based on limited transfers and processing. These three data models have become a reference for many other countries when defining their rules on both the cross-border transfer and the domestic processing of personal data.3
3.1 Taxonomy
Table 1 summarizes the main features of the three data models, broken down by the two components of cross-border transfers and domestic processing of data. Each data model has several defining features that described and summarized as follows.
The open model for data transfers and processing is characterized by the absence of restrictions on cross-border data flows. Neither does the open model have a comprehensive framework for personal data protection that applies to domestic data processing.4 With regards to cross-border data transfers, countries following this model usually rely on a baseline set of privacy principles and leave to companies the flexibility to self-regulate on a voluntary basis. Under this model, firms usually remain accountable for how personal data is treated, also when it is transferred to a recipient in a third country. However, several countries following this model simply lack any accountability on how personal data is treated after crossing the borders. For domestic processing, the open model is defined by the lack of a comprehensive framework on personal data and, therefore, data subjects have only limited rights when it comes to how their personal data is handled. Under this model, it is not uncommon that certain sensitive categories of data, such as in finance and health, have sectoral rules on data processing. In general, countries that fit under this model consider data protection as a consumer right. This model also covers all those countries that simply have not yet regulated personal data at all.
3 Note that there is no globally accepted definition of personal data. For example, according to the US Office of Management and Budget guidance to federal agencies (OMB, 2016), personal data refers to “information that can be used to distinguish or trace an individual's identity, either alone or when combined with other information that is linked or linkable to a specific individual”. The EU General Data Protection Regulation (GDPR) instead defines personal data more widely as “any information relating to an identified or identifiable natural person (‘data subject’); an identifiable natural person is one who can be identified, directly or indirectly, in particular by reference to an identifier such as a name, an identification number, location data, an online identifier or to one or more factors specific to the physical, physiological, genetic, mental, economic, cultural or social identity of that natural person” (Art. 4). This uncertainty poses additional challenges to the analysis of the impact of data models on trade. 4 For example, Gao (2018) refers to the US Telecommunication Act of 1996, 47 U.S.C.¶230(b)(2) which states that it is “the policy of the US (…) to preserve (…) free market (…) unfettered by Federal or State regulation”.

6
The second data model is the one based on conditional transfers and processing. Countries following this model take a comprehensive and fundamental rights approach to data protection with preventative regulation.5 Regarding cross-border data transfers, countries applying this model impose certain conditions to be fulfilled ex-ante for the transfer of personal data across borders. These conditions can be quite diverse, including the consent of the data subject, the use of specific legal mechanisms such as binding corporate rules, the compliance with specific codes of conduct, or the requirement that the recipient countries have a regime for data protection considered as ‘adequate’. For data processing in the domestic market, this model is characterized by the presence of a comprehensive regime for personal data protection, which includes the consent for data collection, extensive data subject rights such as the right to access, modify and delete data, and in most cases also the establishment of data protection authorities. In these countries, personal data protection is usually treated as a fundamental human right.
Table 1: Main features of data models used for the categorization of countries
Cross-border data transfers Domestic data processing
Open Transfers and Processing Model
Self-certification; self-assessment schemes; ex-post accountability; trade agreements and plurilateral/bilateral arrangements as only means to regulate data transfers.
Lack of comprehensive data protection framework; lack of informed consent; privacy as a consumer right.
Conditional Transfers and Processing Model
Conditions to be fulfilled ex-ante, including adequacy of the recipient country, binding corporate rules (BCR), standard contract clauses (SCCs,) data subject consent, codes of conduct, among others.
Wide data subject rights; data subject consent; right to access, modify and delete personal data; establishment of data protection authorities (DPAs) or agencies; privacy as fundamental human right.
Limited Transfers and Processing Model6
Strict conditions including bans to transfer data cross border; local processing requirements: ad hoc government authorization for data transfers; infrastructure requirements; ex-ante security assessments.
Extensive exceptions for government access to personal data; privacy vs security and social order.
Source: Authors.
5 In the case of the EU, which is the main actor embodying this model, the issue of privacy and data protection is incorporated as a matter of fundamental rights in the European Convention of Human Rights (Art.8), Lisbon Treaty (Art. 16) and the Charter of Fundamental Rights of the EU (Artt. 7-8). 6 The reference to limited model is driven by the cross-border element of the model in order to create consistency with the analysis presented in the World Development Report 2021, which focuses on the cross-border element.
7
Finally, the third model is based on limited transfers and processing of data. This model is more common among countries where the concept of the right to privacy is pretty recent.7 Countries following this model tend to link data privacy to cybersecurity, given that generally data regulation is elevated into a matter of national security (e.g. see Gao, 2019).8 Countries following this model are characterised by extensive restrictions on cross-border data transfers and by systematic control of personal data by national authorities. In regard to the cross-border transfers of personal data, this model imposes strict requirements which include the local processing of data or the ex-ante authorization by the government following a security assessment.9 Regarding the domestic processing of personal data, countries following this model impose extensive and systematic control over data, including indiscriminate government access to data to protect national security and public order (Wang, 2012; Rubinstein et al., 2014).10 Note that, when a country has a comprehensive data protection regime in place, but still allows for extensive exceptions for government access to personal data, this country is nonetheless categorized under this model. The reason is that, despite the law is giving rights to the data subjects, the regulatory framework provides extensive exceptions to these rights.
3.2 Mapping Data Models
The above-described characteristics of each data model serve as reference points to systematically categorize 116 countries into one of the three models. Figure 1 and 2 provide a world map of this categorization for the cross-border transfer and domestic data processing components, respectively. The open model is highlighted in blue, the one based on conditions in green, and the limited model in red. Data is based for the most recent year, namely 2019.
Table A1 in the annex also shows the results of this categorization by listing the countries that belong to each regulatory data model, also split into the two components. Note that a country does not necessarily belong to the same model across the two parts. For instance, Tunisia, Ivory Coast and Ukraine follow the limited transfers model, whereas these countries follow the conditional model for domestic processing of data. Another example are countries from North America which all follow the
7 In China, which is the major actor employing this data model, the first mention to data privacy appeared when the Tort Liability Law was enacted in 2009 (Wang, 2012). 8 Regarding China, Gao (2019) adds that “the key to understand data regulation in China, therefore, must be security”. The heightened link with security not only explains the domestic regulatory framework in China, but also informs on how China would deal with the issue at the international level. As stated by President Xi, “there is no national security without cybersecurity”. 9 See China’s 2017 Cybersecurity Law, which imposed several restrictions aiming to “safeguard cyber security, protect cyberspace sovereignty and national security”, as stated in the Cybersecurity Law of the People's Republic of China, as adopted at the 24th Session of the Standing Committee of the Twelfth National People's Congress of the People's Republic of China on November 7, 2016, Art. 1, available at http://www.chinalawinfo.com. On China, see also Ferracane and Lee-Makiyama (2017) and Gao (2019). Another example if the Russian Federal Law No. 242-FZ “On Amending Certain Legislative Acts of the Russian Federation Regarding Clarifying the Personal Data Processing Procedure in Information and Telecommunication Networks’ from 21 July 2014, which required data operators to ensure that the recording, systematisation, accumulation, storage, update/ amendment, and retrieval of personal data of the citizens of the Russian Federation is made using databases located in the Russian Federation. 10 Wang (2012) states that with respect to China: “in the constitution law, penal laws, penal litigation laws, state security laws, and other public sector laws there are many exemption rules and vague definitions that grant the government extensive rights and generous room for flexibility for investigation, seizure, and search, especially in the areas of state security or for maintaining social order”.

8
open transfers model for data flows across borders, but both Canada and Mexico have adopted the conditional model for domestic data processing. Overall, only roughly half of the countries in the sample follow the same model for both cross-border transfers and domestic processing of data. Of these, 35 countries follow the conditional model, 25 countries follow the open model, and only 4 countries follow the limited model, as can be seen in Table A1 as well.

9
Figure 1: World map showing the three data models for the cross-border (CB) data flows component (2019)

10
Figure 2: World map showing the three data models for the domestic data processing (DR) component (2019)

11
With respect to rules related to cross-border data transfers, there are 39 countries that follow the open model, representing a share of 34 percent of the 116 countries analysed; 66 countries follow the conditional transfers model, representing 57 percent of the total country sample; whereas only 11 countries follow the limited transfers model, representing a share of 9 percent. When considering the EU as one entity, the share of countries following the open transfers and conditional transfers models becomes almost equal.
Regarding the rules on the domestic processing of data, Table A1 shows that the number of countries pursuing the open processing model drops to 29, representing a share of 25 percent of all countries considered. Conversely, the number of countries following the conditional processing model goes up to 79, representing a share of 65 percent. Last, only 12 countries in the sample follow the model with limited data processing, with a share of 10 percent. Again, when counting the EU as one entity, the share of the conditional processing model is substantially reduced but nonetheless remains higher than the share of countries that follow the open processing model.
As such, the distribution of the three models in the dataset shows a fair amount of variability, which facilitates the econometric analysis this paper employs, which is described below.
3.3 Descriptive Analysis
Before turning to the econometric assessment, this section presents some descriptive analysis. In particular, it shows the share of global digital services trade that is captured by each of the three data models (section 3.3.1); the top 10 country-pairs of digital services trade that have the same data model in place (section 3.3.2); and show how the categorization of the three data models relates with digital services trade and various other development variables (section 3.3.3). Given that the econometric analysis uses the gravity model, it also relate the main variable of interest with various gravity determinants such as distance and market size (section 3.3.4), and finally with some variables related to the internet (section 3.3.5).
The analysis is conducted using the trade data available in the TiVA database, in particular the underlying gross exports data. This data source covers bilateral goods and services trade up till the year 2015.11 The analysis focuses on digital services trade, which covers different sectors. First, it includes the purely digital services such as publishing, audio-visual and broadcasting services, telecommunications, and IT and other information services, which correspond to ISIC Rev. 4 numbers 58-63. Second, it adds a series of business services that have become substantially digitalized in recent years in order to capture the so-called digital-enabled or digitally delivered services trade (see also UNCTAD, 2019; López González and Jouanjean, 2017; and Borga and Koncz-
11 To main reasons stand out in preferring the OECD TiVA database over other databases such as the ITPD-E database. One, in the econometric analysis the OECD trade data is used for reasons set out in Section 4. Even though the ITPD-E database provides data for more developing countries, it is preferable to use consistent trade data throughout all sections of the paper. Second, the OECD TiVA trade data distinguishes between more sub-categories of digital sectors, whereas the ITPD-E database lumps up digital services into one aggregate sector, namely ISIC Rev. 4 code “J”, which covers information services, telecommunications, and IT, computer and other information services combined (i.e. ISIC Rev. 4 codes 58-60, 61, 62, 63 respectively). However also data from the ITPD-E database is used for a robustness check and found largely similar results.

12
Bruner, 2011). These business services correspond to ISIC Rev. 4 numbers 45-56 as well as 64-66, 68-75 and 77-82.12 Together, this grouping is referred as Digital+, as shown in Annex Table A2.
Of all bilateral trade relations that exist in the TiVA database, the analysis captures around 63 separate exporters and importers. Admittedly, by selecting TiVA over other sources of trade such as the ITPD-E, it omits a large group of developing countries. However, compared to the ITPD-E database, TiVA records more consistent bilateral trade data for the smaller group of developing countries covered. Consequently, this results in a higher number of total observations. Moreover, the share of digital services trade covered by countries sharing the same data model only increases by a small share when using the ITPD-E database, as can be seen when comparing Figure 1 with Figure A1 in the Annex.
3.3.1 Data models and digital services trade
Figure 3 shows that a share of 53 percent of digital services trade takes place among country-pairs sharing a similar data model when considering the component of cross-border flows of data. This share is slightly lower when considering the component of domestic processing of data, namely 47 percent. This difference is due to the fact that, as explained, countries can be categorized into two different models across the twin components.13 The rest of the digital services trade takes place between countries following different data models.
Within the portion of digital services trade covered by country-pairs that share the same data model, the vast majority of trade happens between countries that follow the conditional model. This share is around 79 percent for the component of cross-border data transfers, which increases up to 92 percent for countries following the conditional model for domestic data processing, as shown in Figure 2. A smaller fraction of trade within that portion takes place between countries sharing the open model of cross-border transfers and processing of data, with a share of respectively around 20 percent and 4 percent. Only a minority of trade happens between country-pairs sharing the limited model. The share is about 1.5 percent considering the component of cross-border data transfers and 4.5 percent considering the component of domestic data processing.
12 Typically, digital trade also covers trade in digital goods such as computer, electronic and optical products (ISIC Rev. 4 code 26), which has been left out from this study because of its focus on digital services trade. 13 In what follows, the categorization of countries is based on the component of cross-border data transfers, given that this component more directly connected to trade.

13
Figure 3: Share of digital services trade of country-pairs sharing the same data models (2015)
Source: Authors’ calculations using TiVA trade data. Note: Digital services trade covers ISIC Rev. 4 codes 45-82.
47.0%53.0%
Trade between country-pairs sharing the same data modelTrade between country-pairs not sharing the same data model
Cross-border data transfers rules
53.2%46.8%
Trade between country-pairs sharing the same data modelTrade between country-pairs not sharing the same data model
Domestic processing of data rules

14
Figure 4: Share of digital services trade of country-pairs sharing the same data model, by data model by (2015)
Source: Authors’ calculations using TiVA trade data. Note: Digital services trade covers ISIC Rev. 4 codes 45-82.
19.9%
78.6%
1.5%
Conditional Open Limited
Cross-border data transfers rules
3.8%
91.7%
4.5%
Conditional Open Limited
Domestic processing of data rules

15
Overall, therefore, as a share of total digital services trade (i.e. also including trade covered by countries with different data models), these numbers tell that, for the component of cross-border data transfers, around 42 percent is governed by the conditional transfers model, around 11 percent by the open transfers model, and only less than 1 percent by the limited transfers model. Considering rules on the domestic processing of data, a share of 42 percent is governed by the conditional processing model, only about 2 percent of trade is among country pairs applying the open processing model, and a similar share of 2 percent is based on the limited processing model.
Bilateral digital services trade is on average higher among country-pairs sharing the open data model for cross-border data transfers, with an average value of 3284 Mln. USD. Countries sharing the conditional transfers model have an average bilateral digital services trade value which is significantly lower (1067 Mln. USD), whereas the average trade value for countries following the limited model is the lowest (911 Mln. USD). The high value for the open model is naturally explained by the size of the US, which is at the centre of all trade that is covered by this model. When using trade per capita as a measure, the conditional model emerges as the one with the highest average value of digital services followed by the open model, and then the limited model. This ranking is explained by the fact that many countries adhering to the conditional model are smaller economies.14
These differences also become visible by plotting the distribution of the services trade data by data model, as done in Figure A2. It adopts the log of bilateral digital trade. The differences in the average values between the open model and conditional model becomes clearly visible: countries sharing the open model for cross-border transfers of data have a higher average of total digital services trade. But when expressing values on a per capita basis, countries sharing the conditional model shows the highest trade numbers.
3.3.2 Top 10 country-pairs for digital services trade for each data model
Table 2 shows the Top 10 biggest country-pairs for digital services trade for each data model. The largest bilateral traders in digital services are the ones that follow the open data model in which the US is often one partner country. The 10 biggest country-pairs having the open data model in place cover a share of around 8 percent of global digital services trade. The US and Canada share the biggest trade relationship, followed by the US and Mexico. On top of countries in North America, many countries with high digital trade links that share the open model are located in Asia (such as Taiwan, Thailand and Hong Kong) or involve Australia and New Zealand. The country-pairs sharing this model without the US as a partner country, but with also relatively high trade values, are Mexico-Canada, followed by Australia-New Zealand.
The Top 10 country-pairs that share the conditional model represent a share of 5 percent in global digital services trade. The two countries that trade most digital services with each other are the UK and Germany, which however only represent around a quarter of digital services trade between the US and Canada. All other top country-pairs sharing this model are found in the EU, except the pair Switzerland-Germany. The list of European country-pairs in the Top 10 is fairly concentrated around Germany and the UK, followed by France. The country-pair with the highest digital services trade not
14 Note that per capita numbers include intra-EU trade, too. Given that many EU countries are smaller in economic size, the per capita services trade figures naturally increase compared to the numbers involving the US and China, which are the main economies implementing the other two data models.

16
involving an EU country is composed of Japan-Singapore, which is ranked 12, followed by Japan-Korea, somewhat further below in the ranking.
Table 2: Top 10 country-pairs for digital services trader by data model in 1000 Mln. USD (2015)
Open Transfers and Processing Model
Conditional Transfers and Processing Model
Limited Transfers and Processing Model None
Exporter Importer Trade Exporter Importer Trade Exporter Importer Trade Exporter Importer Trade
USA CAN 115.49 GBR DEU 27.60 RUS CHN 10.70 USA CHN 89.70
CAN USA 61.58 DEU FRA 27.37 IDN CHN 4.16 USA JPN 61.61
USA MEX 55.04 GBR IRL 27.29 CHN RUS 3.67 GBR USA 60.20
MEX USA 48.58 FRA DEU 26.29 CHN VNM 3.65 IND USA 51.19
USA BRA 29.95 GBR FRA 25.42 RUS KAZ 3.37 USA GBR 47.76
USA AUS 18.18 DEU GBR 23.38 KAZ CHN 2.91 USA DEU 46.83
USA SAU 13.75 FRA GBR 22.84 CHN IDN 2.86 CHN USA 45.53
BRA USA 10.72 CHE DEU 21.54 VNM CHN 2.16 USA IRL 43.08
USA TWN 9.60 GBR LUX 20.11 KAZ RUS 1.68 DEU USA 39.71
HKG USA 9.08 NLD DEU 19.85 CHN KAZ 0.49 USA KOR 36.76
Total 371.97 Total 241.69 Total 35.65 Total 522.38
Share world (%) 7.67 Share world (%) 4.98 Share world (%) 0.74 Share world (%) 10.77
Source: Authors’ calculations using TiVA trade data. Note: Trade is based on exports data. Countries are categorized on the basis of the data model regarding the cross-border data transfers.
The 10 largest country-pairs that follow the limited model represent a meagre 1 percent of global digital services trade. The largest bilateral trade relation is between Russia and China, followed by Indonesia-China. Note that the amount of services trade between any of the Top 10 country-pairs is much lower compared to countries sharing the other data models. Not all Top 10 country-pairs following this data model include China. Russia and Kazakhstan share strong digital services trade links as shown in Table 2, but also Russia and Vietnam as well as Indonesia and Vietnam have substantial links in digital services trade, falling just outside the Top 10 list. Other country-pairs applying the limited model, such the ones involving Brunei or Tunisia, only cover a small part of digital services trade.
Over 10 percent of global digital services trade is covered by the Top 10 country-pairs that do not share the same data model. This high share is consistent with the high share of total global digital services trade covered by country-pairs with different data models (Figure 3). The largest bilateral trade relationship in digital services in this list is the one between the US and China, followed by US-Japan. Note that two Asian countries are reported in this Top 10 list of country-pairs with dissimilar data models, namely India and Korea. Moreover, three EU Member States also appear in this list, which are the UK, Germany and Ireland. Note that if the EU is counted as one, the largest trade relationship in this category would be US-EU with 282 Mln. USD, representing alone a world share of 5.8 percent.

17
3.3.3 Data models, digital services trade, and development variables
Digital trade is strongly connected with a country’s level of development. Figure 5 shows that richer countries tend to exhibit a greater level of per capita digital services trade. The dashed vertical line in the figure marks the difference between high-income and middle-income countries. Interestingly, the three data models are applied by countries across all income groups, except for countries following the limited model for which Brunei is the only high-income country with this model in place.15 The other countries applying a limited model are middle income countries, falling below the dashed vertical line.
A further interesting insight from this graph is that almost all countries sharing the limited model are placed below the fitted values line, indicating that they trade less digital services than it would be expected on the basis of their per capita income levels. This is not always the case for countries sharing the other models, where in fact countries are placed both above and below the dashed fitted values line.
Figure 5: Digital services trade, data models, and level of development (2015)
Source: Authors’ calculations using TiVA trade data and World Bank WDI. Countries are categorized on the basis of the data model regarding the cross-border data transfers.
Digital services trade is also strongly associated with technological capabilities of a country, which in turn is typically connected with the level of development. Figure 6 shows that countries with a higher level of per capita digital services trade also exhibit greater levels of technological development. Here too, the open model and the conditional model are applied by countries placed across all levels of digital technology capabilities, while the limited model is more common among
15 The EU countries, which all follow the conditional model and are high-income countries that are omitted from Figure 4.
.1
1
10
100
Per c
apita
exp
orts
in 1
000
Mln
. USD
(log
)
4000 8000 16000 32000 64000 12800GDP per capita PPP USD (log)
Open Conditional Limited
By level of developmentDigital services trade and data models

18
countries with a lower capacity of digital technology. The dashed vertical line marks the threshold level of technological capabilities between the high-income and middle-income countries.
Figure 6: Digital services trade, data models, and technology capability (2015)
Source: Authors’ calculations using TiVA trade data, World Bank WDI and WEF. Countries are categorized on the basis of the data model regarding the cross-border data transfers.
3.3.4 Data realms and gravity determinants
Gravity forces such as geographical distance, market size and trade policies such as Free Trade Agreements (FTA) are all likely to play a strong role in predicting digital services trade, as they do with trade flows generally. Figure 7 confirms this assumption. The three panels of Figure 7 plot on the horizontal axis the distance between the US, EU (for which Brussels is used as a geographic reference) and China respectively, and all trading partners, whilst plotting on the vertical axis the digital services exports of these three entities to each trading partner, divided over their market size. These three trade entities are considered the main representatives of each data model. Figure 7 also highlights for each panel when trading partners share the same data model of the US, EU or China. Moreover, the country dot is marked by an additional coloured circle when it shares an FTA with each of the three trading powers.
.1
1
10
100
Per c
apita
exp
orts
in 1
000
Mln
. USD
(log
)
3 4 5 6Index of digital technology capabilities
Open Conditional Limited
By technology capabilityDigital services trade and data model

19
Figure 7: Digital services trade, geographic distance, and data models (2015)
Source: Authors’ calculations using TiVA trade data, World Bank WDI and ITPD-E. Countries are categorized on the basis of the data model regarding the cross-border data transfers.
AUSBRA
CAN
HKG
KHM
MEX
NZL
PHLSAUTHA
TUR
TWN
.06
.125
.25
.5
1
2
4
8
16
32
Dig
ital s
ervi
ces
expo
rts/P
artn
er's
GD
P (%
log)
1500 4500 7500 10500 13500 1650Distance in km
Open FTA
US exports of digital servicesDistance and data model
ARG
CHE
CHL
COL
CRIIND
ISL
ISR
JPN
KOR
MAR
MYS
NOR
PER
SGP
ZAF
.06
.125
.25
.5
1
2
4
8
16
32
Dig
ital s
ervi
ces
expo
rts/P
artn
er's
GD
P (%
log)
1500 4500 7500 10500 13500 16500Distance in km
Conditional FTA
EU exports of digital servicesDistance and data model
BRNIDNKAZ
RUS TUN
VNM
.06
.125
.25
.5
1
2
4
8
16
32
Dig
ital s
ervi
ces
expo
rts/P
artn
er's
GD
P (%
log)
1500 4500 7500 10500 13500 16500Distance in km
Limited FTA
China's exports of digital servicesDistance and data model

20
A negative correlation appears in each panel, although with varying degrees. That is, the greater the distance between either the US, EU and China and their trading partners, the lower the level of digital services traded between the country-pairs. However, this correlation appears much stronger for exports of the EU than for the US and China.16
The first panel shows that the US has significant trade in digital services with countries sharing the open data model which are geographically close, such as Canada and Mexico, or very distant, such as Australia and Cambodia. Among US trading partners that share the same data model, US trade shows high variability, with high levels of digital services being traded with some countries like Hong Kong, while at the same time much low levels of trade are observable for countries at similar distance, such as Cambodia. As a result, at first sight, the relationship of US digital services exports with respect to distance is not always strong.
The second panel shows a different picture in which for the EU distance appears to play a much stronger role with respect to digital services trade. Many of EU’s trading partners in digital services that also share the same data model are located relatively nearby, although several countries are further away such as Chile and Argentina. The EU also shares a higher number of FTAs with trading partners that have the same data model in place, such as South Africa, Chile, Switzerland and Israel. Moreover, the EU seems to share more FTAs with partner countries located further way, likely compensating for the stronger negative relationship between digital services trade and distance it faces (as shown by the steeper line). Furthermore, the variability of digital services trade between the EU and its trading partner is generally lower, with Singapore being the exception.
For China’s digital services trade, geographical distance seems to play also a weaker role for its trading partners. This is illustrated by the relatively flat dashed fitted values line between China’s digital services exports and distance. Vietnam is one of China’s most important trading partner that shares the same data model, after considering the country’s market size, and the country is also relatively close to China. In fact, many of China’s trading partners sharing its data model are mostly placed relatively close by.17 China shares an FTA with Vietnam, Indonesia and Brunei.
Market size matters for digital services trade, too. Figure 8 shows that for all three trading entities a strong and positive relationship exists between trade in digital services and the size of the market. The three panels of the figure show that the US, EU and China, respectively, trade with countries that are both small and big in economic size, even though the US shares its open data model with only one trading partner which is fairly small, namely Cambodia. Both the US and China otherwise tend to trade relatively more with larger countries, whereas the EU shows somewhat lower levels of digital services trade with some of its larger trading partner that share the same data model, such as with Japan.
16 The distance coefficient with respect to the log digital services trade in GDP based on simple regressions with robust standard errors for the US is -0.53, for the EU (using Brussels) is -0.62, and for China is -0.60, using the log of distance. The coefficient results are significant for the EU and China, whereas they are insignificant for the US. Lower coefficient results indicate greater sensitivity of digital services trade to geographical distance, after taking into account the market size of the partner country. Generally, services trade is less sensitive to distance than goods trade. 17 The other two countries that share the same data model as China are however located further away. These are Ivory Coast and Kenya, for which trade data is missing.

21
Figure 8: Digital services trade, market size, and data models (2015)
Source: Authors’ calculations using TiVA trade data, World Bank WDI. GRC stands for Greece, a mid-level country in economic size, which is normalized to 1 (GRC=1) following Head and Mayer (2014). Countries are categorized on the basis of the data model regarding the cross-border data transfers.
AUSBRA
CAN
HKG
KHM
MEX
NZL
PHLSAU
THATUR
TWN
.5
.75
1
1.25
1.5
1.75
2
Dig
ital s
ervi
ces
expo
rts (G
RC
=1)
.9 .95 1 1.05 1.1 1.15Size GDP (GRC=1)
Open
US exports of digital servicesMarket size and data model
ARG
CHE
CHLCOL
CRI
IND
ISL
ISR
JPNKOR
MARMYS
NOR
PER
SGP
ZAF
.5
.75
1
1.25
1.5
1.75
2
Dig
ital s
ervi
ces
expo
rts (G
RC
=1)
.9 1 1.1 1.2Size GDP (GRC=1)
Safeguards
EU exports of digital servicesMarket size and data model
BRN
IDN
KAZ
RUS
TUN
VNM
.5
.75
1
1.25
1.5
1.75
2
Dig
ital s
ervi
ces
expo
rts (G
RC
=1)
.9 1 1.1 1.2Size GDP (GRC=1)
Control
China's exports of digital servicesMarket size and data model

22
3.3.5 Data models, Internet access, and institutions
Much of digital services trade takes place over the internet. This is especially true for information services, telecommunications, and computer services, because they rely extensively on internet technologies that enable their tradability. Having access to an open internet is therefore an important factor to promote trade in digital services. This importance is substantiated in Figure 9, which shows a positive relationship between countries’ greater access to the internet and per capita digital services trade. The access to an open Internet is measured through the Freedom on the Net indicators of the Freedom House, which cover the extent to which the internet in each country experiences infrastructural and economic barriers to access, government efforts to block specific internet technologies, as well as legal, regulatory and ownership control over internet and mobile phone access providers, and the independence of regulatory bodies.
Figure 9: Digital services trade, data models, and Internet access (2015)
Source: Authors’ calculations using TiVA trade data, World Bank WDI and Freedom House. Countries are categorized on the basis of the data model regarding the cross-border data transfers.
This proxy indicator of internet access from the Freedom House forms part of a wider assessment of whether the Internet is qualified as free, partly free and not free. Thus, besides economic access to the internet, the institute assesses whether the Internet is free on the basis of many other non-economic criteria, such as content access and free speech, which are then combined.18 Figure 8 shows that all countries that are classified as having a free internet share either the conditional or
18 Besides economic access to the internet, the other two categories on which this indicator measures whether the Internet is free, partially free or completely free are (a) whether there are limits on Internet content, such as legal regulations, technical filtering or self-censorship; and (b) whether there are violations of user rights, such as privacy, cyberattacked and repercussions for online speech.
.1
1
10
100
Per c
apita
exp
orts
in 1
000
Mln
. USD
(log
)
5 10 15 20 25Free from obstacles to internet access
Open Coditional Limited Free Internet No Free Internet
By obstacles to internet accessDigital services trade and data model

23
the open model for regulating data. In contrast, there is no country with the limited model that is assessed as having a free internet.19
Figure 10 concludes this descriptive section by looking at the countries’ domestic institutional quality. Given that economic access to the internet is related to a countries’ independence of regulatory bodies, domestic regulatory institutions in a wider sense be an important factor for trade in digital services. The proxy for this analysis is the indicator from the World Bank Governance Indicators which measures the country’s regulatory quality. Figure 10 shows that countries with greater regulatory quality exhibit higher digital services exports. Countries sharing the conditional model exhibit on average a higher score than countries following the other models, even after excluding EU member states.
Figure 10: Digital services trade, data models, and domestic institutions (2015)
Source: Authors’ calculations using TiVA trade data, World Bank WDI and Governance Indicators. Countries are categorized on the basis of the data model regarding the cross-border data transfers.
4. Estimation using the Gravity Model
This section presents the baseline gravity model used to estimate econometrically whether sharing the same data model is correlated with higher or lower digital services trade.20 In doing so, the
19 The midrange of a partly free Internet is taken up by more or less an equal number of countries having a US or EU model. The Freedom House assesses the openness of the Internet for 65 countries, of which 6 are EU member states. Note furthermore that the Freedom House covers 11 countries which are not categorized for their data realm. Of these, 7 countries are qualified as partly free and 4 as not free. 20 Given that the empirical set-up follows a gravity model, which has been extensively used in previous works, the discussion omits how the method for estimating parameters econometrically is consistent with the constraints imposed by standard trade theory. Full details of the gravity model’s solution and characteristics are provided by Anderson et al. (2018; 2015). Their starting point is the familiar structural gravity model
.1
1
10
100
Per c
apita
exp
orts
in 1
000
Mln
. USD
(log
)
-1 0 1 2Regulatory quality
Open Conditional Limited
By regulatory qualityDigital Services Trade and data models

24
empirical strategy makes use of a binary bilateral variable between the exporting and importing country indicating whether country-pairs share the same data model (in which case the variable takes a value equal to one) or not (in which case the variable is zero). Due to its dyadic nature, this indicator resembles many other conventional gravity variables, such as whether countries share an FTA or even closer to the interpretation of the analysis, whether countries share the same legal origins as developed by La Porte et al. (2008). The analysis first estimates whether country-pairs showing the same data model for any of the three models reveal a digital services trade correlation. In a second step, each of the three data models is analysed to estimate their individual trade correlations. In both cases, the two components of the data models, cross-border data transfers and domestic data processing, are considered.
4.1 Baseline Regressions
Equation (1) measures formally the extent to which sharing the same data model is correlated with digital services trade. In particular, the analysis regresses bilateral digital services trade between country o (exporter) and country d (importer) on the dyadic indicator reflecting whether countries share the same data model, in addition to other control variables. Hence, the empirical baseline model takes the following form:
𝐷𝐷𝐷𝐷𝐷𝐷𝑜𝑜𝑜𝑜 = exp [𝜃𝜃1GRAV𝑜𝑜𝑜𝑜 + 𝜃𝜃2MODEL𝑜𝑜𝑜𝑜 + 𝜃𝜃3C ∗ intl𝑜𝑜𝑜𝑜 + 𝛿𝛿𝑜𝑜+ 𝛾𝛾𝑜𝑜] ∗ 𝜀𝜀𝑜𝑜𝑜𝑜 (1)
In equation (1), MODEL𝑜𝑜𝑜𝑜 is the vector that captures whether country-pairs o and d share any of the three data models, regardless of the model they follow. The term is a vector, as this variable is developed along two components, namely again whether country-pairs share the same data model for rules related to the cross-border transfer of data, denoted by CB; and whether country-pairs share the same data model for rules on the domestic processing of data, called DR. As previously noted, a country can adhere to different data models for the two components.
Next, the MODEL𝑜𝑜𝑜𝑜 term is split up into the variables that identify whether o and d share one of the three data models of open transfers and processing (OP), conditional transfers and processing (CT) or limited transfers and processing (LT). Each of this term gives rise to three separate data models vectors given that each contains in similar manner the two components of CB and DR. Formally, therefore, the second empirical baseline model takes the following form:
𝐷𝐷𝐷𝐷𝐷𝐷𝑜𝑜𝑜𝑜 = exp [𝜃𝜃1GRAV𝑜𝑜𝑜𝑜 + 𝜃𝜃2OP 𝑜𝑜𝑜𝑜 + 𝜃𝜃3CT𝑜𝑜𝑜𝑜 + 𝜃𝜃4LT𝑜𝑜𝑜𝑜 + 𝜃𝜃5C ∗ intl𝑜𝑜𝑜𝑜 + 𝛿𝛿𝑜𝑜+ 𝛾𝛾𝑜𝑜] ∗ 𝜀𝜀𝑜𝑜𝑜𝑜 (2)
In both equation (1) and (2), GRAV𝑜𝑜𝑜𝑜 is a vector of observables capturing several other factors of trade costs in services. These are the standard gravity variables commonly appearing in the gravity equation, such as distance, contiguity, sharing a common language, whether countries are part of a previous colonial relationship, or whether countries share a trade agreement with each other. Then,
derived from CES preferences across countries for national varieties differentiated by origin (the Armington assumption).

25
the terms 𝛿𝛿𝑜𝑜 and 𝛾𝛾𝑜𝑜 refer to the set of fixed effects by exporter and importer, respectively. Finally, 𝜀𝜀𝑜𝑜𝑜𝑜 is the residual term. Sectoral fixed effects are not applied in the model, since the analysis considers the sum of trade following the different digital services groupings, as outlined in Annex Table A2. Both equations show that the model is estimated using data for a single year, which therefore presents a cross-country section. Panel regressions are also performed for robustness check later on. The study takes the year 2015 given that this year is the latest year available for the dependent variable.
Note that the model is estimated with PPML with fixed effects as recommended by Santos Silva and Tenreyro (2006). By doing so, Fally (2015) shows that the estimated fixed effects correspond exactly to the terms required by the structural model. Furthermore, regressions are estimated with robust standard error clustered by country-pair.
The dependent variable, 𝐷𝐷𝐷𝐷𝐷𝐷𝑜𝑜𝑜𝑜, denoting digital services trade, is also bilateral and includes all directions of trade. That means that, in accordance with the recent literature, it also includes internal trade, which is equal to the domestic production that is both produced and consumed in a given country. The reason for doing so is that otherwise the estimated fixed effects would not relate to the output and expenditure terms set out by the gravity theory of trade. Yet, not all datasets provide this domestic trade. The best available source is the gross trade data from the OECD TiVA data. The advantage of this source is that it contains harmonized trade and production data, so self-trade is simply calculated as production less total world exports. Using the most recent version of the TiVA dataset, the analysis covers services trade and production data for 64 exporters and importers for the year 2015, the latest year available.21
Finally, both equation (1) and (2) also include the term C ∗ intl𝑜𝑜𝑜𝑜. This vector refers to several control variables included in the baseline model and as part of the robustness checks below. Most importantly, this term includes the data model each country follows by itself, regardless of its trading partner. The reason to control for this trait is that it may not be by coincidence that countries choose to apply a particular data model. Indeed, this choice may be driven by the extent to which a country trades digital services with partner countries to begin with. As such, by not including these controls, this relationship would suffer from reversed causality or would be influenced by the fact that precisely a partner country shares the same data model.
These control variables need to be interacted with a dummy indicator that reflects whether a country-pair are dissimilar or not, called “intl”. This aims to cover for trade costs affecting international flows and not domestic flows (i.e. internal trade). The use of this measure also follows the recent gravity literature such as the one developed in Yotov (2012). In particular, Yotov et al. (2016) states that the inclusion of this dummy leads to the theoretically consistent identification of the effects of bilateral trade policies as shown in Dai et al. (2014). Also, this interaction term can be
21 See footnote 10 that explains the decision to select TiVA instead of other services trade sources. The choice is mainly driven by both data availability and consistency between the services trade databases. Compared to the ITPD-E database, which is extensive in the coverage of developing countries, the following points matter for this choice. First, the TiVA data separates the various digital services sectors of interest. The ITPD-E dataset instead takes the various sub-sectors of the digital economy together. Second, many developing countries included in the ITPD-E database show few observations after aggregating into sector groupings in line with Annex Table A3. This points out to the fact that the ITPD-E data is not in a “squared” or balanced format, missing many observations in services, which in TiVA are present (even though they may be estimated). Hence, even though the limited number of developing countries in TiVA does not match the total number of countries with an identified data model, this database is still considered a preferred option. Nonetheless, data from the ITPD-E database is used for a robustness check and find largely similar results.

26
used to identify the effects of any non-discriminatory policies on the side of exporters and importers, following Heid et al. (2015), which to some extent are present in this case.22
4.2 Robustness Checks
Several robustness checks are performed, mainly by including several additional control variables as part of the C ∗ intl𝑜𝑜𝑜𝑜 term. More specifically, using equation (2), each regression model includes additional policy variables such as the ones developed by ECIPE’s Digital Trade Restrictiveness Index (DTRI), the OECD Digital Services Trade Restrictiveness Index (Digital STRI), as well as the WEF Technology Readiness Indicator. The first two variables are estimated on the importers side (country d), whereas the latter is estimated on the side of the exporter (country o). Finally, as said above, the study adopts a panel series and re-estimates the baseline regression equation (1) and (2), including by using alternative trade data from the ITPD-E.
5. Results
The results of the baseline regressions following equation (1) are reported in Table 3. Column 1-7 follow the sectoral groupings as presented in Annex Table A2. In order to enhance readability of the main variable of interests, the results from the GRAV𝑜𝑜𝑜𝑜 and C ∗ intl𝑜𝑜𝑜𝑜 vectors are featured in a separate table, which can be found in Annex Table A3.23 Moreover, Table 3 first reports the coefficient results of CB and DR under MODEL𝑜𝑜𝑜𝑜 when entered separately in order to avoid potential multicollinearity concerns that may arise by entering them simultaneously, even though countries do not necessarily follow the same model for the two components. In a second step the two components are nonetheless entered together.
The results in Table 3 show a positive and negative coefficient result for the MODEL CB variable, which covers cases in which country-pairs share any model regarding the component of cross-border data transfers. However, none of the coefficient results are significant. In the second panel, the results on the MODEL DR for sharing any model regarding the component of domestic processing of data also show insignificant coefficient results which are either positive or negative in sign, except for publishing services which is negative and significant. When entered together, the analysis finds negative and significant correlation for the MODEL DR variable with digital trade in services in two sectors, namely in Digital+ and publishing services. Other sectors show insignificant coefficients. Given these varying outcomes, it may be the case that these two variables are too aggregate.
22 Given that exports is the main trade variable, the study controls the exporter’s data model interacted with the intl𝑜𝑜𝑜𝑜 dummy. Moreover, given that the dummy signifying each country data model is a square set of dummy variables across all countries, the analysis needs to exclude one of the three data models, which is used as a benchmark. The analysis omits the limited model and so coefficient results need to be seen against this model. 23 Note, however, that the coefficient results in Annex Table A4 are performed without the MODEL𝑜𝑜𝑜𝑜 vector. The reason for doing so is that the coefficient results on the variables of interests in MODEL𝑜𝑜𝑜𝑜 need to be set against the results of the country-specific control variables from vector C ∗ intl𝑜𝑜𝑜𝑜 . Given that the variables in both vectors of MODEL𝑜𝑜𝑜𝑜 and C ∗ intl𝑜𝑜𝑜𝑜 are interaction variables, one needs to regress the latter without the model variables to determine the starting point of a country’s export that follows a certain data model. The coefficient results for the variables for both the gravity and control vectors for all other tables can be obtained from the authors upon request. These results are more reported for each table separately but referred to the Annex Table A4 given that only minor changes appear on each of the coefficient results.

27
Table 3: Baseline results following equation (1)
(1) (2) (3) (4) (5) (6) Digital+ Digital Publishing Telecom IT & Info Business
MODEL CB 0.021 0.097 -0.169 0.101 0.065 -0.146 (0.816) (0.524) (0.349) (0.335) (0.737) (0.352)
Obs 4096 4096 4096 4096 4096 4096 P-R2 0.983 0.962 0.958 0.961 0.928 0.968
MODEL DR -0.131 0.038 -0.418** 0.165 0.264 -0.171 (0.172) (0.796) (0.019) (0.209) (0.158) (0.281)
Obs 4096 4096 4096 4096 4096 4096 P-R2 0.983 0.962 0.959 0.961 0.927 0.967
MODEL CB 0.129 0.165 0.125 0.072 0.069 0.002
(0.145) (0.296) (0.349) (0.483) (0.729) (0.988) MODEL DR -0.223** -0.046 -0.524*** 0.097 0.238 -0.225
(0.031) (0.788) (0.005) (0.470) (0.242) (0.193)
Obs 4096 4096 4096 4096 4096 4096 P-R2 0.983 0.963 0.959 0.961 0.930 0.968
Control GRAV Yes Yes Yes Yes Yes Yes Control C Yes Yes Yes Yes Yes Yes FE exp + imp Yes Yes Yes Yes Yes Yes
Note: * p<0.10; ** p<0.05; *** p<0.01. The dependent variable is bilateral digital services exports (DSX) using the underlying gross trade data from the TiVA database. Sector groupings in each column can be found in Annex Table A2. Robust standard errors are clustered at the country-pair level. Fixed effects for exporter and importer are applied. Coefficient results for the control vectors of GRAV and C can be found in Annex Table A4.
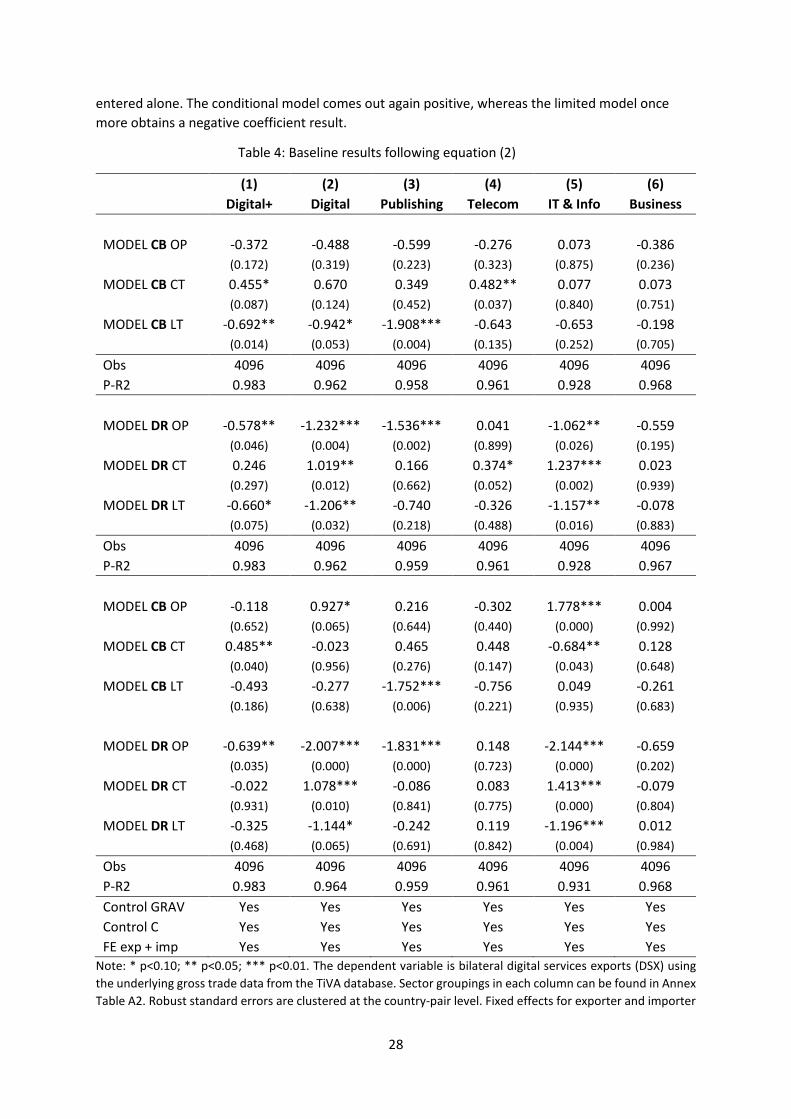
Table 4 shows the results when considering each of the three data models separately. In this case as well, the two components of CB and DR for each model are reported separately first, and then the two components are entered together. A first result in column 1 is that the conditional model is the only model for which a positive and significant coefficient result for Digital+ is found, when the CB component is entered separately; whereas the limited model comes out negative and significant. The results are similar when moving from column 1 till 4, albeit not always significant for the conditional model. Looking at the second panel, a strikingly consistent results is that the open model reports negative and significant results for most sector classifications when the DR component is
28
entered alone. The conditional model comes out again positive, whereas the limited model once more obtains a negative coefficient result.
Table 4: Baseline results following equation (2)
(1) (2) (3) (4) (5) (6) Digital+ Digital Publishing Telecom IT & Info Business
MODEL CB OP -0.372 -0.488 -0.599 -0.276 0.073 -0.386 (0.172) (0.319) (0.223) (0.323) (0.875) (0.236)
MODEL CB CT 0.455* 0.670 0.349 0.482** 0.077 0.073 (0.087) (0.124) (0.452) (0.037) (0.840) (0.751)
MODEL CB LT -0.692** -0.942* -1.908*** -0.643 -0.653 -0.198 (0.014) (0.053) (0.004) (0.135) (0.252) (0.705)
Obs 4096 4096 4096 4096 4096 4096 P-R2 0.983 0.962 0.958 0.961 0.928 0.968
MODEL DR OP -0.578** -1.232*** -1.536*** 0.041 -1.062** -0.559 (0.046) (0.004) (0.002) (0.899) (0.026) (0.195)
MODEL DR CT 0.246 1.019** 0.166 0.374* 1.237*** 0.023 (0.297) (0.012) (0.662) (0.052) (0.002) (0.939)
MODEL DR LT -0.660* -1.206** -0.740 -0.326 -1.157** -0.078 (0.075) (0.032) (0.218) (0.488) (0.016) (0.883)
Obs 4096 4096 4096 4096 4096 4096 P-R2 0.983 0.962 0.959 0.961 0.928 0.967
MODEL CB OP -0.118 0.927* 0.216 -0.302 1.778*** 0.004 (0.652) (0.065) (0.644) (0.440) (0.000) (0.992)
MODEL CB CT 0.485** -0.023 0.465 0.448 -0.684** 0.128 (0.040) (0.956) (0.276) (0.147) (0.043) (0.648)
MODEL CB LT -0.493 -0.277 -1.752*** -0.756 0.049 -0.261 (0.186) (0.638) (0.006) (0.221) (0.935) (0.683)
MODEL DR OP -0.639** -2.007*** -1.831*** 0.148 -2.144*** -0.659 (0.035) (0.000) (0.000) (0.723) (0.000) (0.202)
MODEL DR CT -0.022 1.078*** -0.086 0.083 1.413*** -0.079 (0.931) (0.010) (0.841) (0.775) (0.000) (0.804)
MODEL DR LT -0.325 -1.144* -0.242 0.119 -1.196*** 0.012 (0.468) (0.065) (0.691) (0.842) (0.004) (0.984)
Obs 4096 4096 4096 4096 4096 4096 P-R2 0.983 0.964 0.959 0.961 0.931 0.968 Control GRAV Yes Yes Yes Yes Yes Yes Control C Yes Yes Yes Yes Yes Yes FE exp + imp Yes Yes Yes Yes Yes Yes
Note: * p<0.10; ** p<0.05; *** p<0.01. The dependent variable is bilateral digital services exports (DSX) using the underlying gross trade data from the TiVA database. Sector groupings in each column can be found in Annex Table A2. Robust standard errors are clustered at the country-pair level. Fixed effects for exporter and importer

29
are applied. CB refers to the cross-border transfer of data, whereas DR refers to the domestic processing of data. Coefficient results for the control vectors of GRAV and C can be found in Annex Table A4.
When both components are entered together, results are corroborated. That is, the conditional model obtains a positive and significant result on both CB and DR, whereas the limited model acquires a negative coefficient results for both components. In addition, the open model also obtains a negative and significant coefficient results for the DR component in most digital services sectors. However, additional significant results are now obtained, too. First, in column 2 (Digital+) and column 4 (IT & Info), the open model now also obtains a positive and significant result for CB. In contrast, the conditional model now receives a negative coefficient results for the CB element in the IT & Information service sector only (column 4).
As such, one preliminary conclusion from Table 4 is that trading partners sharing the open model for cross-border data transfers exhibit greater levels of digital services trade compared to country-pairs that have not the same data model in place. This result is particularly strong for IT and information services. In addition, trading partners sharing a conditional model also appear to show greater levels of digital services trade, but this conclusion is sharply reversed for IT and information services. In this sector, country-pairs sharing the conditional model trade less services with each other. Further, trading partners sharing the limited model seem to have lower levels of digital services.
A second conclusion from Table 4 is that country-pairs sharing the open model for domestic data processing exhibit lower levels of digital services trade compared to country-pairs where data models are not the same. This result is particularly strong for the publishing sector and IT and information services. In contrast, trading partners sharing the conditional model show greater levels of digital services trade compared to country-pairs with dissimilar data models. Regarding the limited model, country-pairs sharing this model seems to be again associated with lower trade in digital services than countries sharing different models.
5.1 Adding Control Variables
A number of robustness checks are also conducted by adding several control variables, providing a panel dimension, and finally using the ITPD-E as an alternative source of trade data. For each subsequent table, results are reported when entering the two categories of CB and DR together.
Starting with the first robustness check, Table 5 shows the results when adding the data restrictiveness index as developed in Ferracane and van der Marel (2018) based on the ECIPE’s DTRI. This index measures level of data policy restrictiveness with respect to the cross-border transfers of data and the domestic processing of data of the partner country, namely the importer.24 The table shows that results remain largely unchanged. In all instances, variables stay significant, indicating that sharing the open model on cross-border data transfers tends to be positively associated with digital services trade, while sharing the open model for domestic processing of data tends to be negatively associated. This pattern reverses for country-pairs sharing the conditional model. The
24 Note that the interpretation for both components CB and DR of the Data Restrictiveness Index in Ferracane and van der Marel (2018) is different than the one developed in this paper. The main differences are that the index more generally aims to measures the extent to which data transfers and data processing create restrictions on trade, while this paper simply categorizes the countries under different data models to estimate whether sharing such models has any impact on digital services trade.

30
limited model for data transfers and processing shows a negative significant coefficient in many cases, indicating a negative association with digital services trade.
Table 5: Robustness check baseline equation (2) using Data Restrictiveness Index as control
(1) (2) (3) (4) (5) (6) Digital+ Digital Publishing Telecom IT & Info Business
MODEL CB OP -0.257 0.908* 0.092 -0.342 1.731*** -0.257
(0.345) (0.064) (0.833) (0.369) (0.000) (0.471) MODEL CB CT 0.399* -0.121 0.451 0.449 -0.775*** 0.060
(0.089) (0.765) (0.243) (0.113) (0.010) (0.811) MODEL CB LT -0.444 -0.213 -1.779*** -0.997** -0.157 -0.694
(0.147) (0.647) (0.000) (0.040) (0.664) (0.207)
MODEL DR OP -0.124 -1.602*** -0.950** 0.523 -1.627*** 0.374
(0.702) (0.001) (0.020) (0.246) (0.000) (0.361) MODEL DR CT -0.173 1.029** -0.269 -0.111 1.397*** -0.260
(0.513) (0.014) (0.430) (0.674) (0.000) (0.347) MODEL DR LT -0.218 -1.213*** -0.021 0.350 -1.380*** 0.283
(0.520) (0.009) (0.954) (0.392) (0.000) (0.479)
DTRI CB -1.969*** 0.342 2.962* -1.738* 0.406 -1.083
(0.006) (0.675) (0.088) (0.064) (0.679) (0.319) DTRI DR 1.003* -0.679 1.829 0.352 -2.031** -2.320***
(0.090) (0.318) (0.116) (0.656) (0.016) (0.009) WEF NRI 1.114*** 1.355*** 1.897*** 1.212*** 1.186*** 1.536***
(0.000) (0.000) (0.000) (0.000) (0.000) (0.000)
Control GRAV Yes Yes Yes Yes Yes Yes Control C Yes Yes Yes Yes Yes Yes FE exp + imp Yes Yes Yes Yes Yes Yes
Obs 3717 3717 3717 3717 3717 3717 P-R2 0.986 0.967 0.962 0.963 0.934 0.973
Note: * p<0.10; ** p<0.05; *** p<0.01. The dependent variable is bilateral digital services exports (DSX) using the underlying gross trade data from the TiVA database. Sector groupings in each column can be found in Annex Table A2. Robust standard errors are clustered at the country-pair level. Fixed effects for exporter and importer are applied. CB refers to the cross-border transfer of data, whereas DR refers to the domestic data processing. Both ECIPE CB and ECIPE DR variables are taken for the importer’s side and are interacted with intl as part of the C ∗ intl𝑜𝑜𝑜𝑜 term. Coefficient results for the control vectors of GRAV and C can be found in Annex Table A4.
Regarding the two control variables, they show an expected outcome, which however is not always significant and at times positive. The coefficient for the DTRI CB is negative and significant only for the Digital+ grouping and only weakly significant for Telecom. On the other hand, the coefficient for DTRI DR is negative and significant for IT and information services, but positive for Digital+. In

31
Ferracane and van der Marel (2018) the DR variable remained insignificant.25. Table 5 also adds a third control variable which is the World Economic Forum’s Network Readiness Indicator (NRI). This variable measures a country’s digital preparedness by looking at the propensity for countries to exploit the opportunities offered by information and communications technologies (ICT). It measures the exporting countries enabling environment for digital trade. As expected, the WEF variable comes out as positively significant in all columns.
Table 6: Robustness check baseline equation (2) using OECD Digital STRI as control
(1) (2) (3) (4) (5) (6) Digital+ Digital Publishing Telecom IT & Info Business
MODEL CB OP -0.038 1.173*** 0.127 -0.034 2.048*** 0.139 (0.885) (0.005) (0.793) (0.902) (0.000) (0.617)
MODEL CB CT 0.296 -0.339 0.401 0.079 -0.955*** -0.046 (0.239) (0.354) (0.334) (0.703) (0.001) (0.854)
MODEL CB LT -0.236 0.086 -1.792*** -0.166 -0.116 -0.401 (0.445) (0.838) (0.002) (0.602) (0.771) (0.529)
MODEL DR OP -0.404 -1.667*** -1.092** 0.152 -1.702*** -0.145 (0.188) (0.000) (0.010) (0.642) (0.000) (0.717)
MODEL DR CT -0.131 1.078*** -0.258 -0.024 1.482*** -0.260 (0.624) (0.002) (0.505) (0.911) (0.000) (0.359)
MODEL DR LT -0.344 -1.422*** -0.039 -0.114 -1.434*** 0.147 (0.306) (0.001) (0.920) (0.734) (0.000) (0.740)
OECD DSTRI -2.259** 2.465* -0.106 3.562*** 3.475* 1.783 (0.036) (0.070) (0.962) (0.009) (0.062) (0.356)
WEF NRI 1.045*** 1.607*** 1.819*** 1.203*** 1.591*** 1.763*** (0.000) (0.000) (0.000) (0.000) (0.000) (0.000)
Control GRAV Yes Yes Yes Yes Yes Yes Control C Yes Yes Yes Yes Yes Yes FE exp + imp Yes Yes Yes Yes Yes Yes
Obs 2898 2898 2898 2898 2898 2898 P-R2 0.988 0.969 0.963 0.967 0.937 0.976
Note: * p<0.10; ** p<0.05; *** p<0.01. The dependent variable is bilateral digital services exports (DSX) using the underlying gross trade data from the TiVA database. Sector groupings in each column can be found in Annex Table A2. Robust standard errors are clustered at the country-pair level. Fixed effects for exporter and importer are applied. CB refers to the cross-border transfers of data, whereas DR refers to the domestic data processing. Digital STRI denotes the OECD’s Digital Services Trade Restrictiveness Index for which is the grouping of Infrastructure and Connectivity is used. The OECD Digital STRI variable is taken for the importer’s side and is
25 Note however that in Ferracane and van der Marel (2018) the authors use a different identification strategy that is not based on the gravity model and uses imports as opposed to exports, as this paper does.

32
interacted with intl as part of the C ∗ intl𝑜𝑜𝑜𝑜 term. Coefficient results for the control vectors of GRAV and C can be found in Annex Table A4.
A similar conclusion is reached in Table 6 when adding the OECD Digital STRI as a control variable instead of the DTRI. This indicator considers the sub-index that includes restrictions related to Infrastructure and connectivity. This area of the Digital STRI covers restrictions on cross-border data flows, as presented in Ferencz (2019), amongst various others. Note that this index does not cover any measures related to domestic data processing. In this case too, the results of the variables of interest remain unchanged. One notable change however is that the positive significance of the coefficient of the open model for the cross-border flows of data in column 2 is reinforced, as it is also the case of the negative significance of the limited model regarding the domestic processing of data, also in column 2. The outcome on the OECD Digital STRI variable has varying coefficient signs, which is probably due to the fact that it measures exports (see footnote 24).
5.2 Performing Panel Series
Thus far this paper has dealt with a cross-section analysis. Even though informative, a one-year assessment doesn’t allow for any inferences over time, nor does it say anything about a causal relationship between the data models that countries opt for and trade in digital services. For instance, countries change their regulatory regime for data over time, which likely has an influence on trade patterns between them. Among the 116 countries analysed, a substantial number has changed their regulatory framework across the two components of cross-border data transfers and domestic data processing. Given that the default option is the open model, Table A4 shows the list of switching countries that since 2000 have changed their governing framework to either the conditional model or the limited model.
Although it’s hard to resolve any endogeneity concern that may arise due to the fact that countries with stronger bilateral trade ties may therefore choose a certain data model, a panel data series would be a first step in solving a potential bias due to reverse causality. In doing so, equation (3) replicates the baseline equation from the previous section to which now a time dimension is added:
𝐷𝐷𝐷𝐷𝐷𝐷𝑜𝑜𝑜𝑜𝑜𝑜 = exp [𝜃𝜃1GRAV𝑜𝑜𝑜𝑜 + 𝜃𝜃2OP 𝑜𝑜𝑜𝑜𝑜𝑜 + 𝜃𝜃3CT𝑜𝑜𝑜𝑜𝑜𝑜 + 𝜃𝜃4LT𝑜𝑜𝑜𝑜𝑜𝑜 + 𝜃𝜃5C ∗ intl𝑜𝑜𝑜𝑜𝑜𝑜 + 𝛿𝛿𝑜𝑜𝑜𝑜+ 𝛾𝛾𝑜𝑜𝑜𝑜] ∗ 𝜀𝜀𝑜𝑜𝑜𝑜𝑜𝑜 (3)
In equation (3), all variables stay the same for 𝐷𝐷𝐷𝐷𝐷𝐷𝑜𝑜𝑜𝑜𝑜𝑜 and the two vectors of GRAV𝑜𝑜𝑜𝑜𝑜𝑜 and C ∗ intl𝑜𝑜𝑜𝑜𝑜𝑜 but now vary over time, as all the dummy variables as part of the vectors denoting the three models (i.e. OP 𝑜𝑜𝑜𝑜𝑜𝑜, CT𝑜𝑜𝑜𝑜𝑜𝑜 and LT𝑜𝑜𝑜𝑜𝑜𝑜). Note that the equation applies exporter-year and importer year fixed effects, denoted by 𝛿𝛿𝑜𝑜𝑜𝑜 and 𝛾𝛾𝑜𝑜𝑜𝑜. Finally, 𝜀𝜀𝑜𝑜𝑜𝑜𝑜𝑜 is the residual term. Dyadic fixed effects are not applied in the panel setting as that appears to be too demanding for the available dataset. As previously said, note that not all countries explicitly state when their regulations are implemented, and if a country does not explicitly allow for a framework at all, the default option of the open data model has been assigned to the country. The time period for regressions is 2005-2015 given that TiVA does not provide any trade data before nor after this time span.
Before turning to the results, some basic regressions are first performed without the three data models due to reasons for measuring the trade impact by their proper coefficient sizes, as explained

33
before. The results for GRAV𝑜𝑜𝑜𝑜𝑜𝑜 and C ∗ intl𝑜𝑜𝑜𝑜𝑜𝑜 are reported in Annex Table A6. The panel results following equation (3) are reported in Table 7. In there it also includes two sets of control variables: ECIPE’s data restrictiveness index, which again is split up between the CB and DR component; as well as the WEF’s Network Readiness Index. Both variables vary over time.
The table shows that the coefficient results are largely consistent with the ones found in Table 5 for the cross-section analysis. Yet, the significance for some coefficient outcomes is weaker, such under the conditional model for the CB component in column 5 (although still negative) and for the DR component in column 2, now coming out as insignificant. That said, the conditional model for the Digital+ sector for the CB component (column 1) is much stronger, as well as the negative coefficient outcome for the limited model which now is significant at the 5 percent level.
Table 7: Panel results following equation (3) using Data Restrictiveness Index as control
(1) (2) (3) (4) (5) (6) Digital+ Digital Publishing Telecom IT & Info Business
MODEL CB OP -0.307 0.524 -0.064 -0.223 1.369*** 0.117
(0.122) (0.234) (0.857) (0.510) (0.001) (0.752) MODEL CB CT 0.765*** 0.065 0.470 0.633** -0.550* 0.395
(0.000) (0.871) (0.162) (0.038) (0.097) (0.152) MODEL CB LT -0.695** -0.495 -2.360*** -0.650 -0.060 -0.703
(0.017) (0.296) (0.000) (0.147) (0.899) (0.273)
MODEL DR OP -0.064 -0.996*** -0.665** 0.165 -1.194*** -0.310
(0.738) (0.001) (0.050) (0.581) (0.000) (0.347) MODEL DR CT -0.194 0.713 -0.276 -0.220 1.174*** -0.062
(0.344) (0.124) (0.384) (0.436) (0.002) (0.825) MODEL DR LT 0.027 -0.861* 0.012 0.728* -1.099*** 0.502
(0.925) (0.083) (0.979) (0.080) (0.002) (0.193)
DTRI CB -1.596*** 0.745 0.576 0.212 1.809** -1.304
(0.001) (0.248) (0.499) (0.741) (0.037) (0.147) DTRI DR 1.066** 0.414 3.691*** -0.607 -1.278* 0.039
(0.011) (0.470) (0.000) (0.361) (0.070) (0.955) WEF NRI 0.868*** 1.050*** 1.074*** 0.749*** 0.941*** 1.201***
(0.000) (0.000) (0.000) (0.000) (0.000) (0.000)
Control GRAV Yes Yes Yes Yes Yes Yes Control C Yes Yes Yes Yes Yes Yes FE exp-yr + imp-yr Yes Yes Yes Yes Yes Yes
Obs 33748 33748 33748 33748 33748 33748 P-R2 0.985 0.967 0.958 0.961 0.938 0.972
Note: * p<0.10; ** p<0.05; *** p<0.01. The dependent variable is bilateral digital services exports (DSX) using the underlying gross trade data from the TiVA database. Sector groupings in each column can be found in Annex

34
Table A2. Robust standard errors are clustered at the country-pair level. Fixed effects for exporter-year and importer-year are applied. CB refers to the cross-border transfer of data, whereas DR refers to the domestic data processing. Both ECIPE CB and ECIPE DR variables are taken for the importer’s side and are interacted with intl as part of the C ∗ intl𝑜𝑜𝑜𝑜 term. The WEF NRI variable is taken for the exporter’s side and interacted with intl. Coefficient results for the control vectors of GRAV and C can be found in Annex Table A6.
The regressions were also replicated by including the OECD Digital STRI instead. However, one major difficulty with this index is the relatively limited number of years. The OECD Digital STRI start in 2014 and given that the trade data ends in 2015, it would only allow to analyse two years. Nonetheless, the analysis only discusses the results without reporting them. The results show that all coefficient outcomes stay in line with the ones reported in Table 6, which therefore doesn’t alter the main conclusion of the cross-section analysis.
5.3 Using Alternative Data Source
A final robustness check using the trade in services data from the ITPD-E is performed. This data source has recently been developed (see Borchert et al., 2020) and covers a large set of developing countries. Given that the sample of data models does not include many developing countries, using this source is interesting to check whether results are consistent. However, one disadvantage with this database is that it is not balanced, and many observations are missing for services, particularly for the sectors of interest. The data reported is administrative data which in the case of TiVA may not always be the case. It also includes internal trade, which is convenient for the gravity model. Another downside however is that this database groups all digital services sectors together, as shown in Annex Table A3. The years covered for the panel analysis is 2005-2016.
The results using the ITPD-E data with respect to the baseline regression following equation (3) are presented in Table 8, which means that it covers a panel data set and includes the two sets of control variables of the data restrictiveness index and digital enabling environment. As such, this table is readily comparable with Table 7, the more so because the sectoral grouping for Digital+ and business services are carefully cleaned and matched between the two data sources. The results are reported in Table 8. The results for GRAV𝑜𝑜𝑜𝑜𝑜𝑜 and C ∗ intl𝑜𝑜𝑜𝑜𝑜𝑜 are reported in Annex Table A6.
In Table 8, the total number of observations is lower than using TiVA data which is due to missing observations. The list of countries in this dataset is also different and not balanced compared to the TiVA data. The results reported in columns 1-3 are without any control variables included. A first finding is that none of the variables for the CB component have a significant coefficient outcome. That stands in contrast to some of the significant findings in the bottom panel of Table 4, to which these results need to be compared. When looking at the DR component, the results are largely in line with Table 4, except for the insignificance for the conditional model in column 2, even though the sign remains positive. The difference in results may be due to the fact that even though the sector groupings are matched as closely as possible, some sub-sectoral differences remain or cannot be captured adequately between the two data sources.
Column 4-6 repeat the baseline regressions and adds the two sets of control variables. Note that in case of adding the OECD DSTRI instead of the ECIPE DTRI, the results would omit a large number of developing countries.26 The result that now stand out is the negative coefficient results for the
26 Interestingly, the panel results when using the OECD DSTRI would be in line with the results found in Table 6, particularly with respect to the Digital sector (column 2). However, the years covered by the OECD DSTRI index

35
limited model for the CB component in columns 4 and 6, which is also the case for the DR component for the digital sector in column 5.
Table 8: Panel results following equation (3) using ITPD-E data
(1) (2) (3) (4) (5) (6) Digital+ Digital Business Digital+ Digital Business
MODEL CB OP -0.020 0.325 0.048 -0.083 0.176 -0.167
(0.971) (0.604) (0.940) (0.853) (0.776) (0.730) MODEL CB CT 0.476 0.009 0.235 0.304 0.026 0.187
(0.329) (0.986) (0.643) (0.413) (0.959) (0.625) MODEL CB LT -0.973 0.311 -1.026 -1.235*** -0.435 -1.651***
(0.169) (0.686) (0.165) (0.009) (0.498) (0.000)
MODEL DR OP -0.945** -1.066** -0.928* -0.437 -0.277 -0.100
(0.043) (0.020) (0.075) (0.225) (0.577) (0.798) MODEL DR CT -0.058 0.592 -0.261 -0.177 0.406 -0.567
(0.901) (0.239) (0.559) (0.621) (0.440) (0.102) MODEL DR LT -0.026 -1.773*** -0.294 0.255 -1.278* 0.158
(0.962) (0.008) (0.482) (0.560) (0.060) (0.644)
DTRI CB -1.327* 0.578 -0.845
(0.067) (0.501) (0.333) DTRI DR 0.408 0.828 0.480
(0.485) (0.235) (0.475) WEF NRI 1.126*** 1.203*** 1.399***
(0.000) (0.000) (0.000)
Control GRAV Yes Yes Yes Yes Yes Yes Control C Yes Yes Yes Yes Yes Yes FE exp-yr + imp-yr Yes Yes Yes Yes Yes Yes
Obs 43846 35297 37823 32354 26760 28484 P-R2 0.994 0.994 0.990 0.995 0.995 0.992
Note: * p<0.10; ** p<0.05; *** p<0.01. The dependent variable is bilateral digital services exports (DSX) using the underlying gross trade data from the ITPD-E database. Sector groupings in each column can be found in Annex Table A3. Robust standard errors are clustered at the country-pair level. Fixed effects for exporter-year and importer-year are applied. CB refers to the cross-border transfer of data, whereas DR refers to the domestic data processing. The variables ECIPE CB and ECIPE DR are taken for the importer’s side and are interacted with intl as part of the C ∗ intl𝑜𝑜𝑜𝑜 term. The WEF NRI variable is taken for the exporter’s side and interacted with intl. Coefficient results for the control vectors of GRAV and C can be found in Annex Table A7.
would be again reduced to only a couple of years, namely 2014-2016, and therefore these results are omitted. However, results can be obtained upon request.

36
6. Conclusion
While the regulation of personal data diverges widely between countries, it is nonetheless possible to identify three main models on the basis of their distinctive features: one model based on limited transfers and processing of data, one model based on conditional transfers and processing, and finally one model based on open transfers and processing of data. These three data models have become a reference for many other countries when defining their rules on both the cross-border transfer and the domestic processing of personal data. In this paper, a gravity model of bilateral trade is used to assess whether trading partners sharing the same data model show positive or negative correlations with digital services trade.
Two main sets of conclusions arise from this analysis. Regarding cross-border transfers of data, on the one hand the study finds that trading partners sharing the open model for cross-border transfers of data exhibit higher levels of digital services trade compared to country-pairs with different data models. In large part, this result seems to be driven by the IT and information services sector. On the other hand, trading partners sharing the conditional model on cross-border data transfers show less IT and information services trade with each other, but not for all sectors: for digital and business services more generally the results are positive and significant. Thus, the model based on conditional transfers and processing shows mixed trade correlations. Country pairs applying the limited model, instead, show negative trade correlations for several digital services sectors.
A second set of conclusions relates to the domestic processing of data: on the one hand, country-pairs sharing the open model for domestic processing of data exhibit lower levels of digital services trade, again benchmarked to country-pairs sharing different data models. This result is particularly strong for the IT and information services sector. On the other hand, trading partners with the conditional model for the domestic data processing appear to show greater levels of digital services trade with each other, notably again in IT and information services. Country pairs following the limited model for the domestic processing of data exhibit a negative trade correlation for digital services.
In sum, the results show that trading partners sharing the open data regulatory framework, and partially also the conditional model for cross-border data flows, as well as trading partner sharing the conditional model for domestic data processing, exhibit positive trade correlations in digital services. It therefore seems that those provisions which aim to create “trust” by imposing stricter rules on domestic processing of personal data are conducive to digital services trade, combined with an open regime for cross-border transfers of data. The result arising from country-pairs sharing the conditional model applied on cross-border data transfers is mixed, however: it shows strong negative and significant ant correlation in IT and information services, but not for other business services.
One should bear in mind that the results are sheer associations as they do not say anything yet about causalities. The analysis tried to confront any endogeneity concerns by including a battery of control variables, and develop a panel series, but admittedly this is not enough. For instance, because the main players behind each of the models are large trading partners for many countries and are actively involved in conveying their model of regulating data flows and data processing, it seems reasonable to evaluate the probability of countries choosing for one model over another on the basis of their trade relationship countries have with these big players. There may also be any indirect link with a third trading partner trading with these players. The study could therefore benefit from further refinements, but these questions are left for future research.

37

38
References
Aaronson, S. and P. Leblong (2018) “Another Digital Divide: The Rise of Data Realms and its Implications for the WTO”, Journal of International Economic Law, Vol. 21, Issue 2, pages 245-272.
Anderson, J, I. Borchert, A. Mattoo and Y. Yotov (2018) "Dark Costs, Missing Data: Shedding Some Light on Services Trade", European Economic Review, Vol. 105(C), pages 193-214.
Anderson, J, M. Larch and Y. Yotov (2015) “Growth and Trade with Frictions: A Structural Estimation Framework”, NBER Working Paper No. 21377, NBER, Cambridge MA.
Azmeh, S., C. Foster and J. Echavarri (2019) “The International Trade Regime and the Quest for Free Digital Trade”, International Studies Review, Vol. 22, Issue 1, pages 1-22.
Borchert, I., B. Gootiiz, J. Magdeleine, J. Marchetti, A. Mattoo, E. Rubio and E. Shannon (2019) “Applied Services Trade Policy: A Guide to the Services Trade Policy Database and Services Trade Restrictions Index”, WTO Staff Working Paper (ERSD-2019-14), World Trade Organization.
Dai, M., Y. Yotov and T. Zylkin, T. (2014) “On the Trade-Diversion Effects of Free Trade Agreements”, Economic Letters, Vol. 122, No. 2, pages 321-325.
Daza Jaller, L., S. Gaillard and M. Molinuevo, Martín (2020) “The Regulation of Digital Trade : Key Policies and International Trends”, Washington, DC: World Bank Group.
Fally, T. (2015) “Structural Gravity and Fixed Effects”, Journal of International Economics, Vol. 97, No. 1, pages 76-85.
Ferencz, J. (2019) “The OECD Digital Services Trade Restrictiveness Index”, OECD Trade Policy Papers, No. 221, OECD Publishing, Paris.
Ferracane, M. H. Lee-Makiyama and E. van der Marel (2018) “Digital Trade Restrictiveness Index”, European Centre for International Political Economy (ECIPE), Brussels.
Ferracane, M., J. Kren and E. van der Marel (2020) “Do Data Policy Restrictions Impact the Productivity Performance of Firms and Industries?”, Review of International Economics, Vol. 28, No. 3, pages 676-722.
Ferracane, M.F. and E. van der Marel (2018) “Do Data Flows Restrictions Inhibit Trade in Services?”, ECIPE DTE Working Paper Series No. 2, Brussels: ECIPE.
Ferracane, M.F. and H. Lee-Makiyama (2017) “China’s Technology Protectionism and Its Non-Negotiable Rationales”, ECIPE Discussion Paper, Brussels: ECIPE.
Gao, H. S. (2019) “Data Regulation with Chinese Characteristics”, SMU Centre for AI & Data Governance Research Paper No. 2019/04; Singapore Management University School of Law Research Paper No. 28/2019.
Gao, H. S., (2018) “Digital or Trade? The Contrasting Approaches of China and US to Digital Trade”, Journal of International Economic Law, Vol. 21, Issue 2, pages 297-321.
Head, K. and T. Mayer (2014) “Chapter 3 - Gravity Equations: Workhorse, Toolkit, and Cookbook”, in G. Gopinath, E. Helpman and K. Rogoff (eds) “Handbook of International Economics”, Volume 4, pages 131-195, Oxford: Elsevier.

39
Heid, B., M. Larch and Y. Yotov (2015) “A Simple Method to Estimate the Effects of Non-Discriminatory Trade Policy Within Structural Gravity Models”, unpublished, retrieved from http://www.etsg.org/ETSG2015/Papers/439.pdf
Hodson, S. (2019) “Applying WTO and FTA Disciplines to Data Localization Measures”, World Trade Review, Vol. 18, No. 4, pages 579-607.
La Porta, R, F Lopez-de-Silanes, and A Shleifer (2008) “The Economic Consequences of Legal Origins”, Journal of Economic Literature, 46(2): 285-332.
Lendle, A., M. Olarreaga, S. Schropp, and P-L Vézina (2016) “There Goes Gravity: eBay and the Death of Distance”, The Economic Journal, Vol. 126, Issue 591, pages 406-441.
López González, J. and M. Jouanjean (2017), “Digital Trade: Developing a Framework for Analysis”, OECD Trade Policy Papers, No. 205, OECD Publishing, Paris.
Mattoo, A. and J. Meltzer (2018) “International Data Flows and Privacy: The Conflict and Its Resolution”, Journal of International Economic Law, Vol. 21, Issue 4, pages 769-789.
Meltzer, J. (2019) “Governing Digital Trade”, World Trade Review, Vol. 18, Special Issue1, S23-S48.
Molinuevo, M. and S. Sáez (2014) “Regulatory Assessment Toolkit: A Practical Methodology for Assessing, Regulation on Trade and Investment in Services: Washington DC: The World Bank.
Office of Management and Budget, OMB Memorandum M-17-12, Preparing for and Responding to a Breach of Personally Identifiable Information, January 2017. This definition is based on OMB Circular No. A-130, Managing Information as a Strategic Resource, July 28, 2016.
Rubinstein, I., G. Nojeim and R. Lee (2014) “Systematic Government Access to Personal Data: A Comparative Analysis”, International Data Privacy Law, Vol. 4, No. 2, pages 96–119.
Santos Silva, J. and S. Tenreyro (2006) “The Log of Gravity”, The Review of Economics and Statistics, Vol. 88, No. 4, pages 641-658.
Sen, N. (2018) “Understanding the Role of the WTO in International Data Flows: Taking the Liberalization or the Regulatory Autonomy Path?”, Journal of International Economic Law, Vol. 21, Issue 2, pages 323-348.
UNCTAD (2019) “Digital Economy Report 2019 - Value Creation and Capture: Implications for Developing Countries”, UNCTAD, Geneva.
Wang, Z. (2012) “Systematic Government Access to Private-Sector Data in China”, International Data Privacy Law 220, Vol. 2, No. 4, pages 220-229.
WTO (2018) “World Trade Report 2018: The Future of World Trade: How Digital Technologies are Transforming Global Commerce”, World Trade Organization, Geneva.
Yotov, Y. (2012) “A Simple Solution to the Distance Puzzle in International Trade”, Economics Letters, Vol. 117, No. 3, pages 794-798.
Yotov, Y, R. Piermartini, J-A. Monteiro and M. Larch (2016) ”An Advanced Guide to Trade Policy Analysis: The Structural Gravity Model”, Geneva: UNCTAD and WTO.

40
Annex
Table A1: Countries categorized by their data model (2019)
Open Transfers and Processing Model
Conditional Transfers and Processing Model
Limited Transfers and Processing Model
Cross-border data transfers AFG, ARE, AUS, BGD, BOL, CAN, CMR, COD, EGY, ETH, GHA, GMB, HKG, HND, HTI, IRN, IRQ, JOR, KHM, LAO, LBN, LBR, LKA, MEX, MMR, MWI, NPL, NZL, OMN, PAK, PHL, PNG, QAT, RWA, SAU, SLE, TWN, TZA, USA
AGO, ARG, ARM, AUT, BEL, BEN, BFA, BGR, BRA, CHE, CHL, COL, CRI, CYP, CZE, DEU, DNK, DOM, ESP, EST, FIN, FRA, GAB, GBR, GEO, GRC, HRV, HUN, IND, IRL, ISL, ISR, ITA, JPN, KGZ, KOR, LTU, LUX, LVA, MAR, MDA, MDG, MLI, MLT, MUS, MYS, NIC, NLD, NOR, PER, POL, PRT, ROU, SEN, SGP, SVK, SVN, SWE, TGO, THA, TJK, TUR, UGA, UKR, URY, ZAF
BRN, CHN, CIV, IDN, KAZ, KEN, NGA, RUS, TUN, UZB, VNM
39 countries; 34 percent 66 countries; 57 percent 11 countries; 9 percent Domestic data processing AFG, ARE, BOL, BRN, CMR, COD, ETH, GMB, HND, HTI, IRN, IRQ, JOR, KGZ, KHM, LAO, LBN, LBR, LKA, MMR, MWI, NPL, OMN, PAK, PNG, RWA, SAU, SLE, USA
AGO, ARG, ARM, AUS, AUT, BEL, BEN, BFA, BGR, BRA, CAN, CHE, CHL, CIV, COL, CYP, CZE, DEU, DNK, DOM, ESP, EST, FIN, FRA, GAB, GBR, GEO, GHA, GRC, HKG, HRV, HUN, IRL, ISL, ISR, ITA, JPN, KAZ, KOR, LTU, LUX, LVA, MAR, MDA, MDG, MEX, MLI, MLT, MUS, MYS, NGA, NIC, NLD, NOR, NZL, PER, PHL, POL, PRT, QAT, ROU, SEN, SVK, SVN, SWE, TGO, THA, TJK, TUN, TWN, UGA, UKR, URY, UZB, ZAF
BGD, CHN, CRI, EGY, IDN, IND, KEN, RUS, SGP, TUR, TZA, VNM
29 countries; 25 percent 75 countries; 65 percent 12 countries; 10 percent Note: for each country the ISO 3-digit country codes is used.

41
Table A2: Selected digital sectors and groupings, including ISIC Rev. 4 codes
Sector ISIC Rev. 4
Digital + Distribution 45-47 Transport 49-53 Accommodation 55-56 Publishing, audio-visual and broadcasting 58-60 Telecommunications 61 IT and information 62-63 Other business services 69-82 Finance and insurance 64-66
Digital Publishing, audio-visual and broadcasting 58-60 Telecommunications 61 IT and information 62-63
Publishing Publishing, audio-visual and broadcasting 58-60
Telecom Telecommunications 61
IT & info IT and information 62-63
Business Other business services 69-82
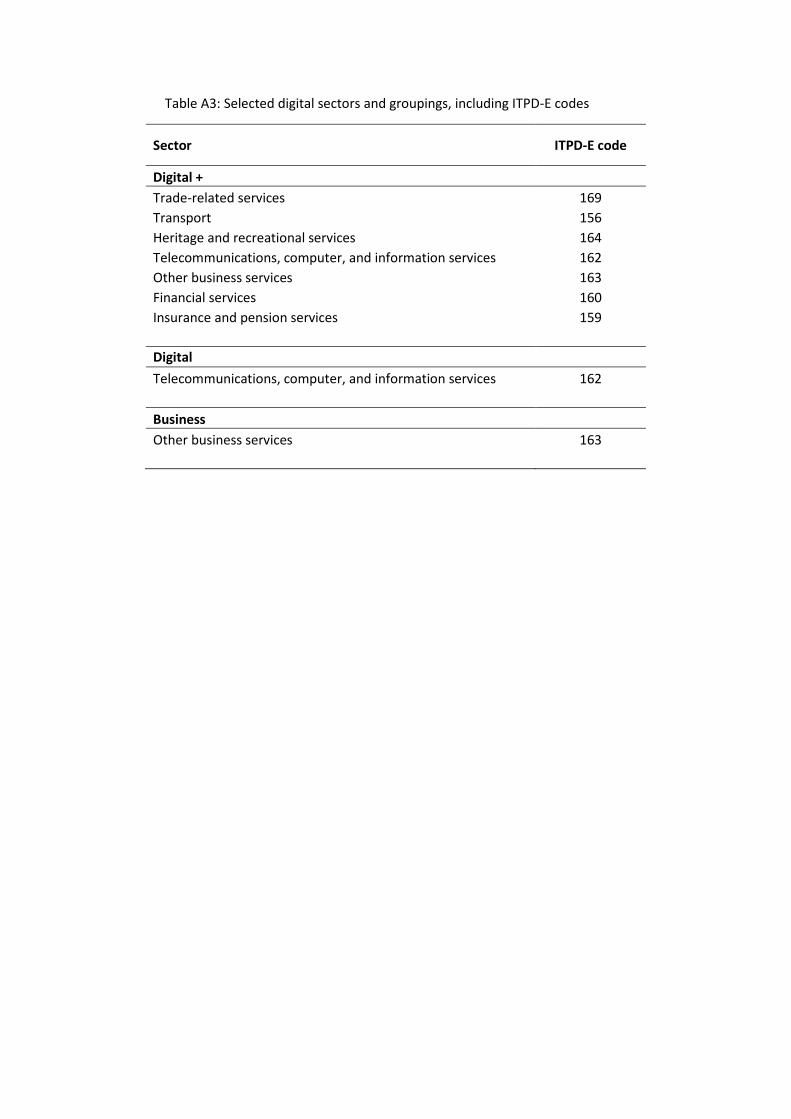
Table A3: Selected digital sectors and groupings, including ITPD-E codes
Sector ITPD-E code
Digital + Trade-related services 169 Transport 156 Heritage and recreational services 164 Telecommunications, computer, and information services 162 Other business services 163 Financial services 160 Insurance and pension services 159
Digital Telecommunications, computer, and information services 162
Business Other business services 163

Figure A1: Share of digital services trade between country-pairs sharing the same data model using ITPD-E (2015)
Source: Authors’ calculations using ITPD-E trade data. Note: Digital services trade covers ISIC Rev. 4 codes 45-82.
41.1%
58.9%
Trade between country-pairs sharing the same data modelTrade between country-pairs not sharing the same data model
Cross-border data transfers rules
44.5%
55.5%
Trade between country-pairs sharing the same data modelTrade between country-pairs not sharing the same data model
Domestic processing of data rules
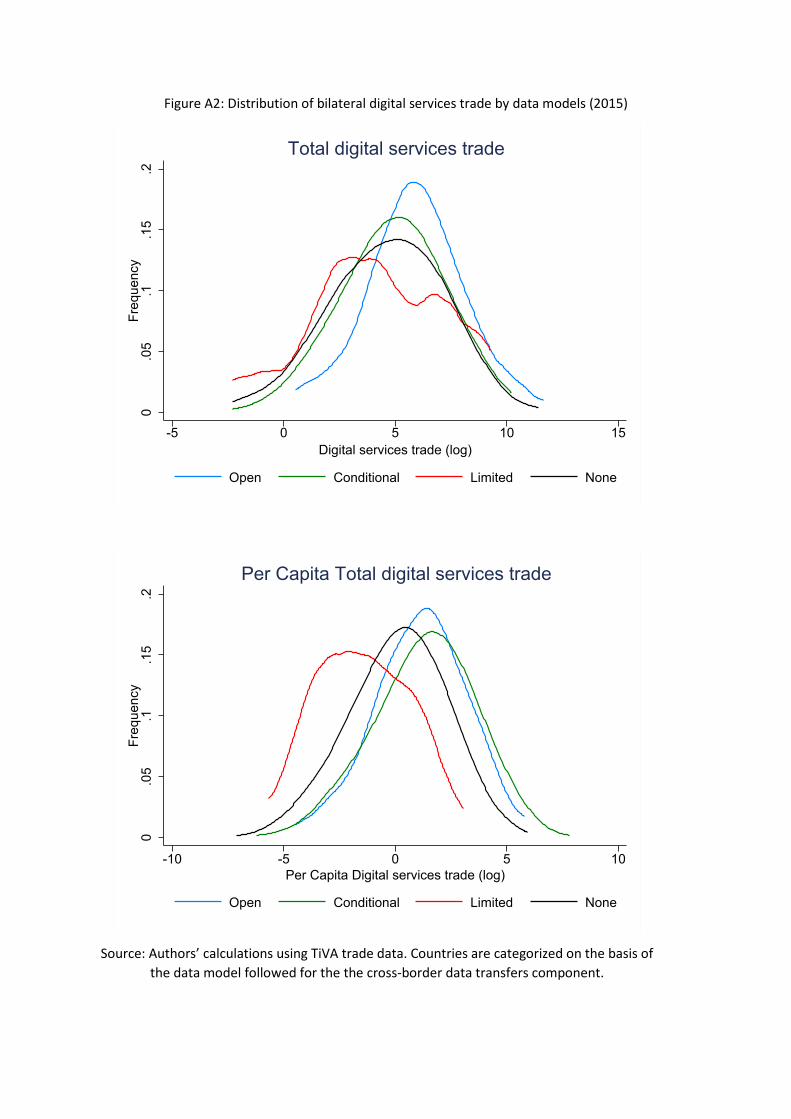
Figure A2: Distribution of bilateral digital services trade by data models (2015)
Source: Authors’ calculations using TiVA trade data. Countries are categorized on the basis of the data model followed for the the cross-border data transfers component.
0.0
5.1
.15
.2Fr
eque
ncy
-5 0 5 10 15Digital services trade (log)
Open Conditional Limited None
Total digital services trade0
.05
.1.1
5.2
Freq
uenc
y
-10 -5 0 5 10Per Capita Digital services trade (log)
Open Conditional Limited None
Per Capita Total digital services trade
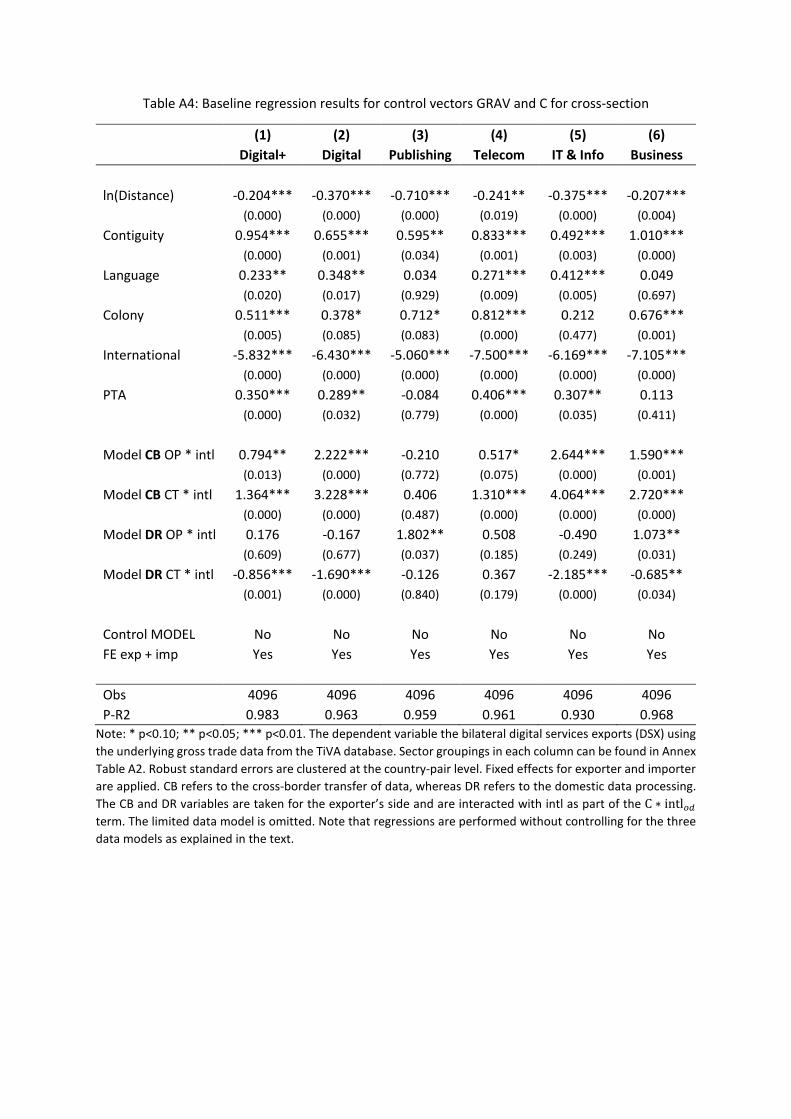
Table A4: Baseline regression results for control vectors GRAV and C for cross-section
(1) (2) (3) (4) (5) (6) Digital+ Digital Publishing Telecom IT & Info Business
ln(Distance) -0.204*** -0.370*** -0.710*** -0.241** -0.375*** -0.207*** (0.000) (0.000) (0.000) (0.019) (0.000) (0.004)
Contiguity 0.954*** 0.655*** 0.595** 0.833*** 0.492*** 1.010*** (0.000) (0.001) (0.034) (0.001) (0.003) (0.000)
Language 0.233** 0.348** 0.034 0.271*** 0.412*** 0.049 (0.020) (0.017) (0.929) (0.009) (0.005) (0.697)
Colony 0.511*** 0.378* 0.712* 0.812*** 0.212 0.676*** (0.005) (0.085) (0.083) (0.000) (0.477) (0.001)
International -5.832*** -6.430*** -5.060*** -7.500*** -6.169*** -7.105*** (0.000) (0.000) (0.000) (0.000) (0.000) (0.000)
PTA 0.350*** 0.289** -0.084 0.406*** 0.307** 0.113 (0.000) (0.032) (0.779) (0.000) (0.035) (0.411)
Model CB OP * intl 0.794** 2.222*** -0.210 0.517* 2.644*** 1.590*** (0.013) (0.000) (0.772) (0.075) (0.000) (0.001)
Model CB CT * intl 1.364*** 3.228*** 0.406 1.310*** 4.064*** 2.720*** (0.000) (0.000) (0.487) (0.000) (0.000) (0.000)
Model DR OP * intl 0.176 -0.167 1.802** 0.508 -0.490 1.073** (0.609) (0.677) (0.037) (0.185) (0.249) (0.031)
Model DR CT * intl -0.856*** -1.690*** -0.126 0.367 -2.185*** -0.685** (0.001) (0.000) (0.840) (0.179) (0.000) (0.034)
Control MODEL No No No No No No FE exp + imp Yes Yes Yes Yes Yes Yes
Obs 4096 4096 4096 4096 4096 4096 P-R2 0.983 0.963 0.959 0.961 0.930 0.968
Note: * p<0.10; ** p<0.05; *** p<0.01. The dependent variable the bilateral digital services exports (DSX) using the underlying gross trade data from the TiVA database. Sector groupings in each column can be found in Annex Table A2. Robust standard errors are clustered at the country-pair level. Fixed effects for exporter and importer are applied. CB refers to the cross-border transfer of data, whereas DR refers to the domestic data processing. The CB and DR variables are taken for the exporter’s side and are interacted with intl as part of the C ∗ intl𝑜𝑜𝑜𝑜 term. The limited data model is omitted. Note that regressions are performed without controlling for the three data models as explained in the text.
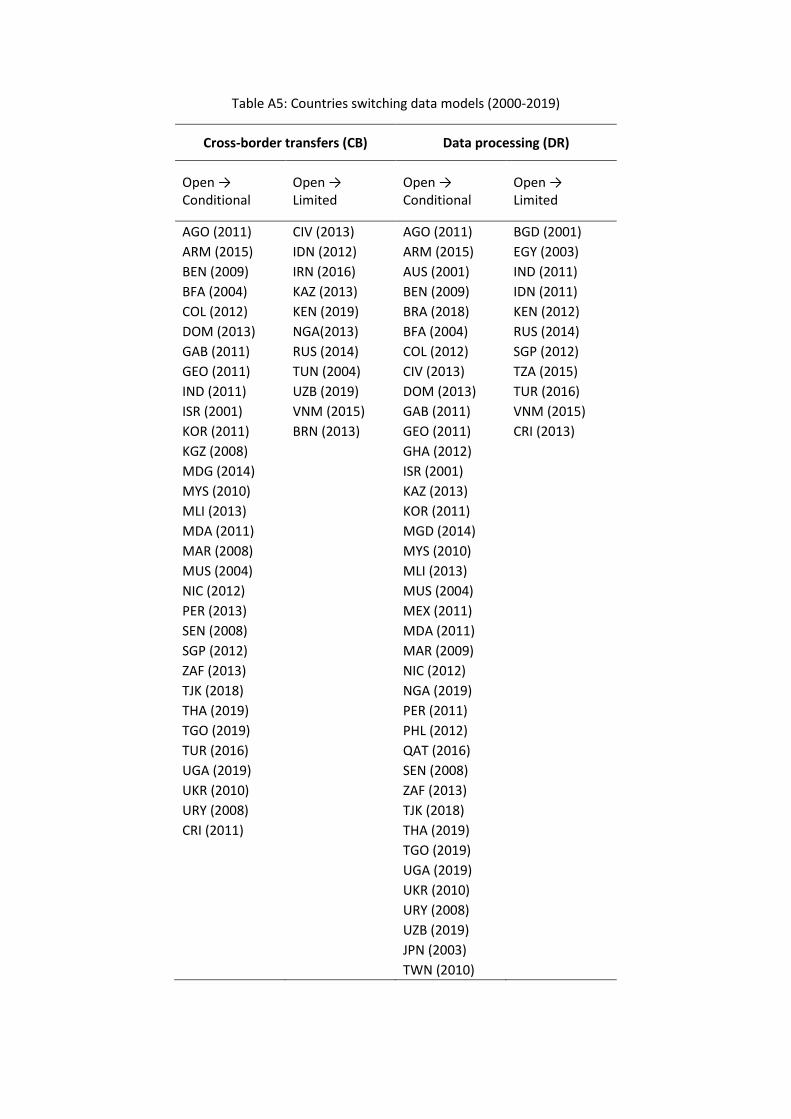
Table A5: Countries switching data models (2000-2019)
Cross-border transfers (CB) Data processing (DR)
Open → Conditional
Open → Limited
Open → Conditional
Open → Limited
AGO (2011) CIV (2013) AGO (2011) BGD (2001) ARM (2015) IDN (2012) ARM (2015) EGY (2003) BEN (2009) IRN (2016) AUS (2001) IND (2011) BFA (2004) KAZ (2013) BEN (2009) IDN (2011) COL (2012) KEN (2019) BRA (2018) KEN (2012) DOM (2013) NGA(2013) BFA (2004) RUS (2014) GAB (2011) RUS (2014) COL (2012) SGP (2012) GEO (2011) TUN (2004) CIV (2013) TZA (2015) IND (2011) UZB (2019) DOM (2013) TUR (2016) ISR (2001) VNM (2015) GAB (2011) VNM (2015) KOR (2011) BRN (2013) GEO (2011) CRI (2013) KGZ (2008) GHA (2012)
MDG (2014) ISR (2001)
MYS (2010) KAZ (2013)
MLI (2013) KOR (2011)
MDA (2011) MGD (2014)
MAR (2008) MYS (2010)
MUS (2004) MLI (2013)
NIC (2012) MUS (2004)
PER (2013) MEX (2011)
SEN (2008) MDA (2011)
SGP (2012) MAR (2009)
ZAF (2013) NIC (2012)
TJK (2018) NGA (2019)
THA (2019) PER (2011)
TGO (2019) PHL (2012)
TUR (2016) QAT (2016)
UGA (2019) SEN (2008)
UKR (2010) ZAF (2013)
URY (2008) TJK (2018)
CRI (2011) THA (2019) TGO (2019) UGA (2019) UKR (2010) URY (2008) UZB (2019) JPN (2003)
TWN (2010)

Table A6: Baseline regression results for control vectors GRAV and C for panel analysis
(1) (2) (3) (4) (5) (6) Digital+ Digital Publishing Telecom IT & Info Business
ln(Distance) -0.244*** -0.457*** -0.896*** -0.356*** -0.427*** -0.218***
(0.000) (0.000) (0.000) (0.000) (0.000) (0.001) Contiguity 0.830*** 0.548*** 0.359 0.606*** 0.476*** 0.727***
(0.000) (0.004) (0.156) (0.000) (0.010) (0.000) Language 0.315*** 0.448*** 0.292 0.386*** 0.376*** 0.149
(0.001) (0.004) (0.370) (0.000) (0.007) (0.231) Colony 0.474*** 0.310 0.564 0.745*** 0.247 0.648***
(0.007) (0.181) (0.171) (0.000) (0.261) (0.001) International -5.417*** -6.068*** -3.740*** -7.722*** -6.382*** -6.916***
(0.000) (0.000) (0.000) (0.000) (0.000) (0.000) PTA 0.293*** 0.195 -0.265 0.358*** 0.268* 0.039
(0.005) (0.233) (0.360) (0.000) (0.065) (0.793)
Model CB OP * intl 0.975*** 2.341*** -0.838 0.827*** 3.848*** 2.074***
(0.006) (0.000) (0.245) (0.002) (0.000) (0.000) Model CB CT * intl 1.083*** 3.089*** -0.356 1.959*** 4.774*** 2.639***
(0.000) (0.000) (0.499) (0.000) (0.000) (0.000) Model DR OP * intl -0.701** -1.025*** 0.957 0.419 -1.927*** -0.081
(0.012) (0.008) (0.165) (0.150) (0.000) (0.849) Model DR CT * intl -0.822*** -1.630*** 0.296 0.453* -2.774*** -0.743**
(0.000) (0.000) (0.547) (0.087) (0.000) (0.013)
Control MODEL No No No No No No FE exp-yr + imp-yr Yes Yes Yes Yes Yes Yes
Obs 45056 45056 45056 45056 45056 45056 P-R2 0.982 0.965 0.955 0.959 0.935 0.968
Note: * p<0.10; ** p<0.05; *** p<0.01. The dependent variable is bilateral digital services exports (DSX) using the underlying gross trade data from the TiVA database. Sector groupings in each column can be found in Annex Table A2. Robust standard errors are clustered at the country-pair level. Fixed effects for exporter-year and importer-year are applied. CB refers to the cross-border transfer of data, whereas DR refers to the domestic data processing. Fixed effects for exporter and importer are applied. CB refers to the cross-border transfer of data, whereas DR refers to the domestic data processing. The CB and DR variables are taken for the exporter’s side and are interacted with intl as part of the C ∗ intl𝑜𝑜𝑜𝑜 term. The limited data model is omitted. Note that regressions are performed without controlling for the three data models as explained in the text.

Table A7: Baseline regression results for control vectors GRAV and C using ITPD-E data
(1) (2) (3) Digital+ Digital Business
ln(Distance) -0.345*** -0.572*** -0.286*** (0.000) (0.000) (0.002)
Contiguity 0.650*** 0.294 0.551*** (0.000) (0.108) (0.005)
Language 0.447*** 0.286** 0.308** (0.000) (0.042) (0.040)
Colony 0.250 0.846*** 0.337 (0.361) (0.006) (0.359)
International -12.037*** -10.392*** -10.455*** (0.000) (0.000) (0.000)
PTA 0.236 0.499*** 0.257 (0.144) (0.004) (0.174)
Model CB OP * intl 4.473*** 4.943*** 3.526*** (0.000) (0.000) (0.000)
Model CB CT * intl 5.020*** 5.857*** 4.348*** (0.000) (0.000) (0.000)
Model DR OP * intl 2.376*** 0.713 2.531*** (0.001) (0.335) (0.000)
Model DR CT * intl 2.029*** -0.529 1.233*** (0.001) (0.485) (0.004)
Control MODEL No No No FE exp-yr + imp-yr Yes Yes Yes
Obs 43846 35297 37823 P-R2 0.994 0.994 0.990
Note: * p<0.10; ** p<0.05; *** p<0.01. The dependent variable the bilateral digital services exports (DSX) using the underlying gross trade data from the ITPD-E database. Sector groupings in each column can be found in Annex Table A3. Robust standard errors are clustered at the country-pair level. Fixed effects for exporter-year and importer-year are applied. CB refers to the cross-border transfer of data, whereas DR refers to the domestic data processing. The CB and DR variables are taken for the exporter’s side and are interacted with intl as part of the C ∗ intl𝑜𝑜𝑜𝑜 term. The limited data model is omitted.