regulation of glucose uptake in muscle - the journal of ... · pdf fileregulation of glucose...
TRANSCRIPT
THE JOURNAL OF BIOLOGICAL CHEMIBTRY Vol. 236, No. 2, February 1961
Printed in U.S.A.
Regulation of Glucose Uptake in Muscle
I. THE EFFECTS OF INSULIN AND ANOXIA ON GLUCOSE TRANSPORT AND PHOSPHORYLATION IN THE ISOLATED, PERFUSED HEART OF NORMAL RATS*
H. E. MORGAN,~ M. J. HENDERSON, D. M. REGEN, AND C. R. PARK
From the Department of Physiology, Vanderbilt University School of Medicine, Nashville, Tennessee
(Received for publication, May 23, 1960)
The stimulation of glucose uptake by muscle cells is recognized as one of the most important and characteristic actions of in- sulin. This hormone effect was shown in earlier work (1, 2) to be due to an acceleration of glucose transport through the cell membrane, as first proposed by Levine et al. (3, 4). Glucose uptake is also stimulated by anoxia, as recently demonstrated by Randle and Smith (6) who attributed this effect to acceleration of the transport process. Morgan, Randle, and Regen (7) con- firmed this conclusion and showed, in addition, that anoxia stimulated glucose phosphorylation.
In the present work, we have studied the effects of insulin and anoxia on glucose uptake in more detail and have attempted, in particular, to analyze the kinetics of the uptake process. In this connection, the importance of glucose transport through the membrane as a rate-limiting step for uptake has been appreciated only recently. Furthermore, the specific nature of the transport process and the differences between transport and diffusion kinetics in muscle have not been clearly described previously.
We have employed the isolated, perfused rat heart as the test preparation. The process of glucose uptake by this tissue has been taken to consist of three sequential steps. These are (a) the diffusion of glucose from within the capillary to the muscle cell surface, (b) the transport of glucose through the cell mem- brane, and (c) the intracellular phosphorylation of the sugar. The kinetics of each of these steps has been investigated, and the extent to which each step limits, or controls, uptake has been evaluated. The effects of insulin and anoxia on uptake as a whole and on each step individually have been determined. The present study deals with heart muscle from normal rats and the following paper with muscle from diabetic rats.
The use and properties of the isolated heart preparation are described in detail.
Preliminary reports of some of this work have appeared earlier
(8, 9).
EXPERIMENTAL PROCEDURE
Preparation and Perfusion of the Heart-Rats of the Sprague- Dawley strain weighing 250 to 300 g were fasted for 18 hours before use. Heparin sodium (5 mg) was injected intraperi- toneally 1 hour before the rats were killed.
The preparation of the heart was as follows. The animal was killed with a guillotine decapitator (Harvard Apparatus Com-
* Supported by grants from the American Heart Association, the National Science Foundation, and the United States Public Health Service.
t Investigator, the Howard Hughes Medical Institute.
pany, Cambridge, Massachusetts). An inverted V incision was made between the upper abdomen and the base of the neck. The abdominal tissues across the base of the V and the attach- ments of the diaphragm to the rib cage were transected, and the cut section of the anterior thorax was lifted out. The heart was raised with the fingers and the great vessels were cut about 5 mm distal to the base. The heart was then immediately placed in a beaker containing 0.9% sodium chloride chilled in an ice bath. Contractions stopped within a few seconds. Speed was essential and with practice the above procedures could be com- pleted in 20 seconds. When the heart had been cooled for 1 to 2 minutes, the aorta was grasped with a pair of fine-tipped forceps and slipped about 3 mm onto a grooved perfusion can- nula filled with perfusion fluid. Ligation was facilitated by holding the heart in place with a hemostat clamped across the upper margin of the aorta. The clamp was then removed and the perfusion with warm medium begun. The first 8 ml of medium passing through the heart washed out all visible blood; they were collected in a graduated cylinder and discarded. This washing also served to equilibrate the glucose concentration in the interstitial fluid with that in the perfusate.
The rate, perfusion pressure, and general appearance of the heart were noted near the beginning and end of the perfusion period. Unsatisfactory preparations were discarded.
Perfusion Medium-Krebs-Henseleit bicarbonate buffer (lo), pH 7.40, equilibrated with either 0~COz (95:5) or N&O2 (95:5) at 37” was used in all experiments.
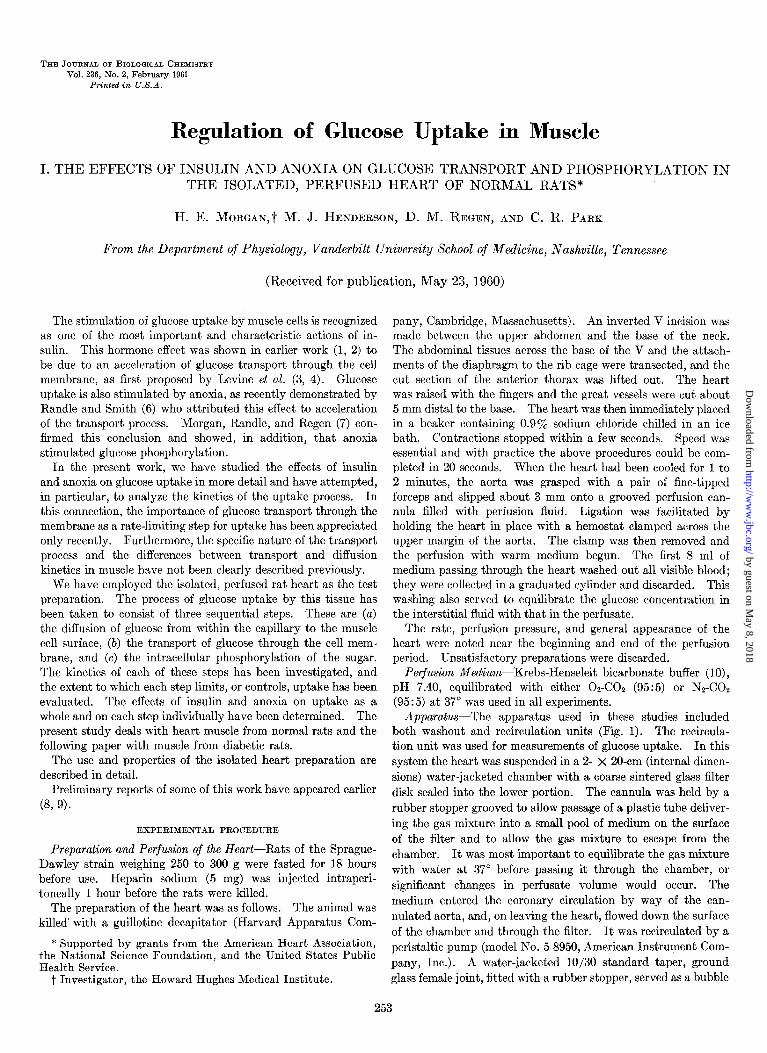
Apparatus-The apparatus used in these studies included both washout and recirculation units (Fig. I). The recircula- tion unit was used for measurements of glucose uptake. In this system the heart was suspended in a 2- X 20-cm (internal dimen- sions) water-jacketed chamber with a coarse sintered glass filter disk sealed into the lower portion. The cannula was held by a rubber stopper grooved to allow passage of a plastic tube deliver- ing the gas mixture into a small pool of medium on the surface of the filter and to allow the gas mixture to escape from the chamber. It was most important to equilibrate the gas mixture with water at 37” before passing it through the chamber, or significant changes in perfusate volume would occur. The medium entered the coronary circulation by way of the can- nulated aorta, and, on leaving the heart, flowed down the surface of the chamber and through the filter. It was recirculated by a peristaltic pump (model No. 5-8950, American Instrument Com- pany, Inc.). A water-jacketed lo/30 standard taper, ground glass female joint, fitted with a rubber stopper, served as a bubble
253
by guest on May 8, 2018
http://ww
w.jbc.org/
Dow
nloaded from
254 Regulation of Glucose Uptake in Muscle. I Vol. 236, No. 2
WASHOUT , RECIRCULATION
PUMP
FIG. 1. Diagrammatic representation of the perfusion appara- tus. The apparatus is described in the text. The authors are indebted to Dr. M. T. Bush for advice in the development of the apparatus.
trap in the line just ahead of the heart chamber and was con- nected to a mercury manometer.
Before the heart was placed in the apparatus, the desired amount of medium plus 8 ml for the preliminary washing were measured into the heart chamber. The pump was turned on and the fluid level in the bubble trap was raised to about 2 cm by venting the connection to the manometer. Satisfactory pres- sures and flow rates were obtained in the subsequent perfusion by making a preliminary adjustment of the pump to produce a pressure of 150 mm Hg with the tube leading to the heart can- nula clamped off.
When checked by isotope dilution with sorbitol-l-C14, the circulating volume was found to be 0.50 + 0.17 ml per g of heart larger than the volume of medium added. This increase was due to a carry-over of fluid in the chambers and interstitial space of the heart. A correction for this additional volume was made so that, in effect, the volume of interstitial water was included in the estimate of perfusate volume.
The washout unit of the apparatus consisted of a Mariotte bottle reservoir placed 90 cm above the level of the heart to supply oxygenated buffer at 37”. When indicated, the perfusate leaving the heart was collected and measured in a series of graduated cylinders.
In comparison to the apparatus described by Bleehen and Fisher (11)) employed extensively in our early experiments, the present setup permitted better control of flow and pressure. It required a smaller volume of recirculating medium (minimum 5 ml) and mixing was faster. The apparatus was simpler to con- struct, more compact, and easily cleaned.
Chemicals-n-Sorbitol was obtained from the Nutritional Biochemicals Corporation; n-glucose from Merck and Company, Inc., and crystalline zinc insulin, treated to remove glucagon, from Eli Lilly and Company (Lot No. 466367). n-Sorbitol-l-C14 was obtained from the Bureau of Standards, Washington, D. C. Glucose oxidase was obtained from the Sigma Chemical Com- pany, horseradish peroxidase from the Worthington Biochemical Corporation, and 3,3’-dimethoxybenzidine from Distillation Products Industries, Rochester, New York.
Glucose Uptake-This was defined as the disappearance of
glucose from the medium. Measurements were made by the glucose oxidase method as described by Huggett and Nixon (5).
Tissue Glucose and Glucose Space-At the end of the perfusion, the heart was cut from the cannula into a beaker of ice-cold 0.9 $$e NaCl and immediately bisected with scissors in order to promote rapid chilling and prevent further glucose utilization. The sub- sequent handling of the tissue and the procedure for estimating glucose content by the oxidase method have been described earlier (7). It may be added here that the glucose estimation was checked by first removing the glucose as glucose 6-phosphate with ATP and five times recrystallized hexokinase (a gift from Dr. S. P. Colowick) followed by Ba(OH)z and ZnS04 precipita- tion. The supernatant solution gave color in the glucose oxidase reaction equivalent to 20 hg of glucose per g of heart for normal and 25 pg per g for diabetic tissue. These blanks were sub- tracted from all estimations. By paper chromatography (12) the reactive materials appeared to be largely maltose and glyco- gen, both of which cause slow color development in the oxidase system because of contaminating enzymes.
The glucose space was defined as the volume of tissue water necessary to contain the glucose of the tissue at the concentration of the perfusion medium. It was calculated by the following formula:
Glucose space, PI/g (muscle glucose, pg per g of wet muscle)(lOOO) =
(medium glucose, pg per ml)
Intracellular glucose concentrations were calculated as follows:
Intracellular glucose, mg/lOO ml (glucose space - sorbitol space, pi/g)
(perfusate glucose, mg/lOO ml) = (Total water - sorbitol space, rl/g)(0.75)
The factor 0.75 was introduced on the basis of unpublished studies with several nonmetabolized sugars which showed that only 75% of the intracellular water was available for sugar dis- tribution.
Extracellular space-This was determined with sorbitol, since it is similar in diffusion characteristics to glucose but does not penetrate the muscle cell. Sorbitol-l-Cl4 was used in order to ensure specificity in its estimation. Approximately 12 PC of n-sorbitol-l-C14 in 50 mg of carrier were added to each 100 ml of the perfusion medium. Solutions for counting were prepared as described for glucose (7). Aliquots (0.5 to 1.0 ml) were dissolved in 60 ml of a solution of toluene and ethanol (77:23 volume per volume) containing 4 g of diphenyloxazole per liter and were counted in a liquid scintillation counter (Tracerlab). The count- ing rates varied from 20 to 100 times background. The sorbitol space was calculated in the same manner as the glucose space.
Tissue Water-This was determined on a lOO- to 200-mg ali- quot of fresh muscle dried in a vacuum at room temperature to constant weight.
Statistical Analysis-The significance of differences between means was established by the t test method (13).
RESULTS
General Characteristics of Preparation-Cardiac contractions began within a few seconds after exposure to the warm perfusion medium. During the following 2 to 3 minutes, the rhythm was frequently irregular but then became steady at a rate of 200 to 240 beats per minute which was maintained for at least 1 hour.
by guest on May 8, 2018
http://ww
w.jbc.org/
Dow
nloaded from

February 1961 H. E. Morgan, M. J. Henderson, D. M. Regen, and C. R. Park
The perfusion pressure of 35 to 50 mm Hg and coronary flow of 7 to 10 ml per minute were also constant. The oxygen tension of the buffer, determined by gas chromatography (14), was about 550 mm Hg on entering and 175 mm Hg on leaving the heart, the latter being still well above that of normal arterial blood. The oxygen uptake, calculated from these figures, the solubility of oxygen in water, and the coronary flow, was approxi- mately 0.1 ml per g per minute.
When the heart was perfused under anaerobic conditions, con- tractions usually stopped within 2 or 3 minutes. The perfusion pressure fell by about 10 mm Hg, and the coronary flow increased by about 50%. Fifteen minutes of anoxia did not cause any
TABLE I
Glucose uptake by isolated heart during two successive periods of perfusion
The number of hearts is given by the figures in parentheses. The heart was perfused with fresh medium at the beginning of the second period in order to restore the initial concentration of glucose (100 mg per 100 ml). For these experiments, two re- circulating perfusion units were connected together through a three-way stopcock (see Fig. 1) and the muscle was transferred to the second chamber at the beginning of the second period.
Aerobic, no insulin. . Anaerobic with insulin
in vitro, 100 milliunitsj ml. . . . . . . . . . .
- * Standard error.
- I Glucose uptake
O-15 min I
15-30 min
w/dhr
5.4 f 0.36* (7) / 5.1 f 0.78 (8)
21.1 f 2.1 (8) 1 20.2 f 1.7 (6)
obvious damage in previously normal hearts, since beating began immediately upon restoration of oxygen, and the usual values for heart rate, perfusion flow, and pressure were quickly re-es- tablished.
As shown in Table I, the glucose uptake was constant over two successive 15-minute periods, even at the highest rates, such as those obtained with insulin and anoxia.
Water and Xorbitol Spaces-For the estimation of intracellular glucose, it was first necessary to determine the water content of the heart and the volumes of the extra- and intracellular com- partments. (a) Water content: Table II shows that the water content was essentially stable at about 790 ~1 per g wet weight between 5 and 50 minutes of perfusion. It was not affected by insulin but was significantly increased by anoxia or hypophy- sectomy. (b) Extracellular volume: The extracellular volume as determined by the distribution of sorbitol was also essentially constant up to 50 minutes at about 360 ~1 per g under aerobic conditions. This volume was about 20 y0 larger than that found in vivo, and was associated with a roughly equivalent increase in water content, as shown by Bleehen and Fisher (11). The extracellular volume was not affected by hypophysectomy or alloxan diabetes, but was increased to about 420 ~1 per g with anoxia. (c) Intracellular volume: Under aerobic conditions, the volume of intracellular water (total water minus sorbitol space) was 430 ~1 per g and was not altered by insulin or alloxan diabetes, but was increased by hypophysectomy to 459 ~1 per g and decreased to 400 ~1 per g with anoxia.
When the changes in extra- and intracellular compartment size with anoxia were considered in relationship to dry rather than wet weight, it could be calculated that the water content increased by about 12%, and this increase occurred entirely in the extracellular volume.
Extracellular Transfer of Glucose-In these experiments, an
TABLE II
Water content and sorbitol space of isolated, perfused heart
The conditions and methods employed are described in the text. The number of hearts is indicated by the figure in parentheses. Alloxan diabetes, with blood plasma sugars in excess of 400 mg per 100 ml after 18 hours of fasting, was induced with 6 mg of alloxan per 100 g, intravenously, 48 hours before testing. Hypophysectomy was performed 20 to 30 days before the rats were killed.
I I
Insulin added, Time of perfusion, min
Condition of heart 100 milliunits/ml 5
I 15
I 30
I 50
Water content, Ml/g
Normal. . . 0 799 f 2 (10) 792 f 3 (17) 789 f 2 (33) 805f 7(6) Normal........................... + 792 f 3 (8) 790 zk 3 (8) 789r!z 5(6) Normal, anaerobic. + 815* f 3 (8) 812* f 8 (6) Diabetic 0 794 f 4 (8) Hypophysectomized. . 0 810* f 1 (16)
Sorbitol space, &/g
Normal........................... 0 336 f 16 (6) 360 f 8 (28) 356 f 10 (16) Normal........................... + 374 f 13 (6) 366 zk 10 (28) 376 f 5 (29) Normal, anaerobic. 0 412 f 23 (9) 419* f 8 (8) Normal, anaerobic. + 440* f 9 (8) 422* f 13 (8) Diabetic. 0 361 f 5 (8) Diabetic.......................... + 346 f 5 (8) Hypophysectomized. 0 351 f 9 (21) Hypophysectomieed, diabetic.. . 0 363 -f 6 (16)
* p <O.Ol versus corresponding normal control.
371 f 4 (6) 346 f 7 (6)
by guest on May 8, 2018
http://ww
w.jbc.org/
Dow
nloaded from
256 Regulation of Glucose Uptake in Muscle. I
, , , I.P;E. 1 0 I 2 3 4 5 6
MINUTES
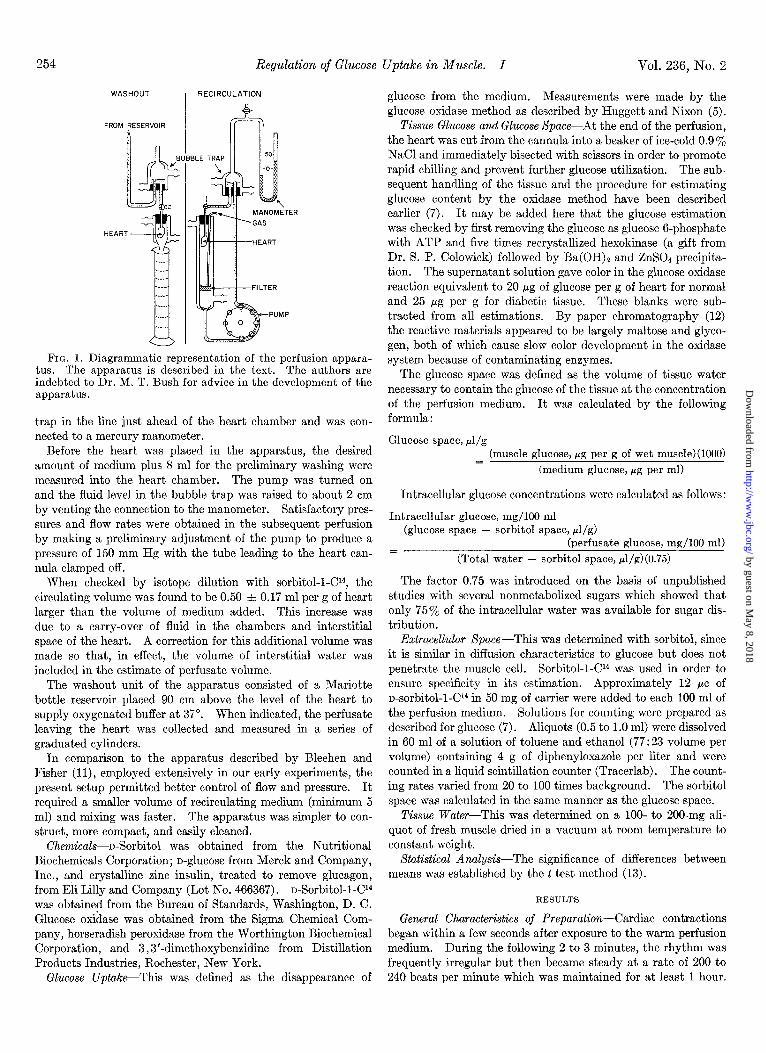
FIG. 2. Time course of the washout of sorbitol from the extra- cellular space of the perfused heart. The procedure and calcula- tions are described in the text. For each point, six hearts were analyzed. For the small compartment, the volume was estimated to be 94 ~1 per g, the time constant 1.7 minutes, and the resistance 30.2 hours per 100 ml per g of heart. The authors are indebted to Dr. R. L. Post for developing the present mathematical treat- ment.
r 500
” 4oc \
i w 300 :: 6 2oc
100 I= 2 SE.
MINUTES
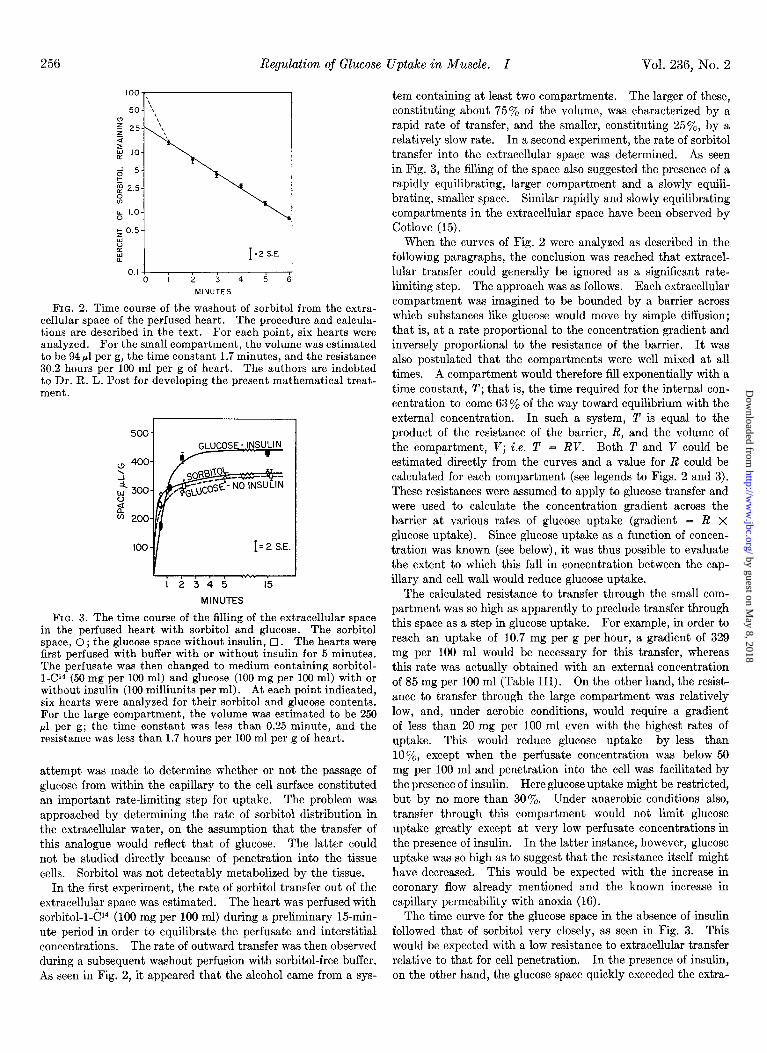
FIG. 3. The time course of the filling of the extracellular space in the perfused heart with sorbitol and glucose. The sorbitol space, 0 ; the glucose space without insulin, 0. The hearts were first perfused with buffer with or without insulin for 5 minutes. The perfusate was then changed to medium containing sorbitol- l-Cl4-(50 mg per 100 ml) and glucose (100 mg per 100 ml) with or without insulin (100 milliunits ner ml). At each noint indicated. six hearts were analyzed for their sorbitol and glucose contents. For the large compartment, the volume was estimated to be 250 ~1 per g; the time constant was less than 0.25 minute, and the resistance was less than 1.7 hours per 100 ml per g of heart.
attempt was made to determine whether or not the passage of glucose from within the capillary to the cell surface constituted an important rate-limiting step for uptake. The problem was approached by determining the rate of sorbitol distribution in the extracellular water, on the assumption that the transfer of this analogue would reflect that of glucose. The latter could not be studied directly because of penetration into the tissue cells. Sorbitol was not detectably metabolized by the tissue.
In the first experiment, the rate of sorbitol transfer out of the extracellular space was estimated. The heart was perfused with sorbitol-l-Cl4 (100 mg per 100 ml) during a preliminary 15-min- ute period in order to equilibrate the perfusate and interstitial concentrations. The rate of outward transfer was then observed during a subsequent washout perfusion with sorbitol-free buffer. As seen in Fig. 2, it appeared that the alcohol came from a sys-
Vol. 236, No. 2
tern containing at least two compartments. The larger of these, constituting about 75% of the volume, was characterized by a rapid rate of transfer, and the smaller, constituting 25’%, by a relatively slow rate. In a second experiment, the rate of sorbitol transfer into the extracellular space was determined. As seen in Fig. 3, the filling of the space also suggested the presence of a rapidly equilibrating, larger compartment and a slowly equili- brating, smaller space. Similar rapidly and slowly equilibrating compartments in the extracellular space have been observed by Cotlove (15).
When the curves of Fig. 2 were analyzed as described in the following paragraphs, the conclusion was reached that extracel- lular transfer could generally be ignored as a significant rate- limiting step. The approach was as follows. Each extracellular compartment was imagined to be bounded by a barrier across which substances like glucose would move by simple diffusion; that is, at a rate proportional to the concentration gradient and inversely proportional to the resistance of the barrier. It was also postulated that the compartments were well mixed at all times. A compartment would therefore fill exponentially with a time constant, T; that is, the time required for the internal con- centration to come 63% of the way toward equilibrium with the external concentration. In such a system, T is equal to the product of the resistance of the barrier, R, and the volume of the compartment, V; i.e. T = RV. Both T and V could be estimated directly from the curves and a value for R could be calculated for each compartment (see legends to Figs. 2 and 3). These resistances were assumed to apply to glucose transfer and were used to calculate the concentration gradient across the barrier at various rates of glucose uptake (gradient = R x
glucose uptake). Since glucose uptake as a function of concen- tration was known (see below), it was thus possible to evaluate the extent to which this fall in concentration between the cap- illary and cell wall would reduce glucose uptake.
The calculated resistance to transfer through the small com- partment was so high as apparently to preclude transfer through this space as a step in glucose uptake. For example, in order to reach an uptake of 10.7 mg per g per hour, a gradient of 329 mg per 100 ml would be necessary for this transfer, whereas this rate was actually obtained with an external concentration of 85 mg per 100 ml (Table III). On the other hand, the resist- ance to transfer through the large compartment was relatively low, and, under aerobic conditions, would require a gradient of less than 20 mg per 100 ml even with the highest rates of uptake. This would reduce glucose uptake by less than lo’%, except when the perfusate concentration was below 50 mg per 100 ml and penetration into the cell was facilitated by the presence of insulin. Here glucose uptake might be restricted, but by no more than 30%. Under anaerobic conditions also, transfer through this compartment would not limit glucose uptake greatly except at very low perfusate concentrations in the presence of insulin. In the latter instance, however, glucose uptake was so high as to suggest that the resistance itself might have decreased. This would be expected with the increase in coronary flow already mentioned and the known increase in capillary permeability with anoxia (16).
The time curve for the glucose space in the absence of insulin followed that of sorbitol very closely, as seen in Fig. 3. This would be expected with a low resistance to extracellular transfer relative to that for cell penetration. In the presence of insulin, on the other hand, the glucose space quickly exceeded the extra-
by guest on May 8, 2018
http://ww
w.jbc.org/
Dow
nloaded from
February 1961 H. E. Morgan, M. J. Henderson, D. M. Regen, and C. R. Park 257
TABLE III
Effect of insulin on uptake, phosphorylation, and intracellular accumulation of glucose in isolated aerobic heart perfused with various concentrations of glucose
Perfusions were carried out for 30 minutes in all cases. The volume of medium was adjusted to give a 20% or larger change between the initial and final perfusate concentrations. The final concentration was used to calculate the glucose space and intracellular glucose concentration. The extracellular (sorbitol) space was taken to be 360 f 10 ~1 per g. Insulin was added to the perfusate where indi- cated in a concentration of 100 milliunits per ml. The number of hearts tested is given by the figures in parentheses.
Perfusate glucose
Initial I
Final
15 11 50 24
100 69 150 108 300 197 400 292 600 495 800 655
50 34 100 71 300 166 600 438 800 637
mg/lOO ml
Insulin added Glucose uptake Glucose space Intracellular glucose Glucose phosphorylation
0
0
0
0
0
0
0
0
+
+
+
+
+
+w/dhr d/s mg 100 ml mg g hr
1.4 f 0.1 (7) 118a n.d. b 1.4 f 0.1 4.1 f 0.3 (8) 158a n.d. 4.1 f 0.3 4.7 f 0.2 (10) 268 f 21 n.d. 4.7 f 0.2 5.8 f 0.5 (6) 269 f 10 n.d. 5.8 f 0.5
10.0 f 0.6 (11) 360 f 13 n.d. 10.0 f 0.6 11.3 f 0.8 (9) 344 f 19 n.d. 11.3 f 0.8 11.6 f 0.7 (12) 386 f 14 nd. 11.3 f 0.7 11.3 f 0.6 (12) 364 f 10 n.d. 11.3 f 0.6
8.3” f 0.2 (6) 948 n.d. 8.3 f 0.2 10.7~ f 0.6 (8) 4304 f 17 15”f 4 10.4 f 0.6 14.1~ f 0.7 (6) 547d f 6 96ef 6 13.2 f 0.7 15.8~ f 1.0 (7) 558d f 16 269” f 26 14.0 f 1.0 16.8~ f 0.5 (8) 564d f 8 402e f 26 14.2 f 0.5
a The reliability of these values is questionable in view of the small amounts of glucose involved. b n.d. = none detected. See footnote 2. c p <O.Ol versus corresponding control. d p <O.Ol versus extracellular volume. c p <O.Ol VeTsus 0.
cellular volume because of rapid penetration and accumulation of free sugar inside the cel1.i It can also be seen that the glucose space in the presence or absence of insulin came into a steady state within about 3 minutes.
From these studies, the conclusion was reached that the extra- cellular transfer of glucose took place through the rapidly equili- brating compartment, and that this step did not significantly limit glucose uptake except possibly at very low perfusate con- centrations in the presence of insulin.
Measurement of Transport and Phosphorylation-The problem of how to measure the transport and phosphorylation steps separately was approached as follows.
It was important to distinguish between inward and net (inward minus outward) transport, since the process is reversible (8, 17). Inasmuch as all glucose taken up must penetrate the cell, net transport could be equated with glucose uptake under all condi- tions. The rate of inward transport could be estimated to a first approximation in the particular circumstance in which the concentration of intracellular free glucose was low enough that back transport was relatively slow. Under these conditions, inward transport was approximately equal to glucose uptake. Intracellular glucose was considered to be very low when the glucose space was equal to or less than the extracellular volume. Corrections for the approximations involved in this approach are taken up in detail in a separate paper (25).
The rate of phosphorylation was taken to be equal to the rate of free. glucose disappearance from the system as a whole. Thus the rate was equal to the glucose uptake corrected for any glucose
1 The low value for glucose space at 30 seconds was presumably due to a rapid transport of glucose into the cell and its removal by phosphorylation.
accumulation inside the cell, since changes in interstitial suga were accounted for in the calculation of uptake from the medium (see “Experimental Procedure”). In order to know whether insulin or anoxia stimulated phosphorylation other than by in- creasing the availability of substrate, it was essential to relate the rate to the intracellular glucose concentration.
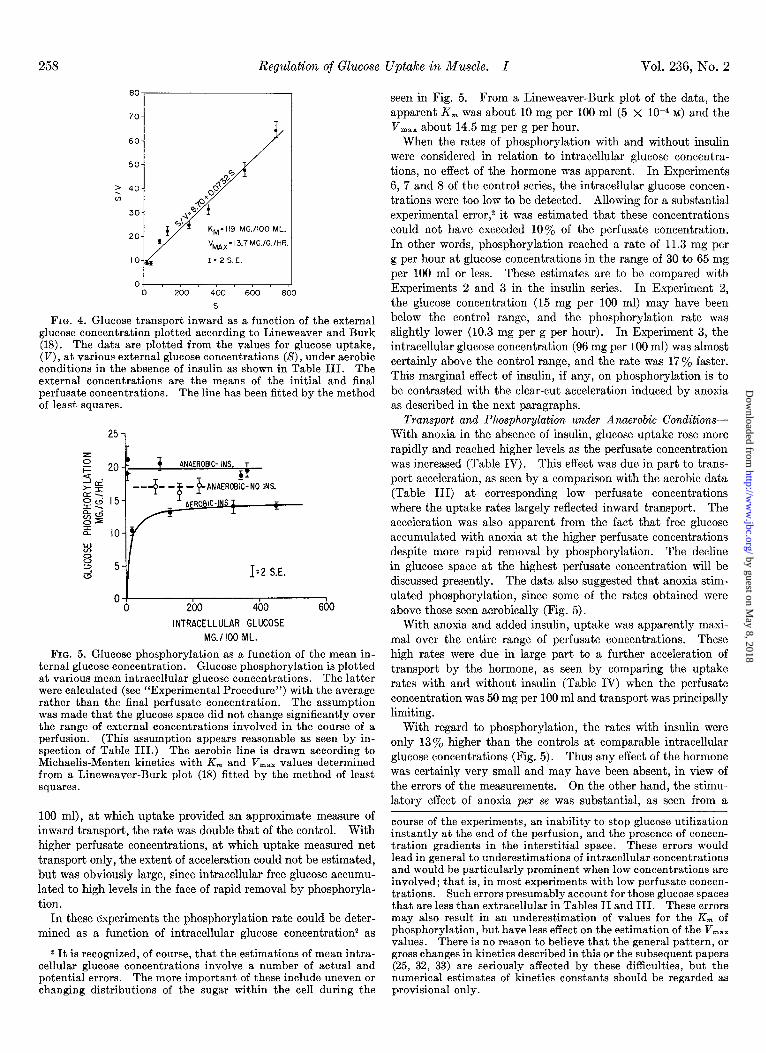
Transport and Phosphorylation under Aerobic Conditions-In the absence of insulin, glucose uptake rose with increasing perfu- sate concentrations and, above 300 mg per 100 ml, showed an obvious tendency to reach a plateau level (Table III). The glucose space did not significantly exceed the extracellular volume at any time, indicating that only very low levels of intracellular free glucose were present. Under these conditions, the values for uptake provided an approximate measure of inward transport as a function of the external glucose concentration. It was clear that this process conformed to Michaelis-Menten kinetics. When the data were plotted as seen in Fig. 4, the concentration for half-maximal transport was found to be about 120 mg per 100 ml (6 X 1O-3 M) and the transport maximum about 14 mg per g per hour (8 x 1O-5 moles per g per hour).
In these experiments, the intracellular free glucose remained so low that no estimate of phosphorylation as a function of glu- cose concentration could be made.
With the addition of insulin, glucose uptake increased much more rapidly at low perfusate concentrations of glucose, and there was less tendency to reach a plateau rate at high concentrations. The glucose space rose sharply and, at 100 mg per 100 ml, sig- nificantly exceeded the extracellular volume, indicating a sub- stantial accumulation of intracellular free sugar.
These effects were attributed to an acceleration of transport by the hormone. At a low perfusate concentration (50 mg per
by guest on May 8, 2018
http://ww
w.jbc.org/
Dow
nloaded from
258 Regulation of Glucose Uptake in Muscle. I Vol. 236, No. 2
60-
KM= 119 MG.1100 ML.
VMnx= 13.7 MG./G.IHR.
1;ZS.E.
O- So0 S
FIG. 4. Glucose transport inward as a function of the external glucose concentration plotted according to Lineweaver and Burk (18). The data are plotted from the values for glucose uptake, (V), at various external glucose concentrations (S), under aerobic conditions in the absence of insulin as shown in Table III. The external concentrations are the means of the initial and final perfusate concentrations. The line has been fitted by the method of least squares.
251
z i= 20 - 4 ANAEROBIC-INS. T
4 . >5E = > zc 15-
---y- -$ ,‘$A~iTN” INS.
NS I gci
I z
0=
zf IO-
w 8 3 5- ” 1’2 S.E.
0' 1 0 200 400 600
INTRACELLULAR GLUCOSE MG.1100 ML.
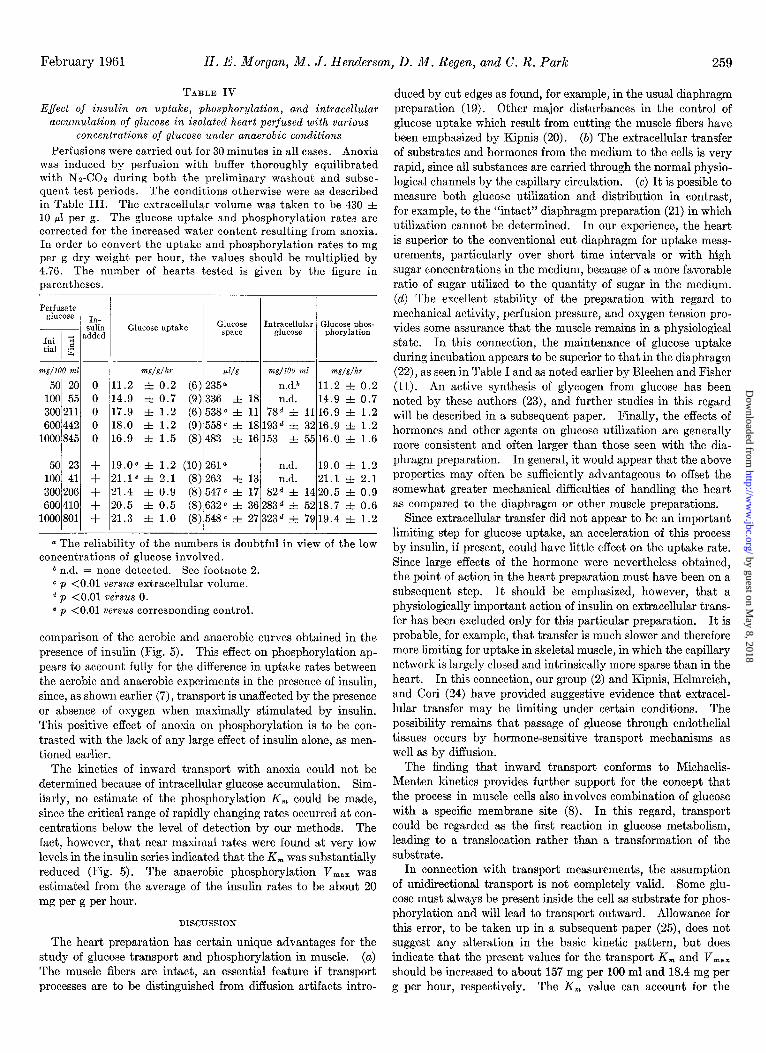
FIG. 5. Glucose phosphorylation as a function of the mean in- ternal glucose concentration. Glucose phosphorylation is plotted at various mean intracellular glucose concentrations. The latter were calculated (see “Experimental Procedure”) with the average rather than the final perfusate concentration. The assumption was made that the glucose space did not change significantly over the range of external concentrations involved in the course of a perfusion. (This assumption appears reasonable as seen by in- spection of Table III.) The aerobic line is drawn according to Michaelis-Menten kinetics with Km and V,,, values determined from a Lineweaver-Burk plot (18) fitted by the method of least squares.
100 ml), at which uptake provided an approximate measure of inward transport, the rate was double that of the control. With higher perfusate concentrations, at which uptake measured net transport only, the extent of acceleration could not be estimated, but was obviously large, since intracellular free glucose accumu- lated to high levels in the face of rapid removal by phosphoryla- tion.
In these experiments the phosphorylation rate could be deter- mined as a function of intracellular glucose concentration2 as
2 It is recognized, of course, that the estimations of mean intra- cellular glucose concentrations involve a number of actual and potential errors. The more important of these include uneven or changing distributions of the sugar within the cell during the
seen in Fig. 5. From a Lineweaver-Burk plot of the data, the apparent K, was about 10 mg per 100 ml (5 x 1O-4 M) and the V,,, about 14.5 mg per g per hour.
When the rates of phosphorylation with and without insulin were considered in relation to intracellular glucose concentra- tions, no effect of the hormone was apparent. In Experiments 6, 7 and 8 of the control series, the intracellular glucose concen- trations were too low to be detected. Allowing for a substantial experimental error,2 it was estimated that these concentrations could not have exceeded 10% of the perfusate concentration. In other words, phosphorylation reached a rate of 11.3 mg per g per hour at glucose concentrations in the range of 30 to 65 mg per 100 ml or less. These estimates are to be compared with Experiments 2 and 3 in the insulin series. In Experiment 2, the glucose concentration (15 mg per 100 ml) may have been below the control range, and the phosphorylation rate was slightly lower (10.3 mg per g per hour). In Experiment 3, the intracellular glucose concentration (96 mg per 100 ml) was almost certainly above the control range, and the rate was 17% faster. This marginal effect of insulin, if any, on phosphorylation is to be contrasted with the clear-cut acceleration induced by anoxia as described in the next paragraphs.
Transport and Phosphorylation under Anaerobic Conditions- With anoxia in the absence of insulin, glucose uptake rose more rapidly and reached higher levels as the perfusate concentration was increased (Table IV). This effect was due in part to trans- port acceleration, as seen by a comparison with the aerobic data (Table III) at corresponding low perfusate concentrations where the uptake rates largely reflected inward transport. The acceleration was also apparent from the fact that free glucose accumulated with anoxia at the higher perfusate concentrations despite more rapid removal by phosphorylation. The decline in glucose space at the highest perfusate concentration will be discussed presently. The data also suggested that anoxia stim- ulated phosphorylation, since some of the rates obtained were above those seen aerobically (Fig. 5).
With anoxia and added insulin, uptake was apparently maxi- mal over the entire range of perfusate concentrations. These high rates were due in large part to a further acceleration of transport by the hormone, as seen by comparing the uptake rates with and without insulin (Table IV) when the perfusate concentration was 50 mg per 100 ml and transport was principally limiting.
With regard to phosphorylation, the rates with insulin were only 13% higher than the controls at comparable intracellular glucose concentrations (Fig. 5). Thus any effect of the hormone was certainly very small and may have been absent, in view of the errors of the measurements. On the other hand, the stimu- latory effect of anoxia per se was substantial, as seen from a
course of the experiments, an inability to stop glucose utilization instantly at the end of the perfusion, and the presence of concen- tration gradients in the interstitial space. These errors would lead in general to underestimations of intracellular concentrations and would be particularly prominent when low concentrations are involved; that is, in most experiments with low perfusate concen- trations. Such errors presumably account for those glucose spaces that are less than extracellular in Tables II and III. These errors may also result in an underestimation of values for the K, of phosphorylation, but have less effect on the estimation of the Vm,, values. There is no reason to believe that the general pattern, or gross changes in kinetics described in this or the subsequent papers (25, 32, 33) are seriously affected by these difficulties, but the numerical estimates of kinetics constants should be regarded as provisional only.
by guest on May 8, 2018
http://ww
w.jbc.org/
Dow
nloaded from
February 1961 H. E. Morgan, M. J. Henderson, D. M. Regen, and C. R. Park 259
TABLE IV E$ect of insulin on uptake, phosphorylation, and intracellular
accumulation of glucose in isolated heart perfused with various concentrations of glucose under anaerobic conditions
Perfusions were carried out for 30 minutes in all cases. Anoxia was induced by perfusion with buffer thoroughly equilibrated with N2-COz during both the preliminary washout and subse- quent test periods. The conditions otherwise were as described in Table III. The extracellular volume was taken to be 430 f 10 ~1 per g. The glucose uptake and phosphorylation rates are corrected for the increased water content resulting from anoxia. In order to convert the uptake and phosphorylation rates to mg per g dry weight per hour, the values should be multiplied by 4.76. The number of hearts tested is given by the figure in parentheses.
Perfusate glucose IIl-
~ suhn Ini- s added
tial .z
Glucose uptake Glucose SPLUX
Intrrcelllar Glucose pbos- phorylatmn
mg/100 ml wldhr Ill/g mg/lOO ml w/&r
50 20 0 11.2 f 0.2 (6)235” n.d.b 11.2 f 0.2 100 55 0 14.9 f 0.7 (9)336 f 18 n.d. 14.9 f 0.7 300211 0 17.9 f 1.2 (6)538c f 11 7Sd f 1116.9 f 1.2 600442 0 18.0 f 1.2 (9)55ac f 18193d f 3216.9 f 1.2
1000845 0 16.9 f 1.5 (8)483 f 16153 f 5516.0 f 1.6
50 23 + 19.0” & 1.2 (lo)2610 n.d. 19.0 f 1.2 100 41 + 21.1e f 2.1 (8)263 i 13 n.d. 21.1 f 2.1 300206 + 21.4 f 0.9 (8)547” i 17 82d f: 1420.5 f 0.9 600410 + 20.5 f 0.5 (8)632c f 36283d f 5218.7 f 0.6
1000801 + 21.3 f 1.0 (8)548c f 27323d f 7919.4 f 1.2
a The reliability of the numbers is doubtful in view of the low concentrations of glucose involved.
b n.d. = none detected. See footnote 2. c p <O.Ol versus extracellular volume. d p <O.Ol versus 0. * p <O.Ol versus corresnonding control.
comparison of the aerobic and anaerobic curves obtained in the presence of insulin (Fig. 5). This effect on phosphorylation ap- pears to account fully for the difference in uptake rates between the aerobic and anaerobic experiments in the presence of insulin, since, as shown earlier (7)) transport is unaffected by the presence or absence of oxygen when maximally stimulated by insulin. This positive effect of anoxia on phosphorylation is to be con- trasted with the lack of any large effect of insulin alone, as men- tioned earlier.
The kinetics of inward transport with anoxia could not be determined because of intracellular glucose accumulation. Sim- ilarly, no estimate of the phosphorylation K, could be made, since the critical range of rapidly changing rates occurred at con- centrations below the level of detection by our methods. The fact, however, that near maximal rates were found at very low levels in the insulin series indicated that the K, was substantially reduced (Fig. 5). The anaerobic phosphorylation V,,, was estimated from the average of the insulin rates to be about 20 mg per g per hour.
DISCUSSION
The heart preparation has certain unique advantages for the study of glucose transport and phosphorylation in muscle. (a) The muscle fibers are intact, an essential feature if transport processes are to be distinguished from diffusion artifacts intro-
duced by cut edges as found, for example, in the usual diaphragm preparation (19). Other major disturbances in the control of glucose uptake which result from cutting the muscle fibers have been emphasized by Kipnis (20). (b) The extracellular transfer of substrates and hormones from the medium to the cells is very rapid, since all substances are carried through the normal physio- logical channels by the capillary circulation. (c) It is possible to measure both glucose utilization and distribution in contrast, for example, to the “intact” diaphragm preparation (21) in which utilization cannot be determined. In our experience, the heart is superior to the conventional cut diaphragm for uptake meas- urements, particularly over short time intervals or with high sugar concentrations in the medium, because of a more favorable ratio of sugar utilized to the quantity of sugar in the medium. (d) The excellent stability of the preparation with regard to mechanical activity, perfusion pressure, and oxygen tension pro- vides some assurance that the muscle remains in a physiological state. In this connection, the maintenance of glucose uptake during incubation appears to be superior to that in the diaphragm (22)) as seen in Table I and as noted earlier by Bleehen and Fisher (11). An active synthesis of glycogen from glucose has been noted by these authors (23), and further studies in this regard will be described in a subsequent paper. Finally, the effects of hormones and other agents on glucose utilization are generally more consistent and often larger than those seen with the dia- phragm preparation. In general, it would appear that the above properties may often be sufficiently advantageous to offset the somewhat greater mechanical difficulties of handling the heart as compared to the diaphragm or other muscle preparations.
Since extracellular transfer did not appear to be an important limiting step for glucose uptake, an acceleration of this process by insulin, if present, could have little effect on the uptake rate. Since large effects of the hormone were nevertheless obtained, the point of action in the heart preparation must have been on a subsequent step. It should be emphasized, however, that a physiologically important action of insulin on extracellular trans- fer has been excluded only for this particular preparation. It is probable, for example, that transfer is much slower and therefore more limiting for uptake in skeletal muscle, in which the capillary network is largely closed and intrinsically more sparse than in the heart. In this connection, our group (2) and Kipnis, Helmreich, and Cori (24) have provided suggestive evidence that extracel- lular transfer may be limiting under certain conditions. The possibility remains that passage of glucose through endothelial tissues occurs by hormone-sensitive transport mechanisms as well as by diffusion.
The finding that inward transport conforms to Michaelis- Menten kinetics provides further support for the concept that the process in muscle cells also involves combination of glucose with a specific membrane site (8). In this regard, transport could be regarded as the first reaction in glucose metabolism, leading to a translocation rather than a transformation of the substrate.
In connection with transport measurements, the assumption of unidirectional transport is not completely valid. Some glu- cose must always be present inside the cell as substrate for phos- phorylation and will lead to transport outward. Allowance for this error, to be taken up in a subsequent paper (25), does not suggest any alteration in the basic kinetic pattern, but does indicate that the present values for the transport K, and V,,, should be increased to about 157 mg per 100 ml and 18.4 mg per g per hour, respectively. The K, value can account for the
by guest on May 8, 2018
http://ww
w.jbc.org/
Dow
nloaded from
260 Regulation of Glucose Uptake in Muscle. I Vol. 236, No. 2
sensitivity of uptake rates to physiological changes in blood glucose concentration. The value is close to that obtained for glucose transport in the human (26, 27) and rabbit (28) erythro- cyte. This is in accord with the concept (8) that the basic mech- anisms of transport in the two tissues are similar, although the process in the red blood cell is not sensitive to insulin.
The general implications of the transport kinetics for the con- trol of glucose uptake and a quantitative description of how these kinetics are affected by insulin will be deferred to a subse- quent paper (25). It may be noted, however, at this point that Michaelis-Menten kinetics can account for the failure of intra- cellular glucose concentration to rise in proportion to the perfu- sate concentration. This is particularly striking at high perfu- sate concentrations under anaerobic conditions where it is reflected by a decline in the glucose space as noted earlier (upper panel of Table IV). An analogous phenomenon has been ob- served (27) in the erythrocyte and can be explained by a rise in the intracellular glucose concentration to a level at which out- ward transport approaches saturation. Under these conditions, inward and outward transport rates become nearly equal and net transport virtually ceases, although a large concentration gradient may remain across the cell membrane. This phenom- enon is not as obvious in the presence of insulin, probably because of a failure to reach saturation rates because of a rise in the transport K, (25).
The apparent K, for glucose phosphorylation in the tissue under aerobic conditions is about 100 times the K, (8 x 1O-6 M) for heart muscle hexokinase found by Sols and Crane (30). The K, appears to be reduced with anoxia and the V,,, is in- creased by about 35%. The effect of insulin in vitro on the phosphorylation process in the 30-minute period of these experi- ments is certainly small, if indeed there is any at all.
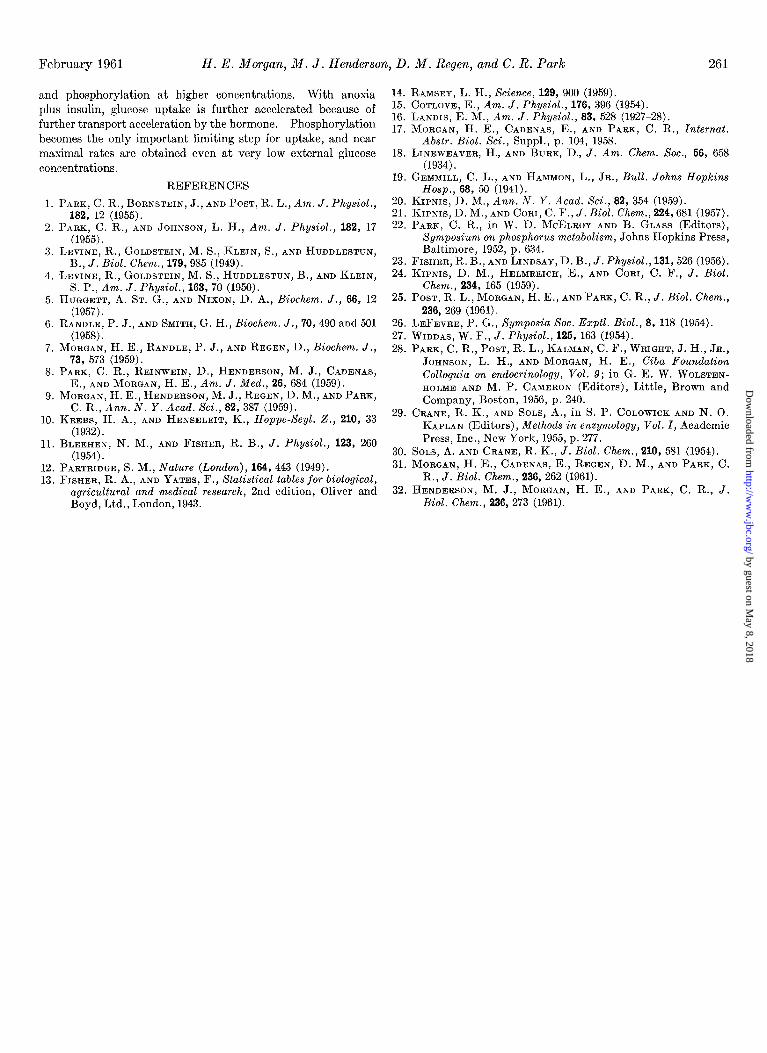
The major limiting steps for glucose uptake are transport and phosphorylation, since extracellular diffusion can usually be dis- regarded, as discussed. The extent to which each of these two steps limits uptake can be evaluated as follows. In the steady state, glucose uptake will proceed at a rate determined by the concentration of glucose available to the phosphorylation step. The highest possible uptake would occur in the hypothetical situation in which the membrane were absent and the available glucose concentration were that of the perfusate. In fact, how- ever, the membrane always restricts glucose entry, and phos-
200 400 600 800
EXTRACELLULAR GLUCOSE MG./lOOML
FIG. 6. The extent to which transport limits glucose uptake by the perfused heart under aerobic conditions. The figure is ex- plained in the text.
phorylation occurs at a rate determined by the intracellular glucose concentration. Thus the difference between the highest possible and actual uptake divided by the highest possible gives the fraction by which transport is limiting. The limitation re- maining is due to phosphorylation.
The relative limitations imposed by transport and phos- phorylation are shown in Fig. 6 for the aerobic tissue. The highest possible rate is indicated by the no membrane curve. This curve is simply a plot of phosphorylation against the perfu- sate concentration according to Michaelis-Menten kinetics with the values for the constants listed earlier. The extent to which transport lowers this rate is shown by the lower curves. These are smooth plots of the uptake rates against perfusate concentra- tions (Table II) for the situations with and without added in- sulin. It can be seen that transport restricts uptake by more than 50% in the range of extracellular concentrations below 100 mg per 100 ml. At higher concentrations, this restriction dimin- ishes progressively and is less than 20% at 800 mg per 100 ml. When insulin is added, transport reduces uptake by 50 y0 or more only when the extracellular concentration is below 25 mg per 100 ml. This restriction rapidly diminishes at higher external con- centrations and becomes negligible above 200 mg per 100 ml.
A similar analysis for the anoxic heart suggests that transport is the major limiting step for uptake only in the absence of insulin at perfusate concentrations below 100 mg per ml. At higher concentrations, or in the presence of insulin, phosphorylation is predominantly limiting.
SUMMARY
The control of glucose uptake and the effects of insulin and anoxia have been studied in the isolated, perfused rat heart. 1zy employing a wide range of perfusate concentrations, it has been possible to determine in a semi-quantitative manner the kinetics of extracellular transfer, membrane transport, and intracellular phosphorylation, and their relationship to each other in the uptake process.
1. The extracellular transfer of glucose from the capillary to the cell membrane is very rapid and does not appear to be an important limiting step for uptake except possibly in the presence of insulin when the capillary glucose concentration is at a physio- logically very low level.
2. In the absence of added insulin, glucose transport through the muscle cell membrane is the major limiting step for uptake in the normal range of blood glucose concentrations. At higher concentrations, phosphorylation becomes predominantly limit- ing.
Inward transport as a function of external glucose concentra- tions conforms to Michaelis-Menten kinetics.
3. With addition of insulin, glucose uptake is increased be- cause of acceleration of the transport step. Under these condi- tions, phosphorylation is the major limiting step at all external concentrations above 25 mg per 100 ml.
Phosphorylation of glucose in the tissue has an apparent K, of about 10 mg per 100 ml and a V,,, of 14.5 mg per g per hour. The kinetics of phosphorylation is not affected grossly by a 30- minute exposure to insulin in vitro.
4. With anoxia, glucose uptake is increased. This is due to an acceleration of transport, an increase in the phosphorylation capacity, and a decrease in the apparent phosphorylation K,. In the anoxic muscle, transport is predominantly rate-limiting for uptake at physiologically low external glucose concentrations
by guest on May 8, 2018
http://ww
w.jbc.org/
Dow
nloaded from
February 196 1 H. E. Morgan, M. J. Henderson, D. M. Regen, and C. R. Park 261
and phosphorylation at higher concentrations. With anoxia 14. RAMSEY, L. H., Science, 129, 900 (1959).
plus insulin, glucose uptake is further accelerated because of 15. COTLOVE, E., Am. J. Physiol., 176, 396 (1954).
further transport acceleration by the hormone. Phosphorylation 16. LANDIS, E. M., Am. J. Physiol., 83, 528 (1927-28).
becomes the only important limiting step for uptake, and near 17. MORGAN, H. E., CADENAS, E., AND PARE, C. R., Internat.
Abstr. Biol. Sci., Suppl., p. 104, 1958. maximal rates are obtained even at very low external glucose 18. LINEWEAVER, H., AND BURK, D., J. Am. Chem. Sot., 66, 658
concentrations.
REFERENCES
1.
2.
3.
4.
5.
6.
7.
8.
9.
10.
Il.
12. 13.
PARK, C. R., BORNSTEIN, J., AND POST, R. L., Am. J. Physiol., 182, 12 (1955).
PARK, C. R., AND JOHNSON, L. H., Am. J. Physiol., 182, 17 (1955).
LEVINE, R., GOLDSTEIN, M. S., KLEIN, S., AND HUDDLESTUN, B., J. Biol. Chem., 179,985 (1949).
LEVINE, R., GOLDSTEIN, M. S., HUDDLESTUN, B., AND KLEIN, S. P., Am. J. Physiol., 163, 70 (1950).
HUGGETT, A. ST. G., AND NIXON, D. A., Biochem. J., 66, 12 (1957).
RANDLE, P. J., AND SMITH, G. H., Biochem. J., 70,490 and 501 (1958).
MORGAN, H. E., RANDLE, P. J., AND REGEN, D., Biochem. J., 73, 573 (1959).
PARK, C. R., REINWEIN, D., HENDERSON, M. J., CADENAS, E., AND MORGAN, H. E., Am. J. Med., 26, 684 (1959).
MORGAN. H. E.. HENDERSON. M. J.. REGEN, D. M.. AND PARK. C. R., Ann. k. Y. Acad. Sk., 82; 387 (1959).
KREBS, H. A., AND HENSELEIT, K., Hoppe-Xeyl. Z., 210, 33 (1932).
BLEEHEN, N. M., AND FISHER, R. B., J. Physiol., 123, 260 (1954).
PARTRIDGE, S. M., Nature (London), 164, 443 (1949). FISHER, R. A., AND YATES, F., Statistical tables for biological,
agricultural and medical research, 2nd edition, Oliver and Boyd, Ltd., London, 1943.
(1934). 19. GEMMILL, C. L., AND HAMMON, L., JR., Bull. Johns Hopkins
Hosp., 68, 50 (1941). 20. KIPNIS, D. M., Ann. N. Y. Acad. Xci., 82, 354 (1959). 21. KIPNIS, D. M., AND CORI, C. F., J. Biol. Chem., 224,681 (1957). 22. PARK, C. R., in W. D. MCELROY AND B. GLASS (Editors),
Symposium on phosphorus metabolism, Johns Hopkins Press, Baltimore, 1952, p. 634.
23. FISHER, R. B., AND LINDSAY, D. B., J. Physiol., 131,526 (1956). 24. KIPNIS, D. M., HELMREICH, E., AND CORI, C. F., J. Biol.
Chem., 234, 165 (1959). 25. POST, R. L., MORGAN, H. E., AND PARK, C. R., J. Biol. Chem.,
236, 269 (1961). 26. LEFEVRE, P. G., Symposia Sot. Esptl. Biol., 8, 118 (1954). 27. WIDDAS, W. F., J. Physiol., 126, 163 (1954). 28. PARK, C. R., POST, R. L., KALMAN, C. F., WRIGHT, J. H., JR.,
JOHNSON, L. H., AND MORGAN, H. E., Ciba Foundation Colloquia on endocrinology, Vol. 9; in G. E. W. WOLSTEN- HOLME AND M. P. CAMERON (Editors), Little, Brown and Company, Boston, 1956, p. 240.
29. CRANE, R. K., AND SOLS, A., in S. P. COLOWICK AND N. 0. KAPLAN (Editors), Methods in enzymology, Vol. I, Academic Press, Inc., New York, 1955, p. 277.
30. SOLS, A. AND CRANE, R. K., J. Biol. Chem., 210, 581 (1954). 31. MORGAN, H. E., CADENAS, E., REGEN, D. M., AND PARK, C.
R., J. Biol. Chem., 236, 262 (1961). 32. HENDERSON, M. J., MORGAN, H. E., AND PARK, C. R., J.
Biol. Chem., 236, 273 (1961).
by guest on May 8, 2018
http://ww
w.jbc.org/
Dow
nloaded from
H. E. Morgan, M. J. Henderson, D. M. Regen and C. R. ParkISOLATED, PERFUSED HEART OF NORMAL RATS
THEANOXIA ON GLUCOSE TRANSPORT AND PHOSPHORYLATION IN Regulation of Glucose Uptake in Muscle: I. THE EFFECTS OF INSULIN AND
1961, 236:253-261.J. Biol. Chem.
http://www.jbc.org/content/236/2/253.citation
Access the most updated version of this article at
Alerts:
When a correction for this article is posted•
When this article is cited•
to choose from all of JBC's e-mail alertsClick here
http://www.jbc.org/content/236/2/253.citation.full.html#ref-list-1
This article cites 0 references, 0 of which can be accessed free at
by guest on May 8, 2018
http://ww
w.jbc.org/
Dow
nloaded from