regulation of histone methylation and reprogramming of ... · pdf fileregulation of histone...
TRANSCRIPT

Regulation of Histone Methylation and Reprogramming ofGene Expression in the Rice Inflorescence Meristem
Xiaoyun Liu,a,1 Shaoli Zhou,a,1 Wentao Wang,a Yiran Ye,a Yu Zhao,a Qiutao Xu,a Chao Zhou,a Feng Tan,a
Saifeng Cheng,a and Dao-Xiu Zhoua,b,2
a National Key Laboratory of Crop Genetic Improvement, Huazhong Agricultural University, 430070 Wuhan, Chinab Institute Plant Science Paris-Saclay (IPS2), Université Paris-sud 11, 91405 Orsay, France
ORCID IDs: 0000-0002-5740-9777 (X.L.); 0000-0001-9111-1598 (S.Z.); 0000-0003-2712-3521 (S.C.); 0000-0002-1540-0598 (D.-X.Z.)
Rice inflorescence meristem (IM) activity is essential for panicle development and grain production. How chromatin andepigenetic mechanisms regulate IM activity remains unclear. Genome-wide analysis revealed that in addition to genesinvolved in the vegetative to reproductive transition, many metabolic and protein synthetic genes were activated in IMcompared with shoot apical meristem and that a change in the H3K27me3/H3K4me3 ratio was an important factor for thedifferential expression of many genes. Thousands of genes gained or lost H3K27me3 in IM, and downregulation of the H3K27methyltransferase gene SET DOMAIN GROUP 711 (SDG711) or mutation of the H3K4 demethylase gene JMJ703 eliminatedthe increase of H3K27me3 in many genes. SDG711-mediated H3K27me3 repressed several important genes involved in IMactivity and many genes that are silent in the IM but activated during floral organogenesis or other developmental stages.SDG711 overexpression augmented IM activity and increased panicle size; suppression of SDG711 by RNA interference hadthe opposite effect. Double knockdown/knockout of SDG711 and JMJ703 further reduced panicle size. These results suggestthat SDG711 and JMJ703 have agonistic functions in reprogramming the H3K27me3/H3K4me3 ratio and modulating geneexpression in the IM.
INTRODUCTION
Rice (Oryza sativa) grain yield is mainly determined by number ofpanicles per plant, grain number per panicle, and grain weight.Among these factors, grain number per panicle contributesthe most to grain yield (Sakamoto and Matsuoka, 2008; Xingand Zhang, 2010), and grain number, in turn, depends on in-florescence meristem (IM) activity to produce the primarybranches and later spikelets during panicle development. Theshift from the shoot apical meristem (SAM) to IM is accompaniedby clear changes in a number of developmental and morpho-logical traits. In rice, the first morphological change is a rapidincrease in meristem size (Itoh et al., 2005). Genes involved inthe vegetative to reproductive transition in rice include LEAFY-LIKE/ABERRANT PANICLE ORGANIZATION2 (RFL/APO2),SEPETALLA-LIKE MADS34/PANICLE PHYTOMER2 (MADS34/PAP2), and three APETALA1 (AP1)/ FRUITFULL-like genes(MADS14, MADS15, andMADS18); these genes are activated inthe meristem during the transition and are required for panicledevelopment (Fornara et al., 2004; Gao et al., 2010; Ikeda-Kawakatsu et al., 2012; Kobayashi et al., 2012). After the transi-tion, the IM starts to initiate panicle branch meristem primordia.Several rice transcription factor genes have been shown to reg-ulate IM activity, panicle branching, and grain production. Forinstance, increased expression of SPL14 (SQUAMOSA PROMOTER
BINDING PROTEIN-LIKE14) promotes panicle branching andgrain yield (Jiao et al., 2010; Miura et al., 2010). IM activity alsorequires cytokinins (Han et al., 2014) and rice genes involved incytokinin accumulation in the IM regulate panicle branching andgrain production. For instance, LONELY GUY (LOG), whichencodes a novel enzyme that works in the final step of bioactivecytokinin synthesis, maintains rice IM activity and promotespanicle branching (Kurakawa et al., 2007). Reduced expressionof the rice cytokinin oxidase gene GN1a/CKX2 causes accu-mulation of active cytokinins in the IM and increases the grainnumber (Ashikari et al., 2005). Therefore, regulation of IM sizeand activity is crucial to determining rice grain production. How-ever, chromatin and epigenetic mechanisms implicated in regu-lating rice IM activity and panicle development remain unknownat the present time.Important epigenetic regulators of developmental processes
are the Polycomb-group (PcG) and Trithorax-group proteins,which catalyze histone H3 lysine 27 trimethylation (H3K27me3)or H3 lysine 4 trimethylation (H3K4me3), respectively (Pien andGrossniklaus, 2007; Steffen and Ringrose, 2014). The presenceof H3K27me3 is largely correlated with gene silencing in animaland plant cells. In plants, the H3K27me3-marked genes havevery low expression levels and often exhibit a high degree oftissue specificity (Zhang et al., 2007; Makarevitch et al., 2013),consistent with a function of H3K27me3 in maintaining generepression during growth. H3K27me3 has been implicated inregulation of many plant developmental pathways, includingseed development, flowering time, vernalization, and organidentity (reviewed in Köhler and Villar, 2008; Zheng and Chen,2011). Whole-genome chromatin immunoprecipitation (ChIP)experiments have shown that ;20% of Arabidopsis thaliana andrice genes are marked by H3K27me3 (He et al., 2010; Lafos
1 These authors contributed equally to this work.2 Address correspondence to [email protected] author responsible for distribution of materials integral to the findingspresented in this article in accordance with the policy described in theInstructions for Authors (www.plantcell.org) is: Dao-Xiu Zhou ([email protected]).www.plantcell.org/cgi/doi/10.1105/tpc.15.00201
The Plant Cell, Vol. 27: 1428–1444, May 2015, www.plantcell.org ã 2015 American Society of Plant Biologists. All rights reserved.
et al., 2011). In both plants and animals, a remarkable number oftranscription factors are targeted by H3K27me3 (Köhler andVillar, 2008; Zheng and Chen, 2011), further supporting the roleof H3K27me3 in the regulation of developmental gene expres-sion. Moreover, the levels of H3K27me3 were profiled in severalplant tissues (Wang et al., 2009b; Lafos et al., 2011). Thesestudies revealed large tissue-specific variation in H3K27me3levels with many genes shown to gain or lose H3K27me3 duringcell differentiation, demonstrating dynamic regulation of thisepigenetic modification in responding to developmental signalsin plants. In addition, H3K27me3 marks many stress-induciblegenes; these marks are removed upon application of environ-mental signals or stresses (Charron et al., 2009; Li et al., 2013),suggesting that H3K27me3 is also dynamically regulated in re-sponse to environmental cues in plants.
About 40% of plant genes are marked by H3K4me3, whichaccumulates predominantly in 59 of the genes (Zhang et al.,2009; He et al., 2010; Hu et al., 2012). Genes predominantlymarked with H3K4me3 are actively transcribed in plants.H3K4me3 has been shown to play an important role in geneexpression involved in plant development and stress adaptation(Avramova, 2009; Fromm and Avramova, 2014). Mutation ofgenes involved in H3K4 methylation and demethylation affectedgenome activity and plant growth (reviewed in Berr et al., 2011;Chen et al., 2011). For instance, mutation of JMJ703, an H3K4demethylase gene, affects cell division in rice, resulting in re-duced plant height with shorter internodes and smaller panicles(Chen et al., 2013).
H3K4me3 and H3K27me3 are considered to be mutually re-pulsive and antagonist marks for gene activity. However, manygenes are simultaneously marked by both H3K4me3 andH3K27me3 (Zhang et al., 2009; He et al., 2010; Hu et al., 2012),referred to as “bivalent” domains (Young et al., 2011; Voigt et al.,2013). The bivalent modifications were identified on a subset ofgenes in Arabidopsis (Sequeira-Mendes et al., 2014). It is sug-gested the simultaneous presence of the active and the re-pressive modifications and associated complexes helps tomaintain bivalent loci in a state that is both responsive to de-velopmental cues and at the same time insensitive to sub-threshold noise (Voigt et al., 2013).
A subset of the PcG proteins, including Enhancer of Zeste[E(z)], Extra sex combs (Esc), Su(z)12, and Nurf55 in Drosophilamelanogaster form the Polycomb-repressive complex2 (PRC2),which is involved in catalyzing the addition of H3K27me3(Schwartz and Pirrotta, 2008). Plants have clear homologs of thefour core protein components of PRC2, often with multiplegenes encoding each component. In Arabidopsis, CURLY LEAF(CLF), SWINGER (SWN), and MEDEA (MEA) encode E(z) ho-mologs. MEA appears to function primarily in gametophyte andseed development, whereas CLF and SWN are broadly ex-pressed and partially redundant in vegetative and reproductivedevelopment (Hennig and Derkacheva, 2009). The Arabidopsisclf swn double mutants show severe developmental defects(such as organ identity) and loss of H3K27me3 in vegetativetissues (Chanvivattana et al., 2004; Lafos et al., 2011), sug-gesting that PRC2 proteins also catalyze the addition ofH3K27me3 in plants. The rice genome contains two genes en-coding homologs of E(z) (CLF or SDG711 and EZ1 or SDG718),
Su(Z)12 (EMF2a and EMF2b), and ESC (FIE1 and FIE2) (Luo et al.,2009; Liu et al., 2014).In this work, we studied genome-wide levels of the H3K27me3
and H3K4me3 modifications and gene expression during theSAM-to-IM transition in rice and examined the function ofSDG711 and JMJ703 in this process. The analysis revealedthat change of H3K27me3/H3K4me3 ratio during the transitionwas critical for genome-wide gene expression reprogrammingin IM and that both SDG711 and JMJ703 were required foracquisition of H3K27me3 on thousands of genes in the IM,including those known to be involved in IM activity and panicledevelopment.
RESULTS
SDG711 Is Involved in the Control of Panicle MeristemActivity and Gene Expression
We recently characterized transgenic and mutant plants for therice E(z) genes SDG711 and SDG718 (Liu et al., 2014). We ob-served that SDG711 expression levels affected panicle size:Overexpression of SDG711 led to the production of largerpanicles with more primary branches and spikelets, andSDG711 RNA interference (RNAi) had the opposite effect (Figure1A). Histological analysis of the IM revealed that the number ofprimary branch primordia increased and decreased in theoverexpression and RNAi lines, respectively, compared withwild-type plants (Figure 1B), suggesting that SDG711 expres-sion was important for IM activity. In situ hybridization experi-ments detected SDG711 transcripts throughout the IM withhigher levels in the primordia of primary branches, spikelets, andflorets (Figure 1C). The hybridization signals became weaker inmore advanced stages of panicle development. Quantitative RT-PCR analysis indicated that SDG711 transcript level was rela-tively high in the IM at early stages and gradually decreasedduring IM growth (Figure 1D), confirming the in situ hybridizationresults. These observations suggested that the expression ofSDG711 was dynamic in IM and might be involved in re-programming the expression of genes involved in IM activity andpanicle development.To study gene expression changes during the SAM-to-IM
transition and to examine the function of SDG711 in the pro-cess, we analyzed the transcriptomes of wild-type SAM and IMand SDG711 RNAi IM (lines 3, 7, and 9 combined) (Liu et al.,2014). The developmental stages of SAM and IM were de-termined as previously described (Itoh et al., 2005). Precisely,SAMs were harvested from 4-week-old plants at the 6- to 7-leafstage, and IMs (;1 to 2 mm) were collected from 6- to 7-week-old SDG711 RNAi plants and 7- to 8-week-old wild-type grownin the field during the May to June period in the Wuhan area (seeMethods). To avoid effects due to tissue culture for the trans-genic plants, wild-type plants used in this study were regen-erated from callus culture. Two biological replicates weresequenced with the Illumina HiSeq-2000 sequencing systemand analyzed by using TopHat (version 2.0.13) to align the cleantags filtered by Trimmomatic (version 0.32) to the referencegenome of Nipponbare (version 7.0). Cufflinks (version 2.2.1)
Epigenetic Regulation of Rice Panicle Development 1429

was used for identification of differentially expressed genes(see Methods). About 21 to 34 million clean reads per samplewere obtained. More than 95% of the clean reads for eachsample were mapped to the reference genome (SupplementalFigure 1A). The two replicates displayed a high repeatability(R2 > 0.96) (Supplemental Figure 1B). A total of 15,491 and15,949 genes were expressed in wild-type SAM and IM, re-spectively (Supplemental Figure 1C). A number of transposableelement (TE) genes were found to be expressed, but the transcriptlevels were relative low (Supplemental Figures 1C and 1D). In IM,1616 and 1010 genes were respectively up- and downregulatedmore than 2-fold (P value < 0.05) compared with SAM (Figure 2A).When we analyzed the differentially regulated genes, we foundthat many metabolic pathways were enriched (false discoveryrate [FDR] < 0.01) for upregulation (Supplemental Table 1). Most
of the enriched pathways were related to photosynthesis, gly-colysis, amino acid biosynthesis, and phenylpropanoid bio-synthesis, indicating that general metabolic and protein syntheticactivities were higher in IM. In addition, genes involved inhormone signal transduction were also found to be enriched(FDR < 0.01) among the upregulated genes (SupplementalTable 1). A similar number of expressed genes (15,922) weredetected in SDG711 RNAi IM (Supplemental Figure 1A).Compared with the wild type, 1199 genes were upregulatedand 780 were downregulated (>2-fold, P value < 0.05) (Figure2A). About 42.5% (518/1199 genes) of the upregulated genesoverlapped with those induced in IM, while only 4% (50/1199)corresponded to those repressed in IM (Supplemental Figure2). In addition, genes of some metabolic pathways upregu-lated in wild-type IM were further induced by SDG711 RNAi
Figure 1. Up- and Downregulation of SDG711 Affected Panicle Development.
(A) Panicle phenotypes of SDG711 overexpression (OX), gain-of-function mutant (sdg711), and RNAi plants compared with the wild type (WT). Means6SD of primary branches and spikelets per panicle (n = 30) are presented on the right. Significant differences between the transgenic or mutant plants andthe wild type (Student’s t tests, P value < 0.01) are marked by double asterisks.(B) Longitudinal section of inflorescence meristem from the indicated genotypes.(C) In situ hybridization of SDG711 transcripts at different developmental stages of the inflorescence meristem. Length of the meristem was ;1 mm in(a), 0.25 mm in (b), 0.5 mm in (c), 1.5 mm in (d), and 3 mm in (e). Probe used was sense in (a) and antisense in (b) to (e).(D) Quantitative RT-PCR analysis of SDG711 transcripts in inflorescence meristem (at different developmental stages), stem, leaf, and seedling. Levelsrelative to ACTIN transcripts are presented (y axis).
1430 The Plant Cell

(Supplemental Table 1). These observations suggested thatSDG711 might have a function to repress genes upregulatedduring the SAM-to-IM transition.
When we analyzed the categories of the differentiallyexpressed genes, we found that those encoding protein kinases(RGAP version 7.0 annotation) and transcription factors (http://drtf.cbi.pku.edu.cn) were significantly enriched (Fisher’s tests,P value < 0.05), with 123 and 75 transcription factor genes and70 and 51 protein kinase genes being up- and downregulated,respectively, in IM compared with SAM (Figure 2A). Differentiallyregulated transcription factors genes found in SDG711 RNAi IMwere also significantly enriched (Fisher’s tests, P value < 0.05),with 70 and 40 being up- and downregulated, respectively,compared with the wild type (Figure 2B). Several specific tran-scription factor families were enriched among the differentiallyexpressed genes (Fisher’s tests, P value < 0.05) (Figure 2B).
Among the differentially regulated transcription factor genes,the three AP1-like genes (MADS15,MADS18, andMADS14) andthe SEP-like gene (MADS34/PAP2), which are IM mark genesand have overlapping function to specify the panicle meristemidentity (Kobayashi et al., 2012), were upregulated by 5- to 355-fold (P value <0.05) in wild-type IM compared with SAM (Table1). In addition, RFL/APO2, the rice ortholog of LEAFY (anothermarker gene of the vegetative to reproductive transition) (Raoet al., 2008; Ikeda-Kawakatsu et al., 2012), was also upregulatedin IM. These data confirmed the developmental stages of thecollected meristem samples. Other transcription factor genes
previously shown to be involved in panicle development werefound to be upregulated, including MADS56 (Ryu et al., 2009),SPL14 (Jiao et al., 2010; Miura et al., 2010), EATB (Ethylene-responsive factor Associated with Tillering and panicle Branch-ing) (Qi et al., 2011), AP2-39 (Yaish et al., 2010), and the GATAC2C2 zinc finger transcription factor gene (Os05g50270) (Wanget al., 2009a). Conversely, other transcription factor genes,such as MADS23 and MADS27 (which are AGL17 homologs),and a few AP2 genes (AP22-106, AP2-125, and AP2-33/IDS1[INDETERMINATE SPIKELET1]) (Lee and An, 2012) were foundto be among the downregulated genes in IM (Table 1).In SDG711 RNAi plants, we observed that the expression of
MADS34/PAP2 was decreased and that of EATB and JAZ1/EG2(EXTRA GLUME2; which encodes a zinc finger protein involvedin spikelet development) (Cai et al., 2014) was upregulated bymore than 2-fold (Table 1). In addition, many genes involved inauxin and cytokinin biosynthesis and signaling were differen-tially expressed in wild-type IM versus SAM or in SDG711 RNAiIM compared with the wild type (Table 1). Remarkably, severalauxin biosynthesis (TDC2 and YUC9) and responsive genes(GH3-2, GH3-6, SAUR23, SAUR11, IAA3, and IAA8) and cy-tokinin oxidase genes (i.e., CKX2/Gn1a and CKX4) were up-regulated by more than 2-fold in SDG711 RNAi IM (Table 1).Conversely, the cytokinin A-type responsive regulator gene RR3was repressed by more than 6-fold (Table 1).To confirm the RNA-seq data, we performed RT-PCR analy-
sis of CKX gene family in IM of wild-type, SDG711 RNAi, and
Figure 2. Differential Gene Expression between IM and SAM and between SDG711 RNAi IM and the Wild Type.
(A) Left histograms: numbers of up- and downregulated genes (>2-fold, P value < 0.05) between IM and SAM and between SDG711 RNAi IM and thewild type (WT). Right histograms: numbers of protein kinase and transcription factor (TF) genes differentially regulated in IM compared with SAM or inSDG711 RNAi compared with the wild type. Significant enrichments (Fisher’s tests, P value <0.05) are indicated by asterisks.(B) Relative enrichments of transcription factor families. Significant enrichments (Fisher’s tests, P value <0.05) are indicated by asterisks. Down/upregulated genes numbers are indicated below the bars. Fold changes are differences relative to the observed frequencies of specific subsets withinthe genome.
Epigenetic Regulation of Rice Panicle Development 1431

overexpression (lines 2, 4, and 5 combined) plants and a gain-of-function mutant (sdg711) (Liu et al., 2014). The analysis re-vealed that the expression of several members (i.e., CKX2/Gn1a,CKX3, CKX4, CKX5, CKX10, and CKX11) of this gene family wasincreased in the RNAi lines but repressed in the overexpressionplants and the gain-of-function mutant (Supplemental Figure3A). Gn1a/CKX2 is expressed in IM and its expression level af-fects panicle size (Ashikari et al., 2005). We performed in situhybridization to analyze the transcript levels of Gn1a/CKX2 in IMof different genotypes. The experiments revealed lower tran-script levels of the gene in the overexpression and higher levelsin the RNAi compared with wild-type plants (SupplementalFigure 3B). Dosage of cytokinins in IM revealed that differenttypes of active cytokinins were increased in the overexpressionand decreased in the RNAi plants compared with the wild type(Supplemental Figure 3C). These data suggested that thepanicle phenotype of SDG711 transgenic plants may be partlyrelated to CKX genes expression and cytokinin levels in themeristem. In addition, quantitative RT-PCR was performedto validate the RNA-seq data of 18 genes with or without
differential expression between SAM and IM or between the wildtype and SDG711 RNAi IM (Supplemental Figure 4).
Genome-Wide H3K27me3 and H3K4me3 Changes duringthe SAM-to-IM Transition
To study H3K27me3 changes during the vegetative-to-reproductiontransition in rice and examine the function of SDG711, we an-alyzed genome-wide H3K27me3 in SAM and IM of callus-regenerated wild-type and SDG711 RNAi plants by ChIP-seq.H3K4me3 is generally thought to be antagonistic to H3K27me3in the regulation of gene expression. In addition, previous datashowed that mutation of H3K4me3 demethylase gene JMJ703affected panicle size (Chen et al., 2013). To study the functionalrelationship between H3K27me3 and H3K4me3 during the tran-sition, we investigated genome-wide H3K4me3 levels in wild-typeSAM and IM and H3K4me3 and H3K27me3 in jmj703 mutant IM(from 7- to 8-week-old plants). SAM and IM were harvested atthe same stages as for the RNA-seq sample collection. Theprecipitated DNAs were sequenced by the Illumina HiSeq-2000
Table 1. Relative Transcript Levels and H3K27me3 Changes of Panicle Development and Hormone-Related Genes in IM Compared to SAM and inSDG711RNAi IM Compared to the Wild Type
Gene Name Locus Number IM/SAM (H3K27me3) SDG711RNAi IM/Wild Type (H3K27me3)
MADS15/AP1 LOC_Os07g01820 355.60 (↓) 0.51 (2)MADS34/PAP2 LOC_Os03g54170 200.86 (↑) 0.36 (↓)MADS14/AP1 LOC_Os03g54160 15.24 (2) 0.72 (↓)MADS18/AP1 LOC_Os07g41370 5.06 (2) 1.05 (↓)MADS56 LOC_Os10g39130 3.43 (2) 1.06 (↓)MADS23 LOC_Os08g33488 0.41 (↑) 0.80 (↓)MADS27 LOC_Os02g36924 0.33 (↑) 1.01 (↓)AP2-33/IDS1 LOC_Os03g60430 0.43 (↑) 0.56 (↓)AP2-106 LOC_Os07g22730 0.06 (↑) 0.85 (↓)AP2-121 LOC_Os03g09170 3.59 (2) 3.08 (↓)AP2-123 LOC_Os09g28440 3.62 (2) 2.22 (↓)AP2-125 LOC_Os03g08470 0.30 (↑) 1.05 (↓)AP2-163 LOC_Os03g64260 2.05 (↓) 2.09 (2)C2C2-GATA LOC_Os05g50270 3.77 (↓) 0.85 (2)JAZ1/EG2 LOC_Os04g55920 1.56 (↑) 2.65 (↓)EATB LOC_Os09g28440 3.62 (2) 2.22 (↓)RFL/APO2 LOC_Os04g51000 4.24 (2) 1.20 (↓)LOG LOC_Os01g40630 4.14 (2) 2.03 (↓)SPL14 LOC_Os08g39890 4.54 (2) 1.11 (2)TDC2 LOC_Os08g04540 2.62 (↓) 5.32 (2)YUC9 LOC_Os01g16714 0.87 (↓) 2.02 (2)PIN9 LOC_Os01g58860 11.75 (2) 1.88 (↓)IAA8 LOC_Os02g49160 1.62 (2) 3.43 (2)IAA3 LOC_Os12g40900 1.49 (↑) 2.25 (↓)GH3-2 LOC_Os01g55940 11.21 (2) 2.96 (↓)GH3-6 LOC_Os05g05180 1.99 (2) 2.06 (↓)SAUR23 LOC_Os04g56690 24.39 (2) 5.85 (↓)SAUR11 LOC_Os02g42990 4.77 (2) 2.61 (2)CKX4 LOC_Os01g71310 1.52 (2) 2.05 (↓)CKX2/GNA1 LOC_Os01g10110 1.37 (↑) 2.12 (↓)RR11 LOC_Os02g42060 3.27 (2) 0.66 (2)RR3 LOC_Os02g58350 0.79 (2) 0.16 (2)
Fold changes for transcripts are indicated. Genes gained or lost H3K27me3 are indicated by upwards and downwards arrows, respectively. Geneswithout change of H3K27me3 are indicated by minus signs.
1432 The Plant Cell

sequencing system. The analyzed materials and the ChIP-seqdata are listed in Supplemental Table 2. Clean reads werealigned with the reference genome (The Institute for GenomicResearch, TIGR version 7.0) using Bowtie2 (version 2.1.0) todetermine the frequency of reads matching each genomicbase pair position. Differential H3K27me3 levels between dif-ferent samples were observed at specific genomic locations,while most regions were at about similar levels (SupplementalFigure 5). More than 10,000 H3K27me3 and 20,000 H3K4me3peaks were identified (P value <1e-5) using MACS (Version 1.4)(Supplemental Table 2). From 65 to 74% of H3K27me3 peakswere found to match with genes (non-TE), 10 to 12% to TEs,and 16 to 23% in the intergenic region. By contrast, more than84% of H3K4me3 peaks mapped to non-TE genes (SupplementalFigure 6).
To analyze the function of H3K27me3 and H3K4me3 in geneactivity, we examined the quantitative relationships between theChIP-seq and the RNA-seq reads using contour plots. As ex-pected, we observed a positive correlation between levels ofH3K4me3 (tags per million [TPM]), but not H3K27me3, and
transcript abundance (reads per kilobase per million reads[RPKM]) in both SAM (R2 =0.219) and IM (R2 = 0.362)(Supplemental Figures 7A and 7B). Interestingly, H3K27me3 andH3K4me3 in both SAM (R2 = 0.471) and IM (R2 = 0.282) dis-played a positive correlation in the contour plots, in which a bi-modal distribution pattern was observed (Supplemental Figure7C). This bimodal distribution pattern of the two epigeneticmarks was also observed in rice seedlings (He et al., 2010),suggesting that there might be a concurrence of H3K27me3 andH3K4me3 in many genes. Next, we analyzed the change ofH3K27me3 and H3K4me3 levels between IM and SAM. Wefound a bimodal distribution of the changes of both epige-netic marks between the two meristems (Figure 3A), in-dicating that the amounts (TPM) of H3K27me3 and H3K4me3on many genes increased in IM, but genes with higher in-creases of H3K27me3 showed lower levels of H3K4me3, andvice versa. Comparison between the ChIP-seq and RNA-seq data revealed that upregulated genes in IM were mostlydistributed in genes with lower H3K27me3/H3K4me3 ra-tios and downregulated genes were found to have higher
Figure 3. Quantitative Changes (TPM) of H3K27me3 and H3K4me3 and Correlation with Differential Gene Expression between IM and SAM andbetween SDG711 and the Wild Type.
(A) Contour plots of H3K4me3 and H3K27me3 changes between IM and SAM.(B) Distribution of up- and downregulated genes (>2-fold, P value <0.05) in IM compared with SAM.(C) Box plots of up- and downregulated, unchanged, and all rice genes relative to H3K27me3/H3K4me3 ratio. P values (t tests) from comparisonbetween differentially regulated gene and unchanged or all genes are indicated.(D) Contour plots of H3K4me3 and H3K27me3 changes between SDG711 RNAi and the wild type.(E) Distribution of different fractions of H3K27me3 TPM ratio between SDG711 RNAi and the wild type (WT). The ratio of ;74% of genes was below 1.y axis, percentage of genes.(F) Distribution of upregulated genes (>2-fold, P value <0.05) on TMP ratio fractions of H3K27me3 or H3K4me3 between SDG711 RNAi and the wildtype. y axis, gene numbers.
Epigenetic Regulation of Rice Panicle Development 1433
H3K27me3/H3K4me3 ratios (Figures 3B and 3C). These ob-servations suggested that change of H3K27me3/H3K4me3 ratiowas implicated in overall gene expression changes during theSAM-to-IM transition.
Differential H3K27me3 between Shoot andPanicle Meristems
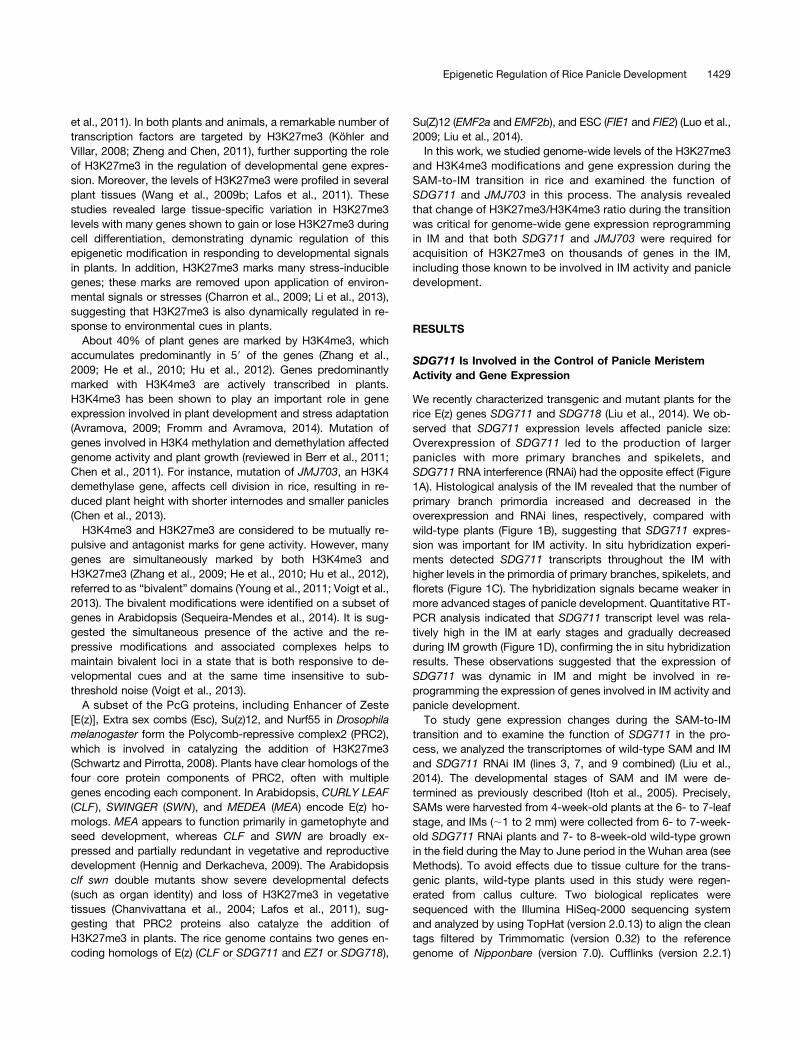
Globally, H3K27me3 or H3K4me3 in the different meristem sam-ples displayed about the same profiles along chromosomes(Figure 4A). However, clear differences of H3K27me3 in discretechromosomal locations could be observed between SAM andIM (Figures 4A and 4B), suggesting that changes in contiguousH3K27me3-marked genomic regions might occur during theSAM-to-IM transition (Figure 4B). We identified a total of 15,247genes marked by H3K27me3 in SAM and 13,954 in IM, repre-senting 25 to 27% of total genes (Figure 5A). For H3K4me3, weidentified 26,562 genes in SAM and 26,474 in IM, corresponding
to ;47% of total rice genes (Figure 5B). The percentages ofboth types of marked genes were comparable to previous datain rice and Arabidopsis (Cui et al., 2010; He et al., 2010; Lafoset al., 2011). The H3K27me3-marked genes displayed a highertissue specificity score compared with unmarked genes(Supplemental Figure 8), confirming the notion that H3K27me3preferentially marks developmental genes (Kinoshita et al., 2001;Chanvivattana et al., 2004; Schubert et al., 2005). There were10,233 genes (representing 67% of those marked in SAMand 73% in IM) marked commonly in both meristems. Com-pared with SAM, IM showed a gain of 3721 and a loss of 5014H3K27me3-marked genes (Table 2). By contrast, most of theH3K4me3-marked genes (97%) were common in both the SAMand IM (Figure 5B).Analysis of the differentially marked genes revealed that
several cellular pathways were enriched for gain of H3K27me3 inIM (Supplemental Table 3). In addition, transcription factor andprotein kinase genes were enriched for gain or loss of H3K27me3
Figure 4. Heat Map of H3K27me3 and H3K4me3 Levels and Transcript Abundance on Chromosome 3.
(A) Comparison between SAM and IM from different genotypes. Regions with clear difference between SAM and IM are indicated by asterisks. Relativeabundance of TEs and genes of the chromosome are indicated.(B) Close-up view of the H3K27me3-marked region indicated by the red asterisk.
1434 The Plant Cell

in IM (Fisher’s tests, P value < 0.05) (Table 2). Further analysisrevealed that some of transcription factor subfamilies (such asARF, Aux/IAA, MADS, AP2, TCP, etc.) were enriched for differ-ential H3K27me3 in IM (Supplemental Figure 9).
When compared with the RNA-seq data, we found no gen-eral correlation between loss or gain of H3K27me3 and up- ordownregulation of gene expression (>2-fold) (Table 2). Never-theless, we observed that the expression of a number of genesencoding transcription factors, protein kinases, and metabolicenzymes was correlated with the gain or loss of H3K27me3during the SAM-to-IM transition (Supplemental Data Set 1).Among the upregulated IM and panicle development regulatorygenes, MADS15 (AP1-like), MADS5 (SEP1-like), and the GATAC2C2 zinc finger gene (Os05g50270) were found to loseH3K27me3 (Table 1). Conversely, downregulated transcriptionfactor genes such asMADS23,MADS27, AP22-106, AP2-125, andAP2-33/IDS1 gained H3K27me3 in IM (Table 1). Several highly
upregulated genes involved in photosynthesis (e.g., light-harvestingcomplex I chlorophyll a/b binding protein 1, Os06g21590), gly-colysis (e.g., pyruvate decarboxylase, Os03g18220), cytokininsynthesis (e.g., cytokinin dehydrogenase, Os01g56810), and li-noleic acid metabolism (e.g., lipoxygenase Os12g37260) lostH3K27me3 (Supplemental Data Set 1). Quantitative ChIP-PCRwas performed to validate the ChIP-seq data of 14 genes with orwithout differential H3K27me3 between SAM and IM (SupplementalFigure 4A).
Effect of SDG711 RNAi on Genome-Wide H3K27me3 in theInflorescence Meristem
Compared with wild-type IM, SDG711 RNAi reduced the amountof H3K27me3 (TPM) of a majority of the marked genes (RNAi/wildtype < 1) (Figures 3D and 3E). Consequently, the changes of thetwo marks in SDG711 RNAi IM were not correlated and a waterdrop-like, instead of a bimodal, pattern was observed (Figure 3D).Comparison with the RNA-seq data revealed that upregulatedgenes (>2-fold, P value < 0.05) in SDG711 RNAi IM were mostlydistributed in genes with reduced H3K27me3 (RNAi/wild type < 1)and increased H3K4me3 (RNAi/wild type > 1) levels (Figure 3F),supporting that the change of H3K27me3/H3K4me3 ratio wasimportant for gene activity.Peak analysis revealed a loss of 5406 and a gain of 1378
H3K27me3-marked genes and a relative smaller change ofH3K4me3-marked genes (with a gain of 1513 and a loss of 576genes) in SDG711 RNAi IM (Figures 5C and 5D). There was noenrichment between loss of H3K27me3 and gain of H3K4m3,while enrichment between loss of H3K4me3 and loss of H3K27me3was observed (Supplemental Table 4). Interestingly, 56% (2083out of 3721) of the genes that gained H3K27me3 in wild-type IM(compared with SAM) were found to lose the mark in SDG711RNAi (Figure 5A). In addition, most of the cellular pathwaysthat were enriched for gain of H3K27me3 in wild-type IM werefound to be enriched for loss of H3K27me3 in SDG711 RNAi
Figure 5. Venn Diagrams of Differentially Marked Genes by H3K27me3and H3K4me3, between SAM and IM, and between SDG711 RNAi orjmj703 IM and the Wild Type.
Differentially marked genes by H3K27me3 ([A], [C], and [E]) andH3K4me3 ([B], [D], and [F]) between SAM and IM ([A] and [B]) andbetween SDG711 RNAi ([C] and [D]) or jmj703 IM and the wild type ([E]and [F]). Black circle represents overlap between genes that lostH3K27me3 in SDG711 RNAi or in both SDG711 RNAi and jmj703 mutantIM and those gained H3K27me3 in IM relative to SAM.
Table 2. Numbers of Genes with Differential H3K27me3 in IMCompared to SAM and in SDG711 RNAi IM Compared to the Wild Type
IM/SAM
H3K27me3 Loss H3K27me3 Gain Genome
Total 5,014 (191↑140↓) 3,721 (122↑72↓) 55,546Protein kinases 168* (7↑5↓) 155* (6↑2↓) 1,600Transcription factors 219* (17↑13↓) 133* (9↑6↓) 1,549
SDG711 RNAi IM/wild type
K27me3 Loss H3K27me3 Gain Genome
Total 5,406 (134↑65↓) 1,378 (28↑16↓) 55,546Protein kinases 248* (4↑2↓) 39 (0↑0↓) 1,600Transcript factors 120 (11↑4↓) 36 (2↑0↓) 1,549
Numbers of genes that showed upregulation (indicated by upwardsarrows) or downregulation (indicated by downwards arrows) by morethan 2-fold (P value < 0.05) are in parentheses. Significant enrichments(Fisher’s tests, P value < 0.05) are indicated by asterisks.
Epigenetic Regulation of Rice Panicle Development 1435

IM (Supplemental Table 3). These observations suggested thatSDG711 was required for acquisition of H3K27me3 during SAM-to-IM transition. We found that 68 genes that showed bothupregulation and loss of H3K27me3 in SDG711 RNAi IM werealso upregulated (>2-fold) in wild-type IM (Supplemental Figure2 and Supplemental Data Set 2), suggesting that these IM-induced genes were repressed by SDG711-mediated H3K27me3.Seven genes that showed both upregulation and H3K27me3loss in SDG711 RNAi were downregulated (>2-fold) in wild-type IM compared with SAM (Supplemental Figure 2 andSupplemental Table 6), suggesting that SDG711-mediatedH3K27me3 was involved in the repression of these “SAM-induced” genes in IM.
We found that 248 kinase and 120 transcription factor geneslost H3K27me3, while relatively fewer genes of these categoriesgained H3K27me3 in the RNAi IM (Table 2). A majority of thedifferentially regulated genes involved in IM activity and panicledevelopment and in auxin and cytokinin synthesis or signalingwere found to lose H3K27me3 in the RNAi IM (Table1), amongwhich the panicle developmental genes (EBTA and JAZ1/EG2)(Qi et al., 2011; Cai et al., 2014), auxin-responsive genes (IAA3,GH3-2, and SAUR23), and CKX genes (CKX2/Gn1a and CKX4)were upregulated. In addition, many upregulated metabolicgenes were found to lose H3K27me3 (Supplemental Data Set 1).These genes might be targets for repression by SDG711-mediated H3K27me3 in IM. Quantitative ChIP-PCR was per-formed to validate the ChIP-seq data of four genes with orwithout differential H3K27me3 between SDG711 RNAi andwild-type IM (Supplemental Figure 4B).
Comparison of the present RNA-seq and H3K27me3 ChIPdata with rice transcriptomic data (http://ricexpro.dna.affrc.go.jp) revealed that 1820 H3K27me3-marked genes repressed inIM are expressed during floral organogenesis or other de-velopmental stages (Figure 6). About one-third (601/1820) of the
genes lost H3K27me3 in SDG711 RNAi IM (Figure 6), some ofwhich were derepressed (Figure 6; Supplemental Data Set 3).This analysis suggested that SDG711 was involved in H3K27me3of genes repressed in IM.
Functional Relationship between SDG711 and JMJ703 inH3K27me3 and Panicle Development
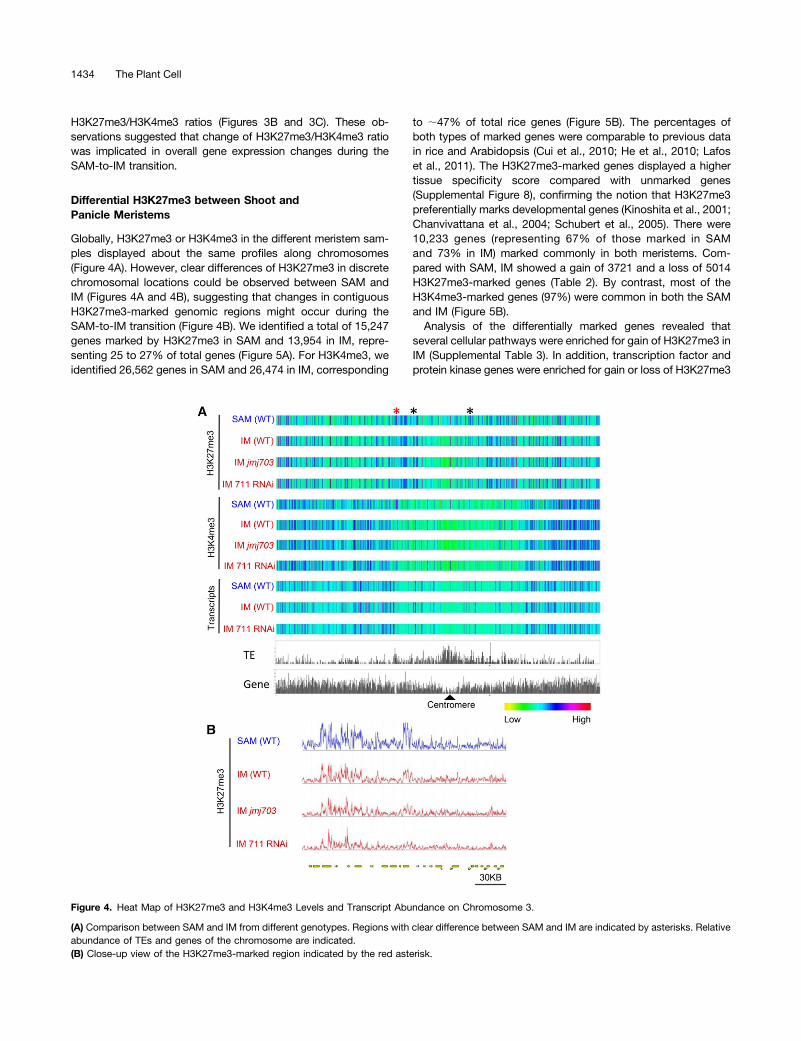
The jmj703 mutation resulted in a change of a relatively smallportion of genome-wide H3K4me3 (Figure 5F), which confirmedpreviously published data (Cui et al., 2013), but led to a loss of2957 and a gain of 2447 H3K27me3-marked genes in IM (Figure5E). Comparison of differentially marked genes in jmj703 andSDG711 RNAi plants revealed that 2307 out of 2952 (i.e., 2307 +645) (78%) genes that lost H3K27me3 in jmj703 overlapped withthose that lost the mark in SDG711 RNAi plants, 50% of which(1172/2307) corresponded to the genes that gained the mark inwild-type IM (Figures 5A and 5E). Conversely, 607 out of 1378(607+771) (44%) genes that gained H3K27me3 in SDG711 RNAiwere found to overlap with those that gained the mark in jmj703(Figure 5E). These observations suggested that JMJ703 mighthave a function in SDG711-mediated H3K27me3 in IM. LikeSDG711, JMJ703 expression in IM gradually decreased duringpanicle development (Figure 7A). To study the functional re-lationship between the two genes, we constructed the doubleknockdown/knockout plants by introducing the SDG711 RNAiconstruct into the jmj703 mutant. These plants displayed a moresevere panicle phenotype (Figures 7B to 7D). The expressionof CKX2/Gn1a in double knockdown/knockout plants washigher than in SDG711 RNAi or jmj703 mutant (Figure 7E),suggesting that the two genes had an additive function torepress the expression of CKX2/Gn1a. H3K27me3 ChIPanalysis of the CKX2/Gn1a locus revealed that H3K27me3levels decreased in SDG711RNAi but increased in overexpression
Figure 6. Involvement of SDG711-Mediated H3K27me3 in Maintaining Repression in IM of Genes That Are Expressed during Floral Organogenesis andOther Developmental Stages.
(A) Heat map of transcripts in the indicated organ/tissues of 1820 genes that were marked by H3K27me3 and repressed in IM.(B) Number of H3K27me3-marked genes in IM that are expressed in the indicated organs (red and blue bars). SDG711 RNAi reduced about one-third ofthe marked genes (red bars). Numbers of genes that were derepressed in SDG711 RNAi IM are indicated on the top of the bars.
1436 The Plant Cell

and gain-of-function mutant plants, whereas H3K4me3 levels(mostly at the 59end) of the gene were reversely regulated(Figures 8A and 8B). In jmj703 mutant, increases of H3K4me3and decreases of H3K27me3 were detected on the locus. In thedouble knockdown/knockout plants, we observed a further in-crease of H3K4me3 and a further decrease of H3K27me3 (Fig-ure 8C). In addition, overexpression of JMJ703 (under thecontrol of the maize ubiquitin gene promoter) reduced H3K4me3but augmented H3K27me3 on the locus (Figure 8C). These datasuggested a mutually repulsive relationship between H3K4me3and H3K27me3 on CXK2/Gn1a and revealed an agonistic rela-tionship between JMJ703 and SDG711 in regulating H3K27me3and H3K4me3 on the locus. ChIP analysis of wild-type plants with
anti-SDG711 (Liu et al., 2014) and Ubi-JMJ703-Flag transgenicplants with anti-Flag suggested that both SDG711 and JMJ703directly target to the CKX2 locus (Figure 8D).
DISCUSSION
H3K27me3 Is Dynamically Regulated during theSAM-to-IM Transition
Our data revealed differential gene expression and histonemethylation patterns in rice IM compared with SAM from plantsgrown in the paddy field in Wuhan. The weather conditions
Figure 7. SDG711 RNAi in jmj703 Mutant Background Further Reduced Panicle Size.
(A) Quantitative RT-PCR analysis of JMJ703 transcript levels (relative to ACTIN transcripts) in IM (at different stages), stem, leaf, and seedling.(B) Relative transcript levels (to ACTIN ) of SDG711 in jmj703, SDG711-RNAi, and the double knockdown/knockout lines compared with the wild type(WT).(C) Panicle phenotype of the indicated genotypes.(D) Spikelet numbers per panicle of the indicated genotypes. Bars = means 6 SD from 20 panicles per genotype. Significant differences (Student’st tests, P value <0.05) compared with the wild type are indicated by double asterisks (P value < 0.01). Significant difference between the doubleknockdown/knockout and SDG711 RNAi is indicated by single asterisks (P value < 0.05).(E) Relative transcript levels (to ACTIN ) of CKX2/Gn1a in IM of the indicated genotypes. For the RT-PCR data, bar = means 6 SD from three biologicalrepeats.
Epigenetic Regulation of Rice Panicle Development 1437
during the growth season may influence rice growth and flow-ering time to some extent, which may vary slightly year to yearbut are very constant in this major rice production area in China.We cannot exclude that some of the differential gene expressionand histone methylation between SAM and IM is related togrowth conditions. However, because the meristem size was the
criterion for SAM and IM sampling and the different genotypeswere grown under the same conditions, the high throughputdata should reflect the main difference between SAM and IMand between the different genotypes. In addition to genes reg-ulating the SAM-to-IM transition, genes of metabolic pathwayssuch as photosynthesis, secondary metabolism, glycolysis, and
Figure 8. SDG711 and JMJ703 Are Involved in Histone Modification and Repression of OsCKX2/Gn1a.
(A) Diagram of the CKX2/Gn1a locus. The transcribed region is represented by the thick line. Relative positions of the transcription start site (TSS) andthe primer sets (P1 to P4) used in ChIP experiments are indicated.(B) ChIP assay with anti H3K27me3 (left) and anti H3K4me3 (right) of IM chromatin of wild-type (DJ), SDG711 RNAi, gain-of-function mutant (sdg711),and overexpression (OX) plants.(C) ChIP assay with anti H3K27me3 (left) and anti H3K4me3 (right) of IM chromatin of SDG711 RNAi, jmj703 mutant, SDG711 and JMJ703 doubleknockdown/knockout, JMJ703 overexpression plants, and their respective wild-type plants (DJ and ZH11).(D) SDG711 and JMJ703 were associated directly with CKX2/Gn1a locus. ChIP assays were performed with the same samples as in (B) using anti-SDG711 (left) and with the indicated genotypes using anti-FLAG (right). Anti-IgG was used as controls in the ChIP assays.
1438 The Plant Cell

amino acid synthesis were highly induced, which may representa characteristic molecular feature that distinguishes IM fromSAM in rice (Supplemental Table 1). Possibly, the increasedmetabolic activity may be required to support the rapid growthof the inflorescence. A recent article also showed that metabolicactivity increased in rice young panicle (Sharma et al., 2012).
Furthermore, the high-throughput data analysis revealed thatmany TE-related genes were expressed in both SAM and IM,although their expression levels were relatively very low (RPKMof most TE is < 1; Supplemental Figure 1D). This is consistentwith previous data showing that many TE genes are transcrip-tionally active in maize shoot meristems (Ohtsu et al., 2007; Liet al., 2010; Martínez and Slotkin, 2012). In particular, a recentwork showed that many TEs are transcribed in rice vegeta-tive and reproductive shoot apex (Tamaki et al., 2015). Themechanism of release of the TE silencing in meristems is notclear. However, the ChIP-seq data indicated that ;10 to 12% ofH3K27me3 peaks corresponded to TEs in rice SAM and IM. Thisis consistent with previous data showing that there is a highnumber of TEs marked by H3K27me3 in Arabidopsis SAM(Lafos et al., 2011). It is suggested that there may be an un-expected role for PcG proteins in the regulation of TEs spe-cifically in stem cell harboring meristems (Lafos et al., 2011). Itis unclear whether there is a causal link between TE expressionand differential H3K27me3 during meristem development.
Importantly, our data showing that thousands of genes gainedor lost H3K27me3 during the SAM-to-IM transition and thatdownregulation of SDG711 or mutation of JMJ703 eliminatedthe gain of H3K27me3 from many genes and affected panicledevelopment (Figures 1, 5, and 7) indicate that genome-wide re-programming of H3K27me3 was critical for IM activity. The re-sults are in line with previous data showing that PRC2-mediatedregulation represents a robust system controlling plant vegeta-tive-to-reproductive developmental transition by regulating trans-criptional master regulators (Bouyer et al., 2011). The enrichmentof transcription factor and protein kinase genes with differentH3K27me3 levels in IM (Table 2) suggested an important role ofthis epigenetic modification in reprogramming gene expressionand signaling during the transition. This assumption is furthersupported by the correlation between upregulation and loss ofH3K27me3 of several key genes known to be required for theSAM-to-IM transition and for panicle development (Table 1).Previous data showed that members of the TCP, CONSTANS-like, and GRAS families are targeted by H3K27me3 specificallyin the SAM in Arabidopsis, while other genes (such as homeo-box genes STM, KNAT2, and KNAT6) that are specifically ex-pressed in SAM are marked by H3K27me3 in leaves (Lafos et al.,2011). Our data indicated that several families of transcriptionfactors were enriched for loss (e.g., TCP, MYB, bHLH, and AP2)or gain (e.g., ARF and Aux/IAA) of H3K27me3 in IM, while MADSfamily members showed both gain or lose of the mark in IM(Supplemental Figure 9), confirming that specific transcriptionfactor gene families are preferentially and dynamically targetedby H3K27me3 (Lafos et al., 2011), which may be involved ingene expression reprogramming during meristem development.Consistent with previous data showing that auxin biosynthesis,transport, perception, and signaling genes are regulated byH3K27me3 in Arabidopsis during meristem cell differentiation
(Lafos et al., 2011), our data revealed that both auxin andcytokinin-related genes are regulated by H3K27me3 during theSAM-to-IM transition. In particular, our data suggest that target-ing of cytokinin oxidase genes by H3K27me3 is likely to play animportant role in IM activity and panicle development.However, there was no general correlation between differen-
tial H3K27me3 and gene expression change (>2-fold) in IM(Table 2). This is consistent with the data showing that al-though large numbers of gene loci lose H3K27me3 in Arabi-dopsis mutants of PRC genes, only a minority of the genesare derepressed (Lafos et al., 2011). Moreover, H3K27me3 isonly partially removed upon gene activation in Drosophila(Schuettengruber et al., 2007). It is suggested that H3K27me3is only critical for maintaining repression of a subset of themarked genes and that gain or loss of H3K27me3 at other locidoes not lead to their repressed or increased expression dueto the absence of specifically expressed transcription factors(Adrian et al., 2010; Eskeland et al., 2010; Farrona et al., 2011;Margueron and Reinberg, 2011).Although only a relatively small portion of genes showed gain
or loss of H3K4me3 in IM compared with SAM (Figure 5B), theamounts (TPM) of H3K4me3 were found to increase in manygenes in IM (Figure 3). Data from the analysis of quantitativecorrelation between ChIP-seq and RNA-seq reads indicatedthat change of H3K27me3/H3K4me3 ratio was an importantfactor for differential expression of many genes after SAM-to-IMtransition (Figure 3). This indicates that the two methylationmarks are functionally connected and that the relative abun-dance of the two marks is related to gene activity. Although it ispossible that chromatin regions modified by one mark are ina different cell population than the other mark, both marks mayoccur concomitantly in the same chromatin fragment. Thistype of bivalent domain was recently identified for many genein Arabidopsis seedlings (Sequeira-Mendes et al., 2014). In an-imal embryonic stem cells, many promoters harbor the bivalentmarks. These bivalent domains are considered to poise theexpression of developmental genes, allowing timely activationwhile maintaining repression in the absence of differentiationsignals (Young et al., 2011; Voigt et al., 2013). Considering thatSAM and IM contain mostly undifferentiated cells, it can besuggested that many of the H3K27me3 and H3K4me3-markedgenes identified in this study may contain the bivalent domains.As it is thought that bivalent domains have a function to finelytune gene expression during development (Young et al., 2011;Voigt et al., 2013), the dynamic change of the H3K27me3/H3K4me3 ratio may also alter bivalent marking and, thus, thefine-tuning of gene expression during the SAM-to-IM transition.
SDG711 Is Required for Gain of H3K27me3 in IM and GeneRepression during Panicle Development
Our data showing the effects of downregulation of SDG711 onpanicle size, genome-wide H3K27me3, and gene expression inIM indicate that SDG711 plays an important role in IM activityand panicle development. This is further supported by the ob-servation that SDG711 RNAi caused H3K27me3 loss and acti-vation of many key panicle developmental and hormone genes(Table 1). However, it cannot be excluded that some of the
Epigenetic Regulation of Rice Panicle Development 1439
differential gene expression and H3K27me3 between the RNAilines and the wild type may be due to slight differences in de-velopment stages of the harvested IM samples. Considering thatin the RNAi lines, there was only partial downregulation ofSDG711 transcripts (Figure 1A), the RNAi effect on H3K27me3may be underestimated. Our data suggest that SDG711-mediated H3K27me3 and gene repression may control IM ac-tivity and panicle development in several aspects. First, SDG711may function to attenuate gene activation in IM, as many genesare highly activated in the IM, especially those involved in plantmetabolism (such as photosynthesis and glycolysis) were foundto lose H3K27me3 and to be further activated in SDG711 RNAi IM(Table 1; Supplemental Data Set 1). Second, SDG711 may reg-ulate cytokinin accumulation and signaling in IM. This is sup-ported by the upregulation of several CKX genes (including CKX2/Gn1a) in SDG711 RNAi and downregulation in SDG711 over-expressing IM and the correlating changes of active cytokininlevels (Table 1, Figure 7; Supplemental Figure 3). Cytokinins areinvolved in rice inflorescence meristem activity and reduced ex-pression of CKX2/Gn1a leads to higher cytokinin accumulation inrice IM and larger panicle sizes (Ashikari et al., 2005). Third,SDG711 may have a function to maintain the repression of manyH3K27me3-marked genes in IM until floral organogenesis, asmany of those genes lost H3K27me3 and were derepressed inthe RNAi IM (Figure 6; Supplemental Data Set 3). This is con-sistent with the decreased expression of SDG711 during panicledevelopment (Figure 1), which may be a prerequisite for the timelyexpression of the genes during floral organogenesis. Collectively,the analysis revealed the importance of SDG711-mediatedH3K27me3 in developmental switch of gene expression duringpanicle development.
SDG711 and JMJ703 Have Synergistic Functions inH3K27me3 and in Panicle Development
Our data showing the similar effects of SDG711 RNAi andjmj703 mutation on genome-wide H3K27me3 and panicle de-velopment (Figures 5, 7, and 8) indicate that the two genes mayhave synergistic functions in histone methylation and gene ex-pression in the IM. The effects of double knockdown/knockoutof the genes on panicle size and H3K27me3 and H3K4me3modifications and expression of CKX2/Gn1a support this hy-pothesis. Possibly, JMJ703-dependent removal of H3K4me3may be required for SDG711 to mediate H3K27me3 on a subsetof genes in the IM. This is consistent with the observations thatincreased H3K27me3 levels were accompanied by decreasedH3K4me3 in a subset of genes during the SAM-to-IM transition(Figure 3A). Likely, a functional interplay between the two en-zymes may act in the negative crosstalk between the two his-tone methylation marks on a subset of genes. The observationthat overexpression of JMJ703 or SDG711 led to decreasedH3K4me3 and increased H3K27me3 in CKX2/Gn1a, while RNAior mutation of the genes produced opposite effects on the mod-ifications, corroborate this hypothesis. In mouse embryonic stemcells, the H3K4 demethylase JARID1a/RBBP2 is associated withthe PRC2 complex to mediate PcG complex-dependent tran-scriptional repression (Pasini et al., 2008). In addition, the PRC2complex recruits JARID1a/RBBP2 to its target genes to mediate
repressive activity during embryonic stem cell differentiation(Pasini et al., 2008). The observation that JMJ703 and SDG711proteins were both associated with the CKX2/Gn1a locus raisesthe possibility of a physical interaction between JMJ703 anda PRC2 complex on target genes in rice. Whether the two pro-teins are implicated in the generation of bivalent domains in ricemeristem cells, as JARID1a/RBBP2 and PRC2 proteins do inanimal stem cells (Young et al., 2011; Voigt et al., 2013), awaitsfurther analysis.
METHODS
Plant Materials and Growth Conditions
Rice (Oryza sativa spp japonica) material used in this study for ChIP-seqand RNA-seq analysis were from the ‘DongJin’ (DJ) background, includ-ing wild-type, SDG711 T-DNA insertion (3A-60654.R), overexpression, andRNAi lines (Liu et al., 2014) as well as JMJ703 T-DNA insertion line (3A-00550) (Chen et al., 2013). To construct the JMJ703 and SDG711 doubleknockdown plants, we transformed jmj703 T-DNAmutant plants with theSDG711 RNAi construct (Liu et al., 2014). The double transformantswere selected by PCR using the primers muJ3-F, muJ3-R, a T-DNA-specific primer 2715L1, pMCG-F, and pMCG-R (Supplemental Data Set4). The Ubi-JMJ703-FLAG transgenic plants were produced in theZhonghua11 (ZH11) background. For that, the JMJ703 full-length cDNAwas amplified using the primer set OXJMJ703-F and OXJMJ703-R(Supplemental Data Set 4), then inserted into the overexpression vectorpU1301-3xFLAG under the control of the maize (Zea mays) ubiquitingene promoter (Sun and Zhou, 2008). The construct was transformedinto ZH11.
The germinated rice seedlings of all genotypes were transplanted infield at the beginning of May in Wuhan area and grown till the beginning ofJune, which corresponded to the 6- to 7-leaf stage, to collect SAM (<0.5mm, observed with a microscope, as a criteria for sampling). Rice plantswere grown until mid June (;10- to 12-leaf stage) to start IM collection(1 to 2 mm, observed with a microscope, as criteria). During the periodfrom May to early June, the daylength at Wuhan area is <13.5 h (which isshort day for rice flowering) but afterward becomes >13.5 h (which is longday for rice flowering). Considering the short period of the long-daycondition between early to mid June, which may accelerate flowering ofSDG711 RNAi plants (Liu et al., 2014), we harvested IM of the RNAi plantsearlier (June 17th to 19th) than that of wild-type and jmj703 plants (June21st to 24th). About 400 plants were used to collect SAM and IM, andapices were hand-dissected from apices and frozen in liquid nitrogen forRNA extraction or fixed in formaldehyde for chromatin cross-linking.
RNA-seq and Data Analysis
Rice SAM and IM total RNA samples were isolated using TRIzol re-agent (Invitrogen). RNA libraries were prepared according to theprotocol at http://support.illumina.com/content/dam/illumina-support/documents/documentation/chemistry_documentation/samplepreps_truseq/truseqstrandedmrna/truseq-stranded-mrna-sample-prep-guide-15031047-e.pdf. Briefly, 1 to 4 mg of total RNA was used for mRNA purification andcDNA synthesis. After a single “A” nucleotide was added to the 39 endsof the blunt fragments of the double-stranded cDNAs, indexing adaptersare ligated to the ends of the cDNA. PCRwasperformed to amplify the DNAfragments. The amplified DNA fragmentswere purified and sequencedwiththe Illumina HiSeq-2000 system.
Sequence reads were filtered using Trimmomatic (version 0.32) (Bolgeret al., 2014). Clean tags were mapped to the reference genome of rice(RGAP version 7.0) using TopHat (version 2.0.13). These data were then
1440 The Plant Cell

analyzed for differentially expressed genes using Cufflinks (version 2.2.1)(Trapnell et al., 2012). Genes with an expression change fold >2 withP value<0.05 were defined as a differentially expressed. For pairwisescatterplots, RPKM was used. For gene pathway analysis, enrichmentwas calculated by comparing the percentage of differentially regulatedpathway genes among all differentially regulated genes with the per-centage of pathway genes in the rice genome. Then P values werecalculated by Fisher’s test using the different gene numbers to determinethe significance of difference of the comparisons. FDRs were used toadjust the P value.
ChIP
About 2 g of SAM or IM (;1 to 2 mm) was cross-linked in 1% formal-dehyde under vacuum. Chromatin was extracted and fragmented to 200to 750 bp by sonication, and ChIP was performed using the followingantibodies: H3K27me3 (a2363; ABclonal) and H3K4me3 (07-473; Milli-pore). The specificity of the antibodies was checked by immunoblots anddot blots using peptides containing H3K27me1-3 or H3K4me1-3 mod-ifications. The precipitated and input DNA samples were analyzed eitherby high-throughput sequencing or by real-time PCR with gene-specificprimers listed in Supplemental Data Set 4. All assays were performed atleast three times from two biological replicates.
ChIP-seq and Data Analysis
DNA libraries (ChIP) were prepared by strictly following the protocol athttp://support.illumina.com/content/dam/illumina-support/documents/documentation/chemistry_documentation/samplepreps_truseq/truseqchip/truseq-chip-sample-prep-guide-15023092-b.pdf. Briefly, 10 ng pre-cipitated DNA was end-repaired, single “A” nucleotide was added to the39 end of the blunt ends of the fragments followed by adapter ligation,library fragments of 250 to 300 bp (insert plus adapter sequences) wereisolated from an agarose gel, and PCR was performed with a PCR primercocktail to enrich DNA fragments. After purification, the DNA fragmentswere sequenced with the Illumina HiSeq-2000.
Sequence reads from all libraries were filtered by Trimmomatic (version0.32) (Bolger et al., 2014), and clean tags were mapped to the referencegenome of rice (RGAP version 7.0) using Bowtie2 (version 2.1.0) (Trapnellet al., 2012). Reads that could be mapped equally well to multiple lo-cations without mismatch or with identical mismatches were assigned toone position at random and were retained for further analyses as de-scribed previously (Wang et al., 2009b). Samtools (version 0.1.17) wasused to remove potential PCR duplicates, and MACS software (Zhanget al., 2008) was used to call histone modification peaks with the defaultparameters (bandwidth, 300 bp; model fold, 10, 30; P value, 1.00e-5)(Wang et al., 2009b). After the positions of the peaks on the chromosomeswere found, genes (including the 2-kb upstream and 2-kb downstreamregions) overlapping with the peaks were considered to have the epi-genetic marks. The wig files of the analysis pipeline were used for viewingthe data in the GBrowse 2.0 software.
For pairwise contour plots and scatterplots, read counts for a genefrom each library were normalized to TPM, which divides the read numberof each gene by the total read number aligned to genome successfullyand multiplied by 106 (He et al., 2010).
Tissue Specificity and Heat Map of Gene Expression
We estimated tissue specificity by calculating Shannon entropy (Schuget al., 2005; Zhang et al., 2007; Makarevitch et al., 2013) using the RiceExpression Profile Database (RiceXPro) (http://ricexpro.dna.affrc.go.jp/).Expression data of 12 tissues including panicle (0.6 to 10 mm), anther (0.3to 2 mm), pistil (5- to 18-cm inflorescence), palea (1.5- to 7-mm floret),
lemma (1.5- to 7-mm floret), ovary (1 to 7 d after flowering [DAF]), embryo(7 to 10 DAF), endosperm (7 to 10 DAF), root (27 d after tillering [DAT]),stem (83 DAT), leaf blade (27 DAT), and leaf sheath (27 DAT) are usedto calculate the gene’s tissue specificity. Tissue specificity score =1 2 H (p)/2.5, and entropy was calculated as:
HðpÞ ¼ 2∑ni¼1 pi log pi
where Pi is a relative abundance of the gene’s transcript in tissue i.Genes with expression (IM) <400 and expression (other tissue)/
expression (IM) >2 are defined as repressed in IM but expressed in othertissue. A heat map was generated by the R package heatmap2 in the Rprogramming environment.
RT-PCR
Total RNAs from rice stems, leaves, seedlings, and panicles of differentsizes were isolated using TRIzol reagent (Invitrogen). Three micrograms oftotal RNA was reverse-transcribed in a reaction of 20 mL using DNase Iand SuperScript III (Invitrogen) according to the manufacturer’s in-structions to obtain cDNA. Real-time PCRwas performed in an optical 96-well plate that included SYBR Premix EX Taq and 0.5 mL of Rox ReferenceDye II (Takara), 1 mL of the reverse transcription reaction, and 0.25 mM ofeach gene-specific primer in a final volume of 25 mL on a PRISM 7500PCR instrument (Applied Biosystems). The reactions were performed at95°C for 10 s, 45 cycles of 95°C for 5 s, and 60°C for 40 s. Disassociationcurve analysis was performed as follows: 95°C for 15 s, 60°C for 20 s, and95°C for 15 s. Data were collected using the ABI PRISM 7500 sequencedetection system following the instructionmanual. The relative expressionlevels were analyzed using the 22DDCT method (Livak and Schmittgen,2001). The riceACTIN1 gene was used as the internal control. The primersfor real-time PCR are listed in Supplemental Data Set 4.
In Situ Hybridization
All the tested materials were fixed, dehydrated, embedded, sliced, andattached to slides as previously reported (Zhao et al., 2009). For prep-aration of the digoxigenin-labeled RNA probes, the coding regions ofSDG711 andCKX2were amplified viaPCRusing primers (Insitu-SDG711-Fand Insitu-SDG711-R, or Insitu-OsCKX2-F and Insitu-OsCKX2-R, re-spectively) (Supplemental Data Set 4). The PCR products were clonedinto pGEM-T vectors, linearized, and used as templates for amplifyingdigoxigenin-labeled sense and antisense RNA probes. Tissue sectionswere cleared, dehydrated, dried, hybridized, and washed. The labeledprobes were detected and images were photographed with a micro-scope (Leica DM2500B).
Cytokinin Dosage
The rice IM (<0.5 cm) of DJ, SDG711 overexpression, RNAi, and T-DNAinsertion (3A-60654.R) was used for measuring cytokinin content. Thesamples were homogenized in liquid nitrogen and extracted in cold ex-traction buffer at –20°C overnight. The material was analyzed for threetechnical repeats. One hundred milligrams (fresh weight) of material and10 ng of each internal standard were used for each technical repeat. Theextraction buffer was amixture of methanol‐water‐formic acid (15:4:1, v/v/v).The extraction was performed according to those reported by Dobrevand Kamínek (2002).
An ultrafast liquid chromatographwith an autosampler (Shimadzu) wasused for liquid chromatography. The Atlantis T3 column (2.1 3 150 mm,5 mm; Waters) was used at ambient temperature. The hybrid triplequadrupole/linear ion trapmass spectrometer of ABI 4000Q‐Trap (AppliedBiosystems) outfitted with an electrospray ion source was used formeasurement of cytokinin content according to the method by Liu et al.
Epigenetic Regulation of Rice Panicle Development 1441

(2012), except that a positive ionization mode was used for measuring thecontents of cytokinin and the internal standards.
Accession Numbers
Sequence data from this article can be found in the Rice Genome AnnotationProject website (http://rice.plantbiology.msu.edu/) under the following ac-cession numbers: SDG711, Os06g16390; JMJ703, Os05g10770; CKX1,Os01g09260; CKX2, Os01g10110; CKX3, Os10g34230; CKX4, Os01g71310;CKX5, Os01g56810; CKX6, Os02g12770; CKX7, Os02g12780; CKX8,Os04g44230; CKX9, Os05g31040; CKX10, Os06g37500; and CKX11,Os08g35860. The ChIP-seq and RNA-seq data described in this article havebeen deposited into the Gene Expression Omnibus database (accessionnumber GSE68299).
Supplemental Data
Supplemental Figure 1. Rice SAM and IM RNA-seq data.
Supplemental Figure 2. Overlap of differentially expressed genes inIM versus SAM and those in SDG711 RNAi IM compared with the wildtype.
Supplemental Figure 3. Expression of rice cytokinin oxidase (CKX)gene family members and accumulation of active cytokinins in IM ofSDG711 transgenic and mutant plants.
Supplemental Figure 4. Experimental validation of RNA-seq andChIP-seq data.
Supplemental Figure 5. Genome browser screenshots of randomlyselected six regions (100 kb each) with H3K27me3 modification indifferent samples.
Supplemental Figure 6. Relative proportions of H3K27me3 andH3K4me3 ChIP-seq peaks in genic (TE and non-TE) and intergenicregions and in promoter and gene body regions.
Supplemental Figure 7. Pairwise scatterplots between amounts(TMP) of H3K4me3.
Supplemental Figure 8. Tissue specificity scores of genes marked byH3K27me3 in SAM or IM (one tissue) or in both (two tissues) comparedwith unmarked genes.
Supplemental Figure 9. Relative fold changes of transcription factorfamily genes that gained or lost H3K27me3 in IM compared with SAM.
Supplemental Table 1. Pathway analysis of up- and downregulatedgenes in wild-type IM/SAM and SDG711 RNAi IM/wild type.
Supplemental Table 2. H3K27me3 and H3K4me3 ChIP-seq readsand analysis data of rice SAM and IM of wild-type, SDG711 RNAi, andjmj703 plants.
Supplemental Table 3. Pathway analysis of genes that gained or lostH3K27me3 in IM/SAM and SDG711 RNAi/wild type IM.
Supplemental Table 4. Enrichment of genes that lost H3K27me3 inSDG711 RNAi and jmj703 mutant versus wild-type IM and in wild-typeIM versus SAM for gain or loss of H3K4me3.
Supplemental Data Set 1. Relative transcript levels of kinase,transcription factor, and metabolic pathway genes that lost or gainedH3K27me3 in IM/SAM and SDG711 RNAi/wild type IM.
Supplemental Data Set 2. List of differentially expressed in IM com-pared SAM which lost H3K27me3 and further induced in SDG711RNAi IM.
Supplemental Data Set 3. List of IM silent and floral organ activegenes that lost H3K27me3 and were activated in SDG711 RNAi IM.
Supplemental Data Set 4. Primers used in this study.
ACKNOWLEDGMENTS
We thank Qinglu Zhang and Xianghua Li for help in field experiments andmanagement. This work was supported by grants from National ScienceFoundation of China (31371241), the 863 Key Project “Rice Func-tional Genomics” of the Chinese Ministry of Science and Technology(2012AA10A303), the special transgenic program of the Chinese Ministryof Agriculture (2014ZX08009-002B), and grants from the Bill and MelindaGates Foundation.
AUTHOR CONTRIBUTIONS
X.L., S.Z., W.W., Y.Y., Y.Z., Q.X., C.Z., F.T., and S.C. performed research. S.Z.,X.L., and D.-X.Z. analyzed data. D.-X.Z., X.L., and S.Z. wrote the article.
Received March 4, 2015; revised April 16, 2015; accepted April 23, 2015;published May 8, 2015.
REFERENCES
Adrian, J., Farrona, S., Reimer, J.J., Albani, M.C., Coupland, G.,and Turck, F. (2010). cis-Regulatory elements and chromatin statecoordinately control temporal and spatial expression of FLOWER-ING LOCUS T in Arabidopsis. Plant Cell 22: 1425–1440.
Ashikari, M., Sakakibara, H., Lin, S., Yamamoto, T., Takashi, T.,Nishimura, A., Angeles, E.R., Qian, Q., Kitano, H., and Matsuoka,M. (2005). Cytokinin oxidase regulates rice grain production. Sci-ence 309: 741–745.
Avramova, Z. (2009). Evolution and pleiotropy of TRITHORAX func-tion in Arabidopsis. Int. J. Dev. Biol. 53: 371–381.
Berr, A., Shafiq, S., and Shen, W.H. (2011). Histone modifications intranscriptional activation during plant development. Biochim. Bio-phys. Acta 1809: 567–576.
Bolger, A.M., Lohse, M., and Usadel, B. (2014). Trimmomatic: a flexibletrimmer for Illumina sequence data. Bioinformatics 30: 2114–2120.
Bouyer, D., Roudier, F., Heese, M., Andersen, E.D., Gey, D.,Nowack, M.K., Goodrich, J., Renou, J.P., Grini, P.E., Colot, V.,and Schnittger, A. (2011). Polycomb repressive complex 2 con-trols the embryo-to-seedling phase transition. PLoS Genet. 7:e1002014.
Cai, Q., Yuan, Z., Chen, M., Yin, C., Luo, Z., Zhao, X., Liang, W., Hu,J., and Zhang, D. (2014). Jasmonic acid regulates spikelet de-velopment in rice. Nat. Commun. 5: 3476.
Chanvivattana, Y., Bishopp, A., Schubert, D., Stock, C., Moon,Y.H., Sung, Z.R., and Goodrich, J. (2004). Interaction of Polycomb-group proteins controlling flowering in Arabidopsis. Development131: 5263–5276.
Charron, J.B., He, H., Elling, A.A., and Deng, X.W. (2009). Dynamiclandscapes of four histone modifications during deetiolation in Arabi-dopsis. Plant Cell 21: 3732–3748.
Chen, Q., Chen, X., Wang, Q., Zhang, F., Lou, Z., Zhang, Q., andZhou, D.X. (2013). Structural basis of a histone H3 lysine 4 de-methylase required for stem elongation in rice. PLoS Genet. 9:e1003239.
Chen, X., Hu, Y., and Zhou, D.X. (2011). Epigenetic gene regulationby plant Jumonji group of histone demethylase. Biochim. Biophys.Acta 1809: 421–426.
Cui, R., Han, J., Zhao, S., Su, K., Wu, F., Du, X., Xu, Q., Chong, K.,Theissen, G., and Meng, Z. (2010). Functional conservation anddiversification of class E floral homeotic genes in rice (Oryza sativa).Plant J. 61: 767–781.
1442 The Plant Cell

Cui, X., Jin, P., Cui, X., Gu, L., Lu, Z., Xue, Y., Wei, L., Qi, J., Song,X., Luo, M., An, G., and Cao, X. (2013). Control of transposonactivity by a histone H3K4 demethylase in rice. Proc. Natl. Acad.Sci. USA 110: 1953–1958.
Dobrev, P.I., and Kamínek, M. (2002). Fast and efficient separation ofcytokinins from auxin and abscisic acid and their purification usingmixed-mode solid-phase extraction. J. Chromatogr. A 950: 21–29.
Eskeland, R., Leeb, M., Grimes, G.R., Kress, C., Boyle, S., Sproul,D., Gilbert, N., Fan, Y., Skoultchi, A.I., Wutz, A., and Bickmore,W.A. (2010). Ring1B compacts chromatin structure and repressesgene expression independent of histone ubiquitination. Mol. Cell 38:452–464.
Farrona, S., Thorpe, F.L., Engelhorn, J., Adrian, J., Dong, X., Sarid-Krebs, L., Goodrich, J., and Turck, F. (2011). Tissue-specific ex-pression of FLOWERING LOCUS T in Arabidopsis is maintainedindependently of polycomb group protein repression. Plant Cell 23:3204–3214.
Fornara, F., Parenicova, L., Falasca, G., Pelucchi, N., Masiero, S.,Ciannamea, S., Lopez-Dee, Z., Altamura, M.M., Colombo, L.,and Kater, M.M. (2004). Functional characterization of OsMADS18,a member of the AP1/SQUA subfamily of MADS box genes. PlantPhysiol. 135: 2207–2219.
Fromm, M., and Avramova, Z. (2014). ATX1/AtCOMPASS and theH3K4me3 marks: how do they activate Arabidopsis genes? Curr.Opin. Plant Biol. 21: 75–82.
Gao, X., Liang, W., Yin, C., Ji, S., Wang, H., Su, X., Guo, C., Kong,H., Xue, H., and Zhang, D. (2010). The SEPALLATA-like gene Os-MADS34 is required for rice inflorescence and spikelet de-velopment. Plant Physiol. 153: 728–740.
Han, Y., Yang, H., and Jiao, Y. (2014). Regulation of inflorescencearchitecture by cytokinins. Front. Plant Sci. 5: 669.
He, G., et al. (2010). Global epigenetic and transcriptional trendsamong two rice subspecies and their reciprocal hybrids. Plant Cell22: 17–33.
Hennig, L., and Derkacheva, M. (2009). Diversity of Polycomb groupcomplexes in plants: same rules, different players? Trends Genet.25: 414–423.
Hu, Y., Liu, D., Zhong, X., Zhang, C., Zhang, Q., and Zhou, D.X.(2012). CHD3 protein recognizes and regulates methylated histoneH3 lysines 4 and 27 over a subset of targets in the rice genome.Proc. Natl. Acad. Sci. USA 109: 5773–5778.
Ikeda-Kawakatsu, K., Maekawa, M., Izawa, T., Itoh, J., andNagato, Y. (2012). ABERRANT PANICLE ORGANIZATION 2/RFL,the rice ortholog of Arabidopsis LEAFY, suppresses the transitionfrom inflorescence meristem to floral meristem through interactionwith APO1. Plant J. 69: 168–180.
Itoh, J., Nonomura, K., Ikeda, K., Yamaki, S., Inukai, Y., Yamagishi,H., Kitano, H., and Nagato, Y. (2005). Rice plant development:from zygote to spikelet. Plant Cell Physiol. 46: 23–47.
Jiao, Y., Wang, Y., Xue, D., Wang, J., Yan, M., Liu, G., Dong, G.,Zeng, D., Lu, Z., Zhu, X., Qian, Q., and Li, J. (2010). Regulation ofOsSPL14 by OsmiR156 defines ideal plant architecture in rice. Nat.Genet. 42: 541–544.
Kinoshita, T., Harada, J.J., Goldberg, R.B., and Fischer, R.L. (2001).Polycomb repression of flowering during early plant development.Proc. Natl. Acad. Sci. USA 98: 14156–14161.
Kobayashi, K., Yasuno, N., Sato, Y., Yoda, M., Yamazaki, R.,Kimizu, M., Yoshida, H., Nagamura, Y., and Kyozuka, J. (2012).Inflorescence meristem identity in rice is specified by overlappingfunctions of three AP1/FUL-like MADS box genes and PAP2, a SE-PALLATA MADS box gene. Plant Cell 24: 1848–1859.
Köhler, C., and Villar, C.B. (2008). Programming of gene expressionby Polycomb group proteins. Trends Cell Biol. 18: 236–243.
Kurakawa, T., Ueda, N., Maekawa, M., Kobayashi, K., Kojima, M.,Nagato, Y., Sakakibara, H., and Kyozuka, J. (2007). Direct controlof shoot meristem activity by a cytokinin-activating enzyme. Nature445: 652–655.
Lafos, M., Kroll, P., Hohenstatt, M.L., Thorpe, F.L., Clarenz, O., andSchubert, D. (2011). Dynamic regulation of H3K27 trimethylationduring Arabidopsis differentiation. PLoS Genet. 7: e1002040.
Lee, D.Y., and An, G. (2012). Two AP2 family genes, supernumerarybract (SNB) and Osindeterminate spikelet 1 (OsIDS1), synergisti-cally control inflorescence architecture and floral meristem estab-lishment in rice. Plant J. 69: 445–461.
Li, H., Freeling, M., and Lisch, D. (2010). Epigenetic reprogrammingduring vegetative phase change in maize. Proc. Natl. Acad. Sci. USA107: 22184–22189.
Li, T., Chen, X., Zhong, X., Zhao, Y., Liu, X., Zhou, S., Cheng, S.,and Zhou, D.X. (2013). Jumonji C domain protein JMJ705-mediatedremoval of histone H3 lysine 27 trimethylation is involved in defense-related gene activation in rice. Plant Cell 25: 4725–4736.
Liu, X., Zhou, C., Zhao, Y., Zhou, S., Wang, W., and Zhou, D.X.(2014). The rice enhancer of zeste [E(z)] genes SDG711 and SDG718are respectively involved in long day and short day signaling tomediate the accurate photoperiod control of flowering time. Front.Plant Sci. 5: 591.
Liu, Z., Cai, B.-D., and Feng, Y.-Q. (2012). Rapid determination ofendogenous cytokinins in plant samples by combination of magneticsolid phase extraction with hydrophilic interaction chromatography-tandem mass spectrometry. J. Chromatogr. B Analyt. Technol. Biomed.Life Sci. 891-892: 27–35.
Livak, K.J., and Schmittgen, T.D. (2001). Analysis of relative geneexpression data using real-time quantitative PCR and the 2(-DeltaDelta C(T)) method. Methods 25: 402–408.
Luo, M., Platten, D., Chaudhury, A., Peacock, W.J., and Dennis,E.S. (2009). Expression, imprinting, and evolution of rice homologsof the polycomb group genes. Mol. Plant 2: 711–723.
Makarevitch, I., Eichten, S.R., Briskine, R., Waters, A.J., Danilevskaya,O.N., Meeley, R.B., Myers, C.L., Vaughn, M.W., and Springer, N.M.(2013). Genomic distribution of maize facultative heterochromatin markedby trimethylation of H3K27. Plant Cell 25: 780–793.
Margueron, R., and Reinberg, D. (2011). The Polycomb complexPRC2 and its mark in life. Nature 469: 343–349.
Martínez, G., and Slotkin, R.K. (2012). Developmental relaxation oftransposable element silencing in plants: functional or byproduct?Curr. Opin. Plant Biol. 15: 496–502.
Miura, K., Ikeda, M., Matsubara, A., Song, X.J., Ito, M., Asano, K.,Matsuoka, M., Kitano, H., and Ashikari, M. (2010). OsSPL14promotes panicle branching and higher grain productivity in rice.Nat. Genet. 42: 545–549.
Ohtsu, K., et al. (2007). Global gene expression analysis of the shootapical meristem of maize (Zea mays L.). Plant J. 52: 391–404.
Pasini, D., Hansen, K.H., Christensen, J., Agger, K., Cloos, P.A.,and Helin, K. (2008). Coordinated regulation of transcriptional re-pression by the RBP2 H3K4 demethylase and Polycomb-RepressiveComplex 2. Genes Dev. 22: 1345–1355.
Pien, S., and Grossniklaus, U. (2007). Polycomb group and trithoraxgroup proteins in Arabidopsis. Biochim. Biophys. Acta 1769: 375–382.
Qi, W., Sun, F., Wang, Q., Chen, M., Huang, Y., Feng, Y.Q., Luo, X.,and Yang, J. (2011). Rice ethylene-response AP2/ERF factorOsEATB restricts internode elongation by down-regulating a gib-berellin biosynthetic gene. Plant Physiol. 157: 216–228.
Rao, N.N., Prasad, K., Kumar, P.R., and Vijayraghavan, U. (2008).Distinct regulatory role for RFL, the rice LFY homolog, in determiningflowering time and plant architecture. Proc. Natl. Acad. Sci. USA 105:3646–3651.
Epigenetic Regulation of Rice Panicle Development 1443

Ryu, C.H., Lee, S., Cho, L.H., Kim, S.L., Lee, Y.S., Choi, S.C., Jeong,H.J., Yi, J., Park, S.J., Han, C.D., and An, G. (2009). OsMADS50and OsMADS56 function antagonistically in regulating long day(LD)-dependent flowering in rice. Plant Cell Environ. 32: 1412–1427.
Sakamoto, T., and Matsuoka, M. (2008). Identifying and exploitinggrain yield genes in rice. Curr. Opin. Plant Biol. 11: 209–214.
Schubert, D., Clarenz, O., and Goodrich, J. (2005). Epigeneticcontrol of plant development by Polycomb-group proteins. Curr.Opin. Plant Biol. 8: 553–561.
Schuettengruber, B., Chourrout, D., Vervoort, M., Leblanc, B., andCavalli, G. (2007). Genome regulation by polycomb and trithoraxproteins. Cell 128: 735–745.
Schug, J., Schuller, W.P., Kappen, C., Salbaum, J.M., Bucan, M.,and Stoeckert, C.J., Jr. (2005). Promoter features related to tissuespecificity as measured by Shannon entropy. Genome Biol. 6: R33.
Schwartz, Y.B., and Pirrotta, V. (2008). Polycomb complexes andepigenetic states. Curr. Opin. Cell Biol. 20: 266–273.
Sequeira-Mendes, J., Aragüez, I., Peiró, R., Mendez-Giraldez, R.,Zhang, X., Jacobsen, S.E., Bastolla, U., and Gutierrez, C. (2014).The functional topography of the Arabidopsis genome is organizedin a reduced number of linear motifs of chromatin states. Plant Cell26: 2351–2366.
Sharma, R., et al. (2012). Expression dynamics of metabolic andregulatory components across stages of panicle and seed de-velopment in indica rice. Funct. Integr. Genomics 12: 229–248.
Steffen, P.A., and Ringrose, L. (2014). What are memories made of?How Polycomb and Trithorax proteins mediate epigenetic memory.Nat. Rev. Mol. Cell Biol. 15: 340–356.
Sun, Q., and Zhou, D.X. (2008). Rice jmjC domain-containing geneJMJ706 encodes H3K9 demethylase required for floral organ de-velopment. Proc. Natl. Acad. Sci. USA 105: 13679–13684.
Tamaki, S., Tsuji, H., Matsumoto, A., Fujita, A., Shimatani, Z.,Terada, R., Sakamoto, T., Kurata, T., and Shimamoto, K. (2015).FT-like proteins induce transposon silencing in the shoot apex duringfloral induction in rice. Proc. Natl. Acad. Sci. USA 112: E901–E910.
Trapnell, C., Roberts, A., Goff, L., Pertea, G., Kim, D., Kelley, D.R.,Pimentel, H., Salzberg, S.L., Rinn, J.L., and Pachter, L. (2012).Differential gene and transcript expression analysis of RNA-seqexperiments with TopHat and Cufflinks. Nat. Protoc. 7: 562–578.
Voigt, P., Tee, W.W., and Reinberg, D. (2013). A double take on bi-valent promoters. Genes Dev. 27: 1318–1338.
Wang, L., Yin, H., Qian, Q., Yang, J., Huang, C., Hu, X., and Luo, D.(2009a). NECK LEAF 1, a GATA type transcription factor, modulatesorganogenesis by regulating the expression of multiple regulatorygenes during reproductive development in rice. Cell Res. 19: 598–611.
Wang, X., Elling, A.A., Li, X., Li, N., Peng, Z., He, G., Sun, H., Qi, Y.,Liu, X.S., and Deng, X.W. (2009b). Genome-wide and organ-specificlandscapes of epigenetic modifications and their relationships to mRNAand small RNA transcriptomes in maize. Plant Cell 21: 1053–1069.
Xing, Y., and Zhang, Q. (2010). Genetic and molecular bases of riceyield. Annu. Rev. Plant Biol. 61: 421–442.
Yaish, M.W., El-Kereamy, A., Zhu, T., Beatty, P.H., Good, A.G., Bi,Y.M., and Rothstein, S.J. (2010). The APETALA-2-like transcriptionfactor OsAP2-39 controls key interactions between abscisic acidand gibberellin in rice. PLoS Genet. 6: e1001098.
Young, M.D., Willson, T.A., Wakefield, M.J., Trounson, E., Hilton,D.J., Blewitt, M.E., Oshlack, A., and Majewski, I.J. (2011). ChIP-seq analysis reveals distinct H3K27me3 profiles that correlate withtranscriptional activity. Nucleic Acids Res. 39: 7415–7427.
Zhang, X., Bernatavichute, Y.V., Cokus, S., Pellegrini, M., andJacobsen, S.E. (2009). Genome-wide analysis of mono-, di- andtrimethylation of histone H3 lysine 4 in Arabidopsis thaliana. Ge-nome Biol. 10: R62.
Zhang, X., Clarenz, O., Cokus, S., Bernatavichute, Y.V., Pellegrini,M., Goodrich, J., and Jacobsen, S.E. (2007). Whole-genomeanalysis of histone H3 lysine 27 trimethylation in Arabidopsis. PLoSBiol. 5: e129.
Zhang, Y., Liu, T., Meyer, C.A., Eeckhoute, J., Johnson, D.S.,Bernstein, B.E., Nusbaum, C., Myers, R.M., Brown, M., Li, W.,and Liu, X.S. (2008). Model-based analysis of ChIP-Seq (MACS).Genome Biol. 9: R137.
Zhao, Y., Hu, Y., Dai, M., Huang, L., and Zhou, D.X. (2009). TheWUSCHEL-related homeobox gene WOX11 is required to activateshoot-borne crown root development in rice. Plant Cell 21: 736–748.
Zheng, B., and Chen, X. (2011). Dynamics of histone H3 lysine27 trimethylation in plant development. Curr. Opin. Plant Biol. 14:123–129.
1444 The Plant Cell

DOI 10.1105/tpc.15.00201; originally published online May 8, 2015; 2015;27;1428-1444Plant Cell
Saifeng Cheng and Dao-Xiu ZhouXiaoyun Liu, Shaoli Zhou, Wentao Wang, Yiran Ye, Yu Zhao, Qiutao Xu, Chao Zhou, Feng Tan,
Inflorescence MeristemRegulation of Histone Methylation and Reprogramming of Gene Expression in the Rice
This information is current as of May 25, 2018
Supplemental Data /content/suppl/2015/04/29/tpc.15.00201.DC1.html
References /content/27/5/1428.full.html#ref-list-1
This article cites 70 articles, 24 of which can be accessed free at:
Permissions https://www.copyright.com/ccc/openurl.do?sid=pd_hw1532298X&issn=1532298X&WT.mc_id=pd_hw1532298X
eTOCs http://www.plantcell.org/cgi/alerts/ctmain
Sign up for eTOCs at:
CiteTrack Alerts http://www.plantcell.org/cgi/alerts/ctmain
Sign up for CiteTrack Alerts at:
Subscription Information http://www.aspb.org/publications/subscriptions.cfm
is available at:Plant Physiology and The Plant CellSubscription Information for
ADVANCING THE SCIENCE OF PLANT BIOLOGY © American Society of Plant Biologists