regulatory financial statements 2020-21
TRANSCRIPT

Regulatory Financial Statements2021
Document user guideBT Regulatory Financial Statements 202
Welcome to the BT Regulatory Financial Statements 202 . In this interactive pdf you can do many things to help you easily access the information that you want, whether that’s printing, searching for a specific item or going directly to another page, section or website. These are explained below.
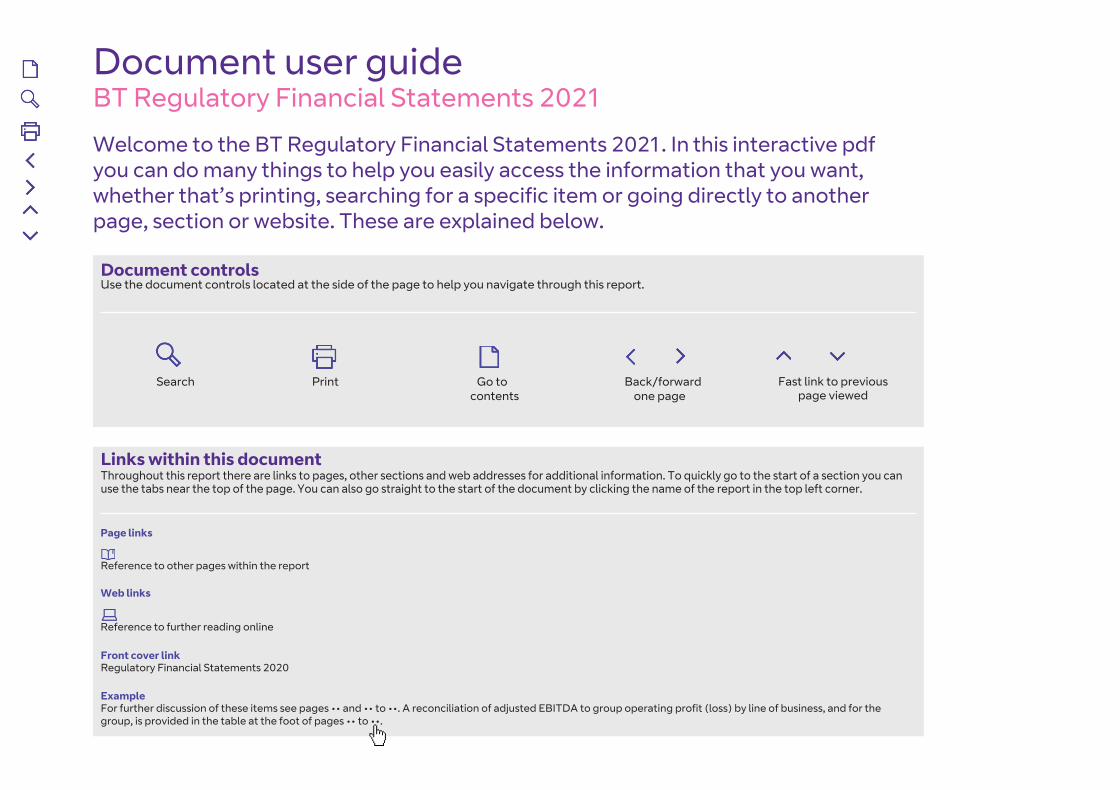
Document controlsUse the document controls located at the side of the page to help you navigate through this report.
Search Print Go to Back/forward contents one page
Fast link to previous page viewed
Links within this documentThroughout this report there are links to pages, other sections and web addresses for additional information. To quickly go to the start of a section you can use the tabs near the top of the page. You can also go straight to the start of the document by clicking the name of the report in the top left corner.
Page links
Reference to other pages within the report
Web links
Reference to further reading online
Front cover linkRegulatory Financial Statements 2020
ExampleFor further discussion of these items see pages •• and •• to ••. A reconciliation of adjusted EBITDA to group operating profit (loss) by line of business, and for the group, is provided in the table at the foot of pages •• to ••.
1
1
Ofcom Statement on BT’s Regulatory Financial Statements 2021
IntroductionBT’s reporting obligations are imposed under SMP conditions and directions related to regulatory reporting set as part of market reviews conducted by Ofcom.1 Under these SMP conditions, BT is required to publish alongside the RFS any written statement made by Ofcom and provided to BT commenting on the data in, the notes to or any presentation of any or all the audited Regulatory Financial Statements (RFS), the reconciliation report and/or the AMD (Accounting Methodology Documents).
New reporting requirements in the 2020/21 RFSThis year’s RFS has additional service level reporting in Section 6 (Physical Infrastructure market) as a result of regulatory financial reporting decisions we made in our July 2019 Regulatory Reporting Statement.2
Methodology changes in the 2020/21As required under the SMP conditions, BT published its Change Control Notification (CCN) for the 2020/21 RFS in March 2021. This sets out the methodology changes it planned to make to the RFS this year. In Appendix 4, the RFS includes a reconciliation report setting out the impact of the methodology changes included in the CCN and the effect of correcting any material errors identified during the year.
New format of AMDBT has changed the format of the AMD this year to with the aim of improving the structure of the document and increasing the transparency of its attribution methodologies. Part 1 provides an introduction to the RFS, which BT says is intended to be accessible to all users. For the first time this includes diagrams illustrating how costs flow through its cost allocation system. Part 2 contains the technical detail of BT’s main methodologies in a standardised format, which BT says is for users with an in-depth knowledge of regulatory reporting and attribution methodologies.
1 Some reporting also arises from the Commitments given by BT and Openreach which were notified to Ofcom under section 89C of the Communications Act 2003.2 BT regulatory financial reporting, 12 July 2019.
Changes to the RFS next yearIn our Wholesale Fixed Telecoms Market Review Statement published on 18 March 2021 we introduced new reporting requirements aimed at ensuring published information is relevant and easy to understand.3 For example, operating cost categories reported in the RFS will be aligned to those published in BT’s annual report.4 These changes will be reflected in the 2021/22 RFS.
3 Promoting investment and competition in fibre networks – Wholesale Fixed Telecoms Market Review 2021-26 4 Full details of BT’s future regulatory reporting requirements can be found in Volume 6 of the Wholesale Fixed Telecoms Market Review Statement.
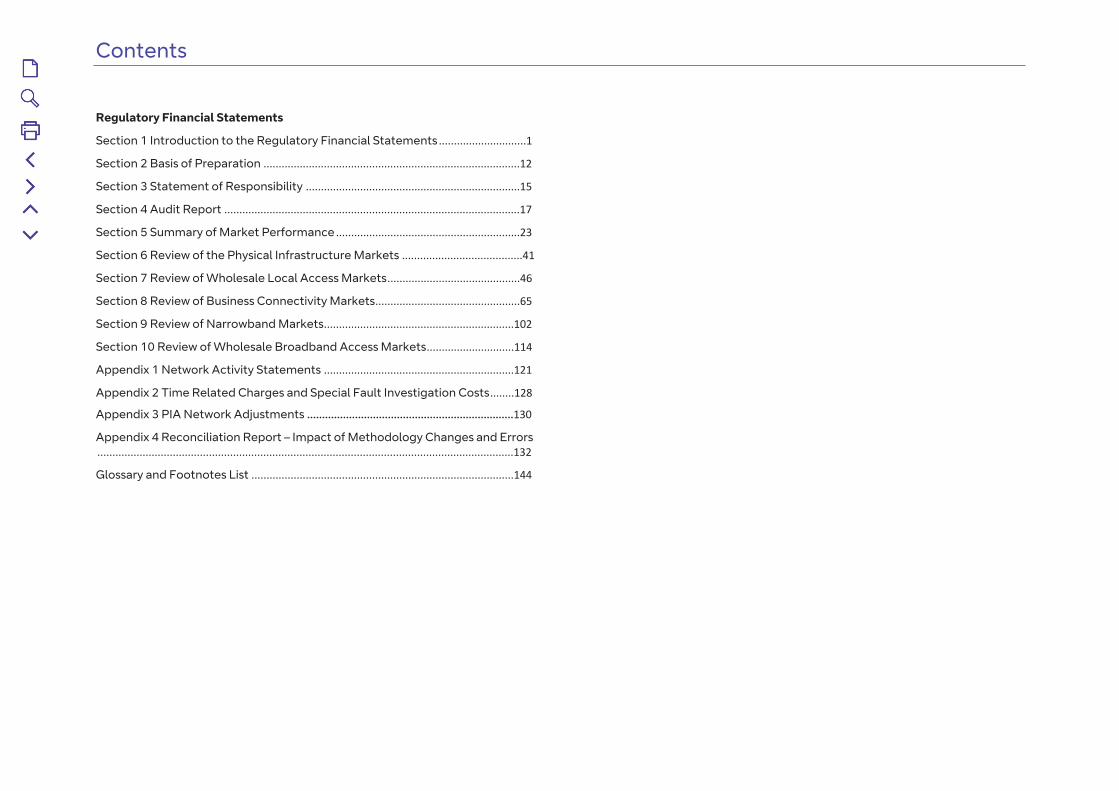
Contents
Regulatory Financial Statements
Section 1 Introduction to the Regulatory Financial Statements .............................1
Section 2 Basis of Preparation .....................................................................................12
Section 3 Statement of Responsibility .......................................................................15
Section 4 Audit Report ..................................................................................................17
Section 5 Summary of Market Performance .............................................................23
Section 6 Review of the Physical Infrastructure Markets ........................................41
Section 7 Review of Wholesale Local Access Markets............................................46
Section 8 Review of Business Connectivity Markets................................................65
Section 9 Review of Narrowband Markets...............................................................102
Section 10 Review of Wholesale Broadband Access Markets.............................114
Appendix 1 Network Activity Statements ...............................................................121
Appendix 2 Time Related Charges and Special Fault Investigation Costs........128
Appendix 3 PIA Network Adjustments .....................................................................130
Appendix 4 Reconciliation Report – Impact of Methodology Changes and Errors..........................................................................................................................................132
Glossary and Footnotes List .......................................................................................144

Page 1
Section 1Introduction to the Regulatory Financial Statements

Section 1 – Introduction to the Regulatory Financial Statements
Page 2
1.1 Regulatory Financial Reporting ObligationsThe ultimate holding company of British Telecommunications plc (‘the Company’) is BT Group plc. The terms ‘the Group’, ‘the Company’, ‘BT’, ‘we’, ‘us’ or ‘our’ refer collectively to BT Group plc and its subsidiary undertakings. The form and content of the Regulatory Financial Statements (RFS) are based on the reporting obligations set by Ofcom. We refer to these obligations as the Final Statements (see Section 2.1.4 Final Statements set out by Office of Communications (Ofcom)).
Openreach
We are required by Sections 20.5 and 20.6 of the Commitments to disclose the financial results of Openreach (OR) separately and to reconcile the financial results to the Openreach segmental information shown in BT Group plc’s Annual Report. We have included this information in Section 5 of these Regulatory Financial Statements.
BT Customer Facing Units and Markets with Significant Market Power (SMP)
In the 2020/21 RFS, we are required to report on the following Significant Market Power (SMP) Markets (in the UK excluding the Hull area, modified where stated below):
Market Review Physical Infrastructure Access (PIMR)
Wholesale Local Access(WLAMR)
Business Connectivity (BCMR) Narrowband (NMR)
Wholesale Broadband Access
(WBAMR)
PIA WLA CI Access Services – BT Only Areas WFAEL
CI Access Services – BT Plus One Areas ISDN2
High Network Reach Areas Outside CLA ISDN30
Technical Areas (Non-Dark Fibre) Inter Exchange
Openreach
Technical Areas (Dark Fibre) Inter Exchange
Call origination WBA Market A
Call terminationRest of BT
Technical Areas- Interconnect Circuits
Section 1 – Introduction to the Regulatory Financial Statements
Page 3
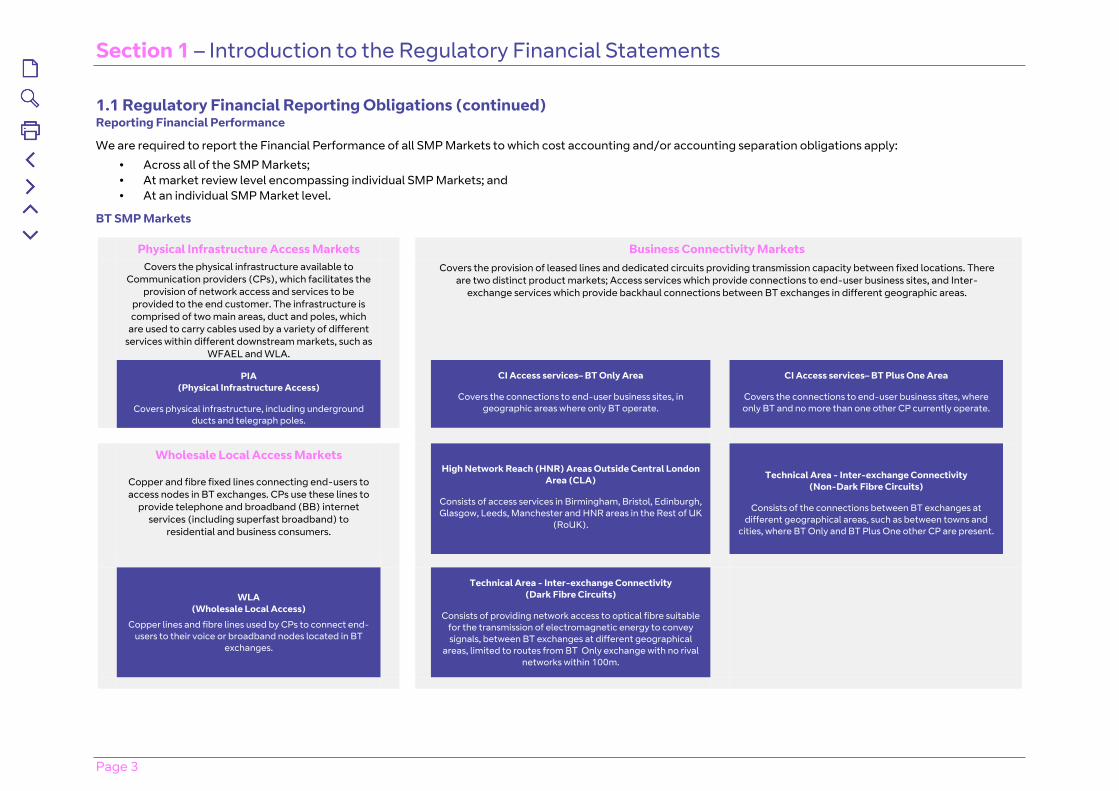
1.1 Regulatory Financial Reporting Obligations (continued)Reporting Financial Performance
We are required to report the Financial Performance of all SMP Markets to which cost accounting and/or accounting separation obligations apply:
• Across all of the SMP Markets;• At market review level encompassing individual SMP Markets; and• At an individual SMP Market level.
BT SMP Markets
Physical Infrastructure Access Markets Business Connectivity MarketsCovers the physical infrastructure available to
Communication providers (CPs), which facilitates the provision of network access and services to be
provided to the end customer. The infrastructure is comprised of two main areas, duct and poles, which
are used to carry cables used by a variety of different services within different downstream markets, such as
WFAEL and WLA.
Covers the provision of leased lines and dedicated circuits providing transmission capacity between fixed locations. There are two distinct product markets; Access services which provide connections to end-user business sites, and Inter-
exchange services which provide backhaul connections between BT exchanges in different geographic areas.
PIA(Physical Infrastructure Access)
Covers physical infrastructure, including underground ducts and telegraph poles.
CI Access services– BT Only Area
Covers the connections to end-user business sites, in geographic areas where only BT operate.
CI Access services– BT Plus One Area
Covers the connections to end-user business sites, where only BT and no more than one other CP currently operate.
Wholesale Local Access Markets
Copper and fibre fixed lines connecting end-users to access nodes in BT exchanges. CPs use these lines to
provide telephone and broadband (BB) internet services (including superfast broadband) to
residential and business consumers.
High Network Reach (HNR) Areas Outside Central London Area (CLA)
Consists of access services in Birmingham, Bristol, Edinburgh, Glasgow, Leeds, Manchester and HNR areas in the Rest of UK
(RoUK).
Technical Area - Inter-exchange Connectivity(Non-Dark Fibre Circuits)
Consists of the connections between BT exchanges at different geographical areas, such as between towns and
cities, where BT Only and BT Plus One other CP are present.
WLA(Wholesale Local Access)
Copper lines and fibre lines used by CPs to connect end-users to their voice or broadband nodes located in BT
exchanges.
Technical Area - Inter-exchange Connectivity (Dark Fibre Circuits)
Consists of providing network access to optical fibre suitable for the transmission of electromagnetic energy to convey signals, between BT exchanges at different geographical
areas, limited to routes from BT Only exchange with no rival networks within 100m.
Section 1 – Introduction to the Regulatory Financial Statements
Page 4
1.1 Regulatory Financial Reporting Obligations (continued)BT SMP Markets (continued)
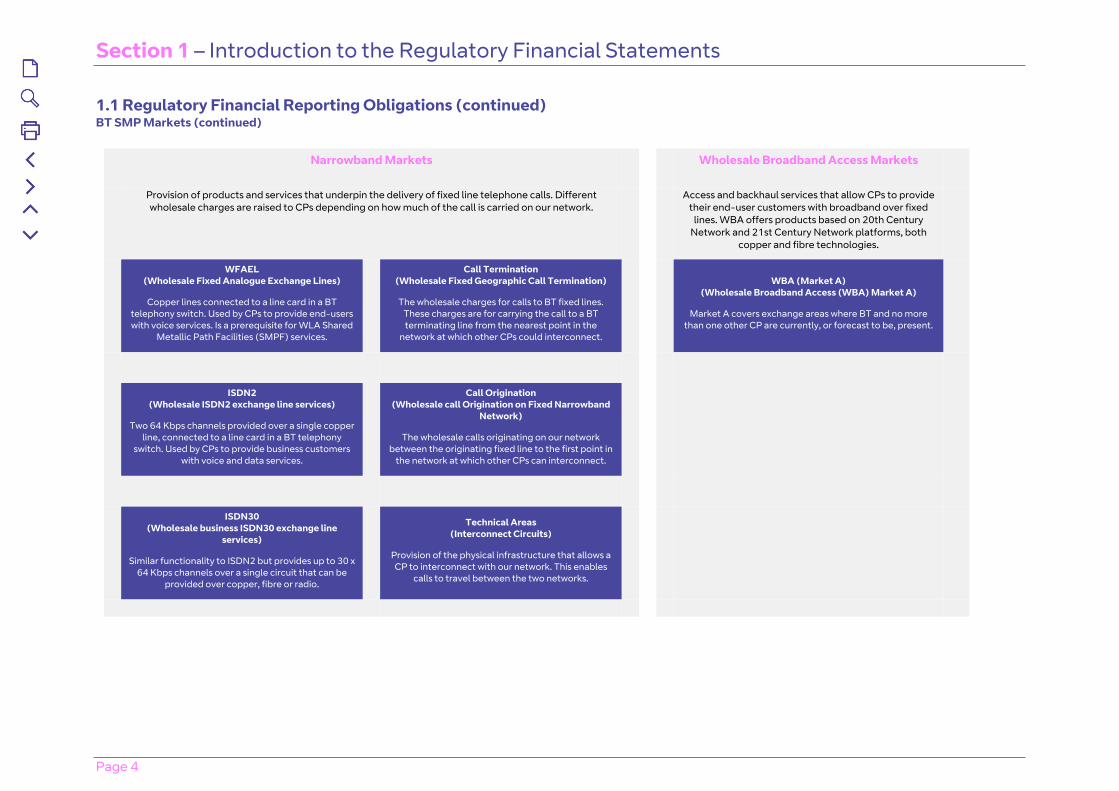
Narrowband Markets Wholesale Broadband Access Markets
Provision of products and services that underpin the delivery of fixed line telephone calls. Different wholesale charges are raised to CPs depending on how much of the call is carried on our network.
Access and backhaul services that allow CPs to provide their end-user customers with broadband over fixed
lines. WBA offers products based on 20th Century Network and 21st Century Network platforms, both
copper and fibre technologies.
WFAEL(Wholesale Fixed Analogue Exchange Lines)
Copper lines connected to a line card in a BT telephony switch. Used by CPs to provide end-users with voice services. Is a prerequisite for WLA Shared
Metallic Path Facilities (SMPF) services.
Call Termination(Wholesale Fixed Geographic Call Termination)
The wholesale charges for calls to BT fixed lines. These charges are for carrying the call to a BT terminating line from the nearest point in the
network at which other CPs could interconnect.
WBA (Market A)(Wholesale Broadband Access (WBA) Market A)
Market A covers exchange areas where BT and no more than one other CP are currently, or forecast to be, present.
ISDN2(Wholesale ISDN2 exchange line services)
Two 64 Kbps channels provided over a single copper line, connected to a line card in a BT telephony
switch. Used by CPs to provide business customers with voice and data services.
Call Origination(Wholesale call Origination on Fixed Narrowband
Network)
The wholesale calls originating on our network between the originating fixed line to the first point in
the network at which other CPs can interconnect.
ISDN30(Wholesale business ISDN30 exchange line
services)
Similar functionality to ISDN2 but provides up to 30 x 64 Kbps channels over a single circuit that can be
provided over copper, fibre or radio.
Technical Areas(Interconnect Circuits)
Provision of the physical infrastructure that allows a CP to interconnect with our network. This enables
calls to travel between the two networks.
Section 1 – Introduction to the Regulatory Financial Statements
Page 5
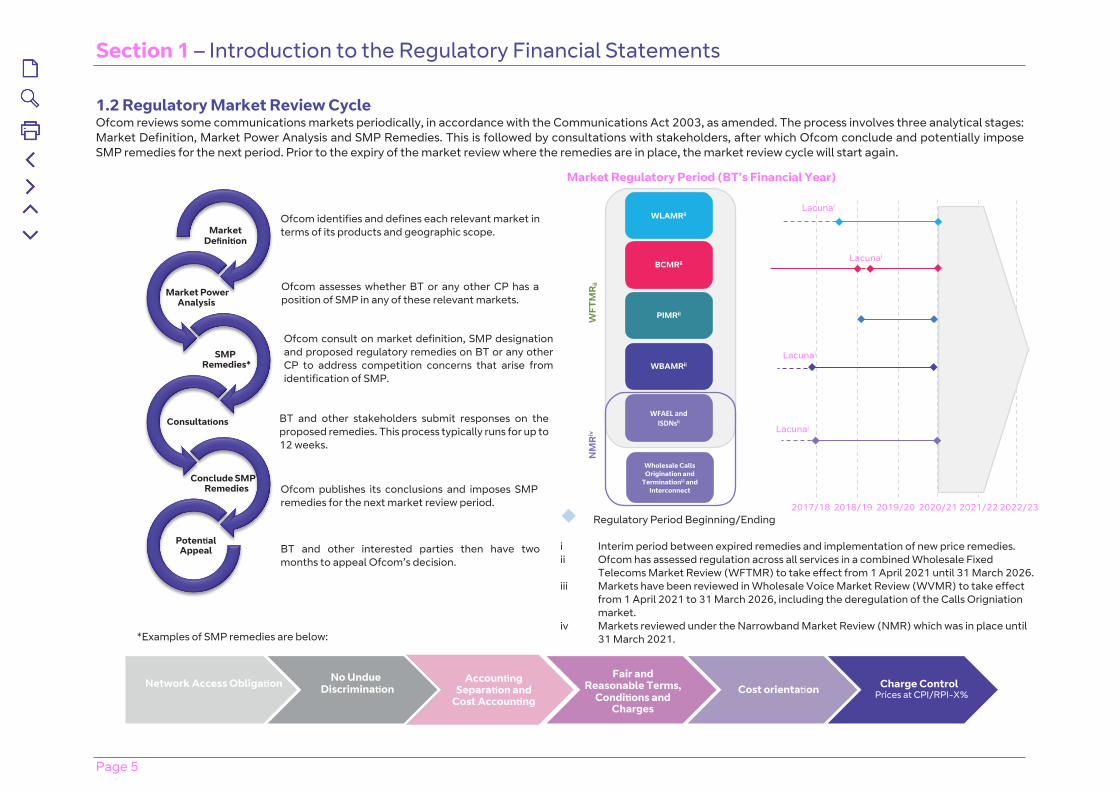
1.2 Regulatory Market Review CycleOfcom reviews some communications markets periodically, in accordance with the Communications Act 2003, as amended. The process involves three analytical stages: Market Definition, Market Power Analysis and SMP Remedies. This is followed by consultations with stakeholders, after which Ofcom conclude and potentially impose SMP remedies for the next period. Prior to the expiry of the market review where the remedies are in place, the market review cycle will start again.
WLAMRii
BCMRii
WFAEL and ISDNsii
WBAMRii
PIMRii
Wholesale Calls Origination and
Terminationiii and Interconnect
2017/18 2018/19 2019/20 2020/21 2021/22 2022/23
NM
Riv
WFT
MR
ii
Lacunai
Lacunai
Lacunai
Lacunai
Regulatory Period Beginning/Ending
i Interim period between expired remedies and implementation of new price remedies.ii Ofcom has assessed regulation across all services in a combined Wholesale Fixed
Telecoms Market Review (WFTMR) to take effect from 1 April 2021 until 31 March 2026.iii Markets have been reviewed in Wholesale Voice Market Review (WVMR) to take effect
from 1 April 2021 to 31 March 2026, including the deregulation of the Calls Origniation market.
iv Markets reviewed under the Narrowband Market Review (NMR) which was in place until 31 March 2021.*Examples of SMP remedies are below:
Market Regulatory Period (BT’s Financial Year)
Ofcom identifies and defines each relevant market in terms of its products and geographic scope.
Ofcom assesses whether BT or any other CP has a position of SMP in any of these relevant markets.
Ofcom consult on market definition, SMP designation and proposed regulatory remedies on BT or any other CP to address competition concerns that arise from identification of SMP.
BT and other stakeholders submit responses on the proposed remedies. This process typically runs for up to 12 weeks.
Ofcom publishes its conclusions and imposes SMP remedies for the next market review period.
BT and other interested parties then have two months to appeal Ofcom’s decision.
Market Defini�on
Market Power Analysis
SMP Remedies*
Consulta�ons
Conclude SMP Remedies
Poten�al Appeal
Network Access Obliga�on No Undue Discrimina�on
Accoun�ng Separa�on and
Cost Accoun�ng
Fair and Reasonable Terms,
Condi�ons and Charges
Cost orienta�on Charge ControlPrices at CPI/RPI-X%
Section 1 – Introduction to the Regulatory Financial Statements
Page 6
1.3 Regulatory Market Review Cycle from 1 April 2021 to 31 March 2026
Wholesale Fixed Telecoms Market Review (WFTMR)
In March 2021 Ofcom published their final statement for ‘Promoting competition and investment in fibre networks: Wholesale Fixed Telecoms Market Review 2021-2026’. This statement covers the period from 1 April 2021 to 31 March 2026.
Ofcom’s statement sets out a clear and long term framework that promotes network investment by all parties. It also ensures that consumers continue to have access to affordable broadband as new networks and services become available.
Ofcom’s investment support takes a number of forms. The new regulatory framework will have five-year market review periods instead of three and looks across all wholesale fixed telecoms markets rather than considering business and residential connectivity separately. To support competitive investment, the prices for legacy services will remain stable in real terms across the country at least until 2031. Future regulation of full-fibre services may be even later – it will depend on prevailing customer outcomes, investment levels and competition.
Wholesale Voice Market Review (WVMR)
Similarly, in March 2021 Ofcom published their final statement for ‘Wholesale Voice Markets Review 2021-2026’. This statement sets out the regulation of the wholesale markets that underpin landline and mobile telephone calls in the UK for the period from 1 April 2021 to 31 March 2026. Changes were made to the regulation of Call Origination and Termination, and Ofcom switched their focus away from traditional interconnection services towards modern, IP-based solutions.
1.4 Risks to regulated activities
Our 2021 Annual report details how the Group manages risk, including identifying, management and oversight of principal risks and enhancing the risk framework in the Strategic Report.
No further risks were identified to our regulated activities or SMP markets, other than those identified in our Annual report.
1.5 Factors that may impact future performanceThere are no known changes to accounting policies or business changes that may impact future performance for the 2021/22 RFS.
1.6 Overall Financial PerformanceDuring the year Return on Capital Employed (ROCE) for total Openreach Markets decreased 2 percentage points to 7.3%. This was primarily driven by reduced CCA holding gains on duct and copper assets, combined with an increase in mean capital employed (MCE) driven by increased cash at bank and investment in the Access Fibre network.
ROCE for total Rest of BT SMP Markets increased by 6.6 percentage points to 21.7% driven primarily by increased bandwidth revenues in the WBA market.
Section 1 – Introduction to the Regulatory Financial Statements
Page 7
1.7 Regulatory Market ChangesPhysical Infrastructure Access Market
Key Market Regulatation
Ofcom published the final statement of the Physical Infrastructure Access Market Review (PIMR) on 28 June 2019, covering the period 1 April 2019 to 31 March 2021.
Ofcom directs BT to use three published services; Physical Infrastructure (PI) for active services, PIA rentals, and PIA ancillary charges. Prices for all services were set as part of the 2018 WLA Market Review, with the price control remaining in place until 31 March 2021, indexed on Consumer Price Index (CPI).
Ofcom directs BT to provide more granular service reporting for the PIA market from the year ended 31 March 2021. PI for active services, PIA rentals and PIA ancillary charges groups of network services shall be split into the individual services (i) spine duct (ii) lead in duct (iii) poles (iv) manholes and (v) junction boxes where the combined internal and external revenues exceed £5m in any given financial year for the individual services.
There were no other regulatory changes to the PIA Market in the 2021 financial year.
The PIA market has been reviewed by Ofcom as part of the WFTMR, which has taken effect from 1 April 2021.
Summary of Market Financial Performance
Revenue increased to £712m and remains almost entirely internal (99.7%). This is an increase of £106m compared to the 2019/20 RFS results. This increase was driven by the increased costs and MCE detailed below, as internal revenue represents a recharge to the downstream markets at cost plus an allowable return (7.1% of MCE).
Costs increased to £344m as a result of decreased CCA holding gains.
MCE increased by 4.5% to £5,165m as a result of continued investment in local duct for optical fibre.
ROCE has stayed consistent year on year at 7.1%, as internal PIA revenue earns the allowable return of 7.1%, and less than 1% of PIA revenue is external.
Section 1 – Introduction to the Regulatory Financial Statements
Page 8
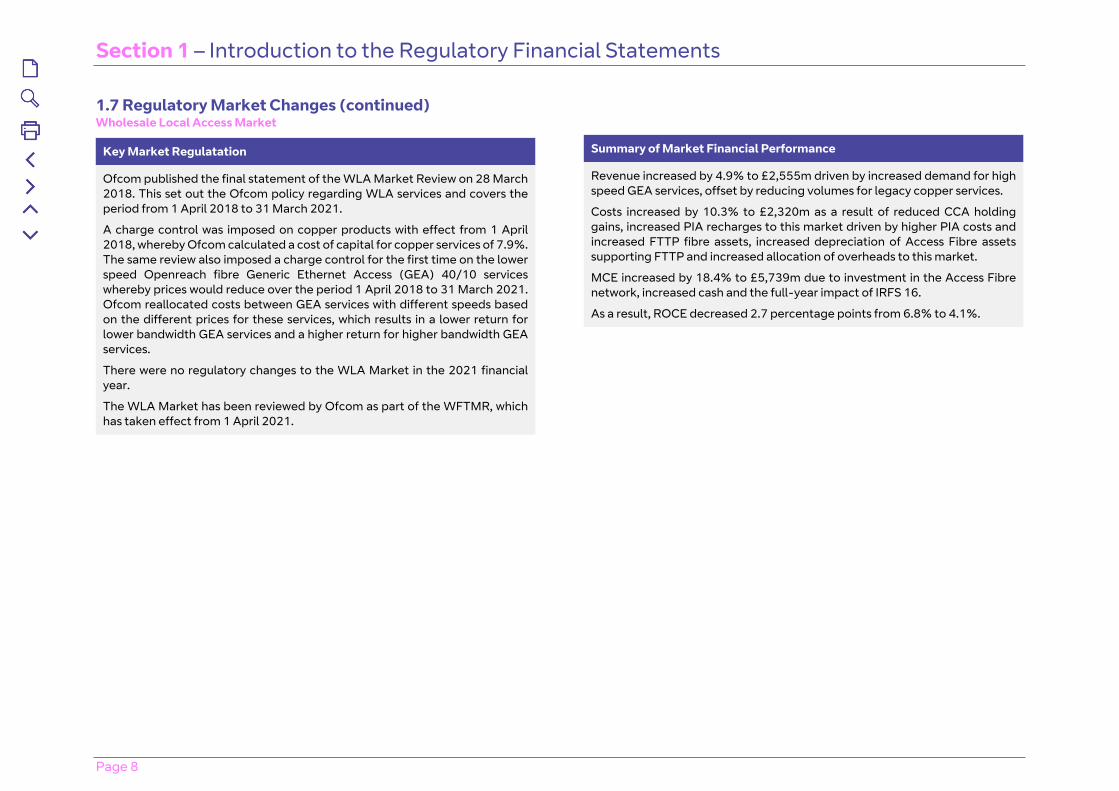
1.7 Regulatory Market Changes (continued)Wholesale Local Access Market
Key Market Regulatation
Ofcom published the final statement of the WLA Market Review on 28 March 2018. This set out the Ofcom policy regarding WLA services and covers the period from 1 April 2018 to 31 March 2021.
A charge control was imposed on copper products with effect from 1 April 2018, whereby Ofcom calculated a cost of capital for copper services of 7.9%. The same review also imposed a charge control for the first time on the lower speed Openreach fibre Generic Ethernet Access (GEA) 40/10 services whereby prices would reduce over the period 1 April 2018 to 31 March 2021. Ofcom reallocated costs between GEA services with different speeds based on the different prices for these services, which results in a lower return for lower bandwidth GEA services and a higher return for higher bandwidth GEA services.
There were no regulatory changes to the WLA Market in the 2021 financial year.
The WLA Market has been reviewed by Ofcom as part of the WFTMR, which has taken effect from 1 April 2021.
Summary of Market Financial Performance
Revenue increased by 4.9% to £2,555m driven by increased demand for high speed GEA services, offset by reducing volumes for legacy copper services.
Costs increased by 10.3% to £2,320m as a result of reduced CCA holding gains, increased PIA recharges to this market driven by higher PIA costs and increased FTTP fibre assets, increased depreciation of Access Fibre assets supporting FTTP and increased allocation of overheads to this market.
MCE increased by 18.4% to £5,739m due to investment in the Access Fibre network, increased cash and the full-year impact of IRFS 16.
As a result, ROCE decreased 2.7 percentage points from 6.8% to 4.1%.

Section 1 – Introduction to the Regulatory Financial Statements
Page 9
1.7 Regulatory Market Changes (continued)Business Connectivity Markets
Key Market Regulatation
Ofcom’s published the final statement of the Business Connectivity Market Review (BCMR) in June 2019, covering the period from 1 April 2019 to 31 March 2021.
BT is required to provide access to dark fibre (on reasonable request) for inter-exchange connectivity circuits from and to BT Only exchanges. As such, Ofcom’s Regulatory Financial Reporting (RFR) statement, dated 12 July 2019 (Direction 8 of the A1 Directions), directs BT to report Dark Fibre Revenues and Costs in respect of the 2019 Business Connectivity Markets for six new Services and two new Network Components.
There were no regulatory changes to the Business Connectivity Markets in the 2021 financial year.
The Business Connectivity Markets have been reviewed by Ofcom as part of the WFTMR, which has taken effect from 1 April 2021.
Summary of Market Financial Performance
ROCE for the Business Connectivity markets is up 3.6 percentage points, to 12.9%, driven by the Access Markets:
Access Markets
Revenue increased 14.3% to £646m as a result of continuing increases in demand for high bandwidth Ethernet and Optical products.
Costs only increased 2.6% to £522m, as volume-driven increases were offset by increased allocation of overheads to the WLA market.
MCE increased 18.6% to £1,388m as a result of investment in Access Fibre to support the additional volumes, as well as increased cash and the full-year impact of IFRS 16.
As a result, ROCE increased 4.1 percentage points to 8.9%.
Inter-exchange Markets
Revenue increased 11.0% to £172m, largely due to volume increases in Ethernet Backhaul Direct (EBD).
Costs increased 6.8% to £94m, largely due to volume increases.
MCE increased 22.0% to £183m, driven by increased cash and the full-year impact of IFRS 16.
As a result, ROCE decreased 2.0 percentage points to 42.6%.
Section 1 – Introduction to the Regulatory Financial Statements
Page 10
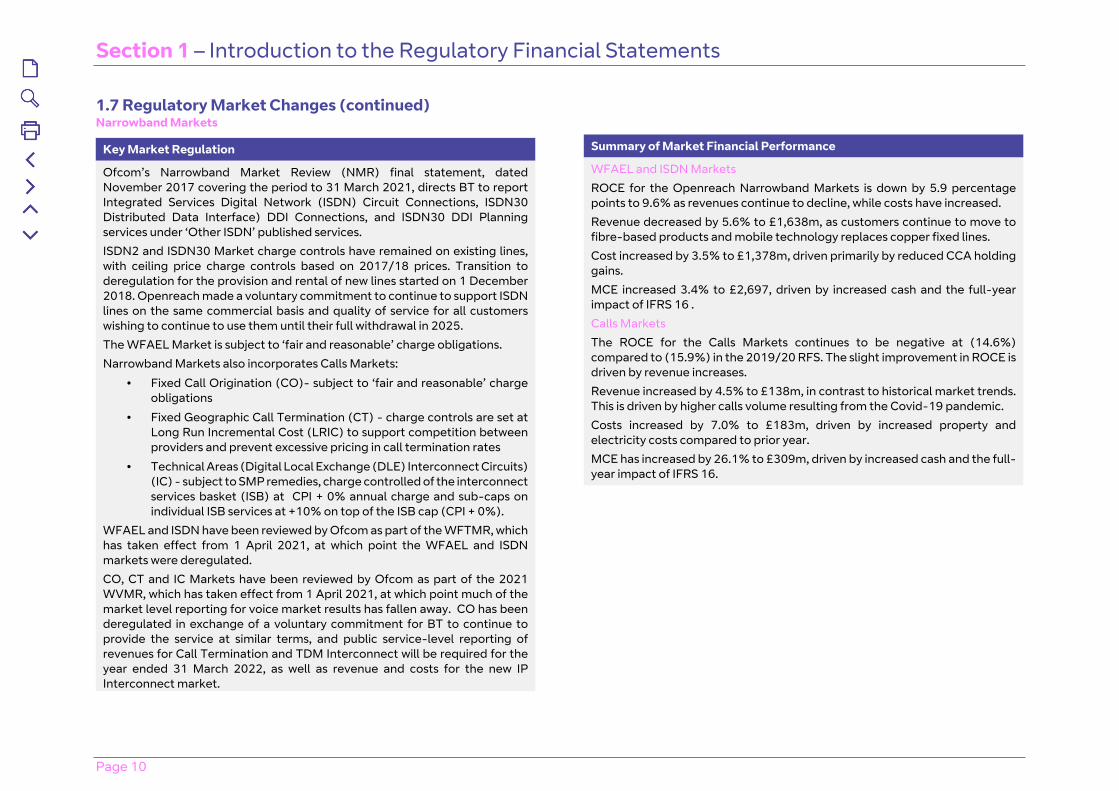
1.7 Regulatory Market Changes (continued)Narrowband Markets
Key Market Regulation
Ofcom’s Narrowband Market Review (NMR) final statement, dated November 2017 covering the period to 31 March 2021, directs BT to report Integrated Services Digital Network (ISDN) Circuit Connections, ISDN30 Distributed Data Interface) DDI Connections, and ISDN30 DDI Planning services under ‘Other ISDN’ published services.
ISDN2 and ISDN30 Market charge controls have remained on existing lines, with ceiling price charge controls based on 2017/18 prices. Transition to deregulation for the provision and rental of new lines started on 1 December 2018. Openreach made a voluntary commitment to continue to support ISDN lines on the same commercial basis and quality of service for all customers wishing to continue to use them until their full withdrawal in 2025.
The WFAEL Market is subject to ‘fair and reasonable’ charge obligations.
Narrowband Markets also incorporates Calls Markets:
• Fixed Call Origination (CO)- subject to ‘fair and reasonable’ charge obligations
• Fixed Geographic Call Termination (CT) - charge controls are set at Long Run Incremental Cost (LRIC) to support competition between providers and prevent excessive pricing in call termination rates
• Technical Areas (Digital Local Exchange (DLE) Interconnect Circuits) (IC) - subject to SMP remedies, charge controlled of the interconnect services basket (ISB) at CPI + 0% annual charge and sub-caps on individual ISB services at +10% on top of the ISB cap (CPI + 0%).
WFAEL and ISDN have been reviewed by Ofcom as part of the WFTMR, which has taken effect from 1 April 2021, at which point the WFAEL and ISDN markets were deregulated.
CO, CT and IC Markets have been reviewed by Ofcom as part of the 2021 WVMR, which has taken effect from 1 April 2021, at which point much of the market level reporting for voice market results has fallen away. CO has been deregulated in exchange of a voluntary commitment for BT to continue to provide the service at similar terms, and public service-level reporting of revenues for Call Termination and TDM Interconnect will be required for the year ended 31 March 2022, as well as revenue and costs for the new IP Interconnect market.
Summary of Market Financial Performance
WFAEL and ISDN Markets
ROCE for the Openreach Narrowband Markets is down by 5.9 percentage points to 9.6% as revenues continue to decline, while costs have increased.
Revenue decreased by 5.6% to £1,638m, as customers continue to move to fibre-based products and mobile technology replaces copper fixed lines.
Cost increased by 3.5% to £1,378m, driven primarily by reduced CCA holding gains.
MCE increased 3.4% to £2,697, driven by increased cash and the full-year impact of IFRS 16 .
Calls Markets
The ROCE for the Calls Markets continues to be negative at (14.6%) compared to (15.9%) in the 2019/20 RFS. The slight improvement in ROCE is driven by revenue increases.
Revenue increased by 4.5% to £138m, in contrast to historical market trends. This is driven by higher calls volume resulting from the Covid-19 pandemic.
Costs increased by 7.0% to £183m, driven by increased property and electricity costs compared to prior year.
MCE has increased by 26.1% to £309m, driven by increased cash and the full-year impact of IFRS 16.
Section 1 – Introduction to the Regulatory Financial Statements
Page 11
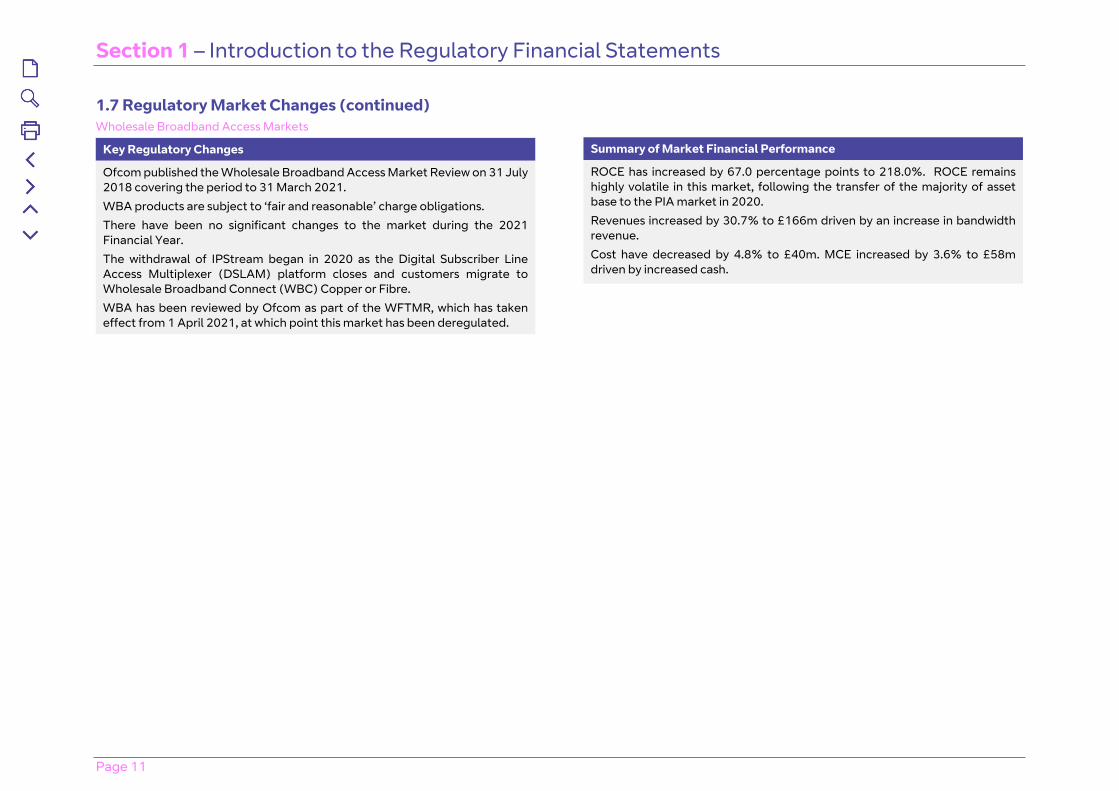
1.7 Regulatory Market Changes (continued)Wholesale Broadband Access Markets
Key Regulatory Changes
Ofcom published the Wholesale Broadband Access Market Review on 31 July 2018 covering the period to 31 March 2021.
WBA products are subject to ‘fair and reasonable’ charge obligations.
There have been no significant changes to the market during the 2021 Financial Year.
The withdrawal of IPStream began in 2020 as the Digital Subscriber Line Access Multiplexer (DSLAM) platform closes and customers migrate to Wholesale Broadband Connect (WBC) Copper or Fibre.
WBA has been reviewed by Ofcom as part of the WFTMR, which has taken effect from 1 April 2021, at which point this market has been deregulated.
Summary of Market Financial Performance
ROCE has increased by 67.0 percentage points to 218.0%. ROCE remains highly volatile in this market, following the transfer of the majority of asset base to the PIA market in 2020.
Revenues increased by 30.7% to £166m driven by an increase in bandwidth revenue.
Cost have decreased by 4.8% to £40m. MCE increased by 3.6% to £58m driven by increased cash.

Page 12
Section 2Basis of Preparation
Section 2 – Basis of Preparation
Page 13
2.1 Basis of Preparation2.1.1 Regulatory Accounting Framework
The Company has prepared the RFS in accordance with the Regulatory Accounting Principles (RAP) (as described in Section 2.1.2 below) and Accounting Methodology Document (AMD) (as described in Section 2.1.3 below), by disaggregating balances recorded in the general ledgers and other accounting records of the Group.
The RAP and AMD set out the framework under which the RFS are prepared.
In accordance with Section 435(1) of the Companies Act 2006, these RFS are not our statutory accounts.
The Group financial statements consolidate the financial statements of BT Group plc and its subsidiaries, and include its share of the results of associates and joint ventures using the equity method of accounting.
Our Annual Report details the basis of preparation and explains the accounting policies adopted by the Group. Our Annual Report 2021, on which the independent external auditors issued an unqualified report, did not contain a statement under Section 498(2) or 498(3) of the Companies Act 2006 and has been delivered to the Registrar of Companies.
2.1.2 Regulatory Accounting Principles
The RAP are the principles we apply or use in the preparation of the RFS. For example, we must attribute revenues, costs, assets and liabilities in accordance with the activities which cause the revenues to be earned, or costs to be incurred, or assets to be acquired, or liabilities to be incurred respectively.
Ofcom set out its conclusions in the Regulatory Financial Reporting Final Statement it issued on 20 May 2014 that, in preparing the RFS, BT shall comply with the RAP, including the requirement for consistency with regulatory decisions.
This requirement is reiterated in the RAP amended by Ofcom’s SMP conditions imposed following market reviews, most recently within the ‘Promoting competition and investment in fibre networks - review of the Physical Infrastructure and Business Connectivity Markets’ Final Statement dated 28 June 2019: Annex 26, Schedule 1: PIMR SMP Conditions (BT) - condition 11.8; and Annex 26, Schedule 1: BCMR SMP Conditions (BT) - condition 11.8.
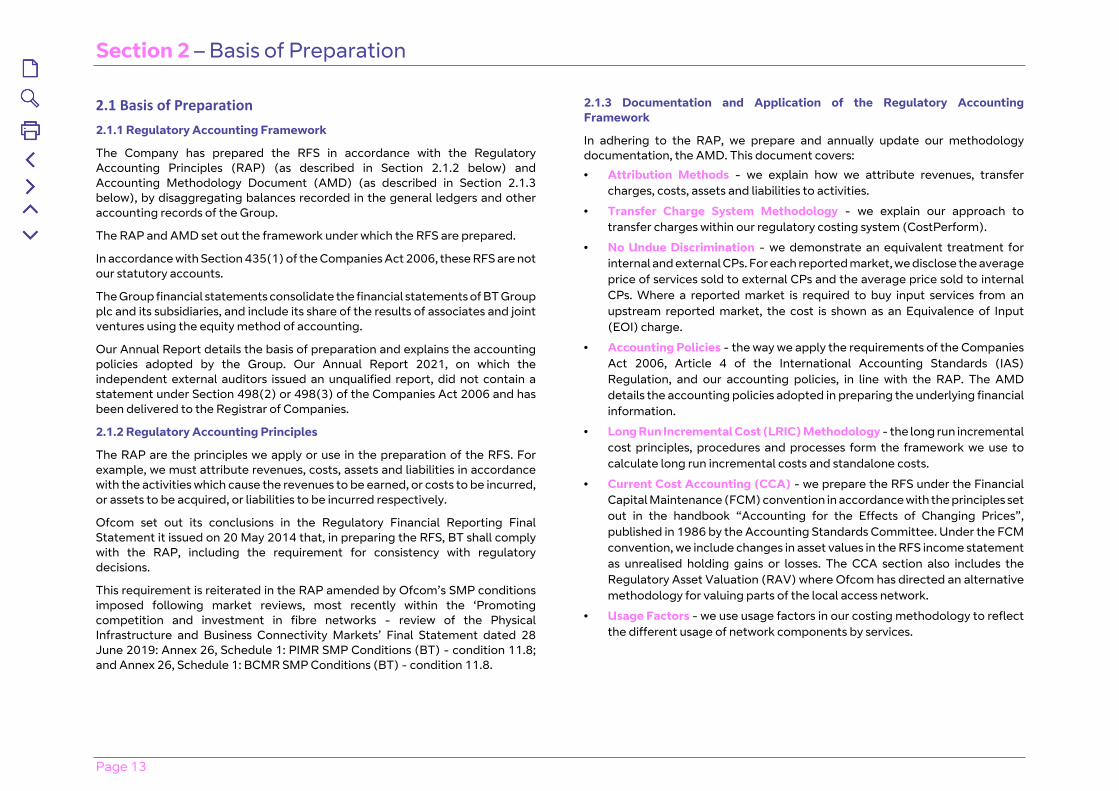
2.1.3 Documentation and Application of the Regulatory Accounting Framework
In adhering to the RAP, we prepare and annually update our methodology documentation, the AMD. This document covers:
• Attribution Methods - we explain how we attribute revenues, transfer charges, costs, assets and liabilities to activities.
• Transfer Charge System Methodology - we explain our approach to transfer charges within our regulatory costing system (CostPerform).
• No Undue Discrimination - we demonstrate an equivalent treatment for internal and external CPs. For each reported market, we disclose the average price of services sold to external CPs and the average price sold to internal CPs. Where a reported market is required to buy input services from an upstream reported market, the cost is shown as an Equivalence of Input (EOI) charge.
• Accounting Policies - the way we apply the requirements of the Companies Act 2006, Article 4 of the International Accounting Standards (IAS) Regulation, and our accounting policies, in line with the RAP. The AMD details the accounting policies adopted in preparing the underlying financial information.
• Long Run Incremental Cost (LRIC) Methodology - the long run incremental cost principles, procedures and processes form the framework we use to calculate long run incremental costs and standalone costs.
• Current Cost Accounting (CCA) - we prepare the RFS under the Financial Capital Maintenance (FCM) convention in accordance with the principles set out in the handbook “Accounting for the Effects of Changing Prices”, published in 1986 by the Accounting Standards Committee. Under the FCM convention, we include changes in asset values in the RFS income statement as unrealised holding gains or losses. The CCA section also includes the Regulatory Asset Valuation (RAV) where Ofcom has directed an alternative methodology for valuing parts of the local access network.
• Usage Factors - we use usage factors in our costing methodology to reflect the different usage of network components by services.
Section 2 – Basis of Preparation
Page 14
2.1.3 Documentation and Application of the Regulatory Accounting Framework (continued)
In addition to the AMD, we also publish a Wholesale Catalogue, which separately identifies and describes services which are internally, externally, or both internally and externally supplied, and those which are used in the course of supplying other wholesale services.
The product and geographic markets defined by Ofcom’s Final Statements do not correspond to how the Group is organised for management and accounting purposes. The RFS are therefore produced by overlaying the requirements of the regulatory reporting framework on the management and accounting structure of the Group.
We reconcile the RFS to our statutory accounts (in Section 5 of this report) and we explain any differences.
For the purposes of the RFS, we calculate Fully Allocated Cost (FAC) for our network components including a Return on MCE attributed to that component.
Due to the complex nature of the RFS, figures in this report are individually rounded to the nearest relevant unit (e.g. £m or £0.1m). For values of less than £50,000 these round to a 0, and where there is no value this is shown as “-”. Totals and sub-totals are calculated based on these rounded figures and percentages are based on unrounded figures. Where required by the Final Statements, rounding differences are shown on each individual schedule. Where rounding differences are not shown minor summation inconsistencies may arise between schedules.
2.1.4 Final Statements set out by Ofcom
Below are the Final Statements setting out the legal conditions and directions relevant to the RFS, to which we have complied with, for the year ended 31 March 2021:
• BT Regulatory Financial Reporting Statement 12 July 2019;
• Promoting competition and investment in fibre networks: review of the Physical Infrastructure and Business Connectivity Markets Final Statement 28 June 2019;
• Regulatory Financial Reporting Final Statement 20 March 2019;
• Wholesale Broadband Access Market Review Statement 31 July 2018;
• Wholesale Local Access Market Review Statement 28 March 2018; and
• Narrowband Market Review Statement 30 November 2017.
2.1.5 Changes to BT’s Financial Reporting Obligations
There were no changes to BT’s Financial Reporting Obligations between 1 April 2020 and 31 March 2021.
The changes resultant of the WFTMR, as set out in Section 1.2, will be implemented from 1 April 2021 and reflected in the 2021/22 RFS.
2.1.6 Comparability of Current and Prior Year Results
The 2020/21 results are prepared in accordance with the AMD issued on 30 July 2021.
The restated comparatives for the year ended 31 March 2020 reflect:
• methodology changes listed in the CCN 2021, as summarised in section 4.1.2 of Appendix 4; and
• all known errors above Ofcom’s defined materiality threshold as described in section 4.1.3 of Appendix 4.
The impact of these changes is shown in section 4.1.4 of Appendix 4.
IFRS 16
As set out in the 2019/20 RFS, BT group adopted IFRS 16 on a modified retrospective basis in the 2020 Financial year. We report MCE in the RFS calculated as the arithmetic mean of the opening and closing capital employed in the year, as such this is the first full year adoption of IFRS 16 on reported MCE.

Page 15
Section 3Statement of Responsibility
Section 3 – Statement of Responsibility
Page 16
3.1 Statement of ResponsibilityBritish Telecommunications plc (the “Company”) is required to prepare the RFS in accordance with the Final Statements as described in Section 2.1.4 ‘Final Statements set out by Ofcom’.
The RFS include comparative information for the year ended 31 March 2020 originally published on 31 July 2020 (the “2019/20 RFS”). The 2019/20 RFS were subsequently subject to certain restatements and re-presentations detailed in section 2.1.6. The Reconciliation Report (Appendix 4) provides additional detail on the impact of these methodology changes and errors identified subsequent to publishing the 2019/20 RFS.
The directors confirm to the best of their knowledge that the RFS for the year ended 31 March 2021 have been prepared in accordance with the requirements of the Final Statements, the AMD and Wholesale Catalogue issued on 30 July 2021 and in accordance with the RAP.
The directors confirm to the best of their knowledge that the comparative information for the year ended 31 March 2020 included in the RFS have been prepared in accordance with the requirements of the Final Statements and the AMD issued on 31 July 2020 subject to certain restatements and re-presentations as detailed in Appendix 4.
The directors are responsible for the maintenance and integrity of the corporate and financial information included on the Company’s website. Legislation in the United Kingdom governing the preparation and dissemination of financial statements may differ from legislation in other jurisdictions.
Openreach
The Company is also required in accordance with the Commitments to separately report the financial results of Openreach within the RFS as explained in Section 1.1.
The Commitments require the Company to report the financial results of Openreach, including the following:
• Openreach financial information such as headline revenue, operating costs disaggregated by major cost category, depreciation, revenues broken down into the broad product groups that Openreach Business Unit provides and further split between internal and external sales, and separately identified payments to other parts of BT for products that form inputs to Openreach Business Unit products (e.g. electronics); and
• Reconciliation of Openreach’s revenue, operating profit and return or profit before tax (and other such items as agreed between the Company and Ofcom) with financial information about Openreach shown in BT’s Annual Report.
The Openreach Financial Statements can be found in Section 5 and include comparative information for the year ended 31 March 2020. These comparatives were subject to certain restatements and re-presentations detailed in Appendix 4.
The form, content and basis of preparation of the financial results of Openreach follow those used in the preparation of the RFS as described above, except where differences are agreed with Ofcom.
The directors confirm to the best of their knowledge that the Openreach Financial Statements for the year ended 31 March 2021, have been prepared in accordance with the AMD and Wholesale Catalogue issued on 30 July 2021, and comply with the financial reporting requirements of the Commitments, most recently issued on 28 May 2021.
The directors confirm to the best of their knowledge that the comparative information for the Openreach Financial Statements for the year ended 31 March 2020 included in the RFS, have been prepared in accordance with the requirements of the Final Statements and the AMD issued on 31 July 2020 subject to certain restatements and re-presentations as detailed in Appendix 4, and comply with the financial reporting requirements of the Commitments, most recently issued on 28 May 2021.
Approved by the Board of Directors and signed on its behalf by:
Simon Lowth
Director, British Telecommunications plc
30 July 2021

Page 17
Section 4Audit Report

Section 4 – Report of Independent Auditors
Page 18
4.1 Independent Auditor’s report to the Directors of British Telecommunications plc and the Office of Communications (“Ofcom”)Opinion
We have audited the Summary of Market Performance, the Review of the Physical Infrastructure Markets, the Review of Wholesale Local Access Markets, the Review of Business Connectivity Markets, the Review of Narrowband Markets and the Review of Wholesale Broadband Access Markets and the Network Activity Statements as set out in sections 5 to 10 and Appendix 1 on pages 23 to 127 and the accounting policies in the Basis of Preparation on pages 12 to 14 together referred to as the “Market Financial Statements”, the Reconciliation Report – Impact of Methodology Changes and Errors (“Reconciliation Report”) set out in Appendix 4 on pages 132 to 143 of BT Group plc (the “Group”), together referred to as the “2021 Financial Statements”, contained within the Regulatory Financial Statements 2021.
The “Market Summary Statements”, within the Market Financial Statements, comprise the statements of financial performance for each market for the year ended 31 March 2021 shown within the Performance Summary by Market or Technical Area on page 24 and 25, including those listed below on which we express an opinion (the “PPIA Markets”):
• Physical Infrastructure Access; • Wholesale Local Access;• Contemporary Interface Access Services - BT Only; • Contemporary Interface Access Services - BT +1; • Technical Area – Inter-Exchange Connectivity (Non-Dark Fibre);• Wholesale Fixed Analogue Exchange Lines; • ISDN30;• Fixed Call Origination; • Fixed Geographic Call Termination; and• Wholesale Broadband Access (Market A).
For the avoidance of doubt, we do not express separate audit opinions in respect of the statements of financial performance for:
• High Network Reach Areas outside Central London Area; • Technical Area - Inter-Exchange Connectivity (Dark Fibre);• ISDN 2; and• Technical areas (DLE Interconnect Circuits).
The “Openreach Information”, within the Market Financial Statements, comprises the figures for “Total Openreach” within the Performance Summary by Market or Technical Area on pages 24 to 25, Attribution of Wholesale Current Costs on pages 26 to 29 and Attribution of Wholesale Current Cost Mean Capital Employed on pages 30 to 33 together with the reconciliation tables headed “Openreach” on pages 35 and 36 and the notes on page 34 where they relate to these tables.
The Market Financial Statements include comparative information for the year ended 31 March 2020 first published on 31 July 2020 which has been restated and re-presented, “Restated Financial Statements”, to comply with the Final Statements issued by Ofcom listed in Section 2.1.4 on page 14 (the ”Final Statements”), and in accordance with the Accounting Methodology Documents and the Wholesale Catalogue dated 30 July 2021, as amended, where applicable, in accordance with “Comparability of Current and Prior Year Results” on page 14.
In our opinion:
a) the Market Financial Statements as a whole, and the Market Summary Statements for each of the PPIA Markets for the year ended 31 March 2021 have been properly prepared, in all material respects, in accordance with the procedures defined in the Accounting Methodology Documents and the Wholesale Catalogue dated 30 July 2021 and comply with the disclosure requirements of the Final Statements;
b) the Openreach Information for the year ended 31 March 2021 has been properly prepared, in all material respects, in accordance with the procedures defined in the Accounting Methodology Documents and the Wholesale Catalogue dated 30 July 2021 and complies with the disclosure requirements of Commitments of British Telecommunications plc and Openreach Limited to Ofcom made on 28 May 2021 (the “Commitments”);
c) the Restated Financial Statements as a whole have been properly prepared, in all material respects, in accordance with the procedures defined in the Accounting Methodology Documents and the Wholesale Catalogue dated 31 July 2020 as amended, where applicable, in accordance with note 2.1.6 “Comparability of Current and Prior Year results” on page 14 and comply with the disclosure requirements of the Final Statements;
d) for the Reconciliation Report, all Material Changes, as defined in the Final Statements, were included in the Change Control Notification published on 31 March 2021; the description of each of the Material Changes provided by BT in the Change Control Notification is accurate; BT included each and every Material Change in the Reconciliation Report and correctly calculated the
Section 4 – Report of Independent Auditors
Page 19
impact of all changes presented in the Market Financial Statements; the description of each of the Material Errors, as defined in Final Statements, provided by BT in the Reconciliation Report is accurate; and the corrected figures for the year ended 31 March 2020 set out in the Reconciliation Report are properly prepared, in all material respects, in accordance with the Accounting Methodology Documents for the year ended 31 March 2020 had these Accounting Methodology Documents not included these Material Errors.
Basis for opinion
We conducted our audit in accordance with International Standards on Auditing (UK) (“ISAs (UK)”), including ISA (UK) 800, the terms of our engagement letter dated 31 March 2021 and having regard to the guidance contained in ICAEW Technical Release 02/16AAF (Revised) Reporting to regulators on regulatory accounts. Our responsibilities under ISAs (UK) are further described in the Auditors’ responsibilities section of our report. We have fulfilled our ethical responsibilities under, and are independent of the Group in accordance with, UK ethical requirements including the FRC Ethical Standard as applicable to listed public interest entities. We believe that the audit evidence we have obtained is sufficient and appropriate to provide a basis for our opinion.
We audited the statutory financial statements of BT Group plc (the “Statutory Financial Statements”) for the year ended 31 March 2021 (“the 2021 Statutory Financial Statements”) on which we expressed an unmodified audit opinion. Our audit report on the Statutory Financial Statements describes the scope of our Statutory Financial Statements audit. In conducting our subsequent audit of the 2021 Financial Statements, and in providing the opinions above, we have not performed any additional tests of the transactions and balances which are recorded in the general ledgers and other accounting records beyond those already performed for the purpose of the audit of the Statutory Financial Statements.
Emphasis of matter – special purpose basis of preparation
We draw attention to Section 2.1 in the 2021 Financial Statements which describes their basis of preparation. The 2021 Financial Statements have been prepared in accordance with a special purpose basis of preparation to allow the Group to comply with the requirements of the Final Statements issued by Ofcom. The nature, form and content of the 2021 Financial Statements are determined by Ofcom. It is not appropriate for us to assess whether the nature of the information being reported upon is suitable for Ofcom’s purposes. Accordingly, we make no such assessment.
The 2021 Financial Statements are separate from the Statutory Financial Statements of the Group and have not been prepared in accordance with
international accounting standards in conformity with the requirements of the Companies Act 2006 or in accordance with international financial reporting standards adopted pursuant to Regulation (EC) No 1606/2002 as it applies in the European Union. Financial information other than that prepared in accordance with international accounting standards in conformity with the requirements of the Companies Act 2006, or in accordance with international financial reporting standards adopted pursuant to Regulation (EC) No 1606/2002 as it applies in the European Union does not necessarily represent a true and fair view of the financial performance or financial position of the Group as shown in statutory financial statements prepared in accordance with the Companies Act 2006.
As a result, the 2021 Financial Statements may not be suitable for another purpose. Our opinion is not modified in respect of this matter.
Going concern
In relation to the 2021 Statutory Financial Statements issued on 13 May 2021, we had reported our conclusions in relation to going concern as follows:
• we considered that the Directors’ use of the going concern basis of accounting in the preparation of the 2021 Statutory Financial Statements is appropriate;
• we did not identify, and concurred with the Directors’ assessment that there is not, a material uncertainty related to events or conditions that, individually or collectively, may have cast significant doubt on the Group’s ability to continue as a going concern for the going concern period;
However, as we cannot predict all future events or conditions and as subsequent events may result in outcomes that are inconsistent with judgements that were reasonable at the time they were made, the above conclusions are not a guarantee that the Group will continue in operation.
Fraud and breaches of laws and regulations – ability to detect
Identifying and responding to risks of material misstatement due to fraud
To identify risks of material misstatement due to fraud (“fraud risks”) we assessed events or conditions that could indicate an incentive or pressure to commit fraud or provide an opportunity to commit fraud. Our risk assessment procedures included:
• Enquiring of directors, the audit committee and inspection of policy documentation as to the Group’s high-level policies and procedures to prevent and detect fraud, and the Group’s channel for “whistleblowing”, as well as whether they have knowledge of any actual, suspected or alleged fraud.
Section 4 – Report of Independent Auditors
Page 20
• Reading Board and Executive Committee minutes.• Using analytical procedures to identify any unusual or unexpected relationships.
We communicated identified fraud risks throughout the audit team and remained alert to any indications of fraud throughout the audit.
As required by auditing standards, and taking into account possible pressures to meet profit targets, recent revisions to guidance and our overall knowledge of the control environment, we perform procedures to address the risk of management override of controls, in particular the risk that Group may be in a position to make inappropriate accounting entries. On this audit we do not believe there is a fraud risk related to revenue recognition because non-long-term contract revenues are not judgemental and consist of a high number of low value transactions, and long-term contracts are generally low in complexity with most having a revenue recognition profile aligned to billing.
We did not identify any additional fraud risks.
We performed procedures including identifying journal entries posted in the general ledgers, used for the preparation of the 2021 Statutory Financial Statements, based on risk criteria and comparing the identified entries to supporting documentation. These included those posted by senior finance management, those posted and approved by the same user and those posted to unusual or seldom used accounts.
Identifying and responding to risks of material misstatement due to non-compliance with laws and regulations
We identified areas of laws and regulations that could reasonably be expected to have a material effect on the 2021 Financial Statements from our general commercial and sector experience, through discussion with the directors and other management (as required by auditing standards), and from inspection of the Group’s regulatory and legal correspondence and discussed with the directors and other management the policies and procedures regarding compliance with laws and regulations.
As the Group is regulated, our assessment of risks involved gaining an understanding of the control environment including the entity’s procedures for complying with regulatory requirements.
We communicated identified laws and regulations throughout our team and remained alert to any indications of noncompliance throughout the audit.
The potential effect of these laws and regulations on the 2021 Financial Statements varies considerably.
Firstly, the Group is subject to laws and regulations that directly affect the 2021 Financial Statements including the financial reporting aspects of the Ofcom regulations, and we assessed the extent of compliance with these regulations as part of our procedures on the related 2021 Financial Statement items.
Secondly, the Group is subject to many other laws and regulations where the consequences of non-compliance could have a material effect on amounts or disclosures in the 2021 Financial Statements, for instance through the imposition of fines or litigation or the loss of the Group’s licence to operate. We identified the following areas as those most likely to have such an effect: anti-bribery, regulations affecting telecommunication providers, and regulated nature of the Group’s activities (including compliance with Ofcom regulation). Auditing standards limit the required audit procedures to identify non-compliance with these laws and regulations to enquiry of the directors and other management and inspection of regulatory and legal correspondence, if any. Therefore, if a breach of operational regulations is not disclosed to us or evident from relevant correspondence, an audit will not detect that breach.
Context of the ability of the audit to detect fraud or breaches of law or regulation
Owing to the inherent limitations of an audit, there is an unavoidable risk that we may not have detected some material misstatements in the 2021 Financial Statements, even though we have properly planned and performed our audit in accordance with auditing standards. For example, the further removed non-compliance with laws and regulations is from the events and transactions reflected in the 2021 Financial Statements, the less likely the inherently limited procedures required by auditing standards would identify it.
In addition, as with any audit, there remained a higher risk of non-detection of fraud, as these may involve collusion, forgery, intentional omissions, misrepresentations, or the override of internal controls. Our audit procedures are designed to detect material misstatement. We are not responsible for preventing non-compliance or fraud and cannot be expected to detect non-compliance with all laws and regulations.
Other information
The other information comprises all information in the Regulatory Financial Statements 2021 other than the 2021 Financial Statements and our auditors’ report thereon.
The Directors are responsible for the other information. Our opinion on the 2021 Financial Statements does not cover the other information and, accordingly, we do not express an audit opinion or any form of assurance conclusion thereon.

Section 4 – Report of Independent Auditors
Page 21
Our responsibility is to read the other information and, in doing so, consider whether based on our 2021 Financial Statements audit work, the information therein is materially misstated or inconsistent with the 2021 Financial Statements or our audit knowledge. Based solely on that work we have not identified material misstatements in the other information.
Respective Responsibilities
Directors’ Responsibilities
As explained more fully in the Directors’ Statement of Responsibility set out on page 16 the directors of British Telecommunications plc (the “Company”) are responsible for the preparation of the 2021 Financial Statements, including the Market Financial Statements and the Reconciliation Report, in accordance with the Final Statements, as set out in Section 2 of this document, the Company’s Accounting Methodology Document and the Wholesale Catalogue dated 30 July 2021.
The Directors are also responsible for the preparation of the Openreach Information in accordance with the Commitments, the Final Statements, as set out in Section 2 of this document, the Company’s Accounting Methodology Document and the Wholesale Catalogue dated 30 July 2021.
The Directors are also responsible for the preparation of the Reconciliation Report under the current cost convention in accordance with: the Final Statements, as set out in Section 2 of this document, the Company’s Accounting Methodology Document and the Wholesale Catalogue dated 30 July 2021 in respect of information for the year ended 31 March 2021; and in accordance with the Final Statements, as set out in Section 2 of this document, the Company’s Accounting Methodology Document and the Wholesale Catalogue dated 31 July 2020, as amended, where applicable, in accordance with note 2.1.6 “Comparability of Current and Prior Year results” on page 14 in respect of information for the year ended 31 March 2020.
As explained in the “Basis of Preparation” on pages 13 and 14 the Company has, prepared the 2021 Financial Statements by disaggregating balances recorded in the general ledgers and other accounting records of the Group maintained in accordance with the Companies Act 2006 and used, in accordance with that Act, for the preparation of the Statutory Financial Statements for the years ended 31 March 2021 and 31 March 2020.
The Directors are also responsible for determining that the basis of preparation is acceptable in the circumstances and also for such internal control as they determine is necessary to enable the preparation of the 2021 Financial Statements that are free from material misstatement, whether due to fraud or error.
In preparing the 2021 Financial Statements, the directors are responsible for assessing the Group’s ability to continue as a going concern, disclosing as applicable matters related to going concern, and using the going concern basis of accounting unless the directors either intend to liquidate the Group or to cease operations, or have no realistic alternative but to do so. In this regard the directors’ assessment was made for the purposes of the preparation of the 2021 Statutory Financial Statements issued on 13 May 2021 and, therefore, covers a period of at least, but not limited to, twelve-month period from that date.
Auditors’ responsibilities
Our objectives are to obtain reasonable assurance about whether the following are free from material misstatement, whether due to fraud or error, and whether:
a) the Market Financial Statements as a whole, and the Market Summary Statements for each of the PPIA Markets for the year ended 31 March 2021 have been properly prepared, in all material respects, in accordance with the procedures defined in the Accounting Methodology Documents and the Wholesale Catalogue dated 30 July 2021 and comply with the disclosure requirements of the Final Statements;
b) the Openreach Information for the year ended 31 March 2021 has been properly prepared, in all material respects, in accordance with the procedures defined in the Accounting Methodology Documents and the Wholesale Catalogue dated 30 July 2021 and complies with the disclosure requirements of the Commitments of British Telecommunications plc and Openreach Limited;
c) the Restated Financial Statements as a whole have been properly prepared, in all material respects, in accordance with the procedures defined in the Accounting Methodology Documents and the Wholesale Catalogue dated 31 July 2020 as amended, where applicable, in accordance with note 2.1.6 “Comparability of Current and Prior Year results” on page 14 and comply with the disclosure requirements of the Final Statements; and
d) for the Reconciliation Report, all Material Changes, as defined in the Final Statements, were included in the Change Control Notification published on 31 March 2021; the description of each of the Material Changes provided by BT in the Change Control Notification is accurate; BT included each and every Material Change in the Reconciliation Report and correctly calculated the impact of all changes presented in the Market Financial Statements; the description of each of the Material Errors, as defined in Final Statements, provided by BT in the Reconciliation Report is accurate; and the corrected figures for the year ended 31 March 2020 set out in the Reconciliation Report

Section 4 – Report of Independent Auditors
Page 22
are properly prepared, in all material respects, in accordance with the Accounting Methodology Documents for the year ended 31 March 2020 had these Accounting Methodology Documents not included these Material Errors.
Our objective is also to issue our opinion in an auditor’s report. Reasonable assurance is a high level of assurance, but does not guarantee that an audit conducted in accordance with ISAs (UK) will always detect a material misstatement when it exists. Misstatements can arise from fraud or error and are considered material if, individually or in aggregate, they could reasonably be expected to influence the economic decisions of users taken on the basis of the 2021 Financial Statements.
As the preparation of the 2021 Financial Statements does not involve an assessment of the Group’s going concern at the date of this report, we have no responsibilities to assess going concern at the date of this report.
A further description of our responsibilities is located on the FRC's website at: www.frc.org.uk/auditorsresponsibilities, except as set out as follows.
We have not assessed whether the accounting policies are appropriate to the circumstances of the Group where these are laid down in the Final Statements as set out by Ofcom. Where the Final Statements do not give specific guidance on the accounting policies to be followed, our audit includes an assessment of whether the accounting policies adopted in respect of the transactions and balances required to be included in the 2021 Financial Statements are consistent with those used in the preparation of the statutory financial statements of the Group.
The purpose of our audit work and to whom we owe our responsibilities
This report is made, on terms that have been agreed, solely to BT Group plc and Ofcom in order to meet the requirements of the Final Statements issued by Ofcom. Our audit work has been undertaken so that we might state to BT Group plc and Ofcom those matters that we have agreed to state to them in our report, in order (a) to assist BT Group plc to meet its obligation as specified in the Final Statements issued by Ofcom to procure a report and (b) to facilitate the carrying out by the Regulator of its regulatory functions, and for no other purpose. To the fullest extent permitted by law, we do not accept or assume responsibility to anyone other than BT Group plc and the Regulator, for our audit work, for this report or for the opinions we have formed.
Our opinion on the Regulatory Accounts is separate from our opinion on the statutory financial statements of BT Group plc for the year ended 31 March 2021 on which we reported on 13 May 2021, which are prepared for a different purpose. Our audit report in relation to the statutory financial statements of BT Group plc (our “Statutory audit”) was made solely to the BT Group plc’s members, as a body, in accordance with Chapter 3 of Part 16 of the Companies Act 2006.
Our Statutory audit work was undertaken so that we might state to BT Group plc’s members those matters we are required to state to them in a statutory audit report and for no other purpose. In these circumstances, to the fullest extent permitted by law, we do not accept or assume responsibility for any other purpose or to any other person to whom our Statutory audit report is shown or into whose hands it may come save where expressly agreed by our prior consent in writing.
Engagement partner
The engagement partner on the audit resulting in this independent auditors’ report is John Luke.
KPMG LLPChartered Accountants15 Canada SquareLondon E14 5GL30 July 2021

Page 23
Section 5Summary of Market Performance
Section 5 – Summary of Market Performance
Page 24
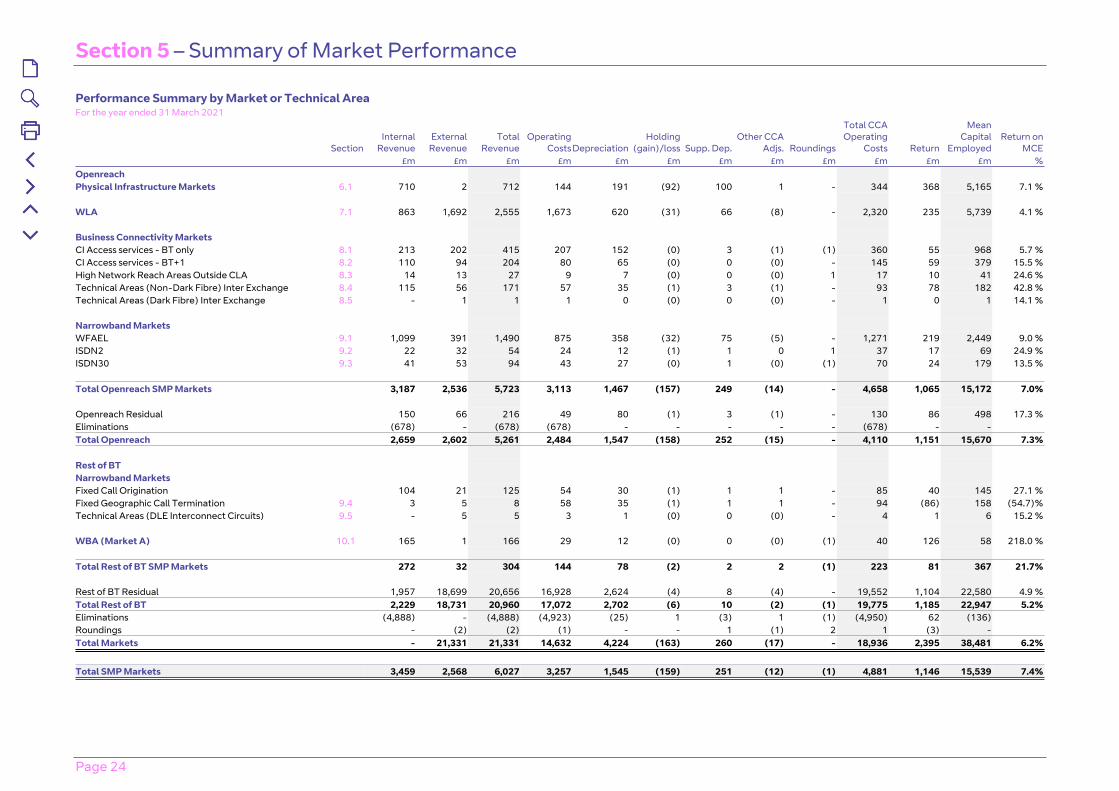
Performance Summary by Market or Technical AreaFor the year ended 31 March 2021
SectionInternal
RevenueExternal
RevenueTotal
RevenueOperating
Costs DepreciationHolding
(gain)/loss Supp. Dep.Other CCA
Adjs. Roundings
Total CCA Operating
Costs Return
Mean Capital
EmployedReturn on
MCE£m £m £m £m £m £m £m £m £m £m £m £m %
OpenreachPhysical Infrastructure Markets 6.1 710 2 712 144 191 (92) 100 1 - 344 368 5,165 7.1 %
WLA 7.1 863 1,692 2,555 1,673 620 (31) 66 (8) - 2,320 235 5,739 4.1 %
Business Connectivity MarketsCI Access services - BT only 8.1 213 202 415 207 152 (0) 3 (1) (1) 360 55 968 5.7 %CI Access services - BT+1 8.2 110 94 204 80 65 (0) 0 (0) - 145 59 379 15.5 %High Network Reach Areas Outside CLA 8.3 14 13 27 9 7 (0) 0 (0) 1 17 10 41 24.6 %Technical Areas (Non-Dark Fibre) Inter Exchange 8.4 115 56 171 57 35 (1) 3 (1) - 93 78 182 42.8 %Technical Areas (Dark Fibre) Inter Exchange 8.5 - 1 1 1 0 (0) 0 (0) - 1 0 1 14.1 %
Narrowband MarketsWFAEL 9.1 1,099 391 1,490 875 358 (32) 75 (5) - 1,271 219 2,449 9.0 %ISDN2 9.2 22 32 54 24 12 (1) 1 0 1 37 17 69 24.9 %ISDN30 9.3 41 53 94 43 27 (0) 1 (0) (1) 70 24 179 13.5 %
Total Openreach SMP Markets 3,187 2,536 5,723 3,113 1,467 (157) 249 (14) - 4,658 1,065 15,172 7.0%
Openreach Residual 150 66 216 49 80 (1) 3 (1) - 130 86 498 17.3 %Eliminations (678) - (678) (678) - - - - - (678) - -Total Openreach 2,659 2,602 5,261 2,484 1,547 (158) 252 (15) - 4,110 1,151 15,670 7.3%
Rest of BTNarrowband MarketsFixed Call Origination 104 21 125 54 30 (1) 1 1 - 85 40 145 27.1 %Fixed Geographic Call Termination 9.4 3 5 8 58 35 (1) 1 1 - 94 (86) 158 (54.7)%Technical Areas (DLE Interconnect Circuits) 9.5 - 5 5 3 1 (0) 0 (0) - 4 1 6 15.2 %
WBA (Market A) 10.1 165 1 166 29 12 (0) 0 (0) (1) 40 126 58 218.0 %
Total Rest of BT SMP Markets 272 32 304 144 78 (2) 2 2 (1) 223 81 367 21.7%
Rest of BT Residual 1,957 18,699 20,656 16,928 2,624 (4) 8 (4) - 19,552 1,104 22,580 4.9 %Total Rest of BT 2,229 18,731 20,960 17,072 2,702 (6) 10 (2) (1) 19,775 1,185 22,947 5.2%Eliminations (4,888) - (4,888) (4,923) (25) 1 (3) 1 (1) (4,950) 62 (136)Roundings - (2) (2) (1) - - 1 (1) 2 1 (3) -Total Markets - 21,331 21,331 14,632 4,224 (163) 260 (17) - 18,936 2,395 38,481 6.2%
Total SMP Markets 3,459 2,568 6,027 3,257 1,545 (159) 251 (12) (1) 4,881 1,146 15,539 7.4%
Section 5 – Summary of Market Performance
Page 25
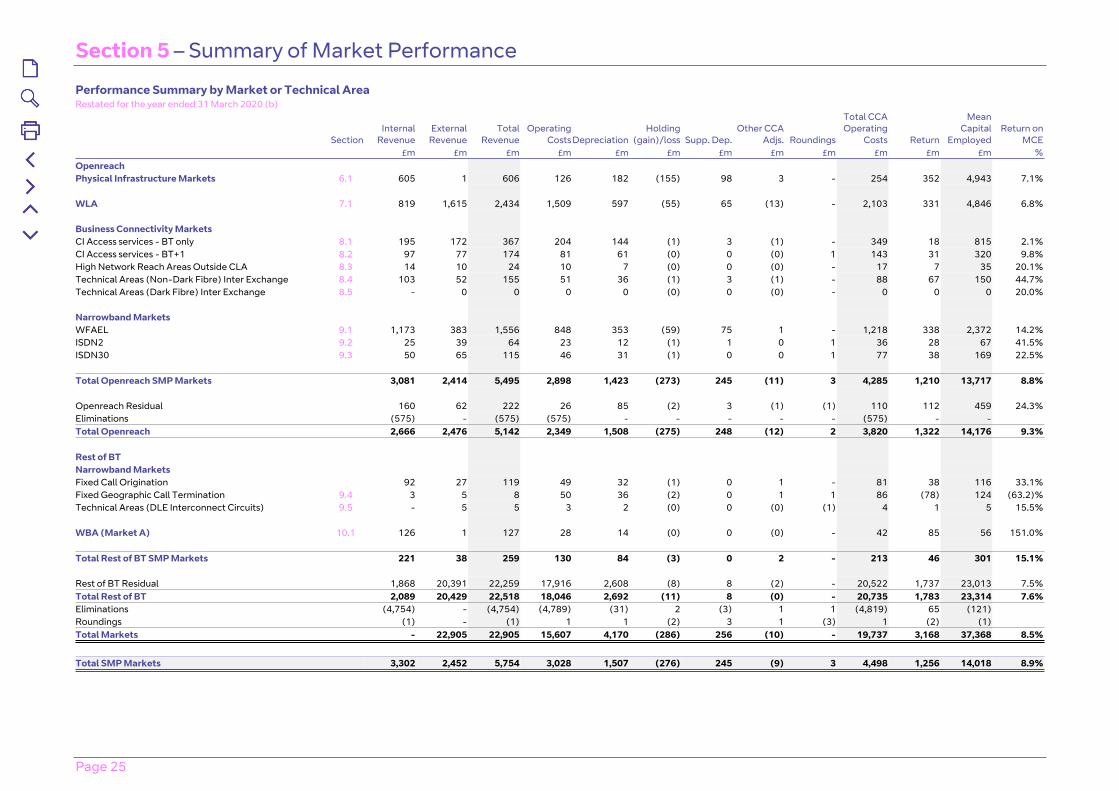
Performance Summary by Market or Technical AreaRestated for the year ended 31 March 2020 (b)
SectionInternal
RevenueExternal
RevenueTotal
RevenueOperating
Costs DepreciationHolding
(gain)/loss Supp. Dep.Other CCA
Adjs. Roundings
Total CCA Operating
Costs Return
Mean Capital
EmployedReturn on
MCE£m £m £m £m £m £m £m £m £m £m £m £m %
OpenreachPhysical Infrastructure Markets 6.1 605 1 606 126 182 (155) 98 3 - 254 352 4,943 7.1%
WLA 7.1 819 1,615 2,434 1,509 597 (55) 65 (13) - 2,103 331 4,846 6.8%
Business Connectivity MarketsCI Access services - BT only 8.1 195 172 367 204 144 (1) 3 (1) - 349 18 815 2.1%CI Access services - BT+1 8.2 97 77 174 81 61 (0) 0 (0) 1 143 31 320 9.8%High Network Reach Areas Outside CLA 8.3 14 10 24 10 7 (0) 0 (0) - 17 7 35 20.1%Technical Areas (Non-Dark Fibre) Inter Exchange 8.4 103 52 155 51 36 (1) 3 (1) - 88 67 150 44.7%Technical Areas (Dark Fibre) Inter Exchange 8.5 - 0 0 0 0 (0) 0 (0) - 0 0 0 20.0%
Narrowband MarketsWFAEL 9.1 1,173 383 1,556 848 353 (59) 75 1 - 1,218 338 2,372 14.2%ISDN2 9.2 25 39 64 23 12 (1) 1 0 1 36 28 67 41.5%ISDN30 9.3 50 65 115 46 31 (1) 0 0 1 77 38 169 22.5%
Total Openreach SMP Markets 3,081 2,414 5,495 2,898 1,423 (273) 245 (11) 3 4,285 1,210 13,717 8.8%
Openreach Residual 160 62 222 26 85 (2) 3 (1) (1) 110 112 459 24.3%Eliminations (575) - (575) (575) - - - - - (575) - -Total Openreach 2,666 2,476 5,142 2,349 1,508 (275) 248 (12) 2 3,820 1,322 14,176 9.3%
Rest of BTNarrowband MarketsFixed Call Origination 92 27 119 49 32 (1) 0 1 - 81 38 116 33.1%Fixed Geographic Call Termination 9.4 3 5 8 50 36 (2) 0 1 1 86 (78) 124 (63.2)%Technical Areas (DLE Interconnect Circuits) 9.5 - 5 5 3 2 (0) 0 (0) (1) 4 1 5 15.5%
WBA (Market A) 10.1 126 1 127 28 14 (0) 0 (0) - 42 85 56 151.0%
Total Rest of BT SMP Markets 221 38 259 130 84 (3) 0 2 - 213 46 301 15.1%
Rest of BT Residual 1,868 20,391 22,259 17,916 2,608 (8) 8 (2) - 20,522 1,737 23,013 7.5%Total Rest of BT 2,089 20,429 22,518 18,046 2,692 (11) 8 (0) - 20,735 1,783 23,314 7.6%Eliminations (4,754) - (4,754) (4,789) (31) 2 (3) 1 1 (4,819) 65 (121)Roundings (1) - (1) 1 1 (2) 3 1 (3) 1 (2) (1)Total Markets - 22,905 22,905 15,607 4,170 (286) 256 (10) - 19,737 3,168 37,368 8.5%
Total SMP Markets 3,302 2,452 5,754 3,028 1,507 (276) 245 (9) 3 4,498 1,256 14,018 8.9%
Section 5 – Summary of Market Performance
Page 26
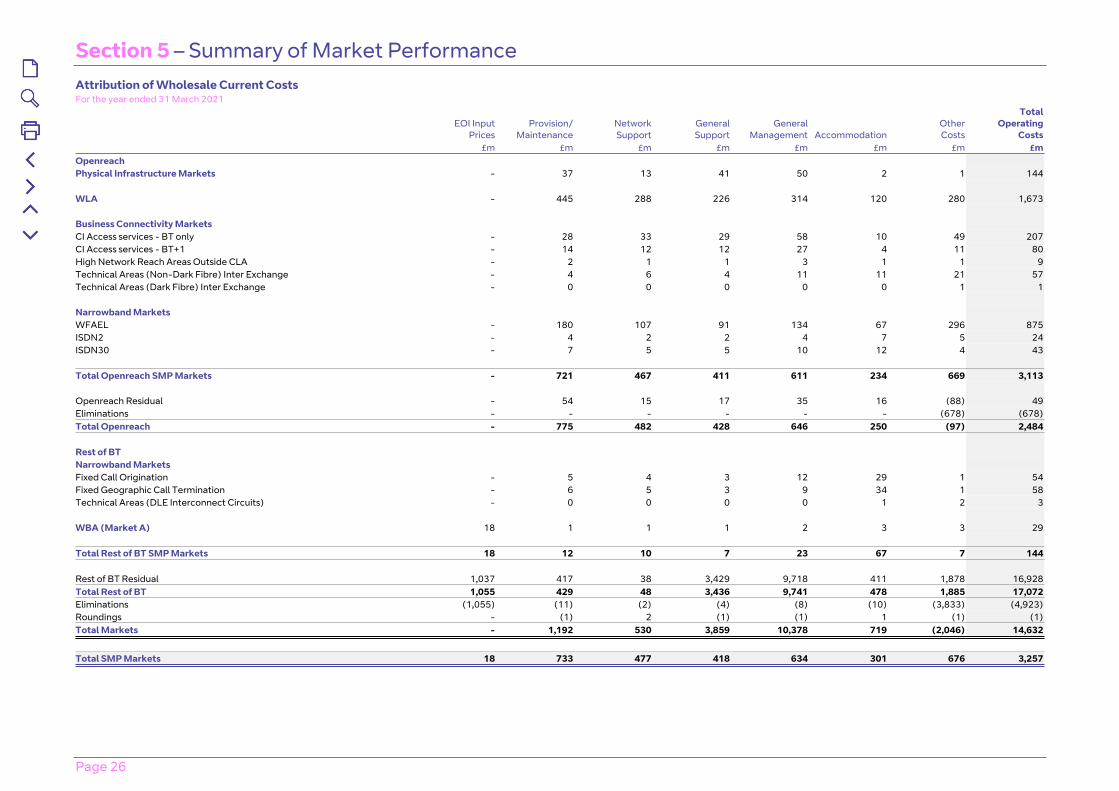
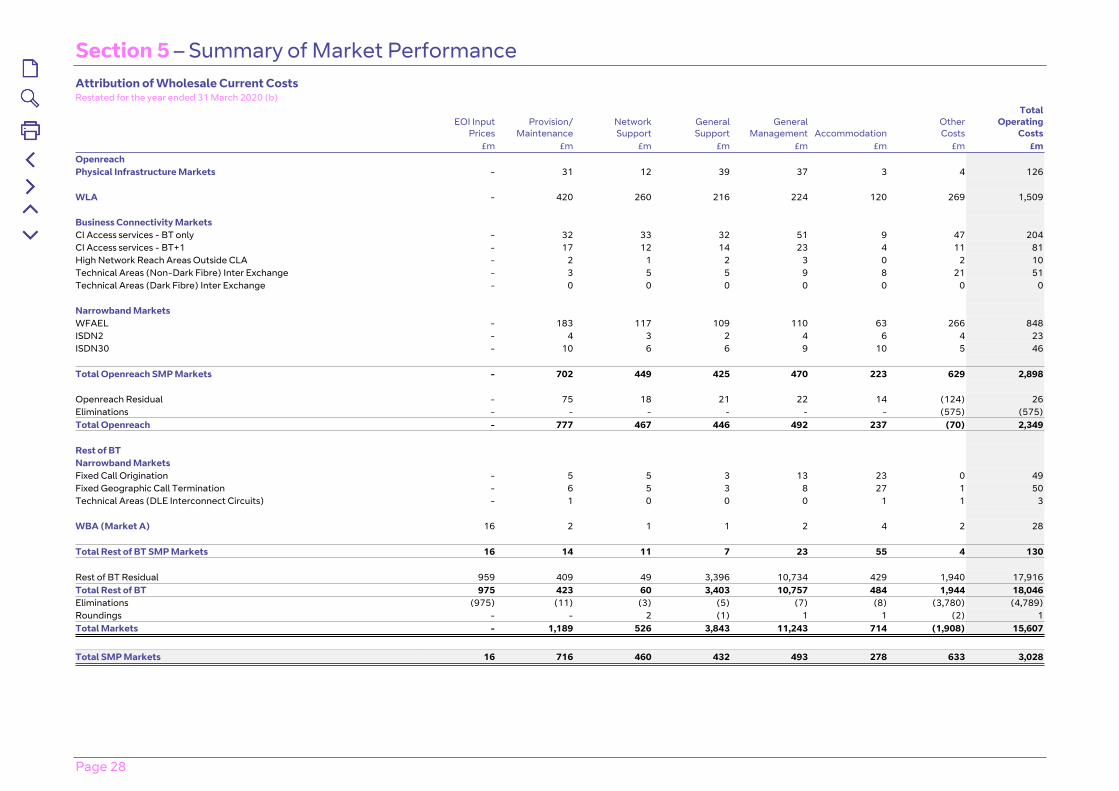
Attribution of Wholesale Current CostsFor the year ended 31 March 2021
EOI InputPrices
Provision/Maintenance
NetworkSupport
GeneralSupport
GeneralManagement Accommodation
OtherCosts
TotalOperating
Costs£m £m £m £m £m £m £m £m
OpenreachPhysical Infrastructure Markets - 37 13 41 50 2 1 144
WLA - 445 288 226 314 120 280 1,673
Business Connectivity MarketsCI Access services - BT only - 28 33 29 58 10 49 207CI Access services - BT+1 - 14 12 12 27 4 11 80High Network Reach Areas Outside CLA - 2 1 1 3 1 1 9Technical Areas (Non-Dark Fibre) Inter Exchange - 4 6 4 11 11 21 57Technical Areas (Dark Fibre) Inter Exchange - 0 0 0 0 0 1 1
Narrowband MarketsWFAEL - 180 107 91 134 67 296 875ISDN2 - 4 2 2 4 7 5 24ISDN30 - 7 5 5 10 12 4 43
Total Openreach SMP Markets - 721 467 411 611 234 669 3,113
Openreach Residual - 54 15 17 35 16 (88) 49Eliminations - - - - - - (678) (678)Total Openreach - 775 482 428 646 250 (97) 2,484
Rest of BTNarrowband MarketsFixed Call Origination - 5 4 3 12 29 1 54Fixed Geographic Call Termination - 6 5 3 9 34 1 58Technical Areas (DLE Interconnect Circuits) - 0 0 0 0 1 2 3
WBA (Market A) 18 1 1 1 2 3 3 29
Total Rest of BT SMP Markets 18 12 10 7 23 67 7 144
Rest of BT Residual 1,037 417 38 3,429 9,718 411 1,878 16,928Total Rest of BT 1,055 429 48 3,436 9,741 478 1,885 17,072Eliminations (1,055) (11) (2) (4) (8) (10) (3,833) (4,923)Roundings - (1) 2 (1) (1) 1 (1) (1)Total Markets - 1,192 530 3,859 10,378 719 (2,046) 14,632
Total SMP Markets 18 733 477 418 634 301 676 3,257
Section 5 – Summary of Market Performance
Page 27
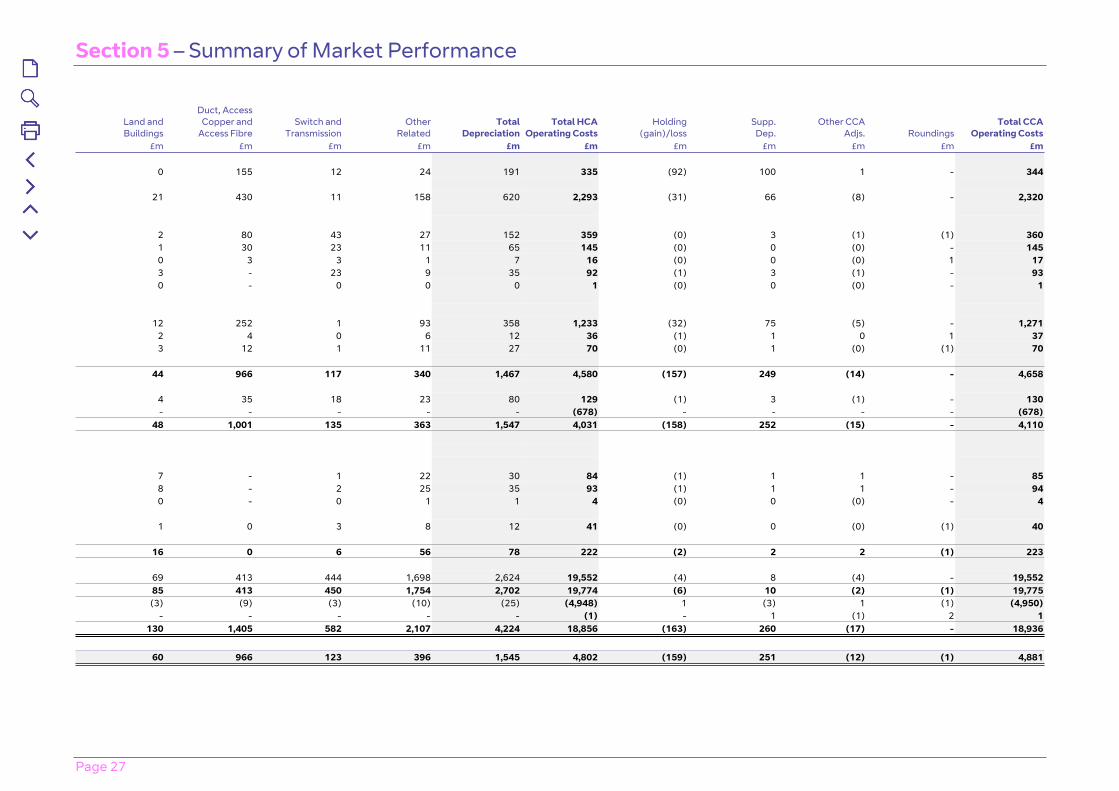
Land andBuildings
Duct, AccessCopper and
Access FibreSwitch and
TransmissionOther
RelatedTotal
DepreciationTotal HCA
Operating CostsHolding
(gain)/lossSupp.
Dep.Other CCA
Adjs. RoundingsTotal CCA
Operating Costs£m £m £m £m £m £m £m £m £m £m £m
0 155 12 24 191 335 (92) 100 1 - 344
21 430 11 158 620 2,293 (31) 66 (8) - 2,320
2 80 43 27 152 359 (0) 3 (1) (1) 3601 30 23 11 65 145 (0) 0 (0) - 1450 3 3 1 7 16 (0) 0 (0) 1 173 - 23 9 35 92 (1) 3 (1) - 930 - 0 0 0 1 (0) 0 (0) - 1
12 252 1 93 358 1,233 (32) 75 (5) - 1,2712 4 0 6 12 36 (1) 1 0 1 373 12 1 11 27 70 (0) 1 (0) (1) 70
44 966 117 340 1,467 4,580 (157) 249 (14) - 4,658
4 35 18 23 80 129 (1) 3 (1) - 130- - - - - (678) - - - - (678)
48 1,001 135 363 1,547 4,031 (158) 252 (15) - 4,110
7 - 1 22 30 84 (1) 1 1 - 858 - 2 25 35 93 (1) 1 1 - 940 - 0 1 1 4 (0) 0 (0) - 4
1 0 3 8 12 41 (0) 0 (0) (1) 40
16 0 6 56 78 222 (2) 2 2 (1) 223
69 413 444 1,698 2,624 19,552 (4) 8 (4) - 19,55285 413 450 1,754 2,702 19,774 (6) 10 (2) (1) 19,775
(3) (9) (3) (10) (25) (4,948) 1 (3) 1 (1) (4,950)- - - - - (1) - 1 (1) 2 1
130 1,405 582 2,107 4,224 18,856 (163) 260 (17) - 18,936
60 966 123 396 1,545 4,802 (159) 251 (12) (1) 4,881
Section 5 – Summary of Market Performance
Page 28
Attribution of Wholesale Current CostsRestated for the year ended 31 March 2020 (b)
EOI InputPrices
Provision/Maintenance
NetworkSupport
GeneralSupport
GeneralManagement Accommodation
OtherCosts
TotalOperating
Costs£m £m £m £m £m £m £m £m
OpenreachPhysical Infrastructure Markets - 31 12 39 37 3 4 126
WLA - 420 260 216 224 120 269 1,509
Business Connectivity MarketsCI Access services - BT only - 32 33 32 51 9 47 204CI Access services - BT+1 - 17 12 14 23 4 11 81High Network Reach Areas Outside CLA - 2 1 2 3 0 2 10Technical Areas (Non-Dark Fibre) Inter Exchange - 3 5 5 9 8 21 51Technical Areas (Dark Fibre) Inter Exchange - 0 0 0 0 0 0 0
Narrowband MarketsWFAEL - 183 117 109 110 63 266 848ISDN2 - 4 3 2 4 6 4 23ISDN30 - 10 6 6 9 10 5 46
Total Openreach SMP Markets - 702 449 425 470 223 629 2,898
Openreach Residual - 75 18 21 22 14 (124) 26Eliminations - - - - - - (575) (575)Total Openreach - 777 467 446 492 237 (70) 2,349
Rest of BTNarrowband MarketsFixed Call Origination - 5 5 3 13 23 0 49Fixed Geographic Call Termination - 6 5 3 8 27 1 50Technical Areas (DLE Interconnect Circuits) - 1 0 0 0 1 1 3
WBA (Market A) 16 2 1 1 2 4 2 28
Total Rest of BT SMP Markets 16 14 11 7 23 55 4 130
Rest of BT Residual 959 409 49 3,396 10,734 429 1,940 17,916Total Rest of BT 975 423 60 3,403 10,757 484 1,944 18,046Eliminations (975) (11) (3) (5) (7) (8) (3,780) (4,789)Roundings - - 2 (1) 1 1 (2) 1Total Markets - 1,189 526 3,843 11,243 714 (1,908) 15,607
Total SMP Markets 16 716 460 432 493 278 633 3,028
Section 5 – Summary of Market Performance
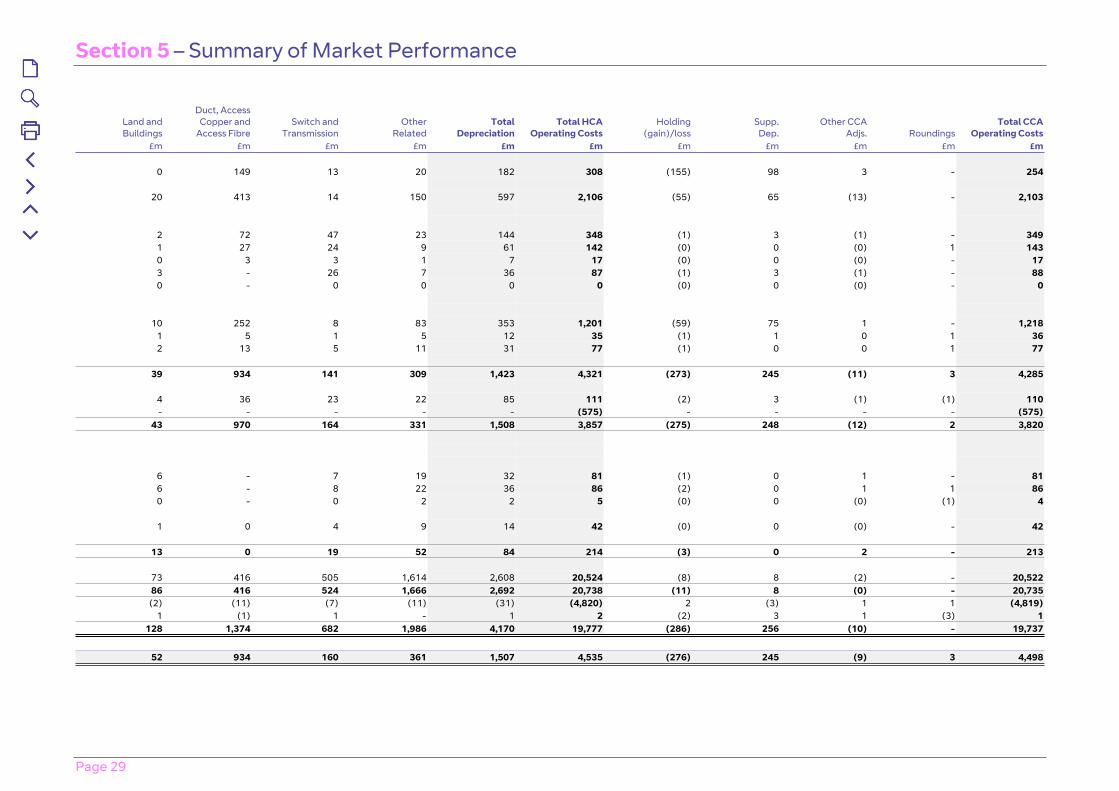
Page 29
Land andBuildings
Duct, AccessCopper and
Access FibreSwitch and
TransmissionOther
RelatedTotal
DepreciationTotal HCA
Operating CostsHolding
(gain)/lossSupp.
Dep.Other CCA
Adjs. RoundingsTotal CCA
Operating Costs£m £m £m £m £m £m £m £m £m £m £m
0 149 13 20 182 308 (155) 98 3 - 254
20 413 14 150 597 2,106 (55) 65 (13) - 2,103
2 72 47 23 144 348 (1) 3 (1) - 3491 27 24 9 61 142 (0) 0 (0) 1 1430 3 3 1 7 17 (0) 0 (0) - 173 - 26 7 36 87 (1) 3 (1) - 880 - 0 0 0 0 (0) 0 (0) - 0
10 252 8 83 353 1,201 (59) 75 1 - 1,2181 5 1 5 12 35 (1) 1 0 1 362 13 5 11 31 77 (1) 0 0 1 77
39 934 141 309 1,423 4,321 (273) 245 (11) 3 4,285
4 36 23 22 85 111 (2) 3 (1) (1) 110- - - - - (575) - - - - (575)
43 970 164 331 1,508 3,857 (275) 248 (12) 2 3,820
6 - 7 19 32 81 (1) 0 1 - 816 - 8 22 36 86 (2) 0 1 1 860 - 0 2 2 5 (0) 0 (0) (1) 4
1 0 4 9 14 42 (0) 0 (0) - 42
13 0 19 52 84 214 (3) 0 2 - 213
73 416 505 1,614 2,608 20,524 (8) 8 (2) - 20,52286 416 524 1,666 2,692 20,738 (11) 8 (0) - 20,735
(2) (11) (7) (11) (31) (4,820) 2 (3) 1 1 (4,819)1 (1) 1 - 1 2 (2) 3 1 (3) 1
128 1,374 682 1,986 4,170 19,777 (286) 256 (10) - 19,737
52 934 160 361 1,507 4,535 (276) 245 (9) 3 4,498
Section 5 – Summary of Market Performance
Page 30
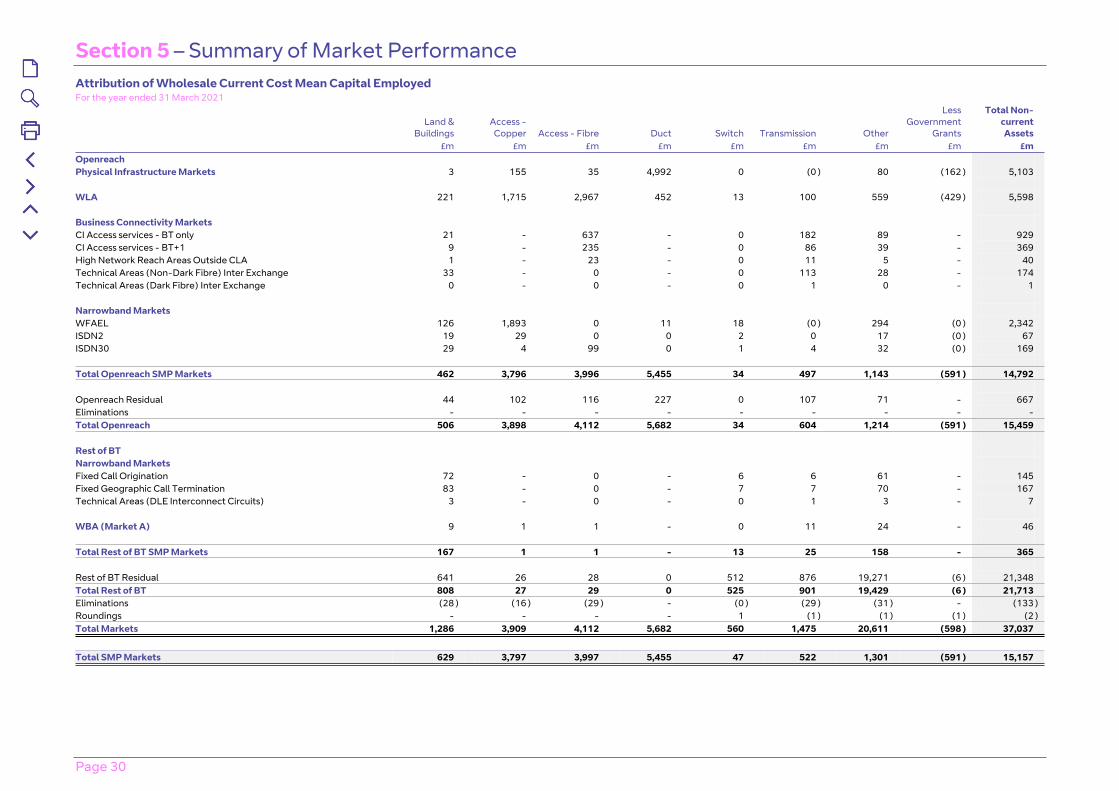
Attribution of Wholesale Current Cost Mean Capital Employed For the year ended 31 March 2021
Land &
Buildings Access -
Copper Access - Fibre Duct Switch Transmission Other
Less Government
Grants
Total Non-current Assets
£m £m £m £m £m £m £m £m £m Openreach Physical Infrastructure Markets 3 155 35 4,992 0 (0 ) 80 (162 ) 5,103 WLA 221 1,715 2,967 452 13 100 559 (429 ) 5,598 Business Connectivity Markets CI Access services - BT only 21 - 637 - 0 182 89 - 929 CI Access services - BT+1 9 - 235 - 0 86 39 - 369 High Network Reach Areas Outside CLA 1 - 23 - 0 11 5 - 40 Technical Areas (Non-Dark Fibre) Inter Exchange 33 - 0 - 0 113 28 - 174 Technical Areas (Dark Fibre) Inter Exchange 0 - 0 - 0 1 0 - 1 Narrowband Markets WFAEL 126 1,893 0 11 18 (0 ) 294 (0 ) 2,342 ISDN2 19 29 0 0 2 0 17 (0 ) 67 ISDN30 29 4 99 0 1 4 32 (0 ) 169 Total Openreach SMP Markets 462 3,796 3,996 5,455 34 497 1,143 (591 ) 14,792 Openreach Residual 44 102 116 227 0 107 71 - 667 Eliminations - - - - - - - - - Total Openreach 506 3,898 4,112 5,682 34 604 1,214 (591 ) 15,459 Rest of BT Narrowband Markets Fixed Call Origination 72 - 0 - 6 6 61 - 145 Fixed Geographic Call Termination 83 - 0 - 7 7 70 - 167 Technical Areas (DLE Interconnect Circuits) 3 - 0 - 0 1 3 - 7 WBA (Market A) 9 1 1 - 0 11 24 - 46 Total Rest of BT SMP Markets 167 1 1 - 13 25 158 - 365 Rest of BT Residual 641 26 28 0 512 876 19,271 (6 ) 21,348 Total Rest of BT 808 27 29 0 525 901 19,429 (6 ) 21,713 Eliminations (28 ) (16 ) (29 ) - (0 ) (29 ) (31 ) - (133 )Roundings - - - - 1 (1 ) (1 ) (1 ) (2 )Total Markets 1,286 3,909 4,112 5,682 560 1,475 20,611 (598 ) 37,037
Total SMP Markets 629 3,797 3,997 5,455 47 522 1,301 (591 ) 15,157
Section 5 – Summary of Market Performance
Page 31
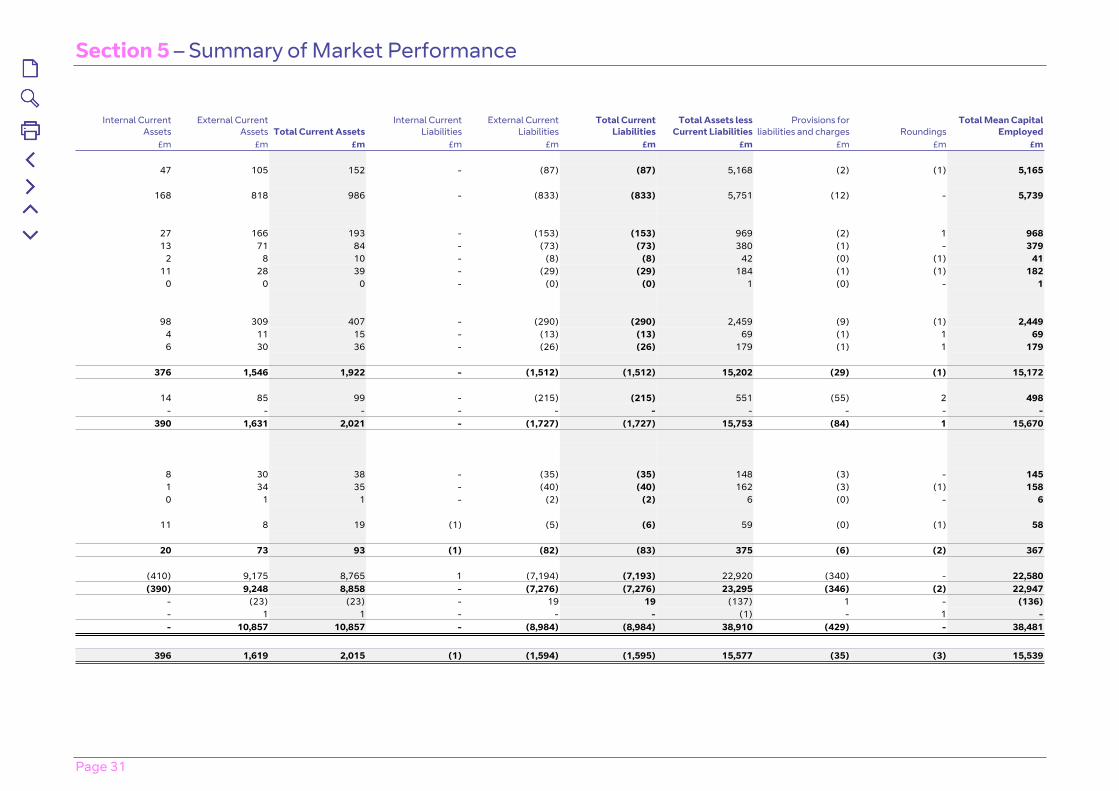
Internal Current Assets
External Current Assets Total Current Assets
Internal Current Liabilities
External Current Liabilities
Total Current Liabilities
Total Assets less Current Liabilities
Provisions for liabilities and charges Roundings
Total Mean Capital Employed
£m £m £m £m £m £m £m £m £m £m
47 105 152 - (87) (87) 5,168 (2) (1) 5,165
168 818 986 - (833) (833) 5,751 (12) - 5,739
27 166 193 - (153) (153) 969 (2) 1 96813 71 84 - (73) (73) 380 (1) - 379
2 8 10 - (8) (8) 42 (0) (1) 4111 28 39 - (29) (29) 184 (1) (1) 182
0 0 0 - (0) (0) 1 (0) - 1
98 309 407 - (290) (290) 2,459 (9) (1) 2,4494 11 15 - (13) (13) 69 (1) 1 696 30 36 - (26) (26) 179 (1) 1 179
376 1,546 1,922 - (1,512) (1,512) 15,202 (29) (1) 15,172
14 85 99 - (215) (215) 551 (55) 2 498
- - - - - - - - - -390 1,631 2,021 - (1,727) (1,727) 15,753 (84) 1 15,670
8 30 38 - (35) (35) 148 (3) - 1451 34 35 - (40) (40) 162 (3) (1) 1580 1 1 - (2) (2) 6 (0) - 6
11 8 19 (1) (5) (6) 59 (0) (1) 58
20 73 93 (1) (82) (83) 375 (6) (2) 367
(410) 9,175 8,765 1 (7,194) (7,193) 22,920 (340) - 22,580(390) 9,248 8,858 - (7,276) (7,276) 23,295 (346) (2) 22,947
- (23) (23) - 19 19 (137) 1 - (136)- 1 1 - - - (1) - 1 -- 10,857 10,857 - (8,984) (8,984) 38,910 (429) - 38,481
396 1,619 2,015 (1) (1,594) (1,595) 15,577 (35) (3) 15,539
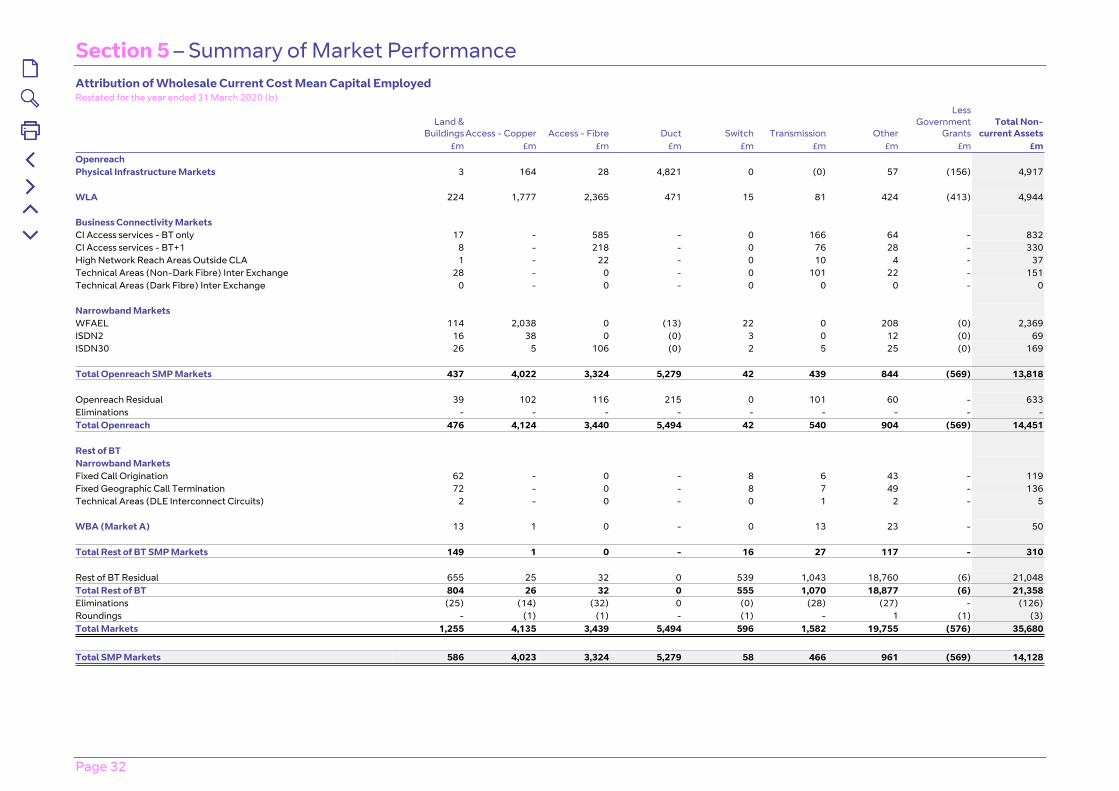
Section 5 – Summary of Market Performance
Page 32
Attribution of Wholesale Current Cost Mean Capital EmployedRestated for the year ended 31 March 2020 (b)
Land & Buildings Access - Copper Access - Fibre Duct Switch Transmission Other
Less Government
GrantsTotal Non-
current Assets£m £m £m £m £m £m £m £m £m
OpenreachPhysical Infrastructure Markets 3 164 28 4,821 0 (0) 57 (156) 4,917
WLA 224 1,777 2,365 471 15 81 424 (413) 4,944
Business Connectivity MarketsCI Access services - BT only 17 - 585 - 0 166 64 - 832CI Access services - BT+1 8 - 218 - 0 76 28 - 330High Network Reach Areas Outside CLA 1 - 22 - 0 10 4 - 37Technical Areas (Non-Dark Fibre) Inter Exchange 28 - 0 - 0 101 22 - 151Technical Areas (Dark Fibre) Inter Exchange 0 - 0 - 0 0 0 - 0
Narrowband MarketsWFAEL 114 2,038 0 (13) 22 0 208 (0) 2,369ISDN2 16 38 0 (0) 3 0 12 (0) 69ISDN30 26 5 106 (0) 2 5 25 (0) 169
Total Openreach SMP Markets 437 4,022 3,324 5,279 42 439 844 (569) 13,818
Openreach Residual 39 102 116 215 0 101 60 - 633Eliminations - - - - - - - - -Total Openreach 476 4,124 3,440 5,494 42 540 904 (569) 14,451
Rest of BTNarrowband MarketsFixed Call Origination 62 - 0 - 8 6 43 - 119Fixed Geographic Call Termination 72 - 0 - 8 7 49 - 136Technical Areas (DLE Interconnect Circuits) 2 - 0 - 0 1 2 - 5
WBA (Market A) 13 1 0 - 0 13 23 - 50
Total Rest of BT SMP Markets 149 1 0 - 16 27 117 - 310
Rest of BT Residual 655 25 32 0 539 1,043 18,760 (6) 21,048Total Rest of BT 804 26 32 0 555 1,070 18,877 (6) 21,358Eliminations (25) (14) (32) 0 (0) (28) (27) - (126)Roundings - (1) (1) - (1) - 1 (1) (3)Total Markets 1,255 4,135 3,439 5,494 596 1,582 19,755 (576) 35,680
Total SMP Markets 586 4,023 3,324 5,279 58 466 961 (569) 14,128
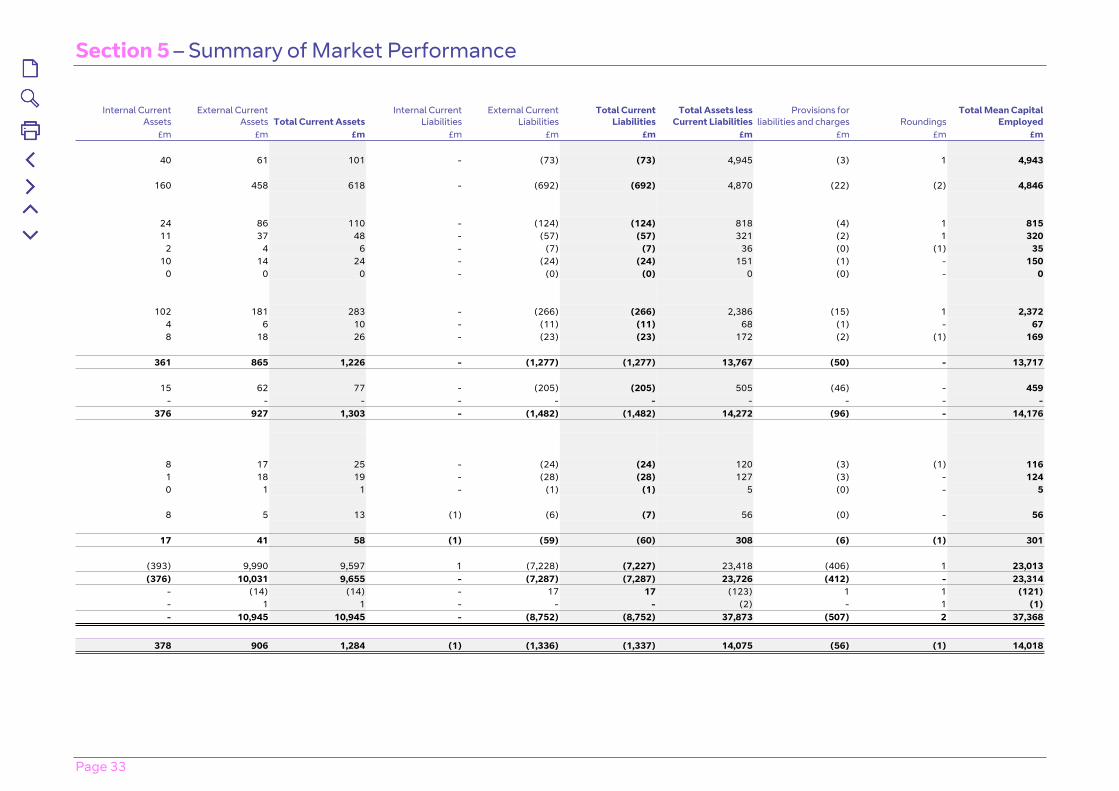
Section 5 – Summary of Market Performance
Page 33
Internal Current Assets
External Current Assets Total Current Assets
Internal Current Liabilities
External Current Liabilities
Total Current Liabilities
Total Assets less Current Liabilities
Provisions for liabilities and charges Roundings
Total Mean Capital Employed
£m £m £m £m £m £m £m £m £m £m
40 61 101 - (73) (73) 4,945 (3) 1 4,943
160 458 618 - (692) (692) 4,870 (22) (2) 4,846
24 86 110 - (124) (124) 818 (4) 1 81511 37 48 - (57) (57) 321 (2) 1 320
2 4 6 - (7) (7) 36 (0) (1) 3510 14 24 - (24) (24) 151 (1) - 150
0 0 0 - (0) (0) 0 (0) - 0
102 181 283 - (266) (266) 2,386 (15) 1 2,3724 6 10 - (11) (11) 68 (1) - 678 18 26 - (23) (23) 172 (2) (1) 169
361 865 1,226 - (1,277) (1,277) 13,767 (50) - 13,717
15 62 77 - (205) (205) 505 (46) - 459
- - - - - - - - - -376 927 1,303 - (1,482) (1,482) 14,272 (96) - 14,176
8 17 25 - (24) (24) 120 (3) (1) 1161 18 19 - (28) (28) 127 (3) - 1240 1 1 - (1) (1) 5 (0) - 5
8 5 13 (1) (6) (7) 56 (0) - 56
17 41 58 (1) (59) (60) 308 (6) (1) 301
(393) 9,990 9,597 1 (7,228) (7,227) 23,418 (406) 1 23,013(376) 10,031 9,655 - (7,287) (7,287) 23,726 (412) - 23,314
- (14) (14) - 17 17 (123) 1 1 (121)- 1 1 - - - (2) - 1 (1)- 10,945 10,945 - (8,752) (8,752) 37,873 (507) 2 37,368
378 906 1,284 (1) (1,336) (1,337) 14,075 (56) (1) 14,018
Section 5 – Summary of Market Performance
Page 34
5.4 Openreach InformationOpenreach Statements
In accordance with Section 20.5 and 20.6 of the Commitments, the RFS must separately present the financial results of Openreach and include a reconciliation of Openreach’s revenue, operating profit (and other items agreed between us and Ofcom) with Openreach’s financial information as shown in our Annual Report.
The form, content and basis of preparation of the financial results of Openreach follow, to the fullest extent possible, those used in the preparation of the RFS. The reconciliation of this statement to the Openreach segmental financial information as shown in our Annual Report is shown in the Income Statement below.
Reconciling Differences
The reconciling differences between the Openreach regulatory statement and the Openreach segmental financial information reported in our Annual Report fall into the following main categories:
(a) Specific items
The Group’s income statement and segmental analysis separately identifies trading results on an adjusted basis, being before specific items. Presentation of the Group’s results in this way is relevant to understanding the Group’s financial performance as specific items are those that, in management’s judgement, need to be disclosed by virtue of their size, nature or incidence. Examples of charges or credits that may be ‘specific items’ include acquisitions and disposals of businesses and investments, retrospective regulatory matters, historical insurance or litigation claims, business restructuring programmes, asset impairment charges and property rationalisation programmes.
(b) Rental charge to Openreach for use of assets owned by Technology
Within the Openreach segmental financial information reported in our Annual Report, the results include a charge for an appropriate return on capital where assets are owned by Technology (e.g. for line cards, electronics and network features) but are used by Openreach. The Openreach regulatory statements do not include this charge, as the basis for attribution of costs and assets to products in the regulatory accounts is actual costs and assets.
(c) Other trading differences
The Openreach segmental financial information reported in our Annual Report reflects the internal charges between our business units rather than the allocation of actual costs and capital employed as shown in the RFS. The other trading differences reflect the total of these differences across the year.
(d) Net short term interest
These are included within our return but not included as adjusted operating profit within our Annual Report.
(e) Share of post tax loss/profit of associates and joint ventures
These are included within our return but not included as adjusted operating profit within our Annual Report.
(f) Installations costs treated as operating expenses
As first directed by Ofcom's WLA Market Review statement (28 March 2018), we make an adjustment in the RFS (relative to IFRS and BT’s accounting policies) to treat installation and planning costs related to GEA Customer Site installation, Tie Cables, GEA Cable Links, Abortive Visits, Co-mingling services and Excess Construction Charges as operating expenditure in the RFS in line with connection revenues received (rather than capital expenditure), and the opening capital employed associated with these activities is also removed.
(g) Basis of preparation under CCA
The consolidated financial statements of BT Group plc have been prepared in accordance with the Companies Act 2006, Article 4 of the IAS Regulation and IAS and IFRS and related interpretations, as adopted by the European Union. The consolidated financial statements also comply with IFRS as issued by the International Accounting Standards Board (the IASB).
Our consolidated financial statements are prepared on the historical cost basis, except for certain financial and equity instruments that have been measured at fair value.
Our RFS have been prepared on a CCA basis, in accordance with the annually updated AMD. As such, a reconciliation entry has been made to include the aggregated CCA adjustments within the Openreach regulatory statement.
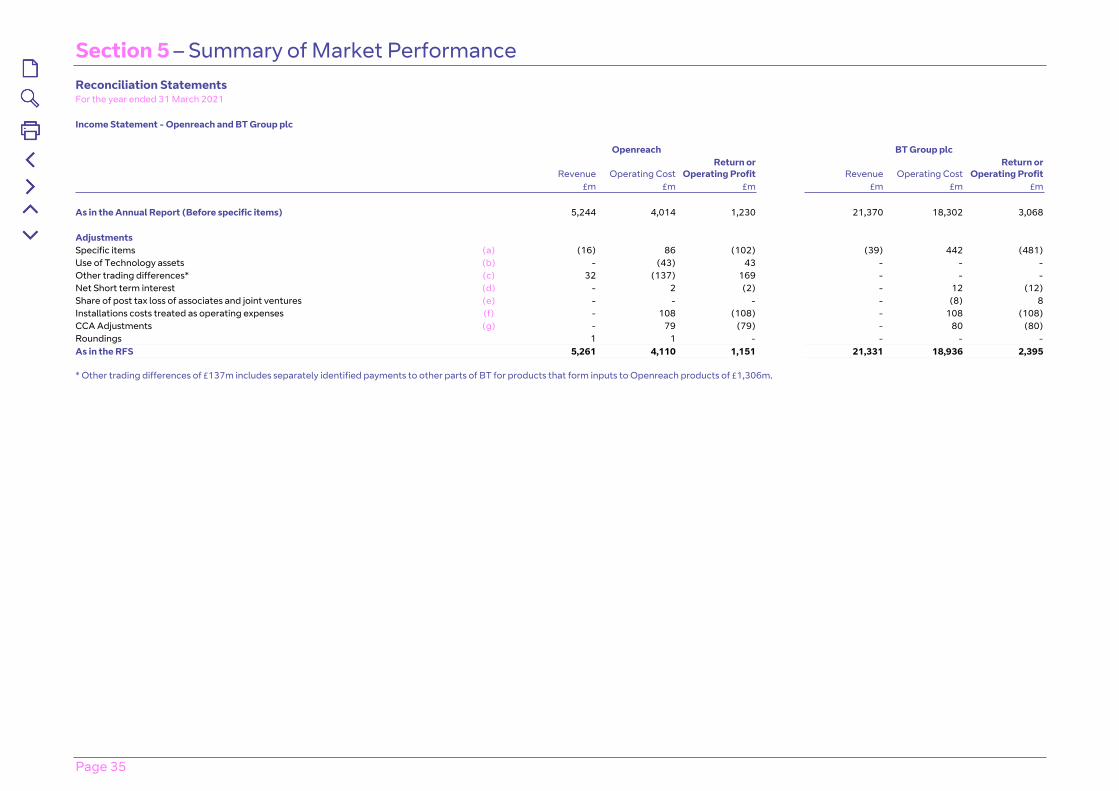
Section 5 – Summary of Market Performance
Page 35
Reconciliation StatementsFor the year ended 31 March 2021
Income Statement - Openreach and BT Group plc
Openreach BT Group plc
Revenue Operating CostReturn or
Operating Profit Revenue Operating CostReturn or
Operating Profit£m £m £m £m £m £m
As in the Annual Report (Before specific items) 5,244 4,014 1,230 21,370 18,302 3,068
AdjustmentsSpecific items (a) (16) 86 (102) (39) 442 (481)Use of Technology assets (b) - (43) 43 - - -Other trading differences* (c) 32 (137) 169 - - -Net Short term interest (d) - 2 (2) - 12 (12)Share of post tax loss of associates and joint ventures (e) - - - - (8) 8Installations costs treated as operating expenses (f) - 108 (108) - 108 (108)CCA Adjustments (g) - 79 (79) - 80 (80)Roundings 1 1 - - - -As in the RFS 5,261 4,110 1,151 21,331 18,936 2,395
* Other trading differences of £137m includes separately identified payments to other parts of BT for products that form inputs to Openreach products of £1,306m.
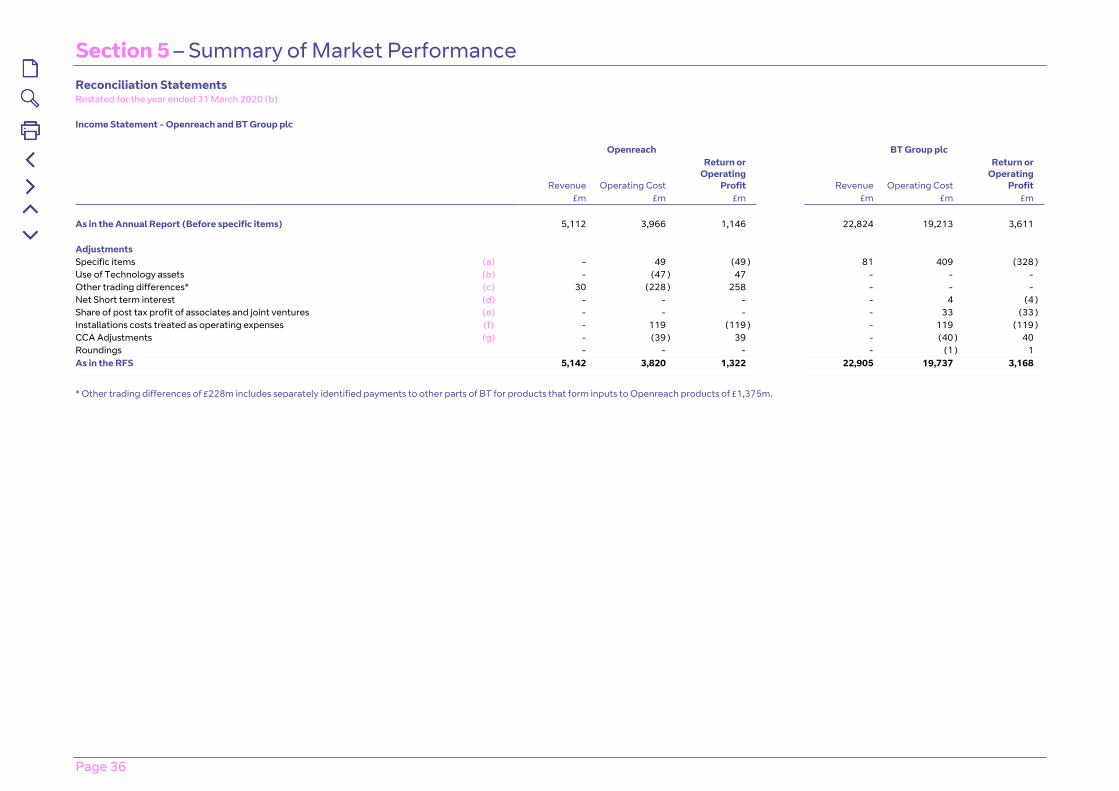
Section 5 – Summary of Market Performance
Page 36
Reconciliation Statements Restated for the year ended 31 March 2020 (b) Income Statement - Openreach and BT Group plc Openreach BT Group plc
Revenue Operating Cost
Return or Operating
Profit
Revenue Operating Cost
Return or Operating
Profit £m £m £m £m £m £m
As in the Annual Report (Before specific items) 5,112 3,966 1,146 22,824 19,213 3,611 Adjustments Specific items (a) - 49 (49 ) 81 409 (328 )Use of Technology assets (b) - (47 ) 47 - - - Other trading differences* (c) 30 (228 ) 258 - - - Net Short term interest (d) - - - - 4 (4 )Share of post tax profit of associates and joint ventures (e) - - - - 33 (33 )Installations costs treated as operating expenses (f) - 119 (119 ) - 119 (119 )CCA Adjustments (g) - (39 ) 39 - (40 ) 40 Roundings - - - - (1 ) 1 As in the RFS 5,142 3,820 1,322 22,905 19,737 3,168
* Other trading differences of £228m includes separately identified payments to other parts of BT for products that form inputs to Openreach products of £1,375m.
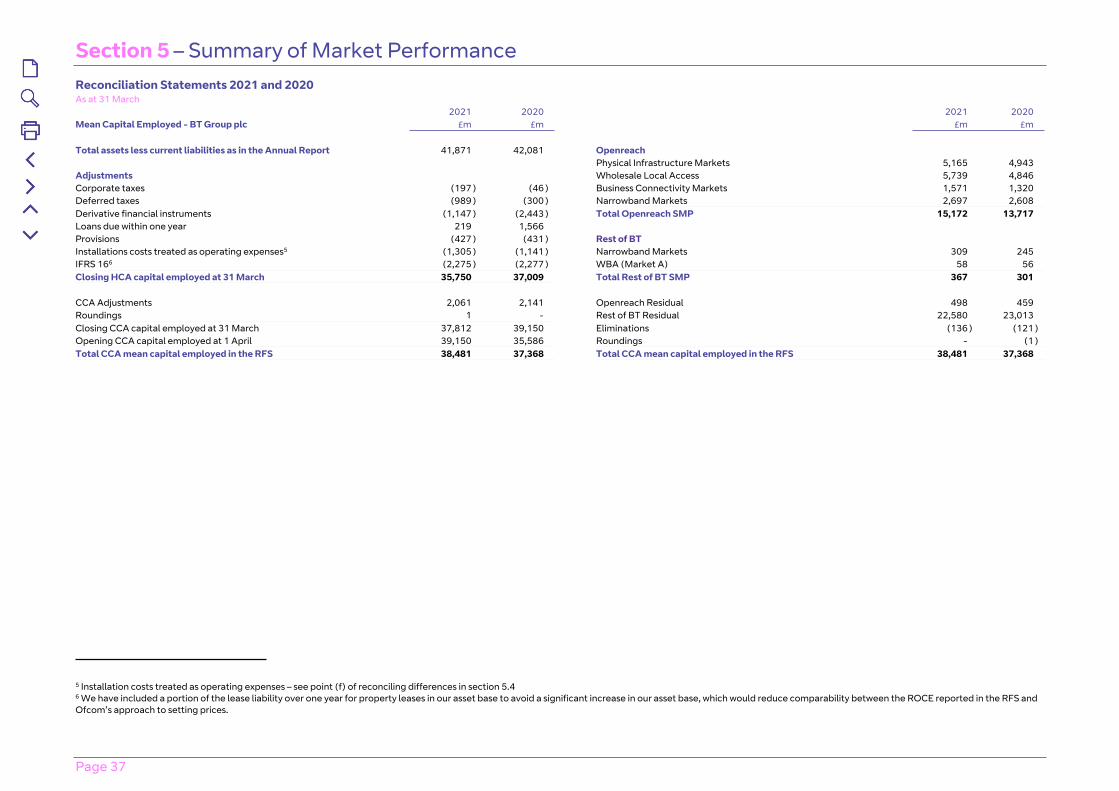
Section 5 – Summary of Market Performance
Page 37
Reconciliation Statements 2021 and 2020As at 31 March
2021 2020 2021 2020 Mean Capital Employed - BT Group plc £m £m £m £m
Total assets less current liabilities as in the Annual Report 41,871 42,081 OpenreachPhysical Infrastructure Markets 5,165 4,943
Adjustments Wholesale Local Access 5,739 4,846 Corporate taxes (197 ) (46 ) Business Connectivity Markets 1,571 1,320 Deferred taxes (989 ) (300 ) Narrowband Markets 2,697 2,608 Derivative financial instruments (1,147 ) (2,443 ) Total Openreach SMP 15,172 13,717 Loans due within one year 219 1,566 Provisions (427 ) (431 ) Rest of BTInstallations costs treated as operating expenses5 (1,305 ) (1,141 ) Narrowband Markets 309 245 IFRS 166 (2,275 ) (2,277 ) WBA (Market A) 58 56 Closing HCA capital employed at 31 March 35,750 37,009 Total Rest of BT SMP 367 301
CCA Adjustments 2,061 2,141 Openreach Residual 498 459 Roundings 1 - Rest of BT Residual 22,580 23,013 Closing CCA capital employed at 31 March 37,812 39,150 Eliminations (136 ) (121 )Opening CCA capital employed at 1 April 39,150 35,586 Roundings - (1 )Total CCA mean capital employed in the RFS 38,481 37,368 Total CCA mean capital employed in the RFS 38,481 37,368
5 Installation costs treated as operating expenses – see point (f) of reconciling differences in section 5.4 6 We have included a portion of the lease liability over one year for property leases in our asset base to avoid a significant increase in our asset base, which would reduce comparability between the ROCE reported in the RFS and Ofcom’s approach to setting prices.
Section 5 – Summary of Market Performance
Page 38
5.5 Adjusted Performance SummaryOfcom’s “Directions in relation to BT’s regulatory financial reporting”, most recently published on 12 July 2019, directs BT to prepare the “Adjusted Financial Performance at a market review level” statement and the “Adjusted Financial Performance at a market level” statement for 2018 WLA and 2019 BCMR markets, respectively, in order to show for each Financial Year the impact on the Regulatory Financial Statements of:
• Calculating an average of the Property Rationalisation Costs incurred in the three prior Financial Years and attributing that average to all markets in accordance with the RAP;
• Calculating an average of the Restructuring Costs incurred in the three prior Financial Years and attributing that average to all markets in accordance with the RAP.
The RFR (March 19) further directs in relation to the 2018 WLA markets:
• BT shall calculate the net proceeds in scrap value that BT will recoup when it moves to an FTTx only network. BT should discount its calculation using its WACC;
• BT shall set and maintain the Net Replacement Costs (NRC): Gross Replacement Cost (GRC) ratio at 50% and adjust the asset lives to equate to the accounting book lives to calculate the Operating Capability Maintenance (OCM) depreciation for the following network components:
a) Metallic Path Facilities (MPF) line testing systems;
b) Local Loop Unbundling systems development;
c) Wholesale Access specific;
d) Local exchanges general frames equipment;
e) Local exchanges general frames maintenance;
f) Analogue line test equipment;
g) Analogue line cards;
h) Co-mingling power and vent; and
i) Combi Card and Multi Service Access Node (MSAN) Access – Voice.
The purpose of this schedule is to publish BT’s estimate of the impact of Ofcom’s regulatory decisions taken in the WLA and Business Connectivity market reviews that were not required to be included within the RFS.
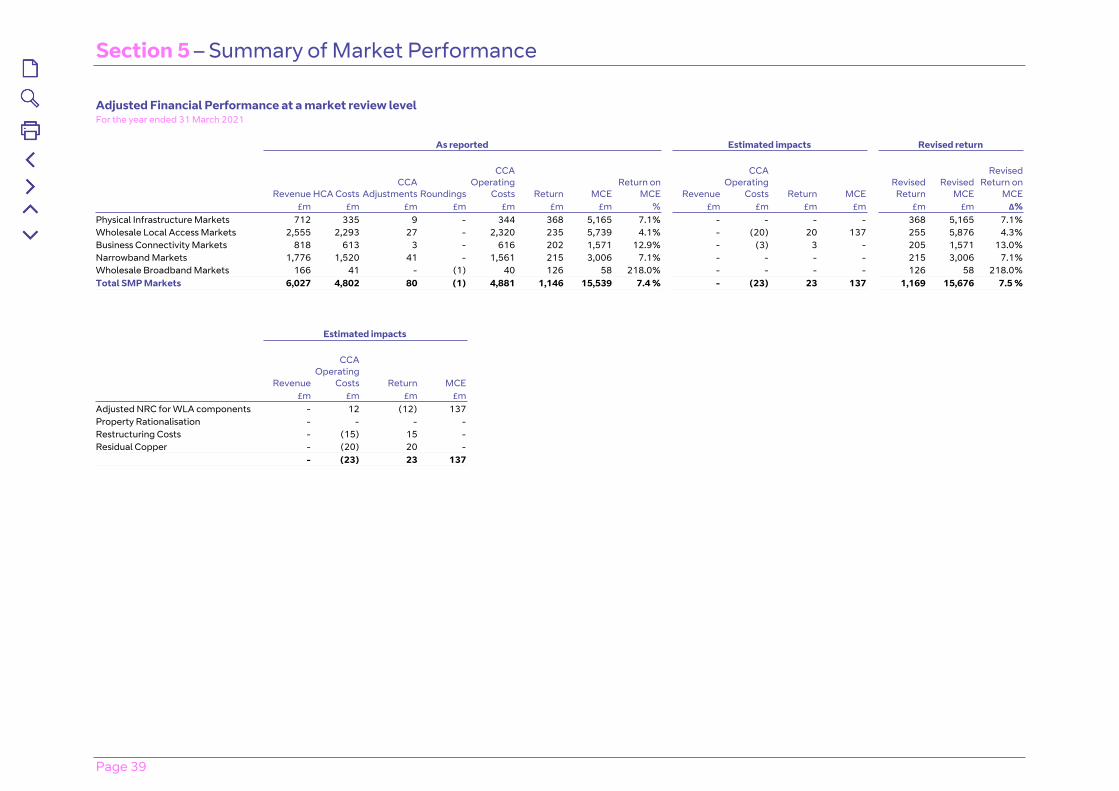
Section 5 – Summary of Market Performance
Page 39
Adjusted Financial Performance at a market review level For the year ended 31 March 2021 As reported Estimated impacts Revised return
Revenue HCA CostsCCA
Adjustments Roundings
CCA Operating
Costs Return MCEReturn on
MCE Revenue
CCA Operating
Costs Return MCE Revised
ReturnRevised
MCE
Revised Return on
MCE £m £m £m £m £m £m £m % £m £m £m £m £m £m Δ%
Physical Infrastructure Markets 712 335 9 - 344 368 5,165 7.1% - - - - 368 5,165 7.1%Wholesale Local Access Markets 2,555 2,293 27 - 2,320 235 5,739 4.1% - (20) 20 137 255 5,876 4.3%Business Connectivity Markets 818 613 3 - 616 202 1,571 12.9% - (3) 3 - 205 1,571 13.0%Narrowband Markets 1,776 1,520 41 - 1,561 215 3,006 7.1% - - - - 215 3,006 7.1%Wholesale Broadband Markets 166 41 - (1) 40 126 58 218.0% - - - - 126 58 218.0%Total SMP Markets 6,027 4,802 80 (1) 4,881 1,146 15,539 7.4 % - (23) 23 137 1,169 15,676 7.5 % Estimated impacts
Revenue
CCA Operating
Costs Return MCE £m £m £m £m
Adjusted NRC for WLA components - 12 (12) 137 Property Rationalisation - - - - Restructuring Costs - (15) 15 - Residual Copper - (20) 20 -
- (23) 23 137
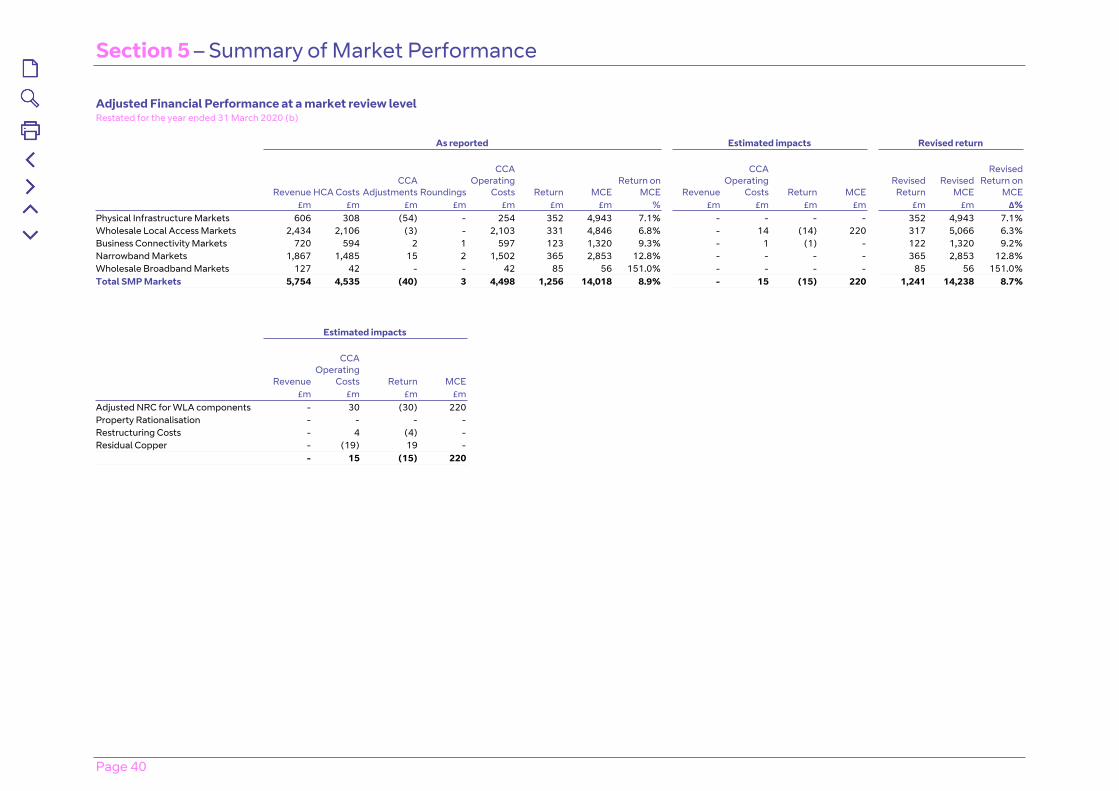
Section 5 – Summary of Market Performance
Page 40
Adjusted Financial Performance at a market review levelRestated for the year ended 31 March 2020 (b)
As reported Estimated impacts Revised return
Revenue HCA CostsCCA
Adjustments Roundings
CCA Operating
Costs Return MCEReturn on
MCE Revenue
CCA Operating
Costs Return MCERevised
ReturnRevised
MCE
Revised Return on
MCE£m £m £m £m £m £m £m % £m £m £m £m £m £m Δ%
Physical Infrastructure Markets 606 308 (54) - 254 352 4,943 7.1% - - - - 352 4,943 7.1%Wholesale Local Access Markets 2,434 2,106 (3) - 2,103 331 4,846 6.8% - 14 (14) 220 317 5,066 6.3%Business Connectivity Markets 720 594 2 1 597 123 1,320 9.3% - 1 (1) - 122 1,320 9.2%Narrowband Markets 1,867 1,485 15 2 1,502 365 2,853 12.8% - - - - 365 2,853 12.8%Wholesale Broadband Markets 127 42 - - 42 85 56 151.0% - - - - 85 56 151.0%Total SMP Markets 5,754 4,535 (40) 3 4,498 1,256 14,018 8.9% - 15 (15) 220 1,241 14,238 8.7%
Estimated impacts
Revenue
CCA Operating
Costs Return MCE £m £m £m £m
Adjusted NRC for WLA components - 30 (30) 220Property Rationalisation - - - - Restructuring Costs - 4 (4) -Residual Copper - (19) 19 -
- 15 (15) 220

Page 41
Section 6Review of the Physical Infrastructure Markets
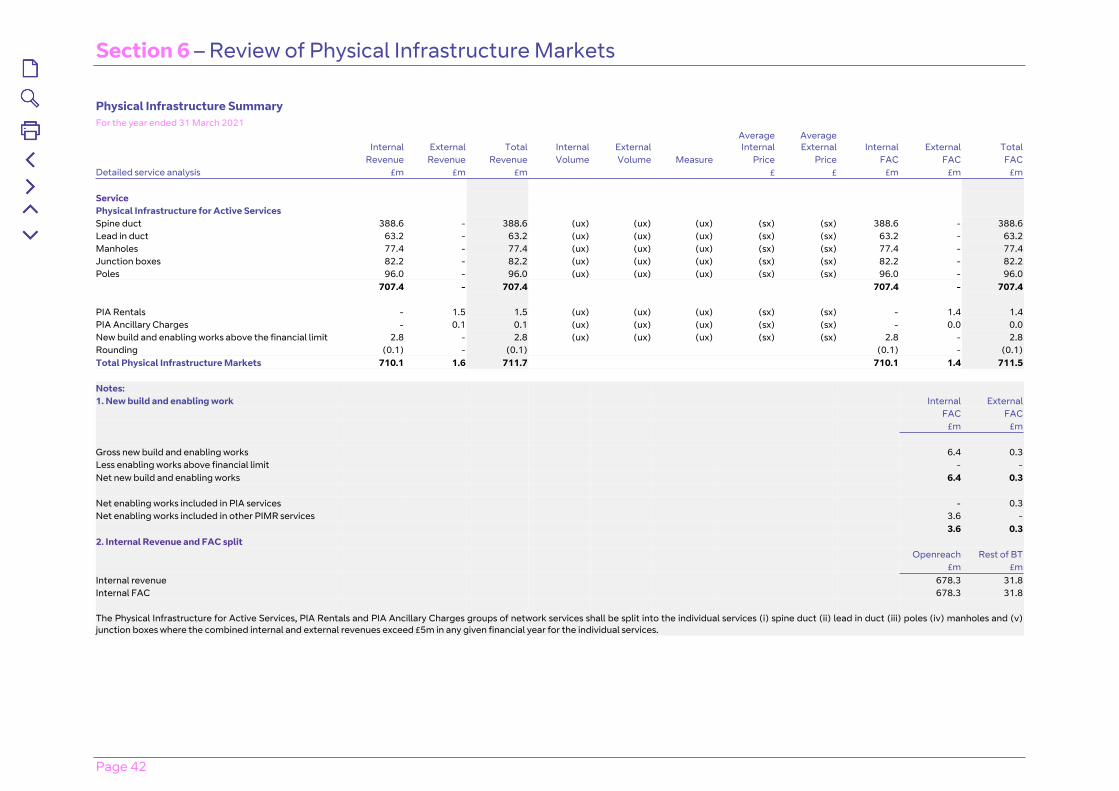
Section 6 – Review of Physical Infrastructure Markets
Page 42
Physical Infrastructure SummaryFor the year ended 31 March 2021
Internal External Total Internal ExternalAverage Internal
Average External Internal External Total
Revenue Revenue Revenue Volume Volume Measure Price Price FAC FAC FACDetailed service analysis £m £m £m £ £ £m £m £m
ServicePhysical Infrastructure for Active ServicesSpine duct 388.6 - 388.6 (ux) (ux) (ux) (sx) (sx) 388.6 - 388.6Lead in duct 63.2 - 63.2 (ux) (ux) (ux) (sx) (sx) 63.2 - 63.2Manholes 77.4 - 77.4 (ux) (ux) (ux) (sx) (sx) 77.4 - 77.4Junction boxes 82.2 - 82.2 (ux) (ux) (ux) (sx) (sx) 82.2 - 82.2Poles 96.0 - 96.0 (ux) (ux) (ux) (sx) (sx) 96.0 - 96.0
707.4 - 707.4 707.4 - 707.4
PIA Rentals - 1.5 1.5 (ux) (ux) (ux) (sx) (sx) - 1.4 1.4PIA Ancillary Charges - 0.1 0.1 (ux) (ux) (ux) (sx) (sx) - 0.0 0.0New build and enabling works above the financial limit 2.8 - 2.8 (ux) (ux) (ux) (sx) (sx) 2.8 - 2.8Rounding (0.1) - (0.1) (0.1) - (0.1)Total Physical Infrastructure Markets 710.1 1.6 711.7 710.1 1.4 711.5
Notes:1. New build and enabling work Internal External
FAC FAC£m £m
Gross new build and enabling works 6.4 0.3Less enabling works above financial limit - -Net new build and enabling works 6.4 0.3
Net enabling works included in PIA services - 0.3Net enabling works included in other PIMR services 3.6 -
3.6 0.32. Internal Revenue and FAC split
Openreach Rest of BT£m £m
Internal revenue 678.3 31.8Internal FAC 678.3 31.8
The Physical Infrastructure for Active Services, PIA Rentals and PIA Ancillary Charges groups of network services shall be split into the individual services (i) spine duct (ii) lead in duct (iii) poles (iv) manholes and (v) junction boxes where the combined internal and external revenues exceed £5m in any given financial year for the individual services.
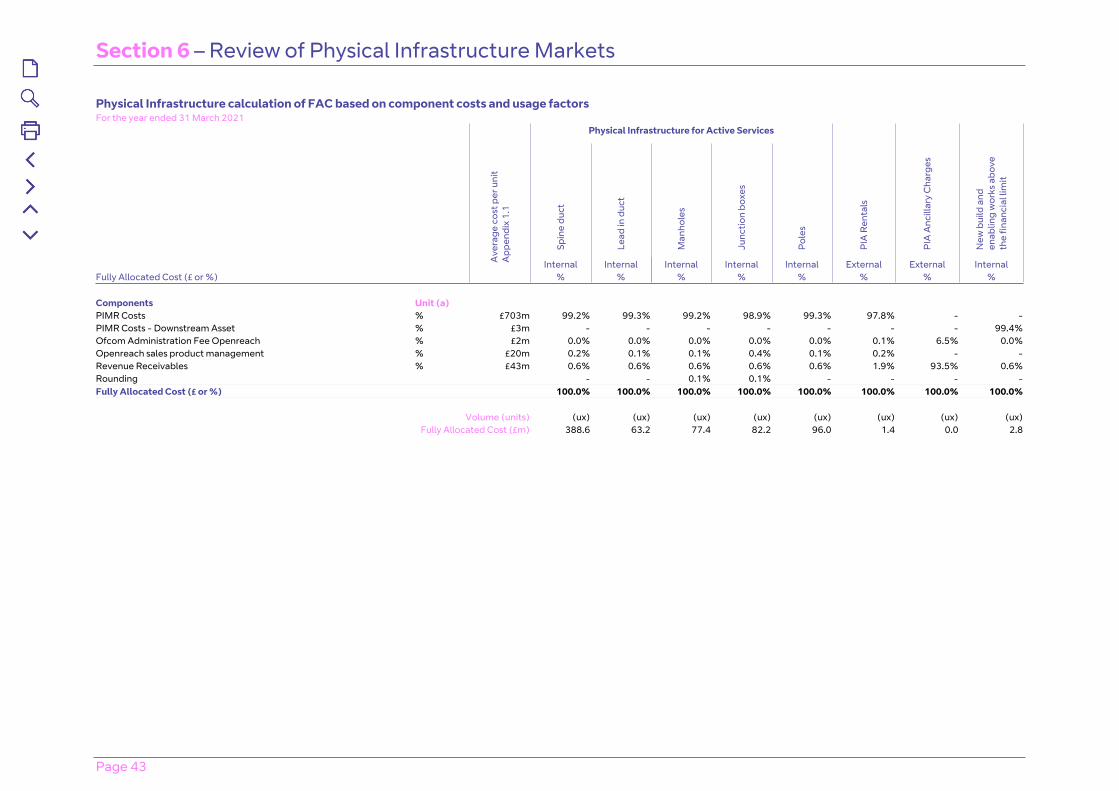
Section 6 – Review of Physical Infrastructure Markets
Page 43
Physical Infrastructure calculation of FAC based on component costs and usage factors For the year ended 31 March 2021
Physical Infrastructure for Active Services
Spin
e du
ct
Lead
in d
uct
Man
hole
s
Junc
tion
boxe
s
Pol
es
PIA
Ren
tals
PIA
Anc
illar
y C
harg
es
New
bui
ld a
nd
enab
ling
wor
ks a
bove
th
e fin
anci
al li
mit
Ave
rage
cos
t per
uni
t A
ppen
dix
1.1
Internal Internal Internal Internal Internal External External InternalFully Allocated Cost (£ or %) % % % % % % % % Components Unit (a) PIMR Costs % £703m 99.2% 99.3% 99.2% 98.9% 99.3% 97.8% - -PIMR Costs - Downstream Asset % £3m - - - - - - - 99.4%Ofcom Administration Fee Openreach % £2m 0.0% 0.0% 0.0% 0.0% 0.0% 0.1% 6.5% 0.0%Openreach sales product management % £20m 0.2% 0.1% 0.1% 0.4% 0.1% 0.2% - -Revenue Receivables % £43m 0.6% 0.6% 0.6% 0.6% 0.6% 1.9% 93.5% 0.6%Rounding - - 0.1% 0.1% - - - -Fully Allocated Cost (£ or %) 100.0% 100.0% 100.0% 100.0% 100.0% 100.0% 100.0% 100.0%
Volume (units) (ux) (ux) (ux) (ux) (ux) (ux) (ux) (ux)Fully Allocated Cost (£m) 388.6 63.2 77.4 82.2 96.0 1.4 0.0 2.8

Section 6 – Review of Physical Infrastructure Markets
Page 44
Physical Infrastructure Summary Restated for the year ended 31 March 2020 (b)
Internal External Total Internal External Average Internal
Average External Internal External Total
Revenue Revenue Revenue Volume Volume Measure Price Price FAC FAC FACDetailed service analysis £m £m £m £ £ £m £m £m Service Physical Infrastructure for Active Services Spine duct 326.5 - 326.5 (ux) (ux) (ux) (sx) (sx) 326.5 - 326.5Lead in duct 53.2 - 53.2 (ux) (ux) (ux) (sx) (sx) 53.2 - 53.2Manholes 54.6 - 54.6 (ux) (ux) (ux) (sx) (sx) 54.6 - 54.6Junction boxes 77.2 - 77.2 (ux) (ux) (ux) (sx) (sx) 77.2 - 77.2Poles 92.7 - 92.7 (ux) (ux) (ux) (sx) (sx) 92.7 - 92.7 604.2 - 604.2 604.2 - 604.2 PIA Rentals - 0.5 0.5 (ux) (ux) (ux) (sx) (sx) - 0.6 0.6PIA Ancillary Charges - 0.2 0.2 (ux) (ux) (ux) (sx) (sx) - 0.0 0.0New build and enabling works above the financial limit 0.8 - 0.8 (ux) (ux) (ux) (sx) (sx) 0.8 - 0.8Rounding - - - - - -Total Physical Infrastructure Markets 605.0 0.7 605.7 605.0 0.6 605.6 Notes: 1. New build and enabling work Internal External FAC FAC £m £m Gross new build and enabling works 1.8 0.3Less enabling works above financial limit - -Net new build and enabling works 1.8 0.3 Net enabling works included in PIA services - 0.3Net enabling works included in other PIMR services 1.8 - 1.8 0.32. Internal Revenue and FAC split Openreach Rest of BT £m £mInternal revenue 575.1 29.9Internal FAC 575.1 29.9 The Physical Infrastructure for Active Services, PIA Rentals and PIA Ancillary Charges groups of network services shall be split into the individual services (i) spine duct (ii) lead in duct (iii) poles (iv) manholes and (v) junction boxes where the combined internal and external revenues exceed £5m in any given financial year for the individual services.
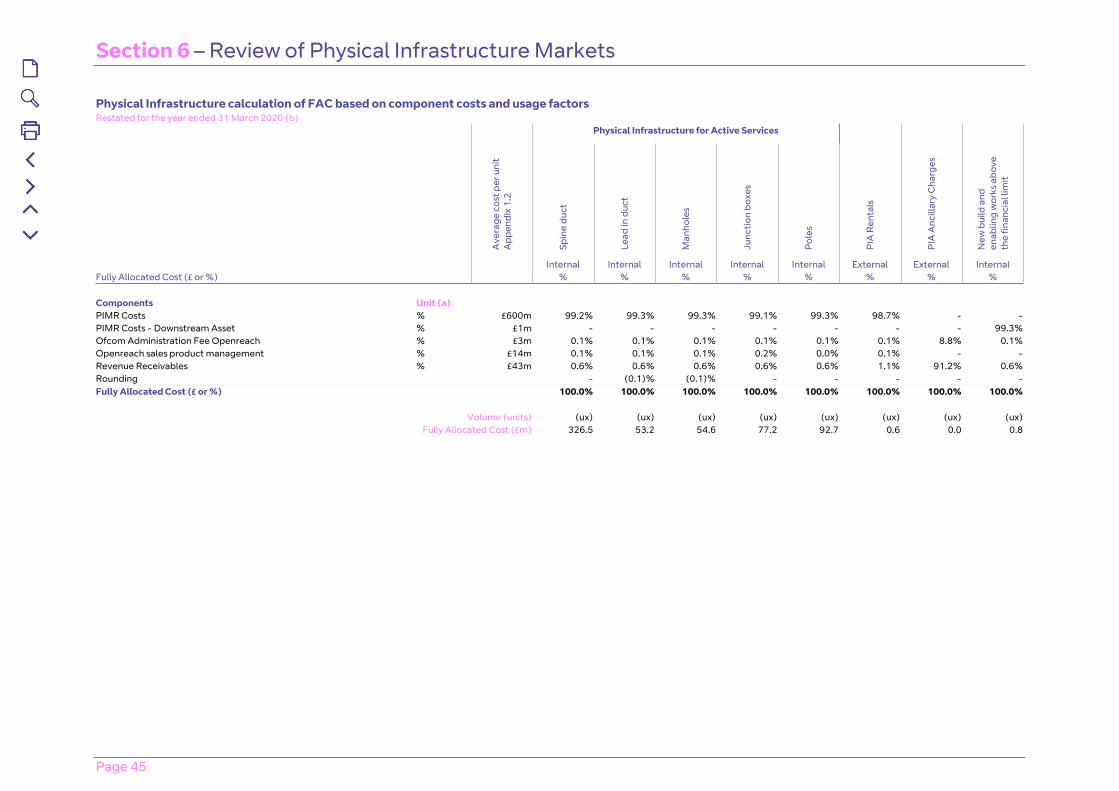
Section 6 – Review of Physical Infrastructure Markets
Page 45
Physical Infrastructure calculation of FAC based on component costs and usage factors Restated for the year ended 31 March 2020 (b)
Physical Infrastructure for Active Services
Ave
rage
cos
t per
uni
t A
ppen
dix
1.2
Spin
e du
ct
Lead
in d
uct
Man
hole
s
Junc
tion
boxe
s
Pol
es
PIA
Ren
tals
PIA
Anc
illar
y C
harg
es
New
bui
ld a
nd
enab
ling
wor
ks a
bove
th
e fin
anci
al li
mit
Internal Internal Internal Internal Internal External External InternalFully Allocated Cost (£ or %) % % % % % % % % Components Unit (a) PIMR Costs % £600m 99.2% 99.3% 99.3% 99.1% 99.3% 98.7% - -PIMR Costs - Downstream Asset % £1m - - - - - - - 99.3%Ofcom Administration Fee Openreach % £3m 0.1% 0.1% 0.1% 0.1% 0.1% 0.1% 8.8% 0.1%Openreach sales product management % £14m 0.1% 0.1% 0.1% 0.2% 0.0% 0.1% - -Revenue Receivables % £43m 0.6% 0.6% 0.6% 0.6% 0.6% 1.1% 91.2% 0.6%Rounding - (0.1)% (0.1)% - - - - -Fully Allocated Cost (£ or %) 100.0% 100.0% 100.0% 100.0% 100.0% 100.0% 100.0% 100.0%
Volume (units) (ux) (ux) (ux) (ux) (ux) (ux) (ux) (ux)Fully Allocated Cost (£m) 326.5 53.2 54.6 77.2 92.7 0.6 0.0 0.8
Page 46
Section 7Review of Wholesale Local Access Markets
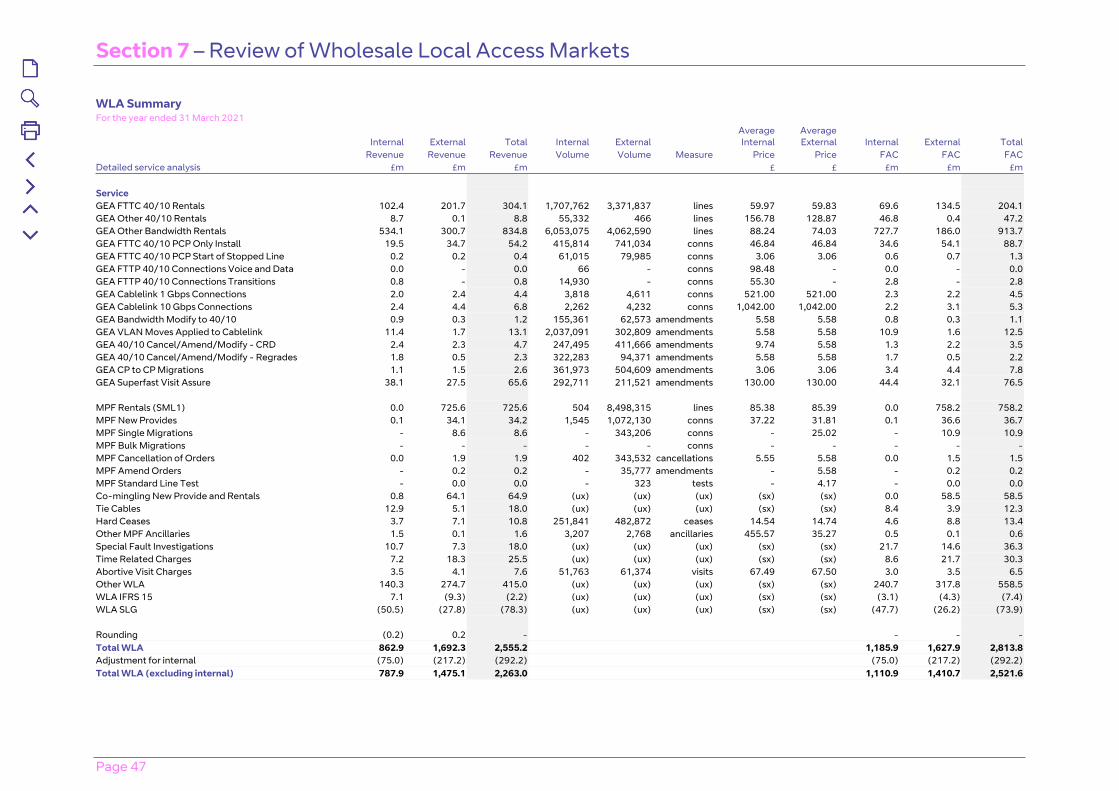
Section 7 – Review of Wholesale Local Access Markets
Page 47
WLA SummaryFor the year ended 31 March 2021
Internal External Total Internal External Average Internal
Average External Internal External Total
Revenue Revenue Revenue Volume Volume Measure Price Price FAC FAC FACDetailed service analysis £m £m £m £ £ £m £m £m Service GEA FTTC 40/10 Rentals 102.4 201.7 304.1 1,707,762 3,371,837 lines 59.97 59.83 69.6 134.5 204.1GEA Other 40/10 Rentals 8.7 0.1 8.8 55,332 466 lines 156.78 128.87 46.8 0.4 47.2GEA Other Bandwidth Rentals 534.1 300.7 834.8 6,053,075 4,062,590 lines 88.24 74.03 727.7 186.0 913.7GEA FTTC 40/10 PCP Only Install 19.5 34.7 54.2 415,814 741,034 conns 46.84 46.84 34.6 54.1 88.7GEA FTTC 40/10 PCP Start of Stopped Line 0.2 0.2 0.4 61,015 79,985 conns 3.06 3.06 0.6 0.7 1.3GEA FTTP 40/10 Connections Voice and Data 0.0 - 0.0 66 - conns 98.48 - 0.0 - 0.0GEA FTTP 40/10 Connections Transitions 0.8 - 0.8 14,930 - conns 55.30 - 2.8 - 2.8GEA Cablelink 1 Gbps Connections 2.0 2.4 4.4 3,818 4,611 conns 521.00 521.00 2.3 2.2 4.5GEA Cablelink 10 Gbps Connections 2.4 4.4 6.8 2,262 4,232 conns 1,042.00 1,042.00 2.2 3.1 5.3GEA Bandwidth Modify to 40/10 0.9 0.3 1.2 155,361 62,573 amendments 5.58 5.58 0.8 0.3 1.1GEA VLAN Moves Applied to Cablelink 11.4 1.7 13.1 2,037,091 302,809 amendments 5.58 5.58 10.9 1.6 12.5GEA 40/10 Cancel/Amend/Modify - CRD 2.4 2.3 4.7 247,495 411,666 amendments 9.74 5.58 1.3 2.2 3.5GEA 40/10 Cancel/Amend/Modify - Regrades 1.8 0.5 2.3 322,283 94,371 amendments 5.58 5.58 1.7 0.5 2.2GEA CP to CP Migrations 1.1 1.5 2.6 361,973 504,609 amendments 3.06 3.06 3.4 4.4 7.8GEA Superfast Visit Assure 38.1 27.5 65.6 292,711 211,521 amendments 130.00 130.00 44.4 32.1 76.5 MPF Rentals (SML1) 0.0 725.6 725.6 504 8,498,315 lines 85.38 85.39 0.0 758.2 758.2MPF New Provides 0.1 34.1 34.2 1,545 1,072,130 conns 37.22 31.81 0.1 36.6 36.7MPF Single Migrations - 8.6 8.6 - 343,206 conns - 25.02 - 10.9 10.9MPF Bulk Migrations - - - - - conns - - - - -MPF Cancellation of Orders 0.0 1.9 1.9 402 343,532 cancellations 5.55 5.58 0.0 1.5 1.5MPF Amend Orders - 0.2 0.2 - 35,777 amendments - 5.58 - 0.2 0.2MPF Standard Line Test - 0.0 0.0 - 323 tests - 4.17 - 0.0 0.0Co-mingling New Provide and Rentals 0.8 64.1 64.9 (ux) (ux) (ux) (sx) (sx) 0.0 58.5 58.5Tie Cables 12.9 5.1 18.0 (ux) (ux) (ux) (sx) (sx) 8.4 3.9 12.3Hard Ceases 3.7 7.1 10.8 251,841 482,872 ceases 14.54 14.74 4.6 8.8 13.4Other MPF Ancillaries 1.5 0.1 1.6 3,207 2,768 ancillaries 455.57 35.27 0.5 0.1 0.6Special Fault Investigations 10.7 7.3 18.0 (ux) (ux) (ux) (sx) (sx) 21.7 14.6 36.3Time Related Charges 7.2 18.3 25.5 (ux) (ux) (ux) (sx) (sx) 8.6 21.7 30.3Abortive Visit Charges 3.5 4.1 7.6 51,763 61,374 visits 67.49 67.50 3.0 3.5 6.5Other WLA 140.3 274.7 415.0 (ux) (ux) (ux) (sx) (sx) 240.7 317.8 558.5WLA IFRS 15 7.1 (9.3) (2.2) (ux) (ux) (ux) (sx) (sx) (3.1) (4.3) (7.4)WLA SLG (50.5) (27.8) (78.3) (ux) (ux) (ux) (sx) (sx) (47.7) (26.2) (73.9) Rounding (0.2) 0.2 - - - -Total WLA 862.9 1,692.3 2,555.2 1,185.9 1,627.9 2,813.8Adjustment for internal (75.0) (217.2) (292.2) (75.0) (217.2) (292.2)Total WLA (excluding internal) 787.9 1,475.1 2,263.0 1,110.9 1,410.7 2,521.6
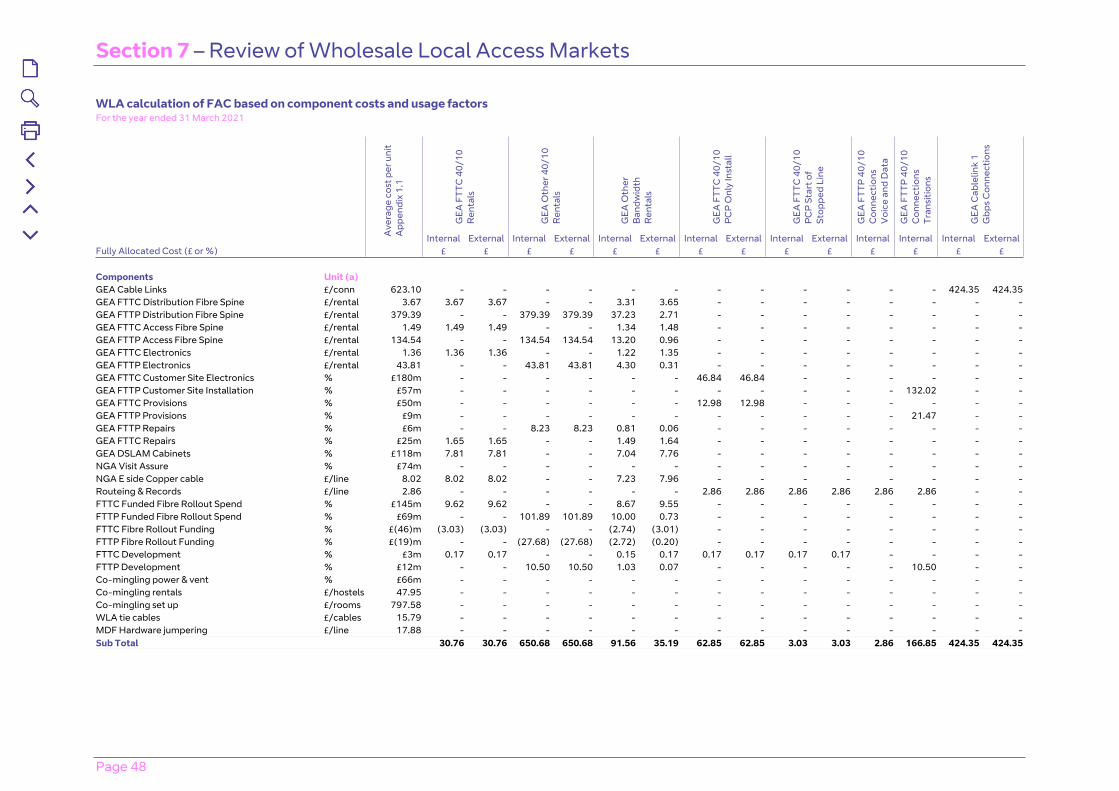
Section 7 – Review of Wholesale Local Access Markets
Page 48
WLA calculation of FAC based on component costs and usage factorsFor the year ended 31 March 2021
GEA
FTT
C 4
0/10
R
enta
ls
GEA
Oth
er 4
0/10
R
enta
ls
GEA
Oth
er
Ban
dwid
th
Ren
tals
GEA
FTT
C 4
0/10
P
CP
Onl
y In
stal
l
GEA
FTT
C 4
0/10
P
CP
Sta
rt o
f St
oppe
d Li
ne
GEA
FTT
P 4
0/10
C
onne
ctio
ns
Voi
ce a
nd D
ata
GEA
FTT
P 4
0/10
C
onne
ctio
ns
Tran
sitio
ns
GEA
Cab
lelin
k 1
Gbp
s C
onne
ctio
ns
Ave
rage
cos
t per
uni
t A
ppen
dix
1.1
Internal External Internal External Internal External Internal External Internal External Internal Internal Internal ExternalFully Allocated Cost (£ or %) £ £ £ £ £ £ £ £ £ £ £ £ £ £ Components Unit (a) GEA Cable Links £/conn 623.10 - - - - - - - - - - - - 424.35 424.35GEA FTTC Distribution Fibre Spine £/rental 3.67 3.67 3.67 - - 3.31 3.65 - - - - - - - -GEA FTTP Distribution Fibre Spine £/rental 379.39 - - 379.39 379.39 37.23 2.71 - - - - - - - -GEA FTTC Access Fibre Spine £/rental 1.49 1.49 1.49 - - 1.34 1.48 - - - - - - - -GEA FTTP Access Fibre Spine £/rental 134.54 - - 134.54 134.54 13.20 0.96 - - - - - - - -GEA FTTC Electronics £/rental 1.36 1.36 1.36 - - 1.22 1.35 - - - - - - - -GEA FTTP Electronics £/rental 43.81 - - 43.81 43.81 4.30 0.31 - - - - - - - -GEA FTTC Customer Site Electronics % £180m - - - - - - 46.84 46.84 - - - - - -GEA FTTP Customer Site Installation % £57m - - - - - - - - - - - 132.02 - -GEA FTTC Provisions % £50m - - - - - - 12.98 12.98 - - - - - -GEA FTTP Provisions % £9m - - - - - - - - - - - 21.47 - -GEA FTTP Repairs % £6m - - 8.23 8.23 0.81 0.06 - - - - - - - -GEA FTTC Repairs % £25m 1.65 1.65 - - 1.49 1.64 - - - - - - - -GEA DSLAM Cabinets % £118m 7.81 7.81 - - 7.04 7.76 - - - - - - - -NGA Visit Assure % £74m - - - - - - - - - - - - - -NGA E side Copper cable £/line 8.02 8.02 8.02 - - 7.23 7.96 - - - - - - - -Routeing & Records £/line 2.86 - - - - - - 2.86 2.86 2.86 2.86 2.86 2.86 - -FTTC Funded Fibre Rollout Spend % £145m 9.62 9.62 - - 8.67 9.55 - - - - - - - -FTTP Funded Fibre Rollout Spend % £69m - - 101.89 101.89 10.00 0.73 - - - - - - - -FTTC Fibre Rollout Funding % £(46)m (3.03) (3.03) - - (2.74) (3.01) - - - - - - - -FTTP Fibre Rollout Funding % £(19)m - - (27.68) (27.68) (2.72) (0.20) - - - - - - - -FTTC Development % £3m 0.17 0.17 - - 0.15 0.17 0.17 0.17 0.17 0.17 - - - -FTTP Development % £12m - - 10.50 10.50 1.03 0.07 - - - - - 10.50 - -Co-mingling power & vent % £66m - - - - - - - - - - - - - -Co-mingling rentals £/hostels 47.95 - - - - - - - - - - - - - -Co-mingling set up £/rooms 797.58 - - - - - - - - - - - - - -WLA tie cables £/cables 15.79 - - - - - - - - - - - - - -MDF Hardware jumpering £/line 17.88 - - - - - - - - - - - - - -Sub Total 30.76 30.76 650.68 650.68 91.56 35.19 62.85 62.85 3.03 3.03 2.86 166.85 424.35 424.35
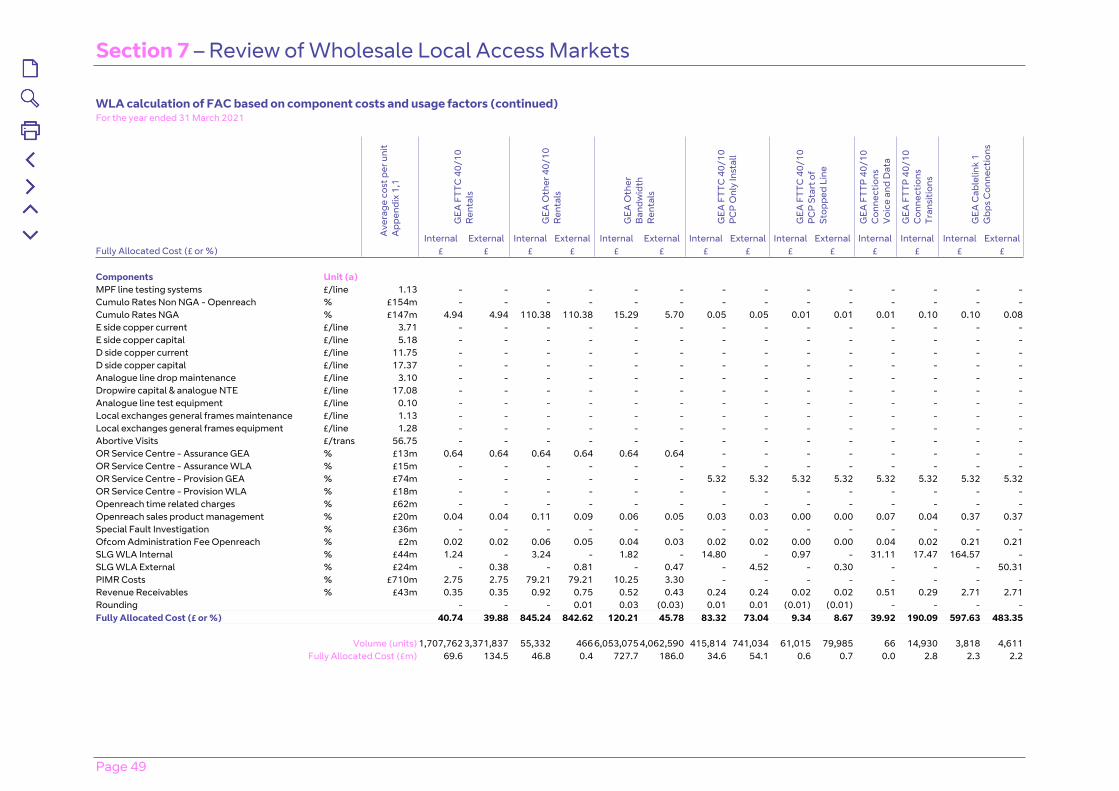
Section 7 – Review of Wholesale Local Access Markets
Page 49
WLA calculation of FAC based on component costs and usage factors (continued)For the year ended 31 March 2021
GEA
FTT
C 4
0/10
R
enta
ls
GEA
Oth
er 4
0/10
R
enta
ls
GEA
Oth
er
Ban
dwid
th
Ren
tals
GEA
FTT
C 4
0/10
P
CP
Onl
y In
stal
l
GEA
FTT
C 4
0/10
P
CP
Sta
rt o
f St
oppe
d Li
ne
GEA
FTT
P 4
0/10
C
onne
ctio
ns
Voi
ce a
nd D
ata
GEA
FTT
P 4
0/10
C
onne
ctio
ns
Tran
sitio
ns
GEA
Cab
lelin
k 1
Gbp
s C
onne
ctio
ns
Ave
rage
cos
t per
uni
t A
ppen
dix
1,1
Internal External Internal External Internal External Internal External Internal External Internal Internal Internal ExternalFully Allocated Cost (£ or %) £ £ £ £ £ £ £ £ £ £ £ £ £ £ Components Unit (a) MPF line testing systems £/line 1.13 - - - - - - - - - - - - - -Cumulo Rates Non NGA - Openreach % £154m - - - - - - - - - - - - - -Cumulo Rates NGA % £147m 4.94 4.94 110.38 110.38 15.29 5.70 0.05 0.05 0.01 0.01 0.01 0.10 0.10 0.08E side copper current £/line 3.71 - - - - - - - - - - - - - -E side copper capital £/line 5.18 - - - - - - - - - - - - - -D side copper current £/line 11.75 - - - - - - - - - - - - - -D side copper capital £/line 17.37 - - - - - - - - - - - - - -Analogue line drop maintenance £/line 3.10 - - - - - - - - - - - - - -Dropwire capital & analogue NTE £/line 17.08 - - - - - - - - - - - - - -Analogue line test equipment £/line 0.10 - - - - - - - - - - - - - -Local exchanges general frames maintenance £/line 1.13 - - - - - - - - - - - - - -Local exchanges general frames equipment £/line 1.28 - - - - - - - - - - - - - -Abortive Visits £/trans 56.75 - - - - - - - - - - - - - -OR Service Centre - Assurance GEA % £13m 0.64 0.64 0.64 0.64 0.64 0.64 - - - - - - - -OR Service Centre - Assurance WLA % £15m - - - - - - - - - - - - - -OR Service Centre - Provision GEA % £74m - - - - - - 5.32 5.32 5.32 5.32 5.32 5.32 5.32 5.32OR Service Centre - Provision WLA % £18m - - - - - - - - - - - - - -Openreach time related charges % £62m - - - - - - - - - - - - - -Openreach sales product management % £20m 0.04 0.04 0.11 0.09 0.06 0.05 0.03 0.03 0.00 0.00 0.07 0.04 0.37 0.37Special Fault Investigation % £36m - - - - - - - - - - - - - -Ofcom Administration Fee Openreach % £2m 0.02 0.02 0.06 0.05 0.04 0.03 0.02 0.02 0.00 0.00 0.04 0.02 0.21 0.21SLG WLA Internal % £44m 1.24 - 3.24 - 1.82 - 14.80 - 0.97 - 31.11 17.47 164.57 -SLG WLA External % £24m - 0.38 - 0.81 - 0.47 - 4.52 - 0.30 - - - 50.31PIMR Costs % £710m 2.75 2.75 79.21 79.21 10.25 3.30 - - - - - - - -Revenue Receivables % £43m 0.35 0.35 0.92 0.75 0.52 0.43 0.24 0.24 0.02 0.02 0.51 0.29 2.71 2.71Rounding - - - 0.01 0.03 (0.03) 0.01 0.01 (0.01) (0.01) - - - -Fully Allocated Cost (£ or %) 40.74 39.88 845.24 842.62 120.21 45.78 83.32 73.04 9.34 8.67 39.92 190.09 597.63 483.35
Volume (units) 1,707,762 3,371,837 55,332 466 6,053,075 4,062,590 415,814 741,034 61,015 79,985 66 14,930 3,818 4,611
Fully Allocated Cost (£m) 69.6 134.5 46.8 0.4 727.7 186.0 34.6 54.1 0.6 0.7 0.0 2.8 2.3 2.2
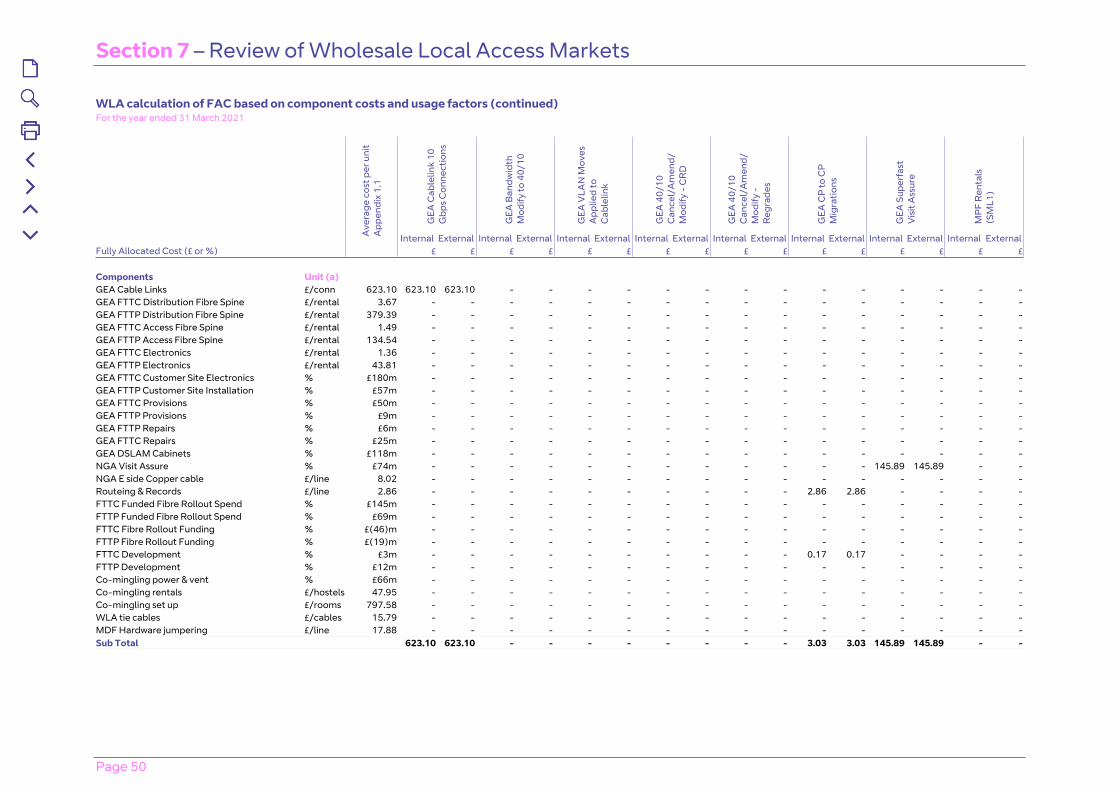
Section 7 – Review of Wholesale Local Access Markets
Page 50
WLA calculation of FAC based on component costs and usage factors (continued)For the year ended 31 March 2021
GEA
Cab
lelin
k 10
G
bps
Con
nect
ions
GEA
Ban
dwid
th
Mod
ify to
40/
10
GEA
VLA
N M
oves
A
pplie
d to
C
able
link
GEA
40/
10
Can
cel/
Am
end/
Mod
ify -
CR
D
GEA
40/
10
Can
cel/
Am
end/
Mod
ify -
R
egra
des
GEA
CP
to C
P
Mig
ratio
ns
GEA
Sup
erfa
st
Vis
it A
ssur
e
MP
F R
enta
ls
(SM
L1)
Ave
rage
cos
t per
uni
t A
ppen
dix
1.1
Internal External Internal External Internal External Internal External Internal External Internal External Internal External Internal ExternalFully Allocated Cost (£ or %) £ £ £ £ £ £ £ £ £ £ £ £ £ £ £ £ Components Unit (a) GEA Cable Links £/conn 623.10 623.10 623.10 - - - - - - - - - - - - - -GEA FTTC Distribution Fibre Spine £/rental 3.67 - - - - - - - - - - - - - - - -GEA FTTP Distribution Fibre Spine £/rental 379.39 - - - - - - - - - - - - - - - -GEA FTTC Access Fibre Spine £/rental 1.49 - - - - - - - - - - - - - - - -GEA FTTP Access Fibre Spine £/rental 134.54 - - - - - - - - - - - - - - - -GEA FTTC Electronics £/rental 1.36 - - - - - - - - - - - - - - - -GEA FTTP Electronics £/rental 43.81 - - - - - - - - - - - - - - - -GEA FTTC Customer Site Electronics % £180m - - - - - - - - - - - - - - - -GEA FTTP Customer Site Installation % £57m - - - - - - - - - - - - - - - -GEA FTTC Provisions % £50m - - - - - - - - - - - - - - - -GEA FTTP Provisions % £9m - - - - - - - - - - - - - - - -GEA FTTP Repairs % £6m - - - - - - - - - - - - - - - -GEA FTTC Repairs % £25m - - - - - - - - - - - - - - - -GEA DSLAM Cabinets % £118m - - - - - - - - - - - - - - - -NGA Visit Assure % £74m - - - - - - - - - - - - 145.89 145.89 - -NGA E side Copper cable £/line 8.02 - - - - - - - - - - - - - - - -Routeing & Records £/line 2.86 - - - - - - - - - - 2.86 2.86 - - - -FTTC Funded Fibre Rollout Spend % £145m - - - - - - - - - - - - - - - -FTTP Funded Fibre Rollout Spend % £69m - - - - - - - - - - - - - - - -FTTC Fibre Rollout Funding % £(46)m - - - - - - - - - - - - - - - -FTTP Fibre Rollout Funding % £(19)m - - - - - - - - - - - - - - - -FTTC Development % £3m - - - - - - - - - - 0.17 0.17 - - - -FTTP Development % £12m - - - - - - - - - - - - - - - -Co-mingling power & vent % £66m - - - - - - - - - - - - - - - -Co-mingling rentals £/hostels 47.95 - - - - - - - - - - - - - - - -Co-mingling set up £/rooms 797.58 - - - - - - - - - - - - - - - -WLA tie cables £/cables 15.79 - - - - - - - - - - - - - - - -MDF Hardware jumpering £/line 17.88 - - - - - - - - - - - - - - - -Sub Total 623.10 623.10 - - - - - - - - 3.03 3.03 145.89 145.89 - -

Section 7 – Review of Wholesale Local Access Markets
Page 51
WLA calculation of FAC based on component costs and usage factors (continued)For the year ended 31 March 2021
GEA
Cab
lelin
k 10
G
bps
Con
nect
ions
GEA
Ban
dwid
th
Mod
ify to
40/
10
GEA
VLA
N M
oves
A
pplie
d to
C
able
link
GEA
40/
10
Can
cel/
Am
end/
Mod
ify -
CR
D
GEA
40/
10
Can
cel/
Am
end/
Mod
ify -
R
egra
des
GEA
CP
to C
P
Mig
ratio
ns
GEA
Sup
erfa
st
Vis
it A
ssur
e
MP
F R
enta
ls
(SM
L1)
Ave
rage
cos
t per
uni
t A
ppen
dix
1.1
Internal External Internal External Internal External Internal External Internal External Internal External Internal External Internal ExternalFully Allocated Cost (£ or %) £ £ £ £ £ £ £ £ £ £ £ £ £ £ £ £
ComponentsUnit (a)
MPF line testing systems £/line 1.13 - - - - - - - - - - - - - - 1.13 1.13Cumulo Rates Non NGA - Openreach % £154m - - - - - - - - - - - - 0.07 0.07 4.28 4.28Cumulo Rates NGA % £147m 0.15 0.13 0.00 0.00 0.00 0.00 0.00 0.00 0.00 0.00 0.01 0.01 - - - -E side copper current £/line 3.71 - - - - - - - - - - - - - - 3.71 3.71E side copper capital £/line 5.18 - - - - - - - - - - - - - - 5.18 5.18D side copper current £/line 11.75 - - - - - - - - - - - - - - 10.62 10.62D side copper capital £/line 17.37 - - - - - - - - - - - - - - 17.37 17.37Analogue line drop maintenance £/line 3.10 - - - - - - - - - - - - - - 3.10 3.10Dropwire capital & analogue NTE £/line 17.08 - - - - - - - - - - - - - - 17.08 17.08Analogue line test equipment £/line 0.10 - - - - - - - - - - - - - - 0.10 0.10Local exchanges general frames maintenance £/line 1.13 - - - - - - - - - - - - - - 1.13 1.13Local exchanges general frames equipment £/line 1.28 - - - - - - - - - - - - - - 2.55 2.55Abortive Visits £/trans 56.75 - - - - - - - - - - - - - - - -OR Service Centre - Assurance GEA % £13m - - - - - - - - - - - - - - - -OR Service Centre - Assurance WLA % £15m - - - - - - - - - - - - - - 1.42 1.42OR Service Centre - Provision GEA % £74m 5.32 5.32 5.32 5.32 5.32 5.32 5.32 5.32 5.32 5.32 5.32 5.32 - - - -OR Service Centre - Provision WLA % £18m - - - - - - - - - - - - - - - -Openreach time related charges % £62m - - - - - - - - - - - - - - - -Openreach sales product management % £20m 0.73 0.73 0.00 0.00 0.00 0.00 0.01 0.00 0.00 0.00 0.12 0.12 5.10 5.10 0.13 0.13Special Fault Investigation % £36m - - - - - - - - - - - - - - - -Ofcom Administration Fee Openreach % £2m 0.42 0.42 0.00 0.00 0.00 0.00 0.00 0.00 0.00 0.00 0.00 0.00 0.05 0.05 0.03 0.03SLG WLA Internal % £44m 329.14 - - - - - - - - - 0.97 - - - 1.76 -SLG WLA External % £24m - 100.61 - - - - - - - - - 0.30 - - - 0.54PIMR Costs % £710m - - - - - - - - - - - - - - 20.35 20.35Revenue Receivables % £43m 5.41 5.41 0.03 0.03 0.03 0.03 0.05 0.03 0.03 0.03 0.02 0.02 0.68 0.68 0.50 0.50Rounding 0.02 0.01 0.01 0.01 0.01 0.01 0.01 0.01 0.01 0.01 (0.01) (0.01) (0.01) (0.01) 0.01 -Fully Allocated Cost (£ or %) 964.29 735.73 5.36 5.36 5.36 5.36 5.39 5.36 5.36 5.36 9.46 8.79 151.78 151.78 90.45 89.22
Volume (units) 2,262 4,232 155,361 62,573 2,037,091 302,809 247,495 411,666 322,283 94,371 361,973 504,609 292,711 211,521 504 8,498,315
Fully Allocated Cost (£m) 2.2 3.1 0.8 0.3 10.9 1.6 1.3 2.2 1.7 0.5 3.4 4.4 44.4 32.1 0.0 758.2

Section 7 – Review of Wholesale Local Access Markets
Page 52
WLA calculation of FAC based on component costs and usage factors (continued)For the year ended 31 March 2021
MP
F N
ew
Pro
vide
s
MP
F Si
ngle
M
igra
tions
MP
F B
ulk
Mig
ratio
ns
MP
F C
ance
llatio
n of
Ord
ers
MP
F A
men
d O
rder
s
MP
F St
anda
rd
Line
Tes
t
Co-
min
glin
g N
ew
Pro
vide
and
R
enta
ls
Tie
Cab
les
Ave
rage
cos
t per
uni
t A
ppen
dix
1.1
Internal External External External Internal External External External Internal External Internal ExternalFully Allocated Cost (£ or %) £ £ £ £ £ £ £ £ % % % % Components Unit (a) GEA Cable Links £/conn 623.10 - - - - - - - - - - - -GEA FTTC Distribution Fibre Spine £/rental 3.67 - - - - - - - - - - - -GEA FTTP Distribution Fibre Spine £/rental 379.39 - - - - - - - - - - - -GEA FTTC Access Fibre Spine £/rental 1.49 - - - - - - - - - - - -GEA FTTP Access Fibre Spine £/rental 134.54 - - - - - - - - - - - -GEA FTTC Electronics £/rental 1.36 - - - - - - - - - - - -GEA FTTP Electronics £/rental 43.81 - - - - - - - - - - - -GEA FTTC Customer Site Electronics % £180m - - - - - - - - - - - -GEA FTTP Customer Site Installation % £57m - - - - - - - - - - - -GEA FTTC Provisions % £50m - - - - - - - - - - - -GEA FTTP Provisions % £9m - - - - - - - - - - - -GEA FTTP Repairs % £6m - - - - - - - - - - - -GEA FTTC Repairs % £25m - - - - - - - - - - - -GEA DSLAM Cabinets % £118m - - - - - - - - - - - -NGA Visit Assure % £74m - - - - - - - - - - - -NGA E side Copper cable £/line 8.02 - - - - - - - - - - - -Routeing & Records £/line 2.86 2.86 2.86 - - - - - - - - - -FTTC Funded Fibre Rollout Spend % £145m - - - - - - - - - - - -FTTP Funded Fibre Rollout Spend % £69m - - - - - - - - - - - -FTTC Fibre Rollout Funding % £(46)m - - - - - - - - - - - -FTTP Fibre Rollout Funding % £(19)m - - - - - - - - - - - -FTTC Development % £3m - - - - - - - - - - - -FTTP Development % £12m - - - - - - - - - - - -Co-mingling power & vent % £66m - - - - - - - - - 22.4 % - -Co-mingling rentals £/hostels 47.95 - - - - - - - - - 32.4 % - -Co-mingling set up £/rooms 797.58 - - - - - - - - - 39.4 % - -WLA tie cables £/cables 15.79 - - - - - - - - - - 73.8 % 69.3 %MDF Hardware jumpering £/line 17.88 23.55 23.55 24.71 - - - - - - - - -Sub Total 26.41 26.41 24.71 - - - - - - 94.2% 73.8% 69.3%
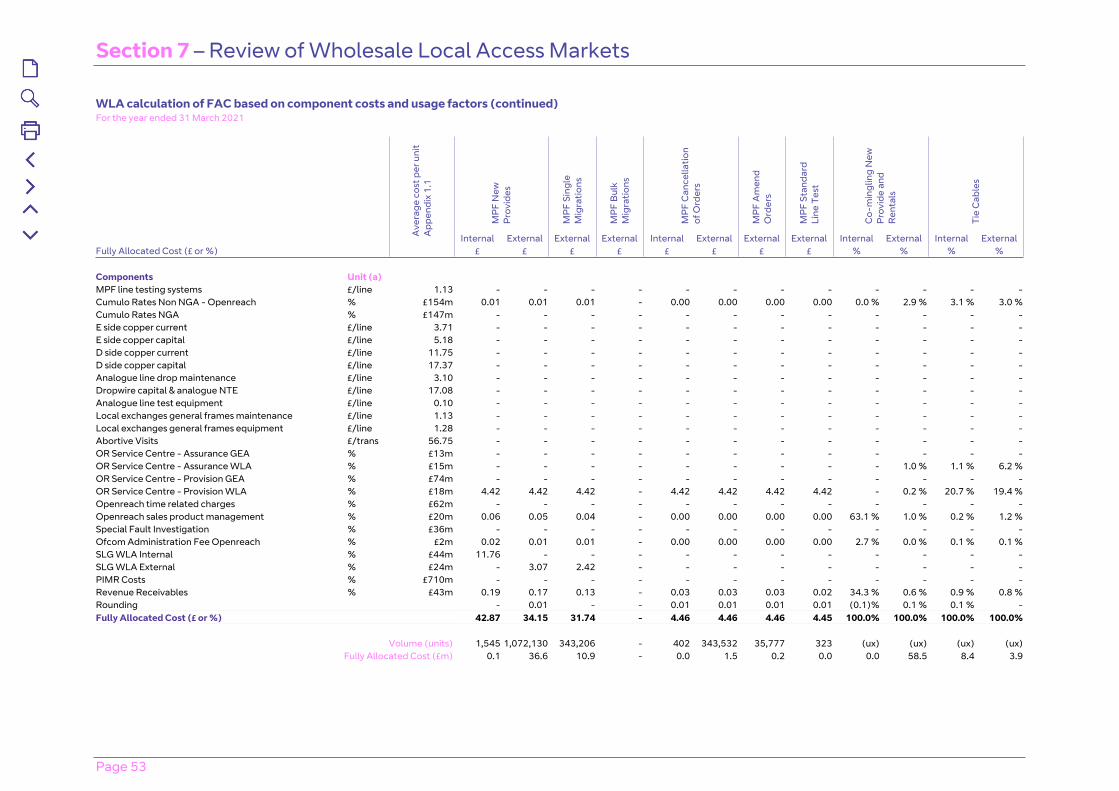
Section 7 – Review of Wholesale Local Access Markets
Page 53
WLA calculation of FAC based on component costs and usage factors (continued)For the year ended 31 March 2021
MP
F N
ew
Pro
vide
s
MP
F Si
ngle
M
igra
tions
MP
F B
ulk
Mig
ratio
ns
MP
F C
ance
llatio
n of
Ord
ers
MP
F A
men
d O
rder
s
MP
F St
anda
rd
Line
Tes
t
Co-
min
glin
g N
ew
Pro
vide
and
R
enta
ls
Tie
Cab
les
Ave
rage
cos
t per
uni
t A
ppen
dix
1.1
Internal External External External Internal External External External Internal External Internal ExternalFully Allocated Cost (£ or %) £ £ £ £ £ £ £ £ % % % % Components Unit (a) MPF line testing systems £/line 1.13 - - - - - - - - - - - -Cumulo Rates Non NGA - Openreach % £154m 0.01 0.01 0.01 - 0.00 0.00 0.00 0.00 0.0 % 2.9 % 3.1 % 3.0 %Cumulo Rates NGA % £147m - - - - - - - - - - - -E side copper current £/line 3.71 - - - - - - - - - - - -E side copper capital £/line 5.18 - - - - - - - - - - - -D side copper current £/line 11.75 - - - - - - - - - - - -D side copper capital £/line 17.37 - - - - - - - - - - - -Analogue line drop maintenance £/line 3.10 - - - - - - - - - - - -Dropwire capital & analogue NTE £/line 17.08 - - - - - - - - - - - -Analogue line test equipment £/line 0.10 - - - - - - - - - - - -Local exchanges general frames maintenance £/line 1.13 - - - - - - - - - - - -Local exchanges general frames equipment £/line 1.28 - - - - - - - - - - - -Abortive Visits £/trans 56.75 - - - - - - - - - - - -OR Service Centre - Assurance GEA % £13m - - - - - - - - - - - -OR Service Centre - Assurance WLA % £15m - - - - - - - - - 1.0 % 1.1 % 6.2 %OR Service Centre - Provision GEA % £74m - - - - - - - - - - - -OR Service Centre - Provision WLA % £18m 4.42 4.42 4.42 - 4.42 4.42 4.42 4.42 - 0.2 % 20.7 % 19.4 %Openreach time related charges % £62m - - - - - - - - - - - -Openreach sales product management % £20m 0.06 0.05 0.04 - 0.00 0.00 0.00 0.00 63.1 % 1.0 % 0.2 % 1.2 %Special Fault Investigation % £36m - - - - - - - - - - - -Ofcom Administration Fee Openreach % £2m 0.02 0.01 0.01 - 0.00 0.00 0.00 0.00 2.7 % 0.0 % 0.1 % 0.1 %SLG WLA Internal % £44m 11.76 - - - - - - - - - - -SLG WLA External % £24m - 3.07 2.42 - - - - - - - - -PIMR Costs % £710m - - - - - - - - - - - -Revenue Receivables % £43m 0.19 0.17 0.13 - 0.03 0.03 0.03 0.02 34.3 % 0.6 % 0.9 % 0.8 %Rounding - 0.01 - - 0.01 0.01 0.01 0.01 (0.1)% 0.1 % 0.1 % -Fully Allocated Cost (£ or %) 42.87 34.15 31.74 - 4.46 4.46 4.46 4.45 100.0% 100.0% 100.0% 100.0%
Volume (units) 1,545 1,072,130 343,206 - 402 343,532 35,777 323 (ux) (ux) (ux) (ux)
Fully Allocated Cost (£m) 0.1 36.6 10.9 - 0.0 1.5 0.2 0.0 0.0 58.5 8.4 3.9
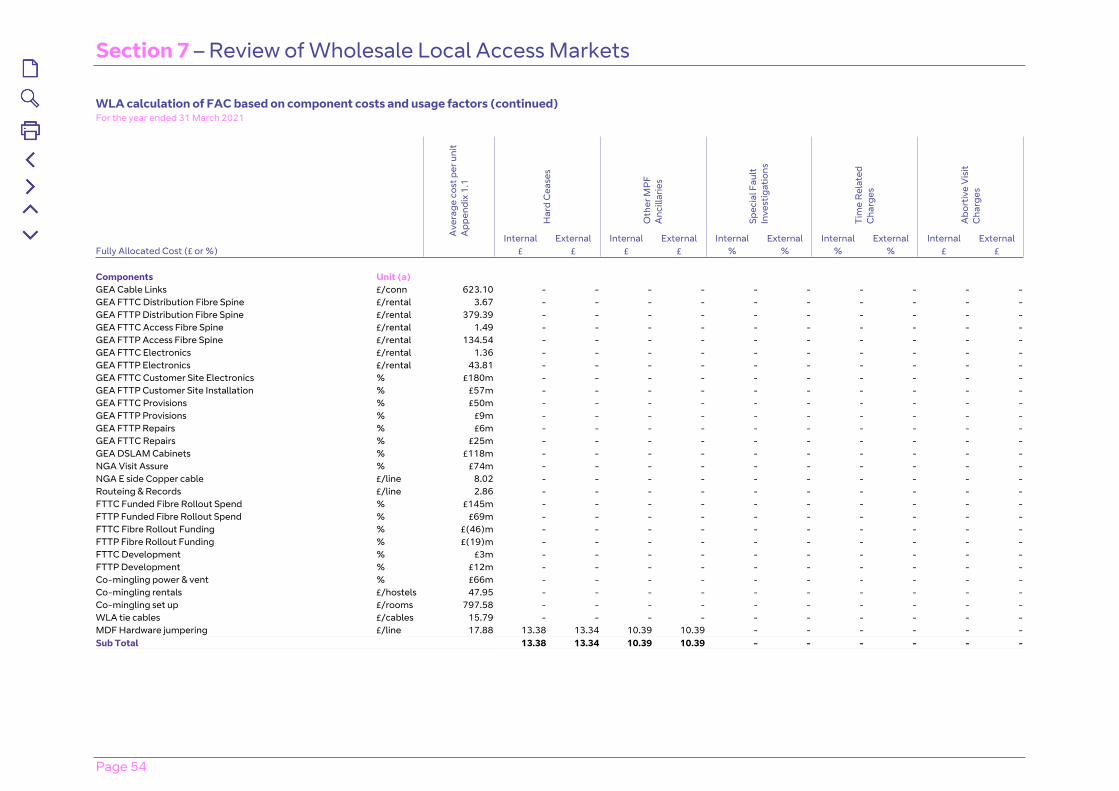
Section 7 – Review of Wholesale Local Access Markets
Page 54
WLA calculation of FAC based on component costs and usage factors (continued)For the year ended 31 March 2021
Har
d C
ease
s
Oth
er M
PF
Anc
illar
ies
Spec
ial F
ault
In
vest
igat
ions
Tim
e R
elat
ed
Cha
rges
Abo
rtiv
e V
isit
Cha
rges
Ave
rage
cos
t per
uni
t A
ppen
dix
1.1
Internal External Internal External Internal External Internal External Internal ExternalFully Allocated Cost (£ or %) £ £ £ £ % % % % £ £ Components Unit (a) GEA Cable Links £/conn 623.10 - - - - - - - - - -GEA FTTC Distribution Fibre Spine £/rental 3.67 - - - - - - - - - -GEA FTTP Distribution Fibre Spine £/rental 379.39 - - - - - - - - - -GEA FTTC Access Fibre Spine £/rental 1.49 - - - - - - - - - -GEA FTTP Access Fibre Spine £/rental 134.54 - - - - - - - - - -GEA FTTC Electronics £/rental 1.36 - - - - - - - - - -GEA FTTP Electronics £/rental 43.81 - - - - - - - - - -GEA FTTC Customer Site Electronics % £180m - - - - - - - - - -GEA FTTP Customer Site Installation % £57m - - - - - - - - - -GEA FTTC Provisions % £50m - - - - - - - - - -GEA FTTP Provisions % £9m - - - - - - - - - -GEA FTTP Repairs % £6m - - - - - - - - - -GEA FTTC Repairs % £25m - - - - - - - - - -GEA DSLAM Cabinets % £118m - - - - - - - - - -NGA Visit Assure % £74m - - - - - - - - - -NGA E side Copper cable £/line 8.02 - - - - - - - - - -Routeing & Records £/line 2.86 - - - - - - - - - -FTTC Funded Fibre Rollout Spend % £145m - - - - - - - - - -FTTP Funded Fibre Rollout Spend % £69m - - - - - - - - - -FTTC Fibre Rollout Funding % £(46)m - - - - - - - - - -FTTP Fibre Rollout Funding % £(19)m - - - - - - - - - -FTTC Development % £3m - - - - - - - - - -FTTP Development % £12m - - - - - - - - - -Co-mingling power & vent % £66m - - - - - - - - - -Co-mingling rentals £/hostels 47.95 - - - - - - - - - -Co-mingling set up £/rooms 797.58 - - - - - - - - - -WLA tie cables £/cables 15.79 - - - - - - - - - -MDF Hardware jumpering £/line 17.88 13.38 13.34 10.39 10.39 - - - - - -Sub Total 13.38 13.34 10.39 10.39 - - - - - -
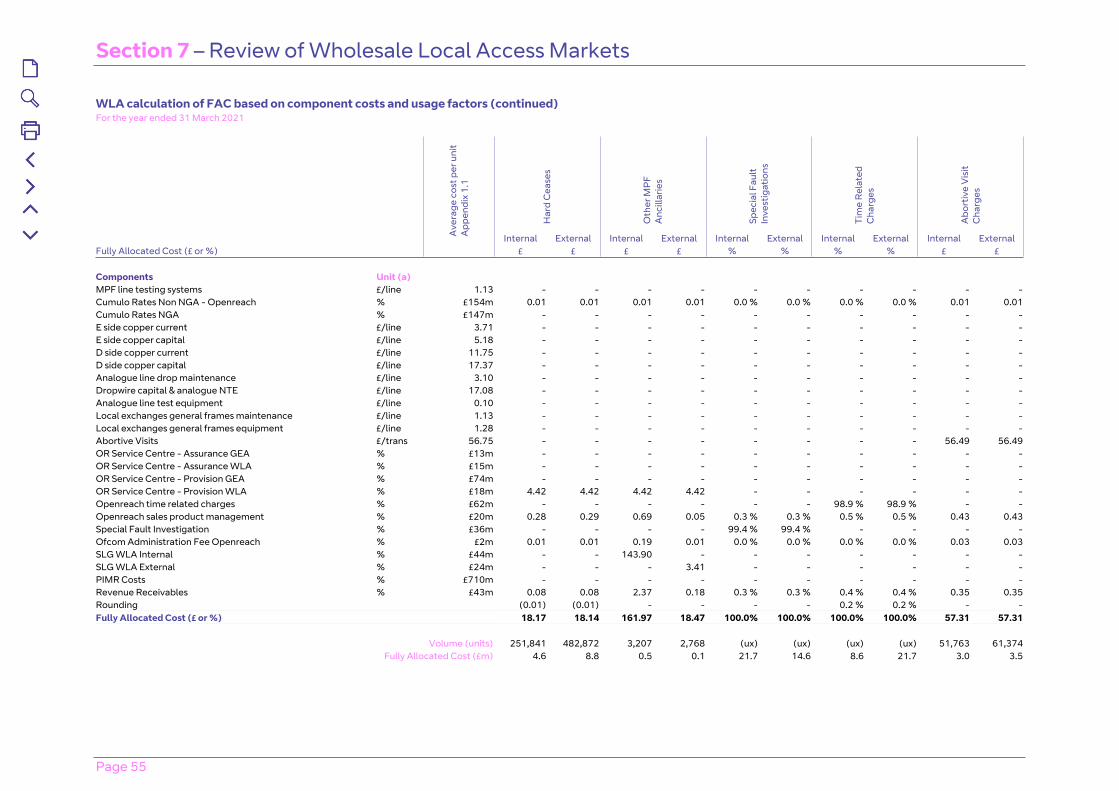
Section 7 – Review of Wholesale Local Access Markets
Page 55
WLA calculation of FAC based on component costs and usage factors (continued)For the year ended 31 March 2021
Har
d C
ease
s
Oth
er M
PF
Anc
illar
ies
Spec
ial F
ault
In
vest
igat
ions
Tim
e R
elat
ed
Cha
rges
Abo
rtiv
e V
isit
Cha
rges
Ave
rage
cos
t per
uni
t A
ppen
dix
1.1
Internal External Internal External Internal External Internal External Internal ExternalFully Allocated Cost (£ or %) £ £ £ £ % % % % £ £ Components Unit (a) MPF line testing systems £/line 1.13 - - - - - - - - - -Cumulo Rates Non NGA - Openreach % £154m 0.01 0.01 0.01 0.01 0.0 % 0.0 % 0.0 % 0.0 % 0.01 0.01Cumulo Rates NGA % £147m - - - - - - - - - -E side copper current £/line 3.71 - - - - - - - - - -E side copper capital £/line 5.18 - - - - - - - - - -D side copper current £/line 11.75 - - - - - - - - - -D side copper capital £/line 17.37 - - - - - - - - - -Analogue line drop maintenance £/line 3.10 - - - - - - - - - -Dropwire capital & analogue NTE £/line 17.08 - - - - - - - - - -Analogue line test equipment £/line 0.10 - - - - - - - - - -Local exchanges general frames maintenance £/line 1.13 - - - - - - - - - -Local exchanges general frames equipment £/line 1.28 - - - - - - - - - -Abortive Visits £/trans 56.75 - - - - - - - - 56.49 56.49OR Service Centre - Assurance GEA % £13m - - - - - - - - - -OR Service Centre - Assurance WLA % £15m - - - - - - - - - -OR Service Centre - Provision GEA % £74m - - - - - - - - - -OR Service Centre - Provision WLA % £18m 4.42 4.42 4.42 4.42 - - - - - -Openreach time related charges % £62m - - - - - - 98.9 % 98.9 % - -Openreach sales product management % £20m 0.28 0.29 0.69 0.05 0.3 % 0.3 % 0.5 % 0.5 % 0.43 0.43Special Fault Investigation % £36m - - - - 99.4 % 99.4 % - - - -Ofcom Administration Fee Openreach % £2m 0.01 0.01 0.19 0.01 0.0 % 0.0 % 0.0 % 0.0 % 0.03 0.03SLG WLA Internal % £44m - - 143.90 - - - - - - -SLG WLA External % £24m - - - 3.41 - - - - - -PIMR Costs % £710m - - - - - - - - - -Revenue Receivables % £43m 0.08 0.08 2.37 0.18 0.3 % 0.3 % 0.4 % 0.4 % 0.35 0.35Rounding (0.01) (0.01) - - - - 0.2 % 0.2 % - -Fully Allocated Cost (£ or %) 18.17 18.14 161.97 18.47 100.0% 100.0% 100.0% 100.0% 57.31 57.31
Volume (units) 251,841 482,872 3,207 2,768 (ux) (ux) (ux) (ux) 51,763 61,374
Fully Allocated Cost (£m) 4.6 8.8 0.5 0.1 21.7 14.6 8.6 21.7 3.0 3.5

Section 7 – Review of Wholesale Local Access Markets
Page 56
WLA Summary Restated for the year ended 31 March 2020 (b)
Internal External Total Internal External Average Internal
Average External Internal External Total
Revenue Revenue Revenue Volume Volume Measure Price Price FAC FAC FAC Detailed service analysis £m £m £m £ £ £m £m £m Service GEA FTTC 40/10 Rentals 88.7 207.9 296.6 1,475,598 3,430,694 lines 60.13 60.61 70.9 164.4 235.3 GEA Other 40/10 Rentals 6.4 0.0 6.4 48,186 51 lines 132.54 147.44 44.1 0.0 44.1 GEA Other Bandwidth Rentals 468.1 193.3 661.4 5,626,583 2,744,488 lines 83.20 70.43 582.1 132.2 714.3 GEA FTTC 40/10 PCP Only Install 25.1 45.9 71.0 547,318 962,566 conns 45.92 47.67 35.5 61.7 97.2 GEA FTTC 40/10 PCP Start of Stopped Line 0.2 0.6 0.8 68,770 117,304 conns 2.99 4.74 0.5 0.8 1.3 GEA FTTP 40/10 Connections Voice and Data 1.8 - 1.8 19,067 - conns 94.10 - 0.3 - 0.3 GEA FTTP 40/10 Connections Transitions 1.0 - 1.0 18,478 - conns 52.35 - 4.5 - 4.5 GEA Cablelink 1 Gbps Connections 2.0 3.2 5.2 3,837 6,182 conns 521.00 521.00 2.3 3.6 5.9 GEA Cablelink 10 Gbps Connections 2.8 3.3 6.1 2,656 3,127 conns 1,042.00 1,042.00 2.5 2.9 5.4 GEA Bandwidth Modify to 40/10 1.0 0.9 1.9 168,374 150,054 amendments 5.82 5.82 0.5 0.4 0.9 GEA VLAN Moves Applied to Cablelink 18.8 1.3 20.1 3,229,586 228,961 amendments 5.82 5.82 9.3 0.7 10.0 GEA 40/10 Cancel/Amend/Modify - CRD 1.5 1.8 3.3 261,885 308,112 amendments 5.82 5.82 0.8 0.9 1.7 GEA 40/10 Cancel/Amend/Modify - Regrades 1.7 1.0 2.7 295,249 164,490 amendments 5.82 5.82 0.9 0.5 1.4 GEA CP to CP Migrations 1.1 1.9 3.0 367,649 651,973 amendments 2.99 2.99 2.6 4.5 7.1 GEA Superfast Visit Assure 25.8 21.1 46.9 198,191 161,923 amendments 130.00 130.00 33.5 27.4 60.9 MPF Rentals (SML1) 0.2 732.6 732.8 2,287 8,538,563 lines 85.81 85.80 0.2 719.9 720.1 MPF New Provides 0.2 52.5 52.7 6,528 1,618,234 conns 37.25 32.42 0.2 49.2 49.4 MPF Single Migrations - 12.9 12.9 - 512,841 conns - 25.16 - 14.2 14.2 MPF Bulk Migrations - 0.1 0.1 - 6,102 conns - 18.29 - 0.2 0.2 MPF Cancellation of Orders 0.0 1.5 1.5 674 259,936 cancellations 5.82 5.82 0.0 0.8 0.8 MPF Amend Orders - 0.3 0.3 - 57,416 amendments - 5.82 - 0.2 0.2 MPF Standard Line Test - 0.0 0.0 - 1,717 tests - 4.11 - 0.0 0.0 Co-mingling New Provide and Rentals 0.9 58.0 58.9 (ux) (ux) (ux) (sx) (sx) 0.0 51.8 51.8 Tie Cables 13.1 4.3 17.4 (ux) (ux) (ux) (sx) (sx) 9.3 7.6 16.9 Hard Ceases 3.4 14.5 17.9 242,119 937,775 ceases 14.03 15.45 3.7 14.4 18.1 Other MPF Ancillaries 1.3 0.6 1.9 23,870 25,107 ancillaries 53.56 23.63 0.5 0.4 0.9 Special Fault Investigations 10.5 9.2 19.7 (ux) (ux) (ux) (sx) (sx) 22.1 18.9 41.0 Time Related Charges 4.9 19.4 24.3 (ux) (ux) (ux) (sx) (sx) 5.6 22.2 27.8 Abortive Visit Charges 4.4 7.1 11.5 62,173 100,862 visits 70.00 70.00 3.7 6.0 9.7 Other WLA 156.8 234.1 390.9 (ux) (ux) (ux) (sx) (sx) 200.6 240.8 441.4 WLA IFRS 15 1.3 4.8 6.1 (ux) (ux) (ux) (sx) (sx) (0.6 ) (2.9 ) (3.5 )WLA SLG (24.0 ) (19.5 ) (43.5 ) (ux) (ux) (ux) (sx) (sx) (25.0 ) (20.3 ) (45.3 ) Rounding - 0.1 0.1 - - - Total WLA 819.0 1,614.7 2,433.7 1,010.6 1,523.4 2,534.0 Adjustment for internal (60.4 ) (180.4 ) (240.8 ) (60.4 ) (180.4 ) (240.8 )Total WLA (excluding internal) 758.6 1,434.3 2,192.9 950.2 1,343.0 2,293.2
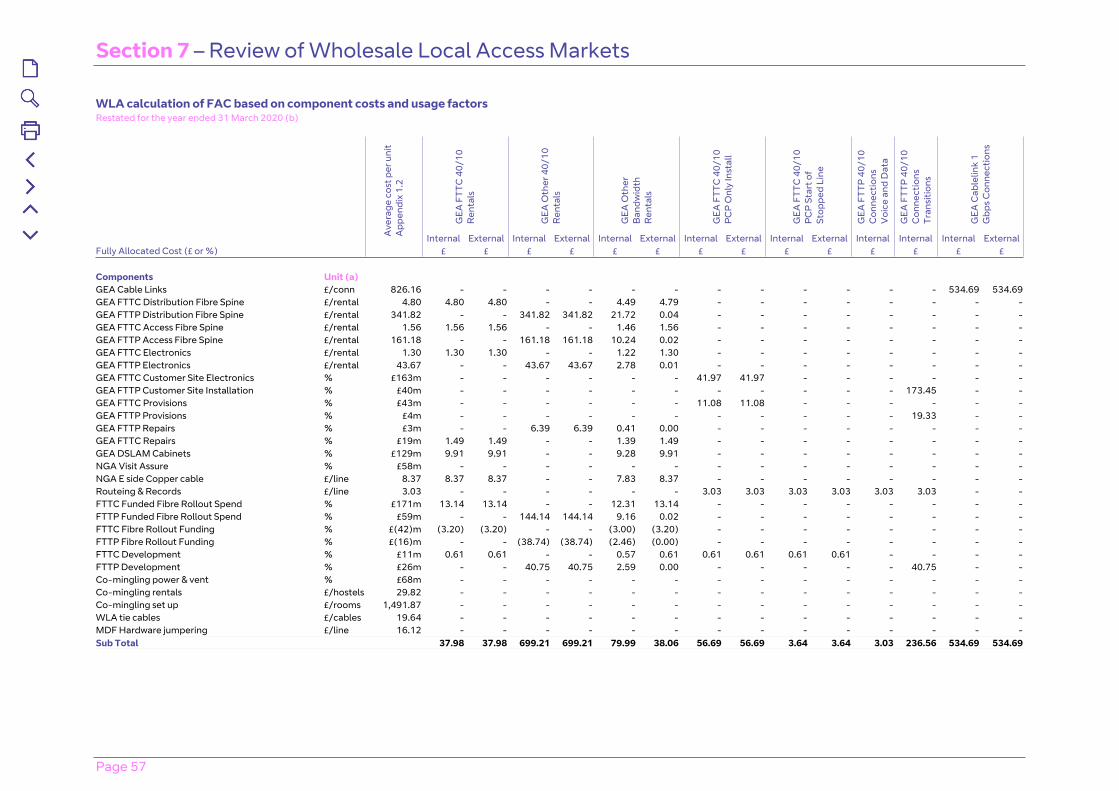
Section 7 – Review of Wholesale Local Access Markets
Page 57
WLA calculation of FAC based on component costs and usage factorsRestated for the year ended 31 March 2020 (b)
GEA
FTT
C 4
0/10
R
enta
ls
GEA
Oth
er 4
0/10
R
enta
ls
GEA
Oth
er
Ban
dwid
th
Ren
tals
GEA
FTT
C 4
0/10
P
CP
Onl
y In
stal
l
GEA
FTT
C 4
0/10
P
CP
Sta
rt o
f St
oppe
d Li
ne
GEA
FTT
P 4
0/10
C
onne
ctio
ns
Voi
ce a
nd D
ata
GEA
FTT
P 4
0/10
C
onne
ctio
ns
Tran
sitio
ns
GEA
Cab
lelin
k 1
Gbp
s C
onne
ctio
ns
Ave
rage
cos
t per
uni
t A
ppen
dix
1.2
Internal External Internal External Internal External Internal External Internal External Internal Internal Internal ExternalFully Allocated Cost (£ or %) £ £ £ £ £ £ £ £ £ £ £ £ £ £ Components Unit (a) GEA Cable Links £/conn 826.16 - - - - - - - - - - - - 534.69 534.69GEA FTTC Distribution Fibre Spine £/rental 4.80 4.80 4.80 - - 4.49 4.79 - - - - - - - -GEA FTTP Distribution Fibre Spine £/rental 341.82 - - 341.82 341.82 21.72 0.04 - - - - - - - -GEA FTTC Access Fibre Spine £/rental 1.56 1.56 1.56 - - 1.46 1.56 - - - - - - - -GEA FTTP Access Fibre Spine £/rental 161.18 - - 161.18 161.18 10.24 0.02 - - - - - - - -GEA FTTC Electronics £/rental 1.30 1.30 1.30 - - 1.22 1.30 - - - - - - - -GEA FTTP Electronics £/rental 43.67 - - 43.67 43.67 2.78 0.01 - - - - - - - -GEA FTTC Customer Site Electronics % £163m - - - - - - 41.97 41.97 - - - - - -GEA FTTP Customer Site Installation % £40m - - - - - - - - - - - 173.45 - -GEA FTTC Provisions % £43m - - - - - - 11.08 11.08 - - - - - -GEA FTTP Provisions % £4m - - - - - - - - - - - 19.33 - -GEA FTTP Repairs % £3m - - 6.39 6.39 0.41 0.00 - - - - - - - -GEA FTTC Repairs % £19m 1.49 1.49 - - 1.39 1.49 - - - - - - - -GEA DSLAM Cabinets % £129m 9.91 9.91 - - 9.28 9.91 - - - - - - - -NGA Visit Assure % £58m - - - - - - - - - - - - - -NGA E side Copper cable £/line 8.37 8.37 8.37 - - 7.83 8.37 - - - - - - - -Routeing & Records £/line 3.03 - - - - - - 3.03 3.03 3.03 3.03 3.03 3.03 - -FTTC Funded Fibre Rollout Spend % £171m 13.14 13.14 - - 12.31 13.14 - - - - - - - -FTTP Funded Fibre Rollout Spend % £59m - - 144.14 144.14 9.16 0.02 - - - - - - - -FTTC Fibre Rollout Funding % £(42)m (3.20) (3.20) - - (3.00) (3.20) - - - - - - - -FTTP Fibre Rollout Funding % £(16)m - - (38.74) (38.74) (2.46) (0.00) - - - - - - - -FTTC Development % £11m 0.61 0.61 - - 0.57 0.61 0.61 0.61 0.61 0.61 - - - -FTTP Development % £26m - - 40.75 40.75 2.59 0.00 - - - - - 40.75 - -Co-mingling power & vent % £68m - - - - - - - - - - - - - -Co-mingling rentals £/hostels 29.82 - - - - - - - - - - - - - -Co-mingling set up £/rooms 1,491.87 - - - - - - - - - - - - - -WLA tie cables £/cables 19.64 - - - - - - - - - - - - - -MDF Hardware jumpering £/line 16.12 - - - - - - - - - - - - - -Sub Total 37.98 37.98 699.21 699.21 79.99 38.06 56.69 56.69 3.64 3.64 3.03 236.56 534.69 534.69

Section 7 – Review of Wholesale Local Access Markets
Page 58
WLA calculation of FAC based on component costs and usage factors (continued)Restated for the year ended 31 March 2020 (b)
GEA
FTT
C 4
0/10
R
enta
ls
GEA
Oth
er 4
0/10
R
enta
ls
GEA
Oth
er
Ban
dwid
th
Ren
tals
GEA
FTT
C 4
0/10
P
CP
Onl
y In
stal
l
GEA
FTT
C 4
0/10
P
CP
Sta
rt o
f St
oppe
d Li
ne
GEA
FTT
P 4
0/10
C
onne
ctio
ns
Voi
ce a
nd D
ata
GEA
FTT
P 4
0/10
C
onne
ctio
ns
Tran
sitio
ns
GEA
Cab
lelin
k 1
Gbp
s C
onne
ctio
ns
Ave
rage
cos
t per
uni
t A
ppen
dix
1.2
Internal External Internal External Internal External Internal External Internal External Internal Internal Internal ExternalFully Allocated Cost (£ or %) £ £ £ £ £ £ £ £ £ £ £ £ £ £ Components Unit (a) MPF line testing systems £/line 1.45 - - - - - - - - - - - - - -Cumulo Rates Non NGA - Openreach % £157m - - - - - - - - - - - - - -Cumulo Rates NGA % £122m 5.66 5.66 120.31 120.31 12.94 5.67 0.04 0.04 0.01 0.01 0.01 0.14 0.12 0.12E side copper current £/line 3.60 - - - - - - - - - - - - - -E side copper capital £/line 4.21 - - - - - - - - - - - - - -D side copper current £/line 10.69 - - - - - - - - - - - - - -D side copper capital £/line 18.37 - - - - - - - - - - - - - -Analogue line drop maintenance £/line 2.77 - - - - - - - - - - - - - -Dropwire capital & analogue NTE £/line 16.40 - - - - - - - - - - - - - -Analogue line test equipment £/line 0.07 - - - - - - - - - - - - - -Local exchanges general frames maintenance £/line 1.28 - - - - - - - - - - - - - -Local exchanges general frames equipment £/line 1.20 - - - - - - - - - - - - - -Abortive Visits £/trans 59.94 - - - - - - - - - - - - - -OR Service Centre - Assurance GEA % £9m 0.57 0.57 0.57 0.57 0.57 0.57 - - - - - - - -OR Service Centre - Assurance WLA % £16m - - - - - - - - - - - - - -OR Service Centre - Provision GEA % £39m - - - - - - 2.85 2.85 2.85 2.85 2.85 2.85 2.85 2.85OR Service Centre - Provision WLA % £17m - - - - - - - - - - - - - -Openreach time related charges % £63m - - - - - - - - - - - - - -Openreach sales product management % £14m 0.02 0.02 0.05 0.05 0.03 0.03 0.02 0.02 0.00 0.00 0.04 0.02 0.20 0.20Special Fault Investigation % £41m - - - - - - - - - - - - - -Ofcom Administration Fee Openreach % £3m 0.04 0.04 0.08 0.09 0.05 0.04 0.03 0.03 0.00 0.00 0.06 0.03 0.31 0.31SLG WLA Internal % £25m 0.57 - 1.25 - 0.78 - 5.07 - 0.33 - 10.40 5.78 57.56 -SLG WLA External % £20m - 0.45 - 1.10 - 0.53 - 4.19 - 0.42 - - - 45.77PIMR Costs % £605m 2.84 2.84 93.33 93.33 8.59 2.85 - - - - - - - -Revenue Receivables % £43m 0.37 0.37 0.81 0.90 0.51 0.43 0.24 0.25 0.02 0.03 0.50 0.28 2.77 2.77Rounding (0.02) (0.01) (0.01) - - (0.01) - - (0.01) (0.01) (0.02) - - -Fully Allocated Cost (£ or %) 48.03 47.92 915.60 915.56 103.46 48.17 64.94 64.07 6.84 6.94 16.87 245.66 598.50 586.71
Volume (units) 1,475,598 3,430,694 48,186 51 5,626,583 2,744,488 547,318 962,566 68,770 117,304 19,067 18,478 3,837 6,182
Fully Allocated Cost (£m) 70.9 164.4 44.1 0.0 582.1 132.2 35.5 61.7 0.5 0.8 0.3 4.5 2.3 3.6

Section 7 – Review of Wholesale Local Access Markets
Page 59
WLA calculation of FAC based on component costs and usage factors (continued)Restated for the year ended 31 March 2020 (b)
GEA
Cab
lelin
k 10
G
bps
Con
nect
ions
GEA
Ban
dwid
th
Mod
ify to
40/
10
GEA
VLA
N M
oves
A
pplie
d to
C
able
link
GEA
40/
10
Can
cel/
Am
end/
Mod
ify -
CR
D
GEA
40/
10
Can
cel/
Am
end/
Mod
ify -
R
egra
des
GEA
CP
to C
P
Mig
ratio
ns
GEA
Sup
erfa
st
Vis
it A
ssur
e
MP
F R
enta
ls
(SM
L1)
Ave
rage
cos
t per
uni
t A
ppen
dix
1.2
Internal External Internal External Internal External Internal External Internal External Internal External Internal External Internal ExternalFully Allocated Cost (£ or %) £ £ £ £ £ £ £ £ £ £ £ £ £ £ £ £ Components Unit (a) GEA Cable Links £/conn 826.16 826.16 826.16 - - - - - - - - - - - - - -GEA FTTC Distribution Fibre Spine £/rental 4.80 - - - - - - - - - - - - - - - -GEA FTTP Distribution Fibre Spine £/rental 341.82 - - - - - - - - - - - - - - - -GEA FTTC Access Fibre Spine £/rental 1.56 - - - - - - - - - - - - - - - -GEA FTTP Access Fibre Spine £/rental 161.18 - - - - - - - - - - - - - - - -GEA FTTC Electronics £/rental 1.30 - - - - - - - - - - - - - - - -GEA FTTP Electronics £/rental 43.67 - - - - - - - - - - - - - - - -GEA FTTC Customer Site Electronics % £163m - - - - - - - - - - - - - - - -GEA FTTP Customer Site Installation % £40m - - - - - - - - - - - - - - - -GEA FTTC Provisions % £43m - - - - - - - - - - - - - - - -GEA FTTP Provisions % £4m - - - - - - - - - - - - - - - -GEA FTTP Repairs % £3m - - - - - - - - - - - - - - - -GEA FTTC Repairs % £19m - - - - - - - - - - - - - - - -GEA DSLAM Cabinets % £129m - - - - - - - - - - - - - - - -NGA Visit Assure % £58m - - - - - - - - - - - - 161.30 161.30 - -NGA E side Copper cable £/line 8.37 - - - - - - - - - - - - - - - -Routeing & Records £/line 3.03 - - - - - - - - - - 3.03 3.03 - - - -FTTC Funded Fibre Rollout Spend % £171m - - - - - - - - - - - - - - - -FTTP Funded Fibre Rollout Spend % £59m - - - - - - - - - - - - - - - -FTTC Fibre Rollout Funding % £(42)m - - - - - - - - - - - - - - - -FTTP Fibre Rollout Funding % £(16)m - - - - - - - - - - - - - - - -FTTC Development % £11m - - - - - - - - - - 0.61 0.61 - - - -FTTP Development % £26m - - - - - - - - - - - - - - - -Co-mingling power & vent % £68m - - - - - - - - - - - - - - - -Co-mingling rentals £/hostels 29.82 - - - - - - - - - - - - - - - -Co-mingling set up £/rooms 1,491.87 - - - - - - - - - - - - - - - -WLA tie cables £/cables 19.64 - - - - - - - - - - - - - - - -MDF Hardware jumpering £/line 16.12 - - - - - - - - - - - - - - - -Sub Total 826.16 826.16 - - - - - - - - 3.64 3.64 161.30 161.30 - -
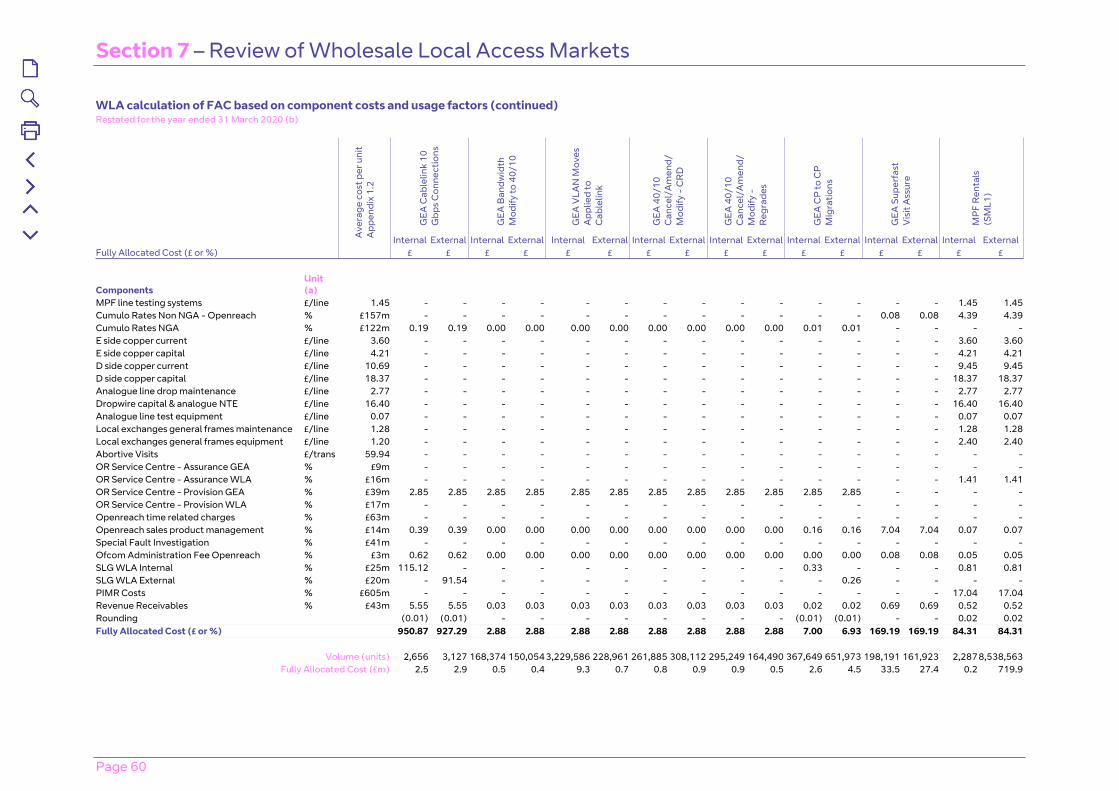
Section 7 – Review of Wholesale Local Access Markets
Page 60
WLA calculation of FAC based on component costs and usage factors (continued)Restated for the year ended 31 March 2020 (b)
GEA
Cab
lelin
k 10
G
bps
Con
nect
ions
GEA
Ban
dwid
th
Mod
ify to
40/
10
GEA
VLA
N M
oves
A
pplie
d to
C
able
link
GEA
40/
10
Can
cel/
Am
end/
Mod
ify -
CR
D
GEA
40/
10
Can
cel/
Am
end/
Mod
ify -
R
egra
des
GEA
CP
to C
P
Mig
ratio
ns
GEA
Sup
erfa
st
Vis
it A
ssur
e
MP
F R
enta
ls
(SM
L1)
Ave
rage
cos
t per
uni
t A
ppen
dix
1.2
Internal External Internal External Internal External Internal External Internal External Internal External Internal External Internal ExternalFully Allocated Cost (£ or %) £ £ £ £ £ £ £ £ £ £ £ £ £ £ £ £
ComponentsUnit (a)
MPF line testing systems £/line 1.45 - - - - - - - - - - - - - - 1.45 1.45Cumulo Rates Non NGA - Openreach % £157m - - - - - - - - - - - - 0.08 0.08 4.39 4.39Cumulo Rates NGA % £122m 0.19 0.19 0.00 0.00 0.00 0.00 0.00 0.00 0.00 0.00 0.01 0.01 - - - -E side copper current £/line 3.60 - - - - - - - - - - - - - - 3.60 3.60E side copper capital £/line 4.21 - - - - - - - - - - - - - - 4.21 4.21D side copper current £/line 10.69 - - - - - - - - - - - - - - 9.45 9.45D side copper capital £/line 18.37 - - - - - - - - - - - - - - 18.37 18.37Analogue line drop maintenance £/line 2.77 - - - - - - - - - - - - - - 2.77 2.77Dropwire capital & analogue NTE £/line 16.40 - - - - - - - - - - - - - - 16.40 16.40Analogue line test equipment £/line 0.07 - - - - - - - - - - - - - - 0.07 0.07Local exchanges general frames maintenance £/line 1.28 - - - - - - - - - - - - - - 1.28 1.28Local exchanges general frames equipment £/line 1.20 - - - - - - - - - - - - - - 2.40 2.40Abortive Visits £/trans 59.94 - - - - - - - - - - - - - - - -OR Service Centre - Assurance GEA % £9m - - - - - - - - - - - - - - - -OR Service Centre - Assurance WLA % £16m - - - - - - - - - - - - - - 1.41 1.41OR Service Centre - Provision GEA % £39m 2.85 2.85 2.85 2.85 2.85 2.85 2.85 2.85 2.85 2.85 2.85 2.85 - - - -OR Service Centre - Provision WLA % £17m - - - - - - - - - - - - - - - -Openreach time related charges % £63m - - - - - - - - - - - - - - - -Openreach sales product management % £14m 0.39 0.39 0.00 0.00 0.00 0.00 0.00 0.00 0.00 0.00 0.16 0.16 7.04 7.04 0.07 0.07Special Fault Investigation % £41m - - - - - - - - - - - - - - - -Ofcom Administration Fee Openreach % £3m 0.62 0.62 0.00 0.00 0.00 0.00 0.00 0.00 0.00 0.00 0.00 0.00 0.08 0.08 0.05 0.05SLG WLA Internal % £25m 115.12 - - - - - - - - - 0.33 - - - 0.81 0.81SLG WLA External % £20m - 91.54 - - - - - - - - - 0.26 - - - -PIMR Costs % £605m - - - - - - - - - - - - - - 17.04 17.04Revenue Receivables % £43m 5.55 5.55 0.03 0.03 0.03 0.03 0.03 0.03 0.03 0.03 0.02 0.02 0.69 0.69 0.52 0.52Rounding (0.01) (0.01) - - - - - - - - (0.01) (0.01) - - 0.02 0.02Fully Allocated Cost (£ or %) 950.87 927.29 2.88 2.88 2.88 2.88 2.88 2.88 2.88 2.88 7.00 6.93 169.19 169.19 84.31 84.31
Volume (units) 2,656 3,127 168,374 150,054 3,229,586 228,961 261,885 308,112 295,249 164,490 367,649 651,973 198,191 161,923 2,287 8,538,563
Fully Allocated Cost (£m) 2.5 2.9 0.5 0.4 9.3 0.7 0.8 0.9 0.9 0.5 2.6 4.5 33.5 27.4 0.2 719.9
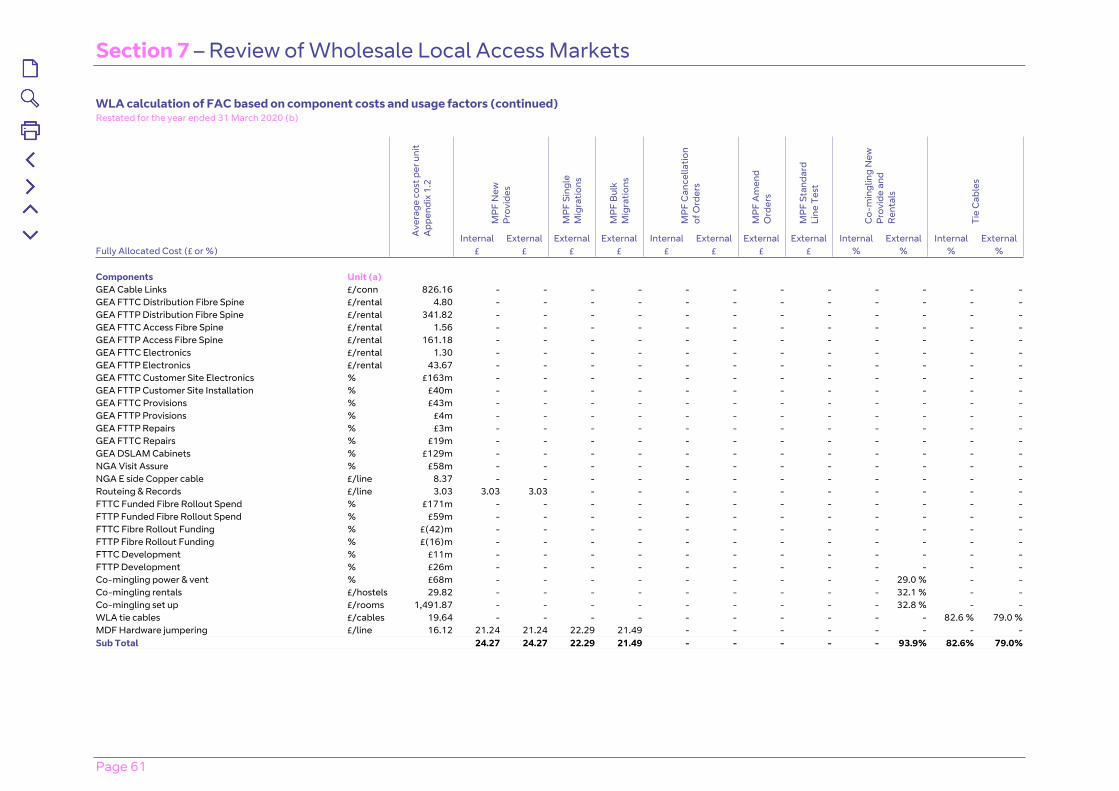
Section 7 – Review of Wholesale Local Access Markets
Page 61
WLA calculation of FAC based on component costs and usage factors (continued)Restated for the year ended 31 March 2020 (b)
MP
F N
ew
Pro
vide
s
MP
F Si
ngle
M
igra
tions
MP
F B
ulk
Mig
ratio
ns
MP
F C
ance
llatio
n of
Ord
ers
MP
F A
men
d O
rder
s
MP
F St
anda
rd
Line
Tes
t
Co-
min
glin
g N
ew
Pro
vide
and
R
enta
ls
Tie
Cab
les
Ave
rage
cos
t per
uni
t A
ppen
dix
1.2
Internal External External External Internal External External External Internal External Internal ExternalFully Allocated Cost (£ or %) £ £ £ £ £ £ £ £ % % % % Components Unit (a) GEA Cable Links £/conn 826.16 - - - - - - - - - - - -GEA FTTC Distribution Fibre Spine £/rental 4.80 - - - - - - - - - - - -GEA FTTP Distribution Fibre Spine £/rental 341.82 - - - - - - - - - - - -GEA FTTC Access Fibre Spine £/rental 1.56 - - - - - - - - - - - -GEA FTTP Access Fibre Spine £/rental 161.18 - - - - - - - - - - - -GEA FTTC Electronics £/rental 1.30 - - - - - - - - - - - -GEA FTTP Electronics £/rental 43.67 - - - - - - - - - - - -GEA FTTC Customer Site Electronics % £163m - - - - - - - - - - - -GEA FTTP Customer Site Installation % £40m - - - - - - - - - - - -GEA FTTC Provisions % £43m - - - - - - - - - - - -GEA FTTP Provisions % £4m - - - - - - - - - - - -GEA FTTP Repairs % £3m - - - - - - - - - - - -GEA FTTC Repairs % £19m - - - - - - - - - - - -GEA DSLAM Cabinets % £129m - - - - - - - - - - - -NGA Visit Assure % £58m - - - - - - - - - - - -NGA E side Copper cable £/line 8.37 - - - - - - - - - - - -Routeing & Records £/line 3.03 3.03 3.03 - - - - - - - - - -FTTC Funded Fibre Rollout Spend % £171m - - - - - - - - - - - -FTTP Funded Fibre Rollout Spend % £59m - - - - - - - - - - - -FTTC Fibre Rollout Funding % £(42)m - - - - - - - - - - - -FTTP Fibre Rollout Funding % £(16)m - - - - - - - - - - - -FTTC Development % £11m - - - - - - - - - - - -FTTP Development % £26m - - - - - - - - - - - -Co-mingling power & vent % £68m - - - - - - - - - 29.0 % - -Co-mingling rentals £/hostels 29.82 - - - - - - - - - 32.1 % - -Co-mingling set up £/rooms 1,491.87 - - - - - - - - - 32.8 % - -WLA tie cables £/cables 19.64 - - - - - - - - - - 82.6 % 79.0 %MDF Hardware jumpering £/line 16.12 21.24 21.24 22.29 21.49 - - - - - - - -Sub Total 24.27 24.27 22.29 21.49 - - - - - 93.9% 82.6% 79.0%
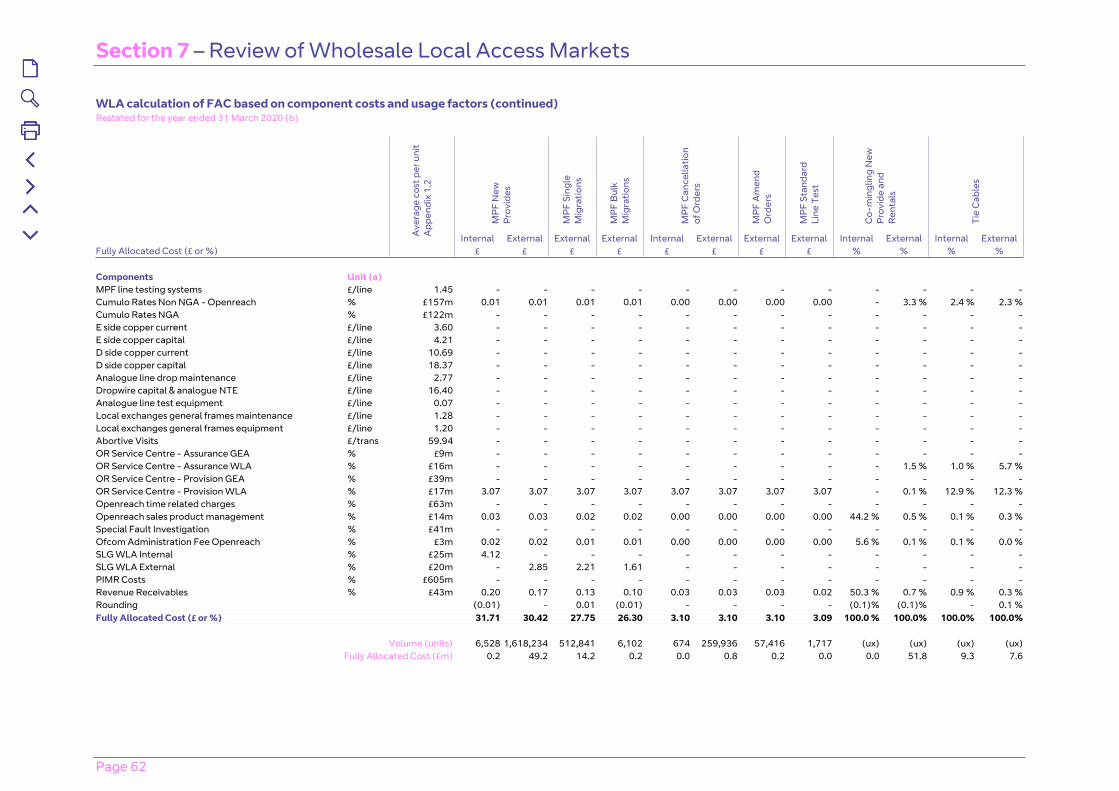
Section 7 – Review of Wholesale Local Access Markets
Page 62
WLA calculation of FAC based on component costs and usage factors (continued)Restated for the year ended 31 March 2020 (b)
MP
F N
ew
Pro
vide
s
MP
F Si
ngle
M
igra
tions
MP
F B
ulk
Mig
ratio
ns
MP
F C
ance
llatio
n of
Ord
ers
MP
F A
men
d O
rder
s
MP
F St
anda
rd
Line
Tes
t
Co-
min
glin
g N
ew
Pro
vide
and
R
enta
ls
Tie
Cab
les
Ave
rage
cos
t per
uni
t A
ppen
dix
1.2
Internal External External External Internal External External External Internal External Internal ExternalFully Allocated Cost (£ or %) £ £ £ £ £ £ £ £ % % % % Components Unit (a) MPF line testing systems £/line 1.45 - - - - - - - - - - - -Cumulo Rates Non NGA - Openreach % £157m 0.01 0.01 0.01 0.01 0.00 0.00 0.00 0.00 - 3.3 % 2.4 % 2.3 %Cumulo Rates NGA % £122m - - - - - - - - - - - -E side copper current £/line 3.60 - - - - - - - - - - - -E side copper capital £/line 4.21 - - - - - - - - - - - -D side copper current £/line 10.69 - - - - - - - - - - - -D side copper capital £/line 18.37 - - - - - - - - - - - -Analogue line drop maintenance £/line 2.77 - - - - - - - - - - - -Dropwire capital & analogue NTE £/line 16.40 - - - - - - - - - - - -Analogue line test equipment £/line 0.07 - - - - - - - - - - - -Local exchanges general frames maintenance £/line 1.28 - - - - - - - - - - - -Local exchanges general frames equipment £/line 1.20 - - - - - - - - - - - -Abortive Visits £/trans 59.94 - - - - - - - - - - - -OR Service Centre - Assurance GEA % £9m - - - - - - - - - - - -OR Service Centre - Assurance WLA % £16m - - - - - - - - - 1.5 % 1.0 % 5.7 %OR Service Centre - Provision GEA % £39m - - - - - - - - - - - -OR Service Centre - Provision WLA % £17m 3.07 3.07 3.07 3.07 3.07 3.07 3.07 3.07 - 0.1 % 12.9 % 12.3 %Openreach time related charges % £63m - - - - - - - - - - - -Openreach sales product management % £14m 0.03 0.03 0.02 0.02 0.00 0.00 0.00 0.00 44.2 % 0.5 % 0.1 % 0.3 %Special Fault Investigation % £41m - - - - - - - - - - - -Ofcom Administration Fee Openreach % £3m 0.02 0.02 0.01 0.01 0.00 0.00 0.00 0.00 5.6 % 0.1 % 0.1 % 0.0 %SLG WLA Internal % £25m 4.12 - - - - - - - - - - -SLG WLA External % £20m - 2.85 2.21 1.61 - - - - - - - -PIMR Costs % £605m - - - - - - - - - - - -Revenue Receivables % £43m 0.20 0.17 0.13 0.10 0.03 0.03 0.03 0.02 50.3 % 0.7 % 0.9 % 0.3 %Rounding (0.01) - 0.01 (0.01) - - - - (0.1)% (0.1)% - 0.1 %Fully Allocated Cost (£ or %) 31.71 30.42 27.75 26.30 3.10 3.10 3.10 3.09 100.0 % 100.0% 100.0% 100.0%
Volume (units) 6,528 1,618,234 512,841 6,102 674 259,936 57,416 1,717 (ux) (ux) (ux) (ux)
Fully Allocated Cost (£m) 0.2 49.2 14.2 0.2 0.0 0.8 0.2 0.0 0.0 51.8 9.3 7.6

Section 7 – Review of Wholesale Local Access Markets
Page 63
WLA calculation of FAC based on component costs and usage factors (continued)Restated for the year ended 31 March 2020 (b)
Har
d C
ease
s
Oth
er M
PF
Anc
illar
ies
Spec
ial F
ault
In
vest
igat
ions
Tim
e R
elat
ed
Cha
rges
Abo
rtiv
e V
isit
Cha
rges
Ave
rage
cos
t per
uni
t A
ppen
dix
1.2
Internal External Internal External Internal External Internal External Internal ExternalFully Allocated Cost (£ or %) £ £ £ £ % % % % £ £ Components Unit (a) GEA Cable Links £/conn 826.16 - - - - - - - - - -GEA FTTC Distribution Fibre Spine £/rental 4.80 - - - - - - - - - -GEA FTTP Distribution Fibre Spine £/rental 341.82 - - - - - - - - - -GEA FTTC Access Fibre Spine £/rental 1.56 - - - - - - - - - -GEA FTTP Access Fibre Spine £/rental 161.18 - - - - - - - - - -GEA FTTC Electronics £/rental 1.30 - - - - - - - - - -GEA FTTP Electronics £/rental 43.67 - - - - - - - - - -GEA FTTC Customer Site Electronics % £163m - - - - - - - - - -GEA FTTP Customer Site Installation % £40m - - - - - - - - - -GEA FTTC Provisions % £43m - - - - - - - - - -GEA FTTP Provisions % £4m - - - - - - - - - -GEA FTTP Repairs % £3m - - - - - - - - - -GEA FTTC Repairs % £19m - - - - - - - - - -GEA DSLAM Cabinets % £129m - - - - - - - - - -NGA Visit Assure % £58m - - - - - - - - - -NGA E side Copper cable £/line 8.37 - - - - - - - - - -Routeing & Records £/line 3.03 - - - - - - - - - -FTTC Funded Fibre Rollout Spend % £171m - - - - - - - - - -FTTP Funded Fibre Rollout Spend % £59m - - - - - - - - - -FTTC Fibre Rollout Funding % £(42)m - - - - - - - - - -FTTP Fibre Rollout Funding % £(16)m - - - - - - - - - -FTTC Development % £11m - - - - - - - - - -FTTP Development % £26m - - - - - - - - - -Co-mingling power & vent % £68m - - - - - - - - - -Co-mingling rentals £/hostels 29.82 - - - - - - - - - -Co-mingling set up £/rooms 1,491.87 - - - - - - - - - -WLA tie cables £/cables 19.64 - - - - - - - - - -MDF Hardware jumpering £/line 16.12 12.07 12.04 11.93 11.93 - - - - - -Sub Total 12.07 12.04 11.93 11.93 - - - - - -
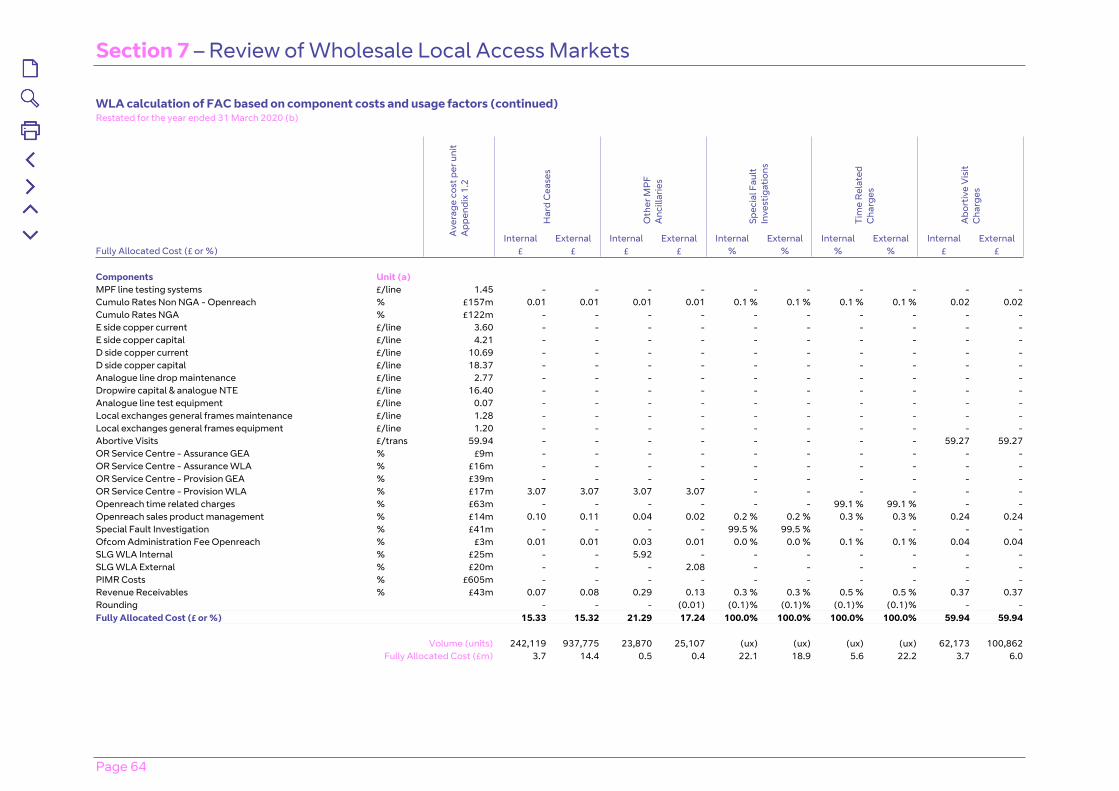
Section 7 – Review of Wholesale Local Access Markets
Page 64
WLA calculation of FAC based on component costs and usage factors (continued)Restated for the year ended 31 March 2020 (b)
Har
d C
ease
s
Oth
er M
PF
Anc
illar
ies
Spec
ial F
ault
In
vest
igat
ions
Tim
e R
elat
ed
Cha
rges
Abo
rtiv
e V
isit
Cha
rges
Ave
rage
cos
t per
uni
t A
ppen
dix
1.2
Internal External Internal External Internal External Internal External Internal ExternalFully Allocated Cost (£ or %) £ £ £ £ % % % % £ £ Components Unit (a) MPF line testing systems £/line 1.45 - - - - - - - - - -Cumulo Rates Non NGA - Openreach % £157m 0.01 0.01 0.01 0.01 0.1 % 0.1 % 0.1 % 0.1 % 0.02 0.02Cumulo Rates NGA % £122m - - - - - - - - - -E side copper current £/line 3.60 - - - - - - - - - -E side copper capital £/line 4.21 - - - - - - - - - -D side copper current £/line 10.69 - - - - - - - - - -D side copper capital £/line 18.37 - - - - - - - - - -Analogue line drop maintenance £/line 2.77 - - - - - - - - - -Dropwire capital & analogue NTE £/line 16.40 - - - - - - - - - -Analogue line test equipment £/line 0.07 - - - - - - - - - -Local exchanges general frames maintenance £/line 1.28 - - - - - - - - - -Local exchanges general frames equipment £/line 1.20 - - - - - - - - - -Abortive Visits £/trans 59.94 - - - - - - - - 59.27 59.27OR Service Centre - Assurance GEA % £9m - - - - - - - - - -OR Service Centre - Assurance WLA % £16m - - - - - - - - - -OR Service Centre - Provision GEA % £39m - - - - - - - - - -OR Service Centre - Provision WLA % £17m 3.07 3.07 3.07 3.07 - - - - - -Openreach time related charges % £63m - - - - - - 99.1 % 99.1 % - -Openreach sales product management % £14m 0.10 0.11 0.04 0.02 0.2 % 0.2 % 0.3 % 0.3 % 0.24 0.24Special Fault Investigation % £41m - - - - 99.5 % 99.5 % - - - -Ofcom Administration Fee Openreach % £3m 0.01 0.01 0.03 0.01 0.0 % 0.0 % 0.1 % 0.1 % 0.04 0.04SLG WLA Internal % £25m - - 5.92 - - - - - - -SLG WLA External % £20m - - - 2.08 - - - - - -PIMR Costs % £605m - - - - - - - - - -Revenue Receivables % £43m 0.07 0.08 0.29 0.13 0.3 % 0.3 % 0.5 % 0.5 % 0.37 0.37Rounding - - - (0.01) (0.1)% (0.1)% (0.1)% (0.1)% - -Fully Allocated Cost (£ or %) 15.33 15.32 21.29 17.24 100.0% 100.0% 100.0% 100.0% 59.94 59.94
Volume (units) 242,119 937,775 23,870 25,107 (ux) (ux) (ux) (ux) 62,173 100,862
Fully Allocated Cost (£m) 3.7 14.4 0.5 0.4 22.1 18.9 5.6 22.2 3.7 6.0

Page 65
Section 8Review of Business Connectivity Markets
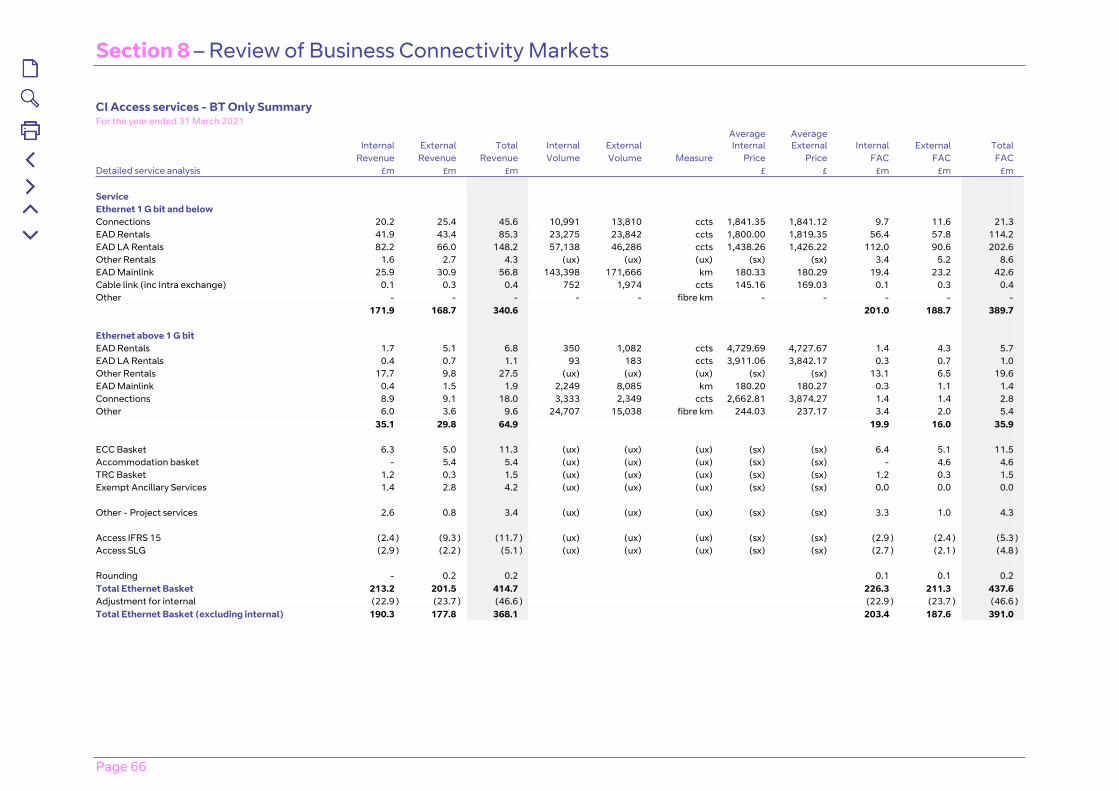
Section 8 – Review of Business Connectivity Markets
Page 66
CI Access services - BT Only Summary For the year ended 31 March 2021
Internal External Total Internal External Average Internal
Average External Internal External Total
Revenue Revenue Revenue Volume Volume Measure Price Price FAC FAC FAC Detailed service analysis £m £m £m £ £ £m £m £m Service Ethernet 1 G bit and below Connections 20.2 25.4 45.6 10,991 13,810 ccts 1,841.35 1,841.12 9.7 11.6 21.3 EAD Rentals 41.9 43.4 85.3 23,275 23,842 ccts 1,800.00 1,819.35 56.4 57.8 114.2 EAD LA Rentals 82.2 66.0 148.2 57,138 46,286 ccts 1,438.26 1,426.22 112.0 90.6 202.6 Other Rentals 1.6 2.7 4.3 (ux) (ux) (ux) (sx) (sx) 3.4 5.2 8.6 EAD Mainlink 25.9 30.9 56.8 143,398 171,666 km 180.33 180.29 19.4 23.2 42.6 Cable link (inc Intra exchange) 0.1 0.3 0.4 752 1,974 ccts 145.16 169.03 0.1 0.3 0.4 Other - - - - - fibre km - - - - - 171.9 168.7 340.6 201.0 188.7 389.7 Ethernet above 1 G bit EAD Rentals 1.7 5.1 6.8 350 1,082 ccts 4,729.69 4,727.67 1.4 4.3 5.7 EAD LA Rentals 0.4 0.7 1.1 93 183 ccts 3,911.06 3,842.17 0.3 0.7 1.0 Other Rentals 17.7 9.8 27.5 (ux) (ux) (ux) (sx) (sx) 13.1 6.5 19.6 EAD Mainlink 0.4 1.5 1.9 2,249 8,085 km 180.20 180.27 0.3 1.1 1.4 Connections 8.9 9.1 18.0 3,333 2,349 ccts 2,662.81 3,874.27 1.4 1.4 2.8 Other 6.0 3.6 9.6 24,707 15,038 fibre km 244.03 237.17 3.4 2.0 5.4 35.1 29.8 64.9 19.9 16.0 35.9 ECC Basket 6.3 5.0 11.3 (ux) (ux) (ux) (sx) (sx) 6.4 5.1 11.5 Accommodation basket - 5.4 5.4 (ux) (ux) (ux) (sx) (sx) - 4.6 4.6 TRC Basket 1.2 0.3 1.5 (ux) (ux) (ux) (sx) (sx) 1.2 0.3 1.5 Exempt Ancillary Services 1.4 2.8 4.2 (ux) (ux) (ux) (sx) (sx) 0.0 0.0 0.0 Other - Project services 2.6 0.8 3.4 (ux) (ux) (ux) (sx) (sx) 3.3 1.0 4.3 Access IFRS 15 (2.4 ) (9.3 ) (11.7 ) (ux) (ux) (ux) (sx) (sx) (2.9 ) (2.4 ) (5.3 )Access SLG (2.9 ) (2.2 ) (5.1 ) (ux) (ux) (ux) (sx) (sx) (2.7 ) (2.1 ) (4.8 ) Rounding - 0.2 0.2 0.1 0.1 0.2 Total Ethernet Basket 213.2 201.5 414.7 226.3 211.3 437.6 Adjustment for internal (22.9 ) (23.7 ) (46.6 ) (22.9 ) (23.7 ) (46.6 )Total Ethernet Basket (excluding internal) 190.3 177.8 368.1 203.4 187.6 391.0
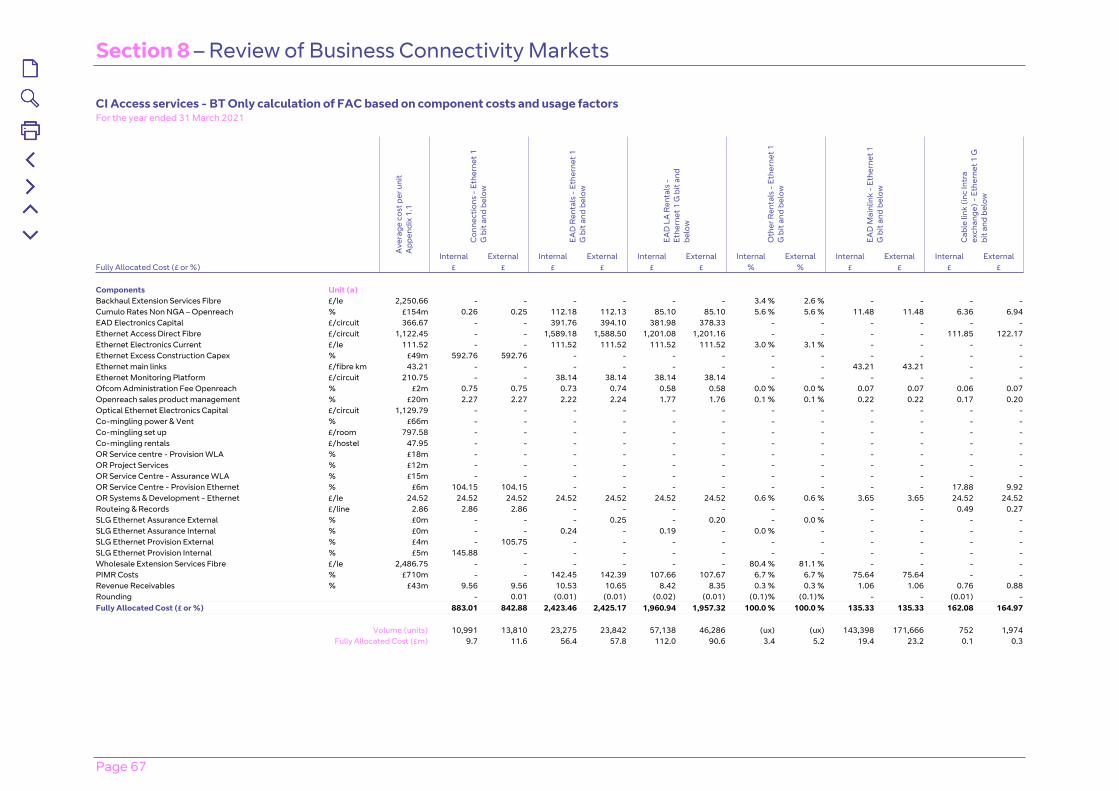
Section 8 – Review of Business Connectivity Markets
Page 67
CI Access services - BT Only calculation of FAC based on component costs and usage factors For the year ended 31 March 2021
Con
nect
ions
- E
ther
net 1
G
bit
and
belo
w
EAD
Ren
tals
- E
ther
net 1
G
bit
and
belo
w
EAD
LA
Ren
tals
-
Ethe
rnet
1 G
bit
and
belo
w
Oth
er R
enta
ls -
Eth
erne
t 1
G b
it an
d be
low
EAD
Mai
nlin
k -
Ethe
rnet
1
G b
it an
d be
low
Cab
le li
nk (i
nc In
tra
exch
ange
) - E
ther
net 1
G
bit a
nd b
elow
Ave
rage
cos
t per
uni
t A
ppen
dix
1.1
Internal External Internal External Internal External Internal External Internal External Internal ExternalFully Allocated Cost (£ or %) £ £ £ £ £ £ % % £ £ £ £ Components Unit (a) Backhaul Extension Services Fibre £/le 2,250.66 - - - - - - 3.4 % 2.6 % - - - -Cumulo Rates Non NGA – Openreach % £154m 0.26 0.25 112.18 112.13 85.10 85.10 5.6 % 5.6 % 11.48 11.48 6.36 6.94EAD Electronics Capital £/circuit 366.67 - - 391.76 394.10 381.98 378.33 - - - - - -Ethernet Access Direct Fibre £/circuit 1,122.45 - - 1,589.18 1,588.50 1,201.08 1,201.16 - - - - 111.85 122.17Ethernet Electronics Current £/le 111.52 - - 111.52 111.52 111.52 111.52 3.0 % 3.1 % - - - -Ethernet Excess Construction Capex % £49m 592.76 592.76 - - - - - - - - - -Ethernet main links £/fibre km 43.21 - - - - - - - - 43.21 43.21 - -Ethernet Monitoring Platform £/circuit 210.75 - - 38.14 38.14 38.14 38.14 - - - - - -Ofcom Administration Fee Openreach % £2m 0.75 0.75 0.73 0.74 0.58 0.58 0.0 % 0.0 % 0.07 0.07 0.06 0.07Openreach sales product management % £20m 2.27 2.27 2.22 2.24 1.77 1.76 0.1 % 0.1 % 0.22 0.22 0.17 0.20Optical Ethernet Electronics Capital £/circuit 1,129.79 - - - - - - - - - - - -Co-mingling power & Vent % £66m - - - - - - - - - - - -Co-mingling set up £/room 797.58 - - - - - - - - - - - -Co-mingling rentals £/hostel 47.95 - - - - - - - - - - - -OR Service centre - Provision WLA % £18m - - - - - - - - - - - -OR Project Services % £12m - - - - - - - - - - - -OR Service Centre - Assurance WLA % £15m - - - - - - - - - - - -OR Service Centre - Provision Ethernet % £6m 104.15 104.15 - - - - - - - - 17.88 9.92OR Systems & Development - Ethernet £/le 24.52 24.52 24.52 24.52 24.52 24.52 24.52 0.6 % 0.6 % 3.65 3.65 24.52 24.52Routeing & Records £/line 2.86 2.86 2.86 - - - - - - - - 0.49 0.27SLG Ethernet Assurance External % £0m - - - 0.25 - 0.20 - 0.0 % - - - -SLG Ethernet Assurance Internal % £0m - - 0.24 - 0.19 - 0.0 % - - - - -SLG Ethernet Provision External % £4m - 105.75 - - - - - - - - - -SLG Ethernet Provision Internal % £5m 145.88 - - - - - - - - - - -Wholesale Extension Services Fibre £/le 2,486.75 - - - - - - 80.4 % 81.1 % - - - -PIMR Costs % £710m - - 142.45 142.39 107.66 107.67 6.7 % 6.7 % 75.64 75.64 - -Revenue Receivables % £43m 9.56 9.56 10.53 10.65 8.42 8.35 0.3 % 0.3 % 1.06 1.06 0.76 0.88Rounding - 0.01 (0.01) (0.01) (0.02) (0.01) (0.1)% (0.1)% - - (0.01) -Fully Allocated Cost (£ or %) 883.01 842.88 2,423.46 2,425.17 1,960.94 1,957.32 100.0 % 100.0 % 135.33 135.33 162.08 164.97
Volume (units) 10,991 13,810 23,275 23,842 57,138 46,286 (ux) (ux) 143,398 171,666 752 1,974Fully Allocated Cost (£m) 9.7 11.6 56.4 57.8 112.0 90.6 3.4 5.2 19.4 23.2 0.1 0.3
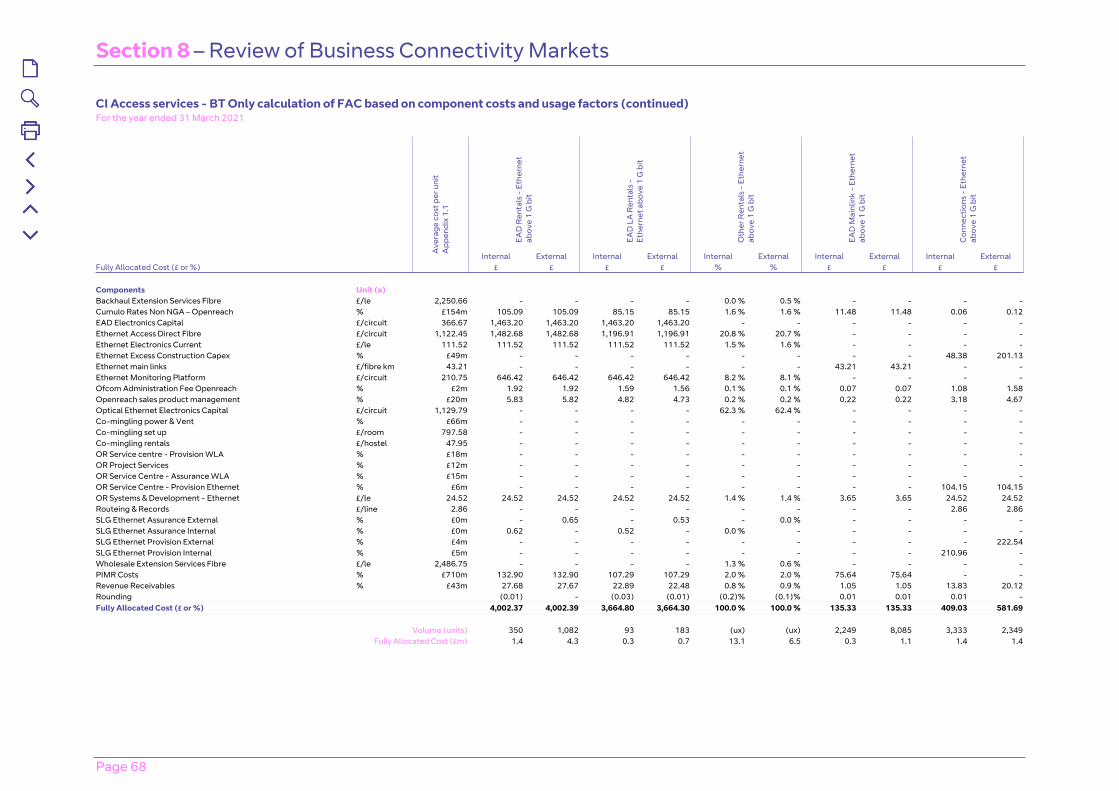
Section 8 – Review of Business Connectivity Markets
Page 68
CI Access services - BT Only calculation of FAC based on component costs and usage factors (continued)For the year ended 31 March 2021
EAD
Ren
tals
- E
ther
net
abov
e 1
G b
it
EAD
LA
Ren
tals
-
Ethe
rnet
abo
ve 1
G b
it
Oth
er R
enta
ls -
Eth
erne
t ab
ove
1 G
bit
EAD
Mai
nlin
k -
Ethe
rnet
ab
ove
1 G
bit
Con
nect
ions
- E
ther
net
abov
e 1
G b
it
Ave
rage
cos
t per
uni
t A
ppen
dix
1.1
Internal External Internal External Internal External Internal External Internal ExternalFully Allocated Cost (£ or %) £ £ £ £ % % £ £ £ £ Components Unit (a) Backhaul Extension Services Fibre £/le 2,250.66 - - - - 0.0 % 0.5 % - - - -Cumulo Rates Non NGA – Openreach % £154m 105.09 105.09 85.15 85.15 1.6 % 1.6 % 11.48 11.48 0.06 0.12EAD Electronics Capital £/circuit 366.67 1,463.20 1,463.20 1,463.20 1,463.20 - - - - - -Ethernet Access Direct Fibre £/circuit 1,122.45 1,482.68 1,482.68 1,196.91 1,196.91 20.8 % 20.7 % - - - -Ethernet Electronics Current £/le 111.52 111.52 111.52 111.52 111.52 1.5 % 1.6 % - - - -Ethernet Excess Construction Capex % £49m - - - - - - - - 48.38 201.13Ethernet main links £/fibre km 43.21 - - - - - - 43.21 43.21 - -Ethernet Monitoring Platform £/circuit 210.75 646.42 646.42 646.42 646.42 8.2 % 8.1 % - - - -Ofcom Administration Fee Openreach % £2m 1.92 1.92 1.59 1.56 0.1 % 0.1 % 0.07 0.07 1.08 1.58Openreach sales product management % £20m 5.83 5.82 4.82 4.73 0.2 % 0.2 % 0.22 0.22 3.18 4.67Optical Ethernet Electronics Capital £/circuit 1,129.79 - - - - 62.3 % 62.4 % - - - -Co-mingling power & Vent % £66m - - - - - - - - - -Co-mingling set up £/room 797.58 - - - - - - - - - -Co-mingling rentals £/hostel 47.95 - - - - - - - - - -OR Service centre - Provision WLA % £18m - - - - - - - - - -OR Project Services % £12m - - - - - - - - - -OR Service Centre - Assurance WLA % £15m - - - - - - - - - -OR Service Centre - Provision Ethernet % £6m - - - - - - - - 104.15 104.15OR Systems & Development - Ethernet £/le 24.52 24.52 24.52 24.52 24.52 1.4 % 1.4 % 3.65 3.65 24.52 24.52Routeing & Records £/line 2.86 - - - - - - - - 2.86 2.86SLG Ethernet Assurance External % £0m - 0.65 - 0.53 - 0.0 % - - - -SLG Ethernet Assurance Internal % £0m 0.62 - 0.52 - 0.0 % - - - - -SLG Ethernet Provision External % £4m - - - - - - - - - 222.54SLG Ethernet Provision Internal % £5m - - - - - - - - 210.96 -Wholesale Extension Services Fibre £/le 2,486.75 - - - - 1.3 % 0.6 % - - - -PIMR Costs % £710m 132.90 132.90 107.29 107.29 2.0 % 2.0 % 75.64 75.64 - -Revenue Receivables % £43m 27.68 27.67 22.89 22.48 0.8 % 0.9 % 1.05 1.05 13.83 20.12Rounding (0.01) - (0.03) (0.01) (0.2)% (0.1)% 0.01 0.01 0.01 -Fully Allocated Cost (£ or %) 4,002.37 4,002.39 3,664.80 3,664.30 100.0 % 100.0 % 135.33 135.33 409.03 581.69
Volume (units) 350 1,082 93 183 (ux) (ux) 2,249 8,085 3,333 2,349Fully Allocated Cost (£m) 1.4 4.3 0.3 0.7 13.1 6.5 0.3 1.1 1.4 1.4
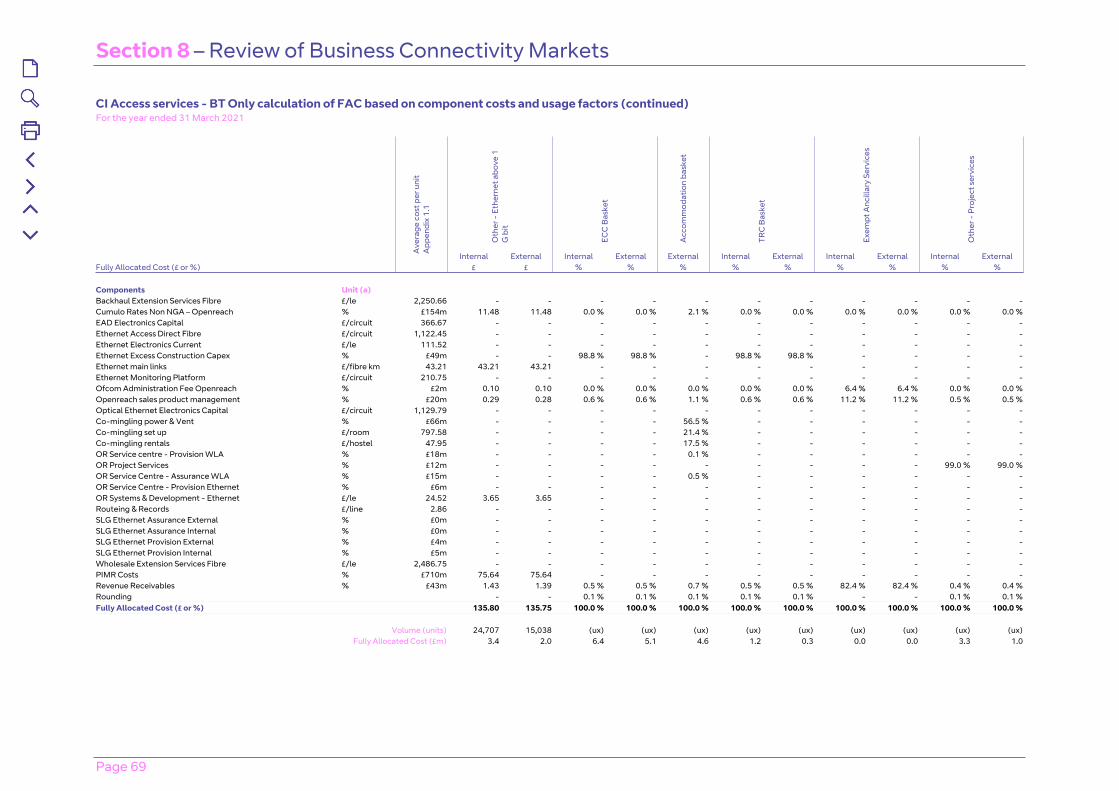
Section 8 – Review of Business Connectivity Markets
Page 69
CI Access services - BT Only calculation of FAC based on component costs and usage factors (continued)For the year ended 31 March 2021
Oth
er -
Eth
erne
t abo
ve 1
G
bit
ECC
Bas
ket
Acc
omm
odat
ion
bask
et
TRC
Bas
ket
Exem
pt A
ncill
ary
Serv
ices
Oth
er -
Pro
ject
ser
vice
s
Ave
rage
cos
t per
uni
t A
ppen
dix
1.1
Internal External Internal External External Internal External Internal External Internal ExternalFully Allocated Cost (£ or %) £ £ % % % % % % % % % Components Unit (a) Backhaul Extension Services Fibre £/le 2,250.66 - - - - - - - - - - -Cumulo Rates Non NGA – Openreach % £154m 11.48 11.48 0.0 % 0.0 % 2.1 % 0.0 % 0.0 % 0.0 % 0.0 % 0.0 % 0.0 %EAD Electronics Capital £/circuit 366.67 - - - - - - - - - - -Ethernet Access Direct Fibre £/circuit 1,122.45 - - - - - - - - - - -Ethernet Electronics Current £/le 111.52 - - - - - - - - - - -Ethernet Excess Construction Capex % £49m - - 98.8 % 98.8 % - 98.8 % 98.8 % - - - -Ethernet main links £/fibre km 43.21 43.21 43.21 - - - - - - - - -Ethernet Monitoring Platform £/circuit 210.75 - - - - - - - - - - -Ofcom Administration Fee Openreach % £2m 0.10 0.10 0.0 % 0.0 % 0.0 % 0.0 % 0.0 % 6.4 % 6.4 % 0.0 % 0.0 %Openreach sales product management % £20m 0.29 0.28 0.6 % 0.6 % 1.1 % 0.6 % 0.6 % 11.2 % 11.2 % 0.5 % 0.5 %Optical Ethernet Electronics Capital £/circuit 1,129.79 - - - - - - - - - - -Co-mingling power & Vent % £66m - - - - 56.5 % - - - - - -Co-mingling set up £/room 797.58 - - - - 21.4 % - - - - - -Co-mingling rentals £/hostel 47.95 - - - - 17.5 % - - - - - -OR Service centre - Provision WLA % £18m - - - - 0.1 % - - - - - -OR Project Services % £12m - - - - - - - - - 99.0 % 99.0 %OR Service Centre - Assurance WLA % £15m - - - - 0.5 % - - - - - -OR Service Centre - Provision Ethernet % £6m - - - - - - - - - - -OR Systems & Development - Ethernet £/le 24.52 3.65 3.65 - - - - - - - - -Routeing & Records £/line 2.86 - - - - - - - - - - -SLG Ethernet Assurance External % £0m - - - - - - - - - - -SLG Ethernet Assurance Internal % £0m - - - - - - - - - - -SLG Ethernet Provision External % £4m - - - - - - - - - - -SLG Ethernet Provision Internal % £5m - - - - - - - - - - -Wholesale Extension Services Fibre £/le 2,486.75 - - - - - - - - - - -PIMR Costs % £710m 75.64 75.64 - - - - - - - - -Revenue Receivables % £43m 1.43 1.39 0.5 % 0.5 % 0.7 % 0.5 % 0.5 % 82.4 % 82.4 % 0.4 % 0.4 %Rounding - - 0.1 % 0.1 % 0.1 % 0.1 % 0.1 % - - 0.1 % 0.1 %Fully Allocated Cost (£ or %) 135.80 135.75 100.0 % 100.0 % 100.0 % 100.0 % 100.0 % 100.0 % 100.0 % 100.0 % 100.0 %
Volume (units) 24,707 15,038 (ux) (ux) (ux) (ux) (ux) (ux) (ux) (ux) (ux)Fully Allocated Cost (£m) 3.4 2.0 6.4 5.1 4.6 1.2 0.3 0.0 0.0 3.3 1.0
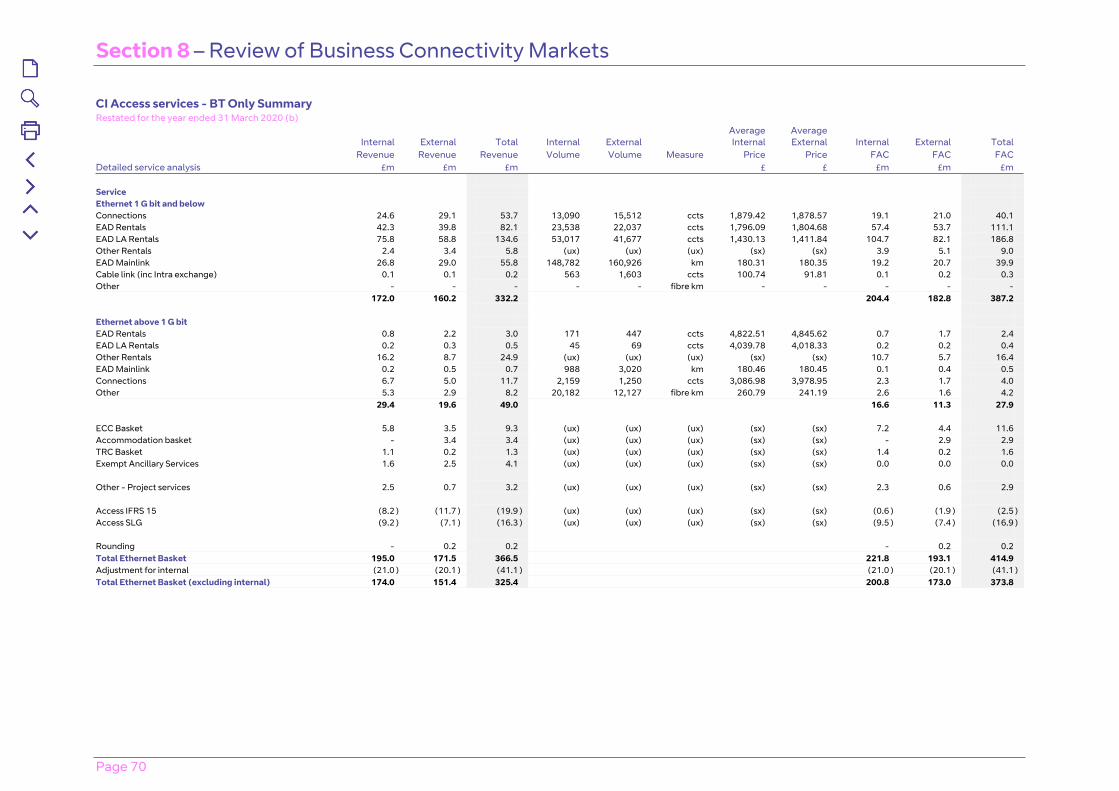
Section 8 – Review of Business Connectivity Markets
Page 70
CI Access services - BT Only Summary Restated for the year ended 31 March 2020 (b)
Internal External Total Internal External Average Internal
Average External Internal External Total
Revenue Revenue Revenue Volume Volume Measure Price Price FAC FAC FAC Detailed service analysis £m £m £m £ £ £m £m £m Service Ethernet 1 G bit and below Connections 24.6 29.1 53.7 13,090 15,512 ccts 1,879.42 1,878.57 19.1 21.0 40.1 EAD Rentals 42.3 39.8 82.1 23,538 22,037 ccts 1,796.09 1,804.68 57.4 53.7 111.1 EAD LA Rentals 75.8 58.8 134.6 53,017 41,677 ccts 1,430.13 1,411.84 104.7 82.1 186.8 Other Rentals 2.4 3.4 5.8 (ux) (ux) (ux) (sx) (sx) 3.9 5.1 9.0 EAD Mainlink 26.8 29.0 55.8 148,782 160,926 km 180.31 180.35 19.2 20.7 39.9 Cable link (inc Intra exchange) 0.1 0.1 0.2 563 1,603 ccts 100.74 91.81 0.1 0.2 0.3 Other - - - - - fibre km - - - - - 172.0 160.2 332.2 204.4 182.8 387.2 Ethernet above 1 G bit EAD Rentals 0.8 2.2 3.0 171 447 ccts 4,822.51 4,845.62 0.7 1.7 2.4 EAD LA Rentals 0.2 0.3 0.5 45 69 ccts 4,039.78 4,018.33 0.2 0.2 0.4 Other Rentals 16.2 8.7 24.9 (ux) (ux) (ux) (sx) (sx) 10.7 5.7 16.4 EAD Mainlink 0.2 0.5 0.7 988 3,020 km 180.46 180.45 0.1 0.4 0.5 Connections 6.7 5.0 11.7 2,159 1,250 ccts 3,086.98 3,978.95 2.3 1.7 4.0 Other 5.3 2.9 8.2 20,182 12,127 fibre km 260.79 241.19 2.6 1.6 4.2 29.4 19.6 49.0 16.6 11.3 27.9 ECC Basket 5.8 3.5 9.3 (ux) (ux) (ux) (sx) (sx) 7.2 4.4 11.6 Accommodation basket - 3.4 3.4 (ux) (ux) (ux) (sx) (sx) - 2.9 2.9 TRC Basket 1.1 0.2 1.3 (ux) (ux) (ux) (sx) (sx) 1.4 0.2 1.6 Exempt Ancillary Services 1.6 2.5 4.1 (ux) (ux) (ux) (sx) (sx) 0.0 0.0 0.0 Other - Project services 2.5 0.7 3.2 (ux) (ux) (ux) (sx) (sx) 2.3 0.6 2.9 Access IFRS 15 (8.2 ) (11.7 ) (19.9 ) (ux) (ux) (ux) (sx) (sx) (0.6 ) (1.9 ) (2.5 )Access SLG (9.2 ) (7.1 ) (16.3 ) (ux) (ux) (ux) (sx) (sx) (9.5 ) (7.4 ) (16.9 ) Rounding - 0.2 0.2 - 0.2 0.2 Total Ethernet Basket 195.0 171.5 366.5 221.8 193.1 414.9 Adjustment for internal (21.0 ) (20.1 ) (41.1 ) (21.0 ) (20.1 ) (41.1 )Total Ethernet Basket (excluding internal) 174.0 151.4 325.4 200.8 173.0 373.8

Section 8 – Review of Business Connectivity Markets
Page 71
CI Access services - BT Only calculation of FAC based on component costs and usage factors Restated for the year ended 31 March 2020 (b)
Con
nect
ions
- E
ther
net 1
G
bit
and
belo
w
EAD
Ren
tals
- E
ther
net 1
G
bit
and
belo
w
EAD
LA
Ren
tals
-
Ethe
rnet
1 G
bit
and
belo
w
Oth
er R
enta
ls -
Eth
erne
t 1
G b
it an
d be
low
EAD
Mai
nlin
k -
Ethe
rnet
1
G b
it an
d be
low
Cab
le li
nk (i
nc In
tra
exch
ange
) - E
ther
net 1
G
bit a
nd b
elow
Ave
rage
cos
t per
uni
t A
ppen
dix
1.2
Internal External Internal External Internal External Internal External Internal External Internal ExternalFully Allocated Cost (£ or %) £ £ £ £ £ £ % % £ £ £ £ Components Unit (a) Backhaul Extension Services Fibre £/le 1,430.50 - - - - - - 3.6 % 2.6 % - - - -Cumulo Rates Non NGA – Openreach % £157m 0.37 0.37 113.53 113.49 85.33 85.35 5.9 % 5.9 % 12.41 12.03 6.08 6.42EAD Electronics Capital £/circuit 434.89 - - 451.34 451.22 444.20 440.80 - - - - - -Ethernet Access Direct Fibre £/circuit 1,082.81 - - 1,542.40 1,541.85 1,153.81 1,153.94 - - - - 105.39 111.41Ethernet Electronics Current £/le 90.45 - - 90.45 90.45 90.45 90.45 3.3 % 3.3 % - - - -Ethernet Excess Construction Capex % £66m 811.00 811.00 - - - - - - - - - -Ethernet main links £/fibre km 41.77 - - - - - - - - 41.77 41.77 - -Ethernet Monitoring Platform £/circuit 301.55 - - 54.37 54.37 54.37 54.37 - - - - - -Ofcom Administration Fee Openreach % £3m 1.11 1.11 1.06 1.07 0.85 0.84 0.0 % 0.0 % 0.11 0.11 0.06 0.05Openreach sales product management % £14m 10.31 10.30 9.85 9.90 7.84 7.74 0.3 % 0.4 % 0.99 0.99 0.53 0.48Optical Ethernet Electronics Capital £/circuit 1,440.57 - - - - - - - - - - - -Co-mingling power & Vent % £68m - - - - - - - - - - - -Co-mingling set up £/room 1,491.87 - - - - - - - - - - - -Co-mingling rentals £/hostel 29.82 - - - - - - - - - - - -OR Service centre - Provision WLA % £17m - - - - - - - - - - - -OR Project Services % £8m - - - - - - - - - - - -OR Service Centre - Assurance WLA % £16m - - - - - - - - - - - -OR Service Centre - Provision Ethernet % £6m 88.61 88.61 - - - - - - - - 9.91 5.42OR Systems & Development - Ethernet £/le 24.07 24.07 24.07 24.07 24.07 24.07 24.07 0.8 % 0.8 % 3.62 3.62 24.07 24.07Routeing & Records £/line 3.03 3.03 3.03 - - - - - - - - 0.34 0.19SLG Ethernet Assurance External % £0m - - - 0.50 - 0.39 - 0.0 % - - - -SLG Ethernet Assurance Internal % £0m - - 0.48 - 0.38 - 0.0 % - - - - -SLG Ethernet Provision External % £15m - 404.84 - - - - - - - - - -SLG Ethernet Provision Internal % £20m 512.98 - - - - - - - - - - -Wholesale Extension Services Fibre £/le 1,792.70 - - - - - - 78.9 % 79.8 % - - - -PIMR Costs % £605m - - 139.35 139.30 104.25 104.26 6.8 % 6.8 % 69.26 69.26 - -Revenue Receivables % £43m 10.01 10.01 10.98 11.04 8.75 8.63 0.4 % 0.4 % 1.10 1.10 0.54 0.49Rounding 0.01 - 0.02 - - - - - (0.01) - - -Fully Allocated Cost (£ or %) 1,461.50 1,353.34 2,437.90 2,437.26 1,974.30 1,970.84 100.0 % 100.0 % 129.25 128.88 146.92 148.53
Volume (units) 13,090 15,512 23,538 22,037 53,017 41,677 (ux) (ux) 148,782 160,926 563 1,603Fully Allocated Cost (£m) 19.1 21.0 57.4 53.7 104.7 82.1 3.9 5.1 19.2 20.7 0.1 0.2
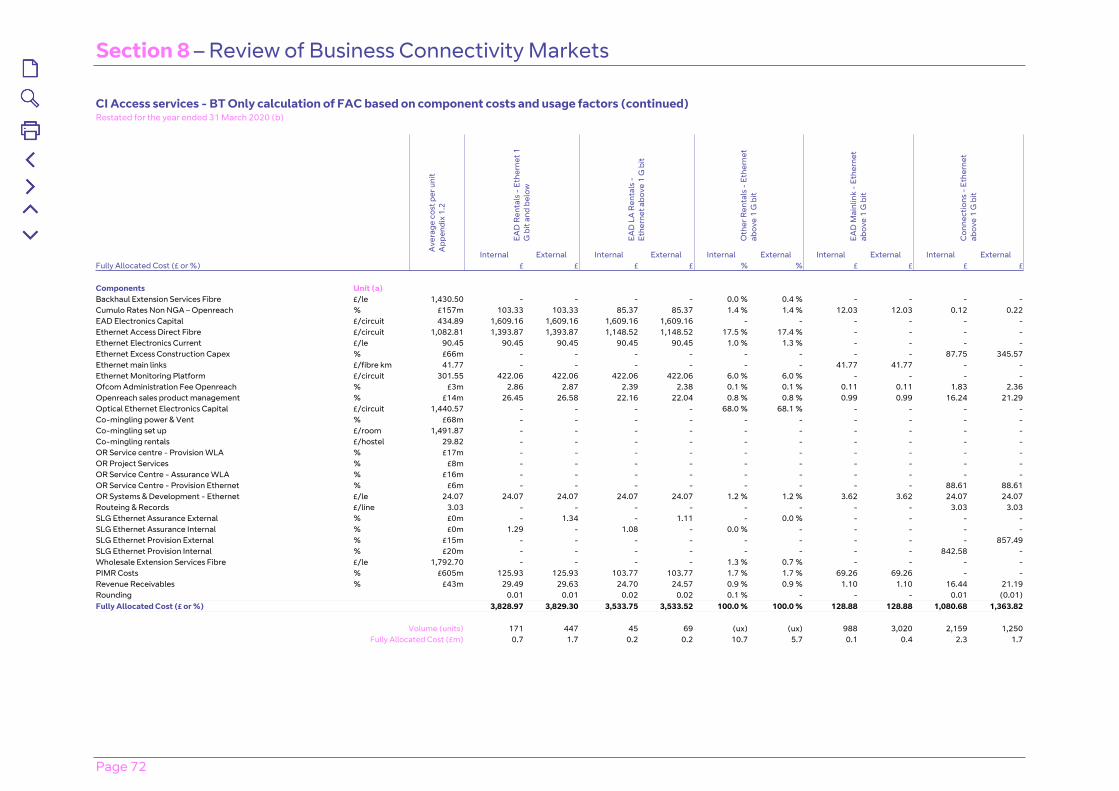
Section 8 – Review of Business Connectivity Markets
Page 72
CI Access services - BT Only calculation of FAC based on component costs and usage factors (continued)Restated for the year ended 31 March 2020 (b)
EAD
Ren
tals
- E
ther
net 1
G
bit
and
belo
w
EAD
LA
Ren
tals
-
Ethe
rnet
abo
ve 1
G b
it
Oth
er R
enta
ls -
Eth
erne
t ab
ove
1 G
bit
EAD
Mai
nlin
k -
Ethe
rnet
ab
ove
1 G
bit
Con
nect
ions
- E
ther
net
abov
e 1
G b
it
Ave
rage
cos
t per
uni
t A
ppen
dix
1.2
Internal External Internal External Internal External Internal External Internal ExternalFully Allocated Cost (£ or %) £ £ £ £ % % £ £ £ £ Components Unit (a) Backhaul Extension Services Fibre £/le 1,430.50 - - - - 0.0 % 0.4 % - - - -Cumulo Rates Non NGA – Openreach % £157m 103.33 103.33 85.37 85.37 1.4 % 1.4 % 12.03 12.03 0.12 0.22EAD Electronics Capital £/circuit 434.89 1,609.16 1,609.16 1,609.16 1,609.16 - - - - - -Ethernet Access Direct Fibre £/circuit 1,082.81 1,393.87 1,393.87 1,148.52 1,148.52 17.5 % 17.4 % - - - -Ethernet Electronics Current £/le 90.45 90.45 90.45 90.45 90.45 1.0 % 1.3 % - - - -Ethernet Excess Construction Capex % £66m - - - - - - - - 87.75 345.57Ethernet main links £/fibre km 41.77 - - - - - - 41.77 41.77 - -Ethernet Monitoring Platform £/circuit 301.55 422.06 422.06 422.06 422.06 6.0 % 6.0 % - - - -Ofcom Administration Fee Openreach % £3m 2.86 2.87 2.39 2.38 0.1 % 0.1 % 0.11 0.11 1.83 2.36Openreach sales product management % £14m 26.45 26.58 22.16 22.04 0.8 % 0.8 % 0.99 0.99 16.24 21.29Optical Ethernet Electronics Capital £/circuit 1,440.57 - - - - 68.0 % 68.1 % - - - -Co-mingling power & Vent % £68m - - - - - - - - - -Co-mingling set up £/room 1,491.87 - - - - - - - - - -Co-mingling rentals £/hostel 29.82 - - - - - - - - - -OR Service centre - Provision WLA % £17m - - - - - - - - - -OR Project Services % £8m - - - - - - - - - -OR Service Centre - Assurance WLA % £16m - - - - - - - - - -OR Service Centre - Provision Ethernet % £6m - - - - - - - - 88.61 88.61OR Systems & Development - Ethernet £/le 24.07 24.07 24.07 24.07 24.07 1.2 % 1.2 % 3.62 3.62 24.07 24.07Routeing & Records £/line 3.03 - - - - - - - - 3.03 3.03SLG Ethernet Assurance External % £0m - 1.34 - 1.11 - 0.0 % - - - -SLG Ethernet Assurance Internal % £0m 1.29 - 1.08 - 0.0 % - - - - -SLG Ethernet Provision External % £15m - - - - - - - - - 857.49SLG Ethernet Provision Internal % £20m - - - - - - - - 842.58 -Wholesale Extension Services Fibre £/le 1,792.70 - - - - 1.3 % 0.7 % - - - -PIMR Costs % £605m 125.93 125.93 103.77 103.77 1.7 % 1.7 % 69.26 69.26 - -Revenue Receivables % £43m 29.49 29.63 24.70 24.57 0.9 % 0.9 % 1.10 1.10 16.44 21.19Rounding 0.01 0.01 0.02 0.02 0.1 % - - - 0.01 (0.01)Fully Allocated Cost (£ or %) 3,828.97 3,829.30 3,533.75 3,533.52 100.0 % 100.0 % 128.88 128.88 1,080.68 1,363.82
Volume (units) 171 447 45 69 (ux) (ux) 988 3,020 2,159 1,250Fully Allocated Cost (£m) 0.7 1.7 0.2 0.2 10.7 5.7 0.1 0.4 2.3 1.7
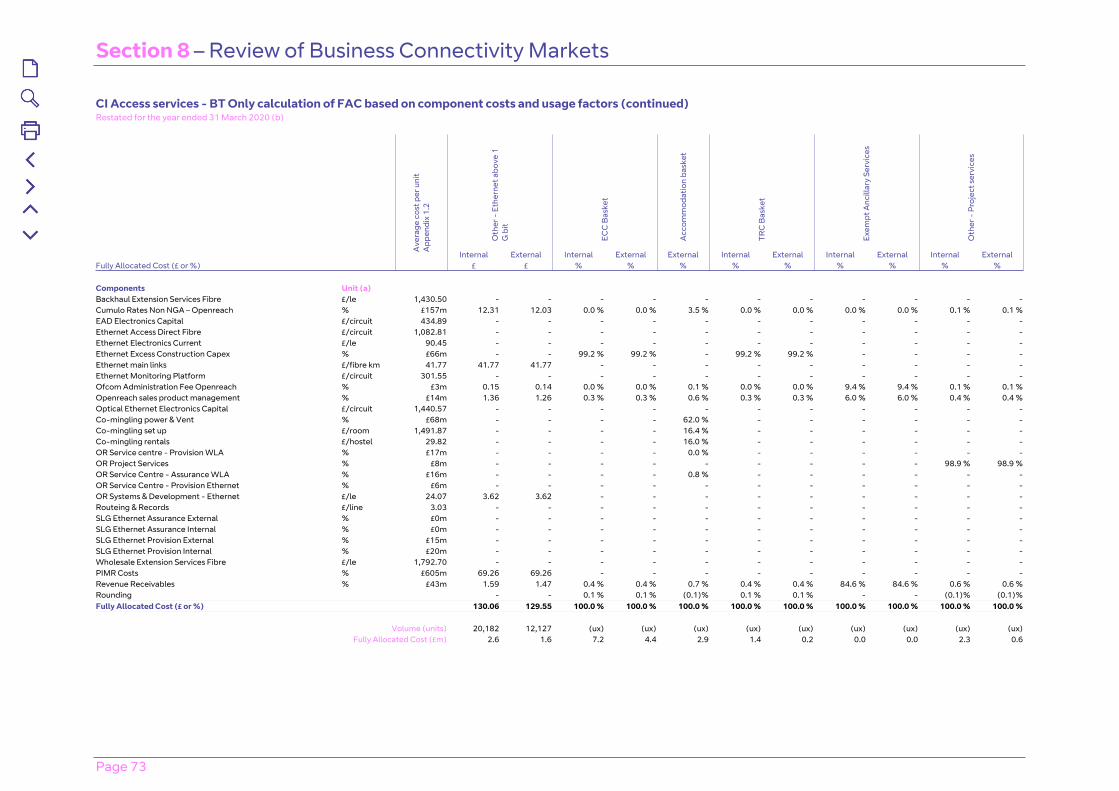
Section 8 – Review of Business Connectivity Markets
Page 73
CI Access services - BT Only calculation of FAC based on component costs and usage factors (continued)Restated for the year ended 31 March 2020 (b)
Oth
er -
Eth
erne
t abo
ve 1
G
bit
ECC
Bas
ket
Acc
omm
odat
ion
bask
et
TRC
Bas
ket
Exem
pt A
ncill
ary
Serv
ices
Oth
er -
Pro
ject
ser
vice
s
Ave
rage
cos
t per
uni
t A
ppen
dix
1.2
Internal External Internal External External Internal External Internal External Internal ExternalFully Allocated Cost (£ or %) £ £ % % % % % % % % % Components Unit (a) Backhaul Extension Services Fibre £/le 1,430.50 - - - - - - - - - - -Cumulo Rates Non NGA – Openreach % £157m 12.31 12.03 0.0 % 0.0 % 3.5 % 0.0 % 0.0 % 0.0 % 0.0 % 0.1 % 0.1 %EAD Electronics Capital £/circuit 434.89 - - - - - - - - - - -Ethernet Access Direct Fibre £/circuit 1,082.81 - - - - - - - - - - -Ethernet Electronics Current £/le 90.45 - - - - - - - - - - -Ethernet Excess Construction Capex % £66m - - 99.2 % 99.2 % - 99.2 % 99.2 % - - - -Ethernet main links £/fibre km 41.77 41.77 41.77 - - - - - - - - -Ethernet Monitoring Platform £/circuit 301.55 - - - - - - - - - - -Ofcom Administration Fee Openreach % £3m 0.15 0.14 0.0 % 0.0 % 0.1 % 0.0 % 0.0 % 9.4 % 9.4 % 0.1 % 0.1 %Openreach sales product management % £14m 1.36 1.26 0.3 % 0.3 % 0.6 % 0.3 % 0.3 % 6.0 % 6.0 % 0.4 % 0.4 %Optical Ethernet Electronics Capital £/circuit 1,440.57 - - - - - - - - - - -Co-mingling power & Vent % £68m - - - - 62.0 % - - - - - -Co-mingling set up £/room 1,491.87 - - - - 16.4 % - - - - - -Co-mingling rentals £/hostel 29.82 - - - - 16.0 % - - - - - -OR Service centre - Provision WLA % £17m - - - - 0.0 % - - - - - -OR Project Services % £8m - - - - - - - - - 98.9 % 98.9 %OR Service Centre - Assurance WLA % £16m - - - - 0.8 % - - - - - -OR Service Centre - Provision Ethernet % £6m - - - - - - - - - - -OR Systems & Development - Ethernet £/le 24.07 3.62 3.62 - - - - - - - - -Routeing & Records £/line 3.03 - - - - - - - - - - -SLG Ethernet Assurance External % £0m - - - - - - - - - - -SLG Ethernet Assurance Internal % £0m - - - - - - - - - - -SLG Ethernet Provision External % £15m - - - - - - - - - - -SLG Ethernet Provision Internal % £20m - - - - - - - - - - -Wholesale Extension Services Fibre £/le 1,792.70 - - - - - - - - - - -PIMR Costs % £605m 69.26 69.26 - - - - - - - - -Revenue Receivables % £43m 1.59 1.47 0.4 % 0.4 % 0.7 % 0.4 % 0.4 % 84.6 % 84.6 % 0.6 % 0.6 %Rounding - - 0.1 % 0.1 % (0.1)% 0.1 % 0.1 % - - (0.1)% (0.1)%Fully Allocated Cost (£ or %) 130.06 129.55 100.0 % 100.0 % 100.0 % 100.0 % 100.0 % 100.0 % 100.0 % 100.0 % 100.0 %
Volume (units) 20,182 12,127 (ux) (ux) (ux) (ux) (ux) (ux) (ux) (ux) (ux)Fully Allocated Cost (£m) 2.6 1.6 7.2 4.4 2.9 1.4 0.2 0.0 0.0 2.3 0.6
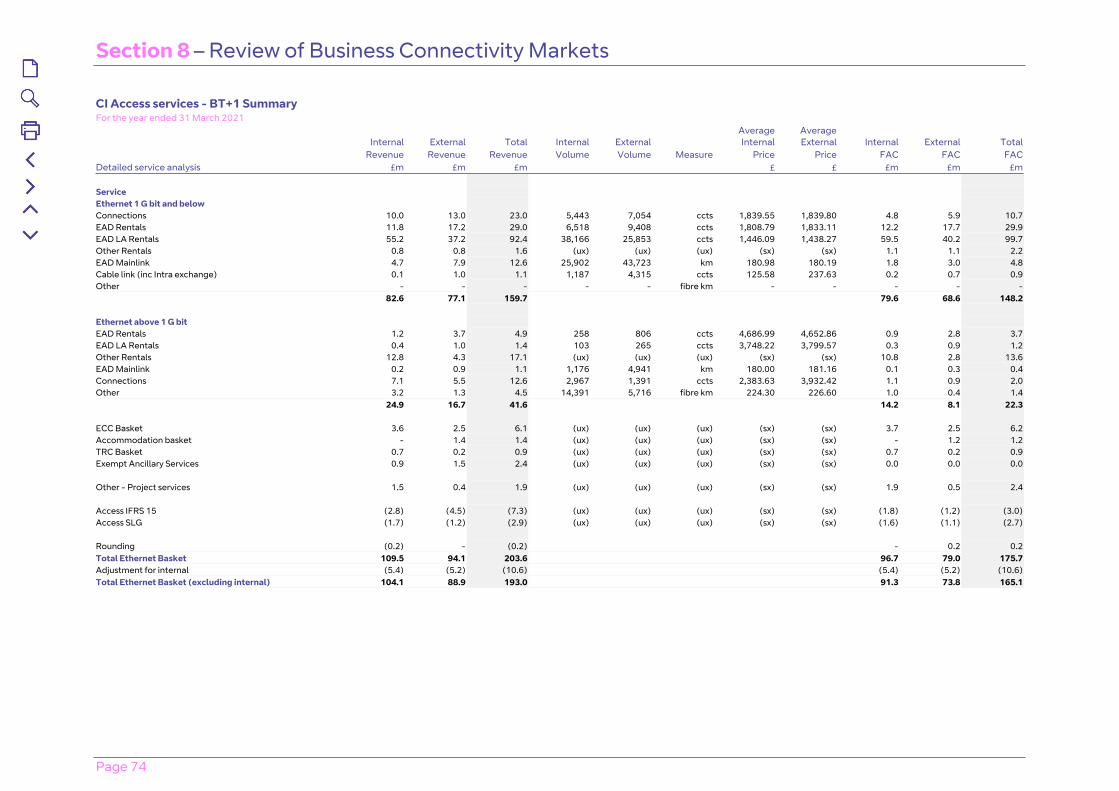
Section 8 – Review of Business Connectivity Markets
Page 74
CI Access services - BT+1 SummaryFor the year ended 31 March 2021
Internal External Total Internal External Average Internal
Average External Internal External Total
Revenue Revenue Revenue Volume Volume Measure Price Price FAC FAC FACDetailed service analysis £m £m £m £ £ £m £m £m Service Ethernet 1 G bit and below Connections 10.0 13.0 23.0 5,443 7,054 ccts 1,839.55 1,839.80 4.8 5.9 10.7EAD Rentals 11.8 17.2 29.0 6,518 9,408 ccts 1,808.79 1,833.11 12.2 17.7 29.9EAD LA Rentals 55.2 37.2 92.4 38,166 25,853 ccts 1,446.09 1,438.27 59.5 40.2 99.7Other Rentals 0.8 0.8 1.6 (ux) (ux) (ux) (sx) (sx) 1.1 1.1 2.2EAD Mainlink 4.7 7.9 12.6 25,902 43,723 km 180.98 180.19 1.8 3.0 4.8Cable link (inc Intra exchange) 0.1 1.0 1.1 1,187 4,315 ccts 125.58 237.63 0.2 0.7 0.9Other - - - - - fibre km - - - - - 82.6 77.1 159.7 79.6 68.6 148.2 Ethernet above 1 G bit EAD Rentals 1.2 3.7 4.9 258 806 ccts 4,686.99 4,652.86 0.9 2.8 3.7EAD LA Rentals 0.4 1.0 1.4 103 265 ccts 3,748.22 3,799.57 0.3 0.9 1.2Other Rentals 12.8 4.3 17.1 (ux) (ux) (ux) (sx) (sx) 10.8 2.8 13.6EAD Mainlink 0.2 0.9 1.1 1,176 4,941 km 180.00 181.16 0.1 0.3 0.4Connections 7.1 5.5 12.6 2,967 1,391 ccts 2,383.63 3,932.42 1.1 0.9 2.0Other 3.2 1.3 4.5 14,391 5,716 fibre km 224.30 226.60 1.0 0.4 1.4 24.9 16.7 41.6 14.2 8.1 22.3 ECC Basket 3.6 2.5 6.1 (ux) (ux) (ux) (sx) (sx) 3.7 2.5 6.2Accommodation basket - 1.4 1.4 (ux) (ux) (ux) (sx) (sx) - 1.2 1.2TRC Basket 0.7 0.2 0.9 (ux) (ux) (ux) (sx) (sx) 0.7 0.2 0.9Exempt Ancillary Services 0.9 1.5 2.4 (ux) (ux) (ux) (sx) (sx) 0.0 0.0 0.0 Other - Project services 1.5 0.4 1.9 (ux) (ux) (ux) (sx) (sx) 1.9 0.5 2.4 Access IFRS 15 (2.8) (4.5) (7.3) (ux) (ux) (ux) (sx) (sx) (1.8) (1.2) (3.0)Access SLG (1.7) (1.2) (2.9) (ux) (ux) (ux) (sx) (sx) (1.6) (1.1) (2.7) Rounding (0.2) - (0.2) - 0.2 0.2Total Ethernet Basket 109.5 94.1 203.6 96.7 79.0 175.7Adjustment for internal (5.4) (5.2) (10.6) (5.4) (5.2) (10.6)Total Ethernet Basket (excluding internal) 104.1 88.9 193.0 91.3 73.8 165.1
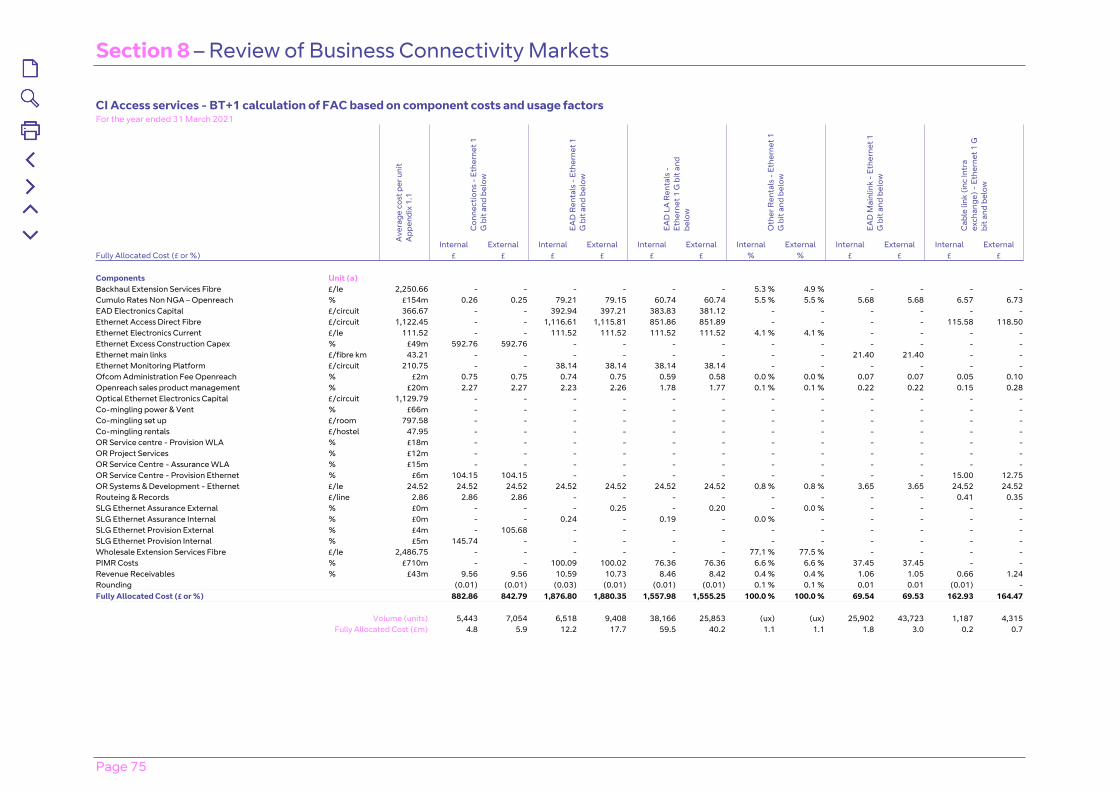
Section 8 – Review of Business Connectivity Markets
Page 75
CI Access services - BT+1 calculation of FAC based on component costs and usage factors For the year ended 31 March 2021
Con
nect
ions
- E
ther
net 1
G
bit
and
belo
w
EAD
Ren
tals
- E
ther
net 1
G
bit
and
belo
w
EAD
LA
Ren
tals
-
Ethe
rnet
1 G
bit
and
belo
w
Oth
er R
enta
ls -
Eth
erne
t 1
G b
it an
d be
low
EAD
Mai
nlin
k -
Ethe
rnet
1
G b
it an
d be
low
Cab
le li
nk (i
nc In
tra
exch
ange
) - E
ther
net 1
G
bit a
nd b
elow
Ave
rage
cos
t per
uni
t A
ppen
dix
1.1
Internal External Internal External Internal External Internal External Internal External Internal ExternalFully Allocated Cost (£ or %) £ £ £ £ £ £ % % £ £ £ £ Components Unit (a) Backhaul Extension Services Fibre £/le 2,250.66 - - - - - - 5.3 % 4.9 % - - - -Cumulo Rates Non NGA – Openreach % £154m 0.26 0.25 79.21 79.15 60.74 60.74 5.5 % 5.5 % 5.68 5.68 6.57 6.73EAD Electronics Capital £/circuit 366.67 - - 392.94 397.21 383.83 381.12 - - - - - -Ethernet Access Direct Fibre £/circuit 1,122.45 - - 1,116.61 1,115.81 851.86 851.89 - - - - 115.58 118.50Ethernet Electronics Current £/le 111.52 - - 111.52 111.52 111.52 111.52 4.1 % 4.1 % - - - -Ethernet Excess Construction Capex % £49m 592.76 592.76 - - - - - - - - - -Ethernet main links £/fibre km 43.21 - - - - - - - - 21.40 21.40 - -Ethernet Monitoring Platform £/circuit 210.75 - - 38.14 38.14 38.14 38.14 - - - - - -Ofcom Administration Fee Openreach % £2m 0.75 0.75 0.74 0.75 0.59 0.58 0.0 % 0.0 % 0.07 0.07 0.05 0.10Openreach sales product management % £20m 2.27 2.27 2.23 2.26 1.78 1.77 0.1 % 0.1 % 0.22 0.22 0.15 0.28Optical Ethernet Electronics Capital £/circuit 1,129.79 - - - - - - - - - - - -Co-mingling power & Vent % £66m - - - - - - - - - - - -Co-mingling set up £/room 797.58 - - - - - - - - - - - -Co-mingling rentals £/hostel 47.95 - - - - - - - - - - - -OR Service centre - Provision WLA % £18m - - - - - - - - - - - -OR Project Services % £12m - - - - - - - - - - - -OR Service Centre - Assurance WLA % £15m - - - - - - - - - - - -OR Service Centre - Provision Ethernet % £6m 104.15 104.15 - - - - - - - - 15.00 12.75OR Systems & Development - Ethernet £/le 24.52 24.52 24.52 24.52 24.52 24.52 24.52 0.8 % 0.8 % 3.65 3.65 24.52 24.52Routeing & Records £/line 2.86 2.86 2.86 - - - - - - - - 0.41 0.35SLG Ethernet Assurance External % £0m - - - 0.25 - 0.20 - 0.0 % - - - -SLG Ethernet Assurance Internal % £0m - - 0.24 - 0.19 - 0.0 % - - - - -SLG Ethernet Provision External % £4m - 105.68 - - - - - - - - - -SLG Ethernet Provision Internal % £5m 145.74 - - - - - - - - - - -Wholesale Extension Services Fibre £/le 2,486.75 - - - - - - 77.1 % 77.5 % - - - -PIMR Costs % £710m - - 100.09 100.02 76.36 76.36 6.6 % 6.6 % 37.45 37.45 - -Revenue Receivables % £43m 9.56 9.56 10.59 10.73 8.46 8.42 0.4 % 0.4 % 1.06 1.05 0.66 1.24Rounding (0.01) (0.01) (0.03) (0.01) (0.01) (0.01) 0.1 % 0.1 % 0.01 0.01 (0.01) -Fully Allocated Cost (£ or %) 882.86 842.79 1,876.80 1,880.35 1,557.98 1,555.25 100.0 % 100.0 % 69.54 69.53 162.93 164.47
Volume (units) 5,443 7,054 6,518 9,408 38,166 25,853 (ux) (ux) 25,902 43,723 1,187 4,315
Fully Allocated Cost (£m) 4.8 5.9 12.2 17.7 59.5 40.2 1.1 1.1 1.8 3.0 0.2 0.7
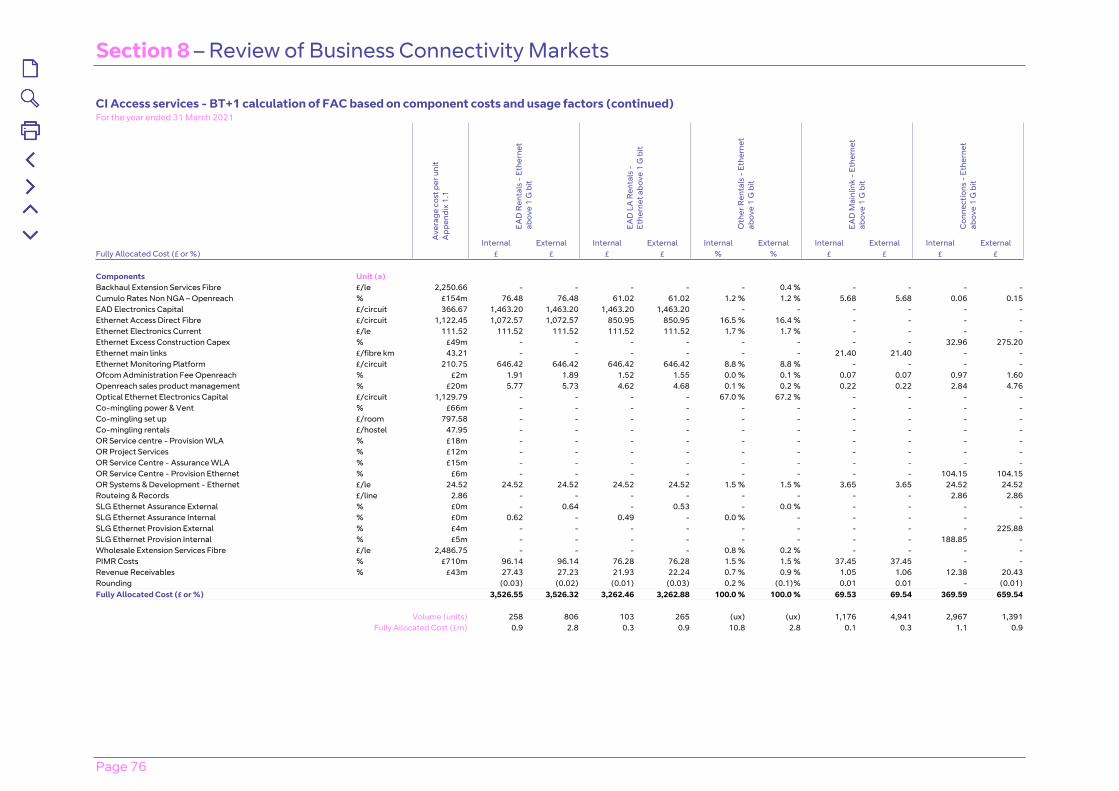
Section 8 – Review of Business Connectivity Markets
Page 76
CI Access services - BT+1 calculation of FAC based on component costs and usage factors (continued)For the year ended 31 March 2021
EAD
Ren
tals
- E
ther
net
abov
e 1
G b
it
EAD
LA
Ren
tals
-
Ethe
rnet
abo
ve 1
G b
it
Oth
er R
enta
ls -
Eth
erne
t ab
ove
1 G
bit
EAD
Mai
nlin
k -
Ethe
rnet
ab
ove
1 G
bit
Con
nect
ions
- E
ther
net
abov
e 1
G b
it
Ave
rage
cos
t per
uni
t A
ppen
dix
1.1
Internal External Internal External Internal External Internal External Internal ExternalFully Allocated Cost (£ or %) £ £ £ £ % % £ £ £ £ Components Unit (a) Backhaul Extension Services Fibre £/le 2,250.66 - - - - - 0.4 % - - - -Cumulo Rates Non NGA – Openreach % £154m 76.48 76.48 61.02 61.02 1.2 % 1.2 % 5.68 5.68 0.06 0.15EAD Electronics Capital £/circuit 366.67 1,463.20 1,463.20 1,463.20 1,463.20 - - - - - -Ethernet Access Direct Fibre £/circuit 1,122.45 1,072.57 1,072.57 850.95 850.95 16.5 % 16.4 % - - - -Ethernet Electronics Current £/le 111.52 111.52 111.52 111.52 111.52 1.7 % 1.7 % - - - -Ethernet Excess Construction Capex % £49m - - - - - - - - 32.96 275.20Ethernet main links £/fibre km 43.21 - - - - - - 21.40 21.40 - -Ethernet Monitoring Platform £/circuit 210.75 646.42 646.42 646.42 646.42 8.8 % 8.8 % - - - -Ofcom Administration Fee Openreach % £2m 1.91 1.89 1.52 1.55 0.0 % 0.1 % 0.07 0.07 0.97 1.60Openreach sales product management % £20m 5.77 5.73 4.62 4.68 0.1 % 0.2 % 0.22 0.22 2.84 4.76Optical Ethernet Electronics Capital £/circuit 1,129.79 - - - - 67.0 % 67.2 % - - - -Co-mingling power & Vent % £66m - - - - - - - - - -Co-mingling set up £/room 797.58 - - - - - - - - - -Co-mingling rentals £/hostel 47.95 - - - - - - - - - -OR Service centre - Provision WLA % £18m - - - - - - - - - -OR Project Services % £12m - - - - - - - - - -OR Service Centre - Assurance WLA % £15m - - - - - - - - - -OR Service Centre - Provision Ethernet % £6m - - - - - - - - 104.15 104.15OR Systems & Development - Ethernet £/le 24.52 24.52 24.52 24.52 24.52 1.5 % 1.5 % 3.65 3.65 24.52 24.52Routeing & Records £/line 2.86 - - - - - - - - 2.86 2.86SLG Ethernet Assurance External % £0m - 0.64 - 0.53 - 0.0 % - - - -SLG Ethernet Assurance Internal % £0m 0.62 - 0.49 - 0.0 % - - - - -SLG Ethernet Provision External % £4m - - - - - - - - - 225.88SLG Ethernet Provision Internal % £5m - - - - - - - - 188.85 -Wholesale Extension Services Fibre £/le 2,486.75 - - - - 0.8 % 0.2 % - - - -PIMR Costs % £710m 96.14 96.14 76.28 76.28 1.5 % 1.5 % 37.45 37.45 - -Revenue Receivables % £43m 27.43 27.23 21.93 22.24 0.7 % 0.9 % 1.05 1.06 12.38 20.43Rounding (0.03) (0.02) (0.01) (0.03) 0.2 % (0.1)% 0.01 0.01 - (0.01)Fully Allocated Cost (£ or %) 3,526.55 3,526.32 3,262.46 3,262.88 100.0 % 100.0 % 69.53 69.54 369.59 659.54
Volume (units) 258 806 103 265 (ux) (ux) 1,176 4,941 2,967 1,391
Fully Allocated Cost (£m) 0.9 2.8 0.3 0.9 10.8 2.8 0.1 0.3 1.1 0.9
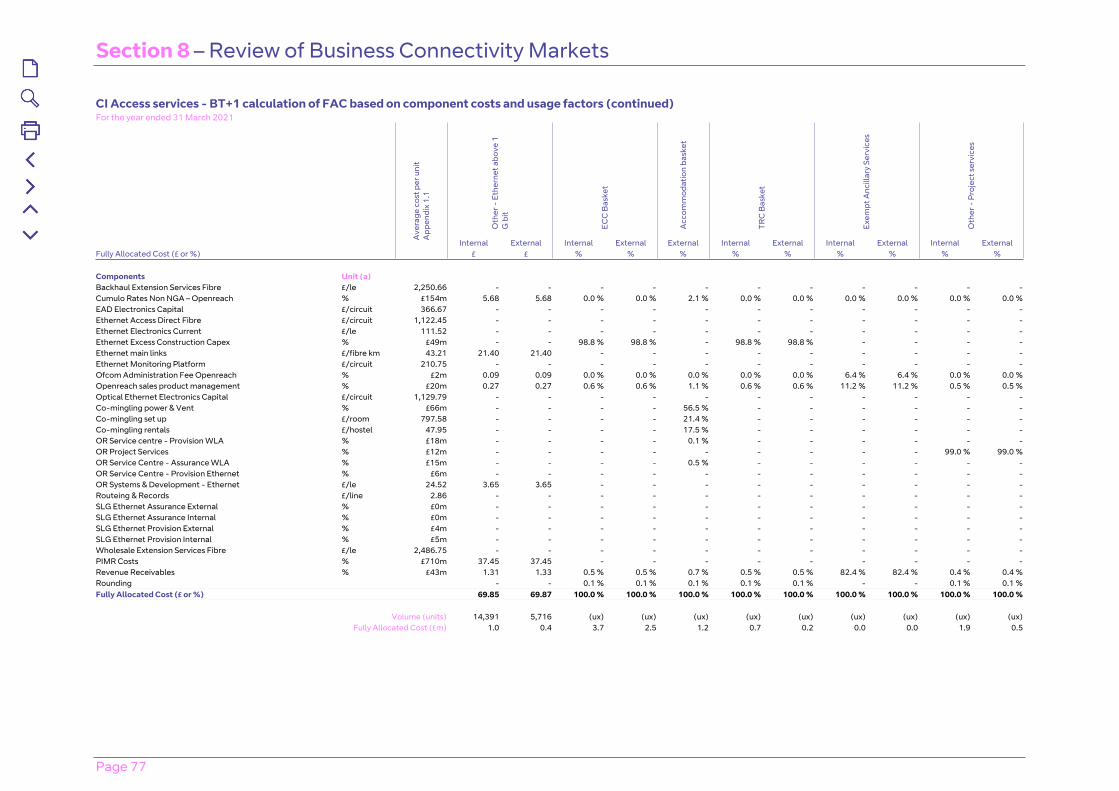
Section 8 – Review of Business Connectivity Markets
Page 77
CI Access services - BT+1 calculation of FAC based on component costs and usage factors (continued)For the year ended 31 March 2021
Oth
er -
Eth
erne
t abo
ve 1
G
bit
ECC
Bas
ket
Acc
omm
odat
ion
bask
et
TRC
Bas
ket
Exem
pt A
ncill
ary
Serv
ices
Oth
er -
Pro
ject
ser
vice
s
Ave
rage
cos
t per
uni
t A
ppen
dix
1.1
Internal External Internal External External Internal External Internal External Internal ExternalFully Allocated Cost (£ or %) £ £ % % % % % % % % % Components Unit (a) Backhaul Extension Services Fibre £/le 2,250.66 - - - - - - - - - - -Cumulo Rates Non NGA – Openreach % £154m 5.68 5.68 0.0 % 0.0 % 2.1 % 0.0 % 0.0 % 0.0 % 0.0 % 0.0 % 0.0 %EAD Electronics Capital £/circuit 366.67 - - - - - - - - - - -Ethernet Access Direct Fibre £/circuit 1,122.45 - - - - - - - - - - -Ethernet Electronics Current £/le 111.52 - - - - - - - - - - -Ethernet Excess Construction Capex % £49m - - 98.8 % 98.8 % - 98.8 % 98.8 % - - - -Ethernet main links £/fibre km 43.21 21.40 21.40 - - - - - - - - -Ethernet Monitoring Platform £/circuit 210.75 - - - - - - - - - - -Ofcom Administration Fee Openreach % £2m 0.09 0.09 0.0 % 0.0 % 0.0 % 0.0 % 0.0 % 6.4 % 6.4 % 0.0 % 0.0 %Openreach sales product management % £20m 0.27 0.27 0.6 % 0.6 % 1.1 % 0.6 % 0.6 % 11.2 % 11.2 % 0.5 % 0.5 %Optical Ethernet Electronics Capital £/circuit 1,129.79 - - - - - - - - - - -Co-mingling power & Vent % £66m - - - - 56.5 % - - - - - -Co-mingling set up £/room 797.58 - - - - 21.4 % - - - - - -Co-mingling rentals £/hostel 47.95 - - - - 17.5 % - - - - - -OR Service centre - Provision WLA % £18m - - - - 0.1 % - - - - - -OR Project Services % £12m - - - - - - - - - 99.0 % 99.0 %OR Service Centre - Assurance WLA % £15m - - - - 0.5 % - - - - - -OR Service Centre - Provision Ethernet % £6m - - - - - - - - - - -OR Systems & Development - Ethernet £/le 24.52 3.65 3.65 - - - - - - - - -Routeing & Records £/line 2.86 - - - - - - - - - - -SLG Ethernet Assurance External % £0m - - - - - - - - - - -SLG Ethernet Assurance Internal % £0m - - - - - - - - - - -SLG Ethernet Provision External % £4m - - - - - - - - - - -SLG Ethernet Provision Internal % £5m - - - - - - - - - - -Wholesale Extension Services Fibre £/le 2,486.75 - - - - - - - - - - -PIMR Costs % £710m 37.45 37.45 - - - - - - - - -Revenue Receivables % £43m 1.31 1.33 0.5 % 0.5 % 0.7 % 0.5 % 0.5 % 82.4 % 82.4 % 0.4 % 0.4 %Rounding - - 0.1 % 0.1 % 0.1 % 0.1 % 0.1 % - - 0.1 % 0.1 %Fully Allocated Cost (£ or %) 69.85 69.87 100.0 % 100.0 % 100.0 % 100.0 % 100.0 % 100.0 % 100.0 % 100.0 % 100.0 %
Volume (units) 14,391 5,716 (ux) (ux) (ux) (ux) (ux) (ux) (ux) (ux) (ux)
Fully Allocated Cost (£m) 1.0 0.4 3.7 2.5 1.2 0.7 0.2 0.0 0.0 1.9 0.5

Section 8 – Review of Business Connectivity Markets
Page 78
CI Access services - BT+1 Summary Restated for the year ended 31 March 2020 (b)
Internal External Total Internal External Average Internal
Average External Internal External Total
Revenue Revenue Revenue Volume Volume Measure Price Price FAC FAC FAC Detailed service analysis £m £m £m £ £ £m £m £m Service Ethernet 1 G bit and below Connections 13.8 15.5 29.3 7,334 8,277 ccts 1,876.78 1,876.71 10.7 11.2 21.9 EAD Rentals 12.3 15.1 27.4 6,802 8,315 ccts 1,804.49 1,817.77 13.3 16.2 29.5 EAD LA Rentals 51.7 32.6 84.3 35,889 22,897 ccts 1,440.91 1,423.56 58.2 37.0 95.2 Other Rentals 1.1 1.0 2.1 (ux) (ux) (ux) (sx) (sx) 1.3 1.1 2.4 EAD Mainlink 5.0 7.2 12.2 27,743 40,015 km 180.96 180.24 1.9 2.7 4.6 Cable link (inc Intra exchange) 0.1 0.3 0.4 940 3,772 ccts 103.24 89.13 0.1 0.6 0.7 Other - - - - - fibre km - - - - - 84.0 71.7 155.7 85.5 68.8 154.3 Ethernet above 1 G bit EAD Rentals 0.6 1.4 2.0 132 300 ccts 4,797.26 4,747.52 0.5 1.0 1.5 EAD LA Rentals 0.1 0.4 0.5 33 100 ccts 3,928.33 3,904.02 0.1 0.3 0.4 Other Rentals 10.1 3.8 13.9 (ux) (ux) (ux) (sx) (sx) 7.6 2.4 10.0 EAD Mainlink 0.1 0.3 0.4 692 1,562 km 180.00 180.26 0.0 0.1 0.1 Connections 6.9 3.3 10.2 2,527 844 ccts 2,716.51 3,939.54 2.4 1.3 3.7 Other 2.6 1.1 3.7 10,608 4,727 fibre km 248.74 230.58 0.7 0.3 1.0 20.4 10.3 30.7 11.3 5.4 16.7 ECC Basket 3.2 1.7 4.9 (ux) (ux) (ux) (sx) (sx) 4.0 2.1 6.1 Accommodation basket - 0.8 0.8 (ux) (ux) (ux) (sx) (sx) - 0.7 0.7 TRC Basket 0.6 0.1 0.7 (ux) (ux) (ux) (sx) (sx) 0.8 0.1 0.9 Exempt Ancillary Services 1.1 1.4 2.5 (ux) (ux) (ux) (sx) (sx) 0.0 0.0 0.0 Other - Project services 1.4 0.3 1.7 (ux) (ux) (ux) (sx) (sx) 1.3 0.3 1.6 Access IFRS 15 (7.9 ) (5.3 ) (13.2 ) (ux) (ux) (ux) (sx) (sx) (0.4 ) (1.0 ) (1.4 )Access SLG (5.9 ) (3.8 ) (9.7 ) (ux) (ux) (ux) (sx) (sx) (6.2 ) (4.0 ) (10.2 ) Rounding - 0.1 0.1 (0.1 ) 0.2 0.1 Total Ethernet Basket 96.9 77.3 174.2 96.2 72.6 168.8 Adjustment for internal (5.0 ) (4.3 ) (9.3 ) (5.0 ) (4.3 ) (9.3 )Total Ethernet Basket (excluding internal) 91.9 73.0 164.9 91.2 68.3 159.5
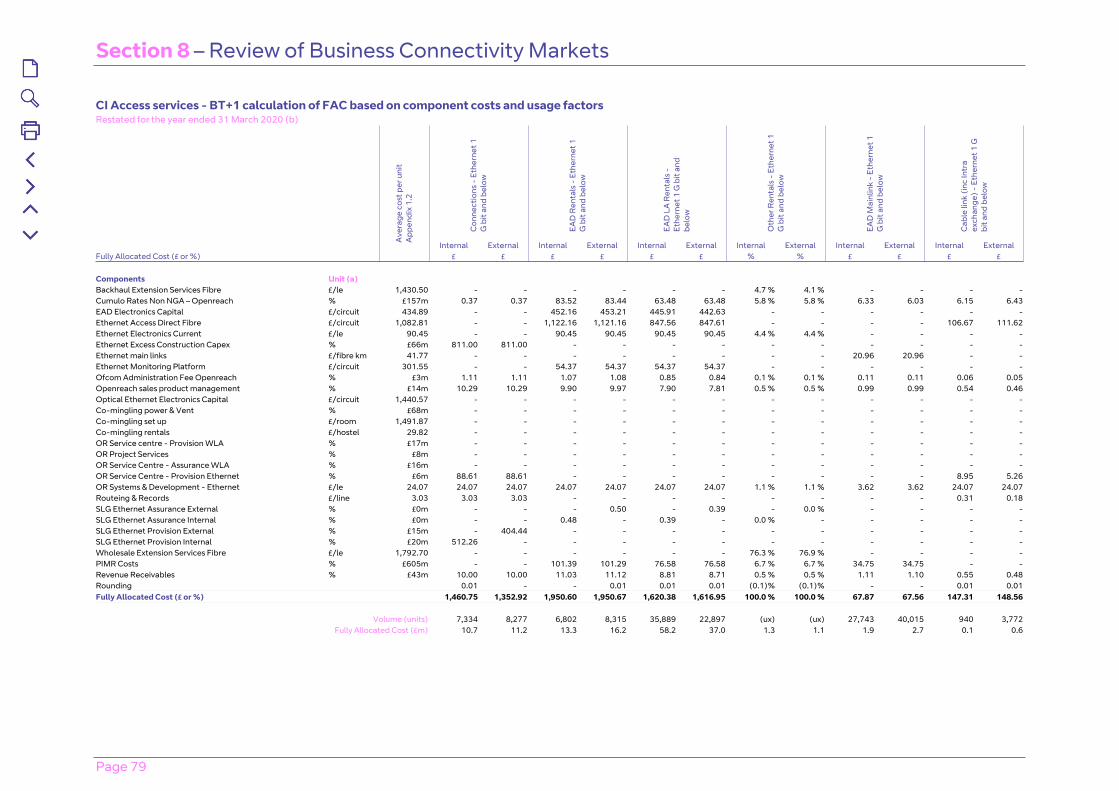
Section 8 – Review of Business Connectivity Markets
Page 79
CI Access services - BT+1 calculation of FAC based on component costs and usage factors Restated for the year ended 31 March 2020 (b)
Con
nect
ions
- E
ther
net 1
G
bit
and
belo
w
EAD
Ren
tals
- E
ther
net 1
G
bit
and
belo
w
EAD
LA
Ren
tals
-
Ethe
rnet
1 G
bit
and
belo
w
Oth
er R
enta
ls -
Eth
erne
t 1
G b
it an
d be
low
EAD
Mai
nlin
k -
Ethe
rnet
1
G b
it an
d be
low
Cab
le li
nk (i
nc In
tra
exch
ange
) - E
ther
net 1
G
bit a
nd b
elow
Ave
rage
cos
t per
uni
t A
ppen
dix
1.2
Internal External Internal External Internal External Internal External Internal External Internal ExternalFully Allocated Cost (£ or %) £ £ £ £ £ £ % % £ £ £ £ Components Unit (a) Backhaul Extension Services Fibre £/le 1,430.50 - - - - - - 4.7 % 4.1 % - - - -Cumulo Rates Non NGA – Openreach % £157m 0.37 0.37 83.52 83.44 63.48 63.48 5.8 % 5.8 % 6.33 6.03 6.15 6.43EAD Electronics Capital £/circuit 434.89 - - 452.16 453.21 445.91 442.63 - - - - - -Ethernet Access Direct Fibre £/circuit 1,082.81 - - 1,122.16 1,121.16 847.56 847.61 - - - - 106.67 111.62Ethernet Electronics Current £/le 90.45 - - 90.45 90.45 90.45 90.45 4.4 % 4.4 % - - - -Ethernet Excess Construction Capex % £66m 811.00 811.00 - - - - - - - - - -Ethernet main links £/fibre km 41.77 - - - - - - - - 20.96 20.96 - -Ethernet Monitoring Platform £/circuit 301.55 - - 54.37 54.37 54.37 54.37 - - - - - -Ofcom Administration Fee Openreach % £3m 1.11 1.11 1.07 1.08 0.85 0.84 0.1 % 0.1 % 0.11 0.11 0.06 0.05Openreach sales product management % £14m 10.29 10.29 9.90 9.97 7.90 7.81 0.5 % 0.5 % 0.99 0.99 0.54 0.46Optical Ethernet Electronics Capital £/circuit 1,440.57 - - - - - - - - - - - -Co-mingling power & Vent % £68m - - - - - - - - - - - -Co-mingling set up £/room 1,491.87 - - - - - - - - - - - -Co-mingling rentals £/hostel 29.82 - - - - - - - - - - - -OR Service centre - Provision WLA % £17m - - - - - - - - - - - -OR Project Services % £8m - - - - - - - - - - - -OR Service Centre - Assurance WLA % £16m - - - - - - - - - - - -OR Service Centre - Provision Ethernet % £6m 88.61 88.61 - - - - - - - - 8.95 5.26OR Systems & Development - Ethernet £/le 24.07 24.07 24.07 24.07 24.07 24.07 24.07 1.1 % 1.1 % 3.62 3.62 24.07 24.07Routeing & Records £/line 3.03 3.03 3.03 - - - - - - - - 0.31 0.18SLG Ethernet Assurance External % £0m - - - 0.50 - 0.39 - 0.0 % - - - -SLG Ethernet Assurance Internal % £0m - - 0.48 - 0.39 - 0.0 % - - - - -SLG Ethernet Provision External % £15m - 404.44 - - - - - - - - - -SLG Ethernet Provision Internal % £20m 512.26 - - - - - - - - - - -Wholesale Extension Services Fibre £/le 1,792.70 - - - - - - 76.3 % 76.9 % - - - -PIMR Costs % £605m - - 101.39 101.29 76.58 76.58 6.7 % 6.7 % 34.75 34.75 - -Revenue Receivables % £43m 10.00 10.00 11.03 11.12 8.81 8.71 0.5 % 0.5 % 1.11 1.10 0.55 0.48Rounding 0.01 - - 0.01 0.01 0.01 (0.1)% (0.1)% - - 0.01 0.01Fully Allocated Cost (£ or %) 1,460.75 1,352.92 1,950.60 1,950.67 1,620.38 1,616.95 100.0 % 100.0 % 67.87 67.56 147.31 148.56
Volume (units) 7,334 8,277 6,802 8,315 35,889 22,897 (ux) (ux) 27,743 40,015 940 3,772
Fully Allocated Cost (£m) 10.7 11.2 13.3 16.2 58.2 37.0 1.3 1.1 1.9 2.7 0.1 0.6

Section 8 – Review of Business Connectivity Markets
Page 80
CI Access services - BT+1 calculation of FAC based on component costs and usage factors (continued)Restated for the year ended 31 March 2020 (b)
EAD
Ren
tals
- E
ther
net
abov
e 1
G b
it
EAD
LA
Ren
tals
-
Ethe
rnet
abo
ve 1
G b
it
Oth
er R
enta
ls -
Eth
erne
t ab
ove
1 G
bit
EAD
Mai
nlin
k -
Ethe
rnet
ab
ove
1 G
bit
Con
nect
ions
- E
ther
net
abov
e 1
G b
it
Ave
rage
cos
t per
uni
t A
ppen
dix
1.2
Internal External Internal External Internal External Internal External Internal ExternalFully Allocated Cost (£ or %) £ £ £ £ % % £ £ £ £ Components Unit (a) Backhaul Extension Services Fibre £/le 1,430.50 - - - - - 0.3 % - - - -Cumulo Rates Non NGA – Openreach % £157m 77.97 77.97 63.79 63.79 1.1 % 1.1 % 6.03 6.03 0.10 0.28EAD Electronics Capital £/circuit 434.89 1,609.16 1,609.16 1,609.16 1,609.16 - - - - - -Ethernet Access Direct Fibre £/circuit 1,082.81 1,042.08 1,042.08 846.71 846.71 14.1 % 13.9 % - - - -Ethernet Electronics Current £/le 90.45 90.45 90.45 90.45 90.45 1.1 % 1.3 % - - - -Ethernet Excess Construction Capex % £66m - - - - - - - - 57.64 507.00Ethernet main links £/fibre km 41.77 - - - - - - 20.96 20.96 - -Ethernet Monitoring Platform £/circuit 301.55 422.06 422.06 422.06 422.06 6.4 % 6.3 % - - - -Ofcom Administration Fee Openreach % £3m 2.84 2.81 2.33 2.31 0.1 % 0.1 % 0.11 0.11 1.61 2.33Openreach sales product management % £14m 26.31 26.04 21.55 21.41 0.7 % 0.8 % 0.99 0.99 14.25 21.30Optical Ethernet Electronics Capital £/circuit 1,440.57 - - - - 72.1 % 72.4 % - - - -Co-mingling power & Vent % £68m - - - - - - - - - -Co-mingling set up £/room 1,491.87 - - - - - - - - - -Co-mingling rentals £/hostel 29.82 - - - - - - - - - -OR Service centre - Provision WLA % £17m - - - - - - - - - -OR Project Services % £8m - - - - - - - - - -OR Service Centre - Assurance WLA % £16m - - - - - - - - - -OR Service Centre - Provision Ethernet % £6m - - - - - - - - 88.61 88.61OR Systems & Development - Ethernet £/le 24.07 24.07 24.07 24.07 24.07 1.2 % 1.2 % 3.62 3.62 24.07 24.07Routeing & Records £/line 3.03 - - - - - - - - 3.03 3.03SLG Ethernet Assurance External % £0m - 1.31 - 1.08 - 0.0 % - - - -SLG Ethernet Assurance Internal % £0m 1.29 - 1.05 - 0.0 % - - - - -SLG Ethernet Provision External % £15m - - - - - - - - - 848.99SLG Ethernet Provision Internal % £20m - - - - - - - - 741.47 -Wholesale Extension Services Fibre £/le 1,792.70 - - - - 1.0 % 0.2 % - - - -PIMR Costs % £605m 94.15 94.15 76.50 76.50 1.3 % 1.3 % 34.75 34.75 - -Revenue Receivables % £43m 29.34 29.03 24.02 23.87 0.8 % 1.0 % 1.10 1.10 14.47 20.98Rounding 0.01 0.02 0.01 0.02 0.1 % 0.1 % - - - -Fully Allocated Cost (£ or %) 3,419.73 3,419.15 3,181.70 3,181.43 100.0 % 100.0 % 67.56 67.56 945.25 1,516.59
Volume (units) 132 300 33 100 (ux) (ux) 692 1,562 2,527 844
Fully Allocated Cost (£m) 0.5 1.0 0.1 0.3 7.6 2.4 0.0 0.1 2.4 1.3
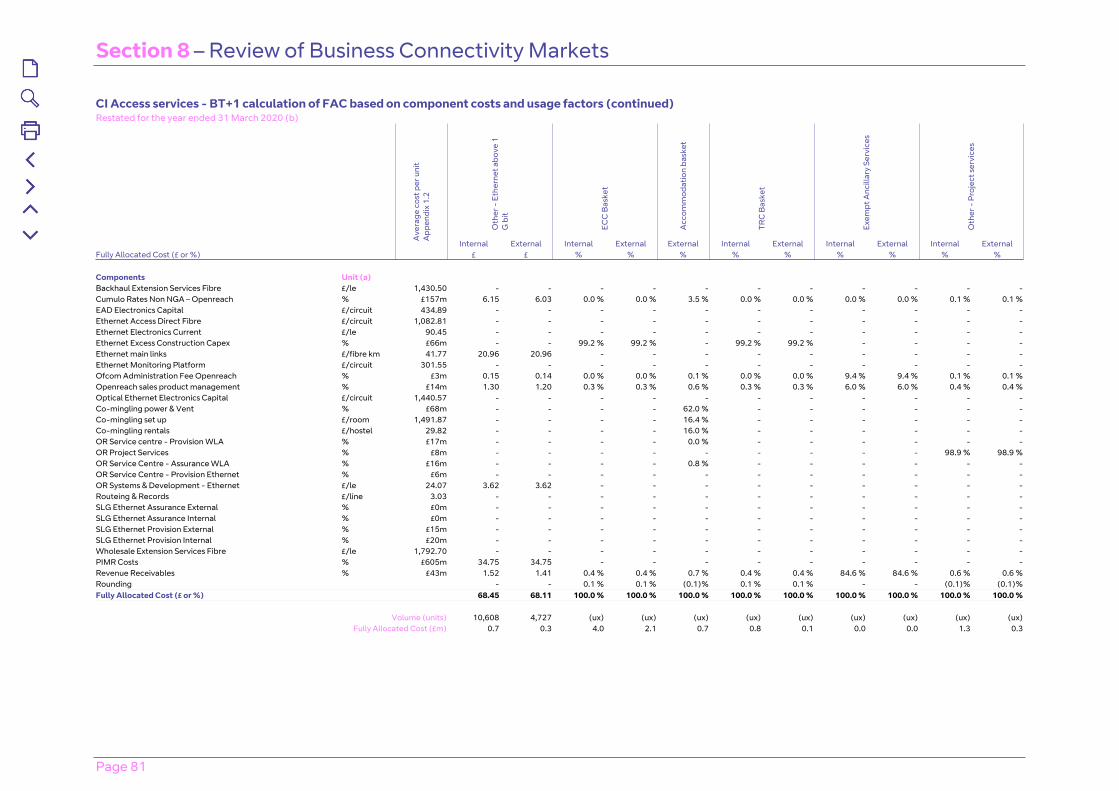
Section 8 – Review of Business Connectivity Markets
Page 81
CI Access services - BT+1 calculation of FAC based on component costs and usage factors (continued)Restated for the year ended 31 March 2020 (b)
Oth
er -
Eth
erne
t abo
ve 1
G
bit
ECC
Bas
ket
Acc
omm
odat
ion
bask
et
TRC
Bas
ket
Exem
pt A
ncill
ary
Serv
ices
Oth
er -
Pro
ject
ser
vice
s
Ave
rage
cos
t per
uni
t A
ppen
dix
1.2
Internal External Internal External External Internal External Internal External Internal ExternalFully Allocated Cost (£ or %) £ £ % % % % % % % % % Components Unit (a) Backhaul Extension Services Fibre £/le 1,430.50 - - - - - - - - - - -Cumulo Rates Non NGA – Openreach % £157m 6.15 6.03 0.0 % 0.0 % 3.5 % 0.0 % 0.0 % 0.0 % 0.0 % 0.1 % 0.1 %EAD Electronics Capital £/circuit 434.89 - - - - - - - - - - -Ethernet Access Direct Fibre £/circuit 1,082.81 - - - - - - - - - - -Ethernet Electronics Current £/le 90.45 - - - - - - - - - - -Ethernet Excess Construction Capex % £66m - - 99.2 % 99.2 % - 99.2 % 99.2 % - - - -Ethernet main links £/fibre km 41.77 20.96 20.96 - - - - - - - - -Ethernet Monitoring Platform £/circuit 301.55 - - - - - - - - - - -Ofcom Administration Fee Openreach % £3m 0.15 0.14 0.0 % 0.0 % 0.1 % 0.0 % 0.0 % 9.4 % 9.4 % 0.1 % 0.1 %Openreach sales product management % £14m 1.30 1.20 0.3 % 0.3 % 0.6 % 0.3 % 0.3 % 6.0 % 6.0 % 0.4 % 0.4 %Optical Ethernet Electronics Capital £/circuit 1,440.57 - - - - - - - - - - -Co-mingling power & Vent % £68m - - - - 62.0 % - - - - - -Co-mingling set up £/room 1,491.87 - - - - 16.4 % - - - - - -Co-mingling rentals £/hostel 29.82 - - - - 16.0 % - - - - - -OR Service centre - Provision WLA % £17m - - - - 0.0 % - - - - - -OR Project Services % £8m - - - - - - - - - 98.9 % 98.9 %OR Service Centre - Assurance WLA % £16m - - - - 0.8 % - - - - - -OR Service Centre - Provision Ethernet % £6m - - - - - - - - - - -OR Systems & Development - Ethernet £/le 24.07 3.62 3.62 - - - - - - - - -Routeing & Records £/line 3.03 - - - - - - - - - - -SLG Ethernet Assurance External % £0m - - - - - - - - - - -SLG Ethernet Assurance Internal % £0m - - - - - - - - - - -SLG Ethernet Provision External % £15m - - - - - - - - - - -SLG Ethernet Provision Internal % £20m - - - - - - - - - - -Wholesale Extension Services Fibre £/le 1,792.70 - - - - - - - - - - -PIMR Costs % £605m 34.75 34.75 - - - - - - - - -Revenue Receivables % £43m 1.52 1.41 0.4 % 0.4 % 0.7 % 0.4 % 0.4 % 84.6 % 84.6 % 0.6 % 0.6 %Rounding - - 0.1 % 0.1 % (0.1)% 0.1 % 0.1 % - - (0.1)% (0.1)%Fully Allocated Cost (£ or %) 68.45 68.11 100.0 % 100.0 % 100.0 % 100.0 % 100.0 % 100.0 % 100.0 % 100.0 % 100.0 %
Volume (units) 10,608 4,727 (ux) (ux) (ux) (ux) (ux) (ux) (ux) (ux) (ux)
Fully Allocated Cost (£m) 0.7 0.3 4.0 2.1 0.7 0.8 0.1 0.0 0.0 1.3 0.3
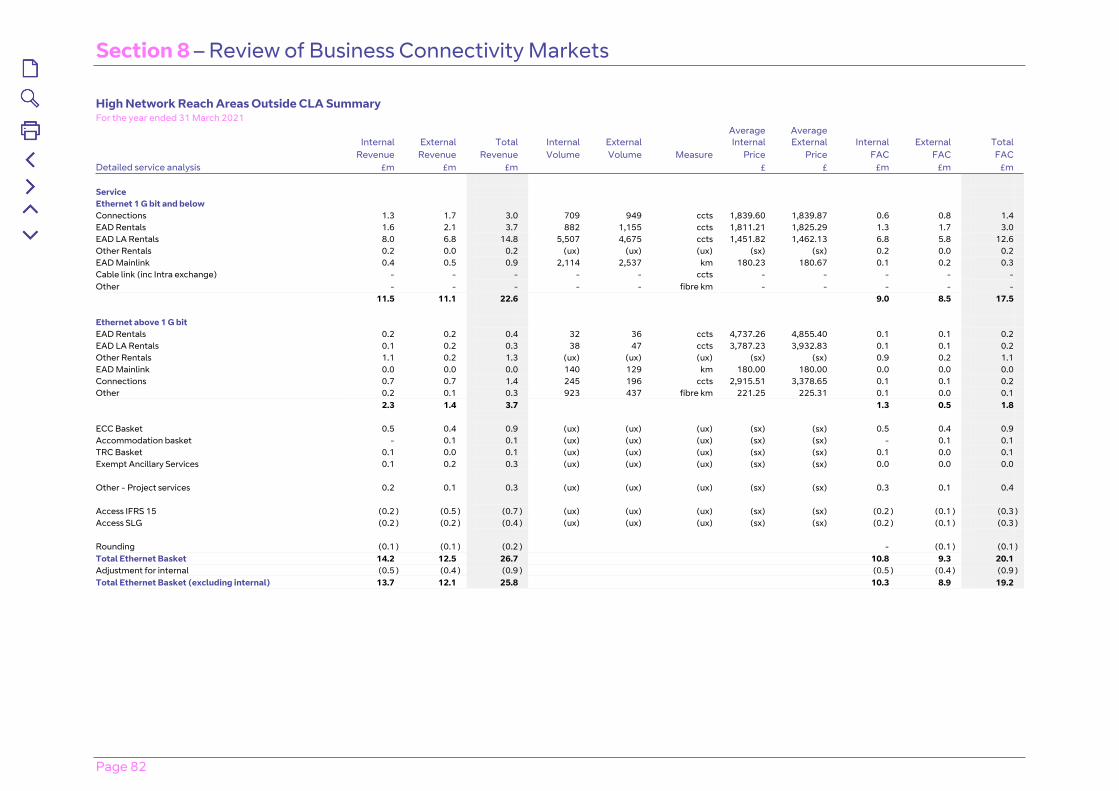
Section 8 – Review of Business Connectivity Markets
Page 82
High Network Reach Areas Outside CLA Summary For the year ended 31 March 2021
Internal External Total Internal External Average Internal
Average External Internal External Total
Revenue Revenue Revenue Volume Volume Measure Price Price FAC FAC FAC Detailed service analysis £m £m £m £ £ £m £m £m Service Ethernet 1 G bit and below Connections 1.3 1.7 3.0 709 949 ccts 1,839.60 1,839.87 0.6 0.8 1.4 EAD Rentals 1.6 2.1 3.7 882 1,155 ccts 1,811.21 1,825.29 1.3 1.7 3.0 EAD LA Rentals 8.0 6.8 14.8 5,507 4,675 ccts 1,451.82 1,462.13 6.8 5.8 12.6 Other Rentals 0.2 0.0 0.2 (ux) (ux) (ux) (sx) (sx) 0.2 0.0 0.2 EAD Mainlink 0.4 0.5 0.9 2,114 2,537 km 180.23 180.67 0.1 0.2 0.3 Cable link (inc Intra exchange) - - - - - ccts - - - - - Other - - - - - fibre km - - - - - 11.5 11.1 22.6 9.0 8.5 17.5 Ethernet above 1 G bit EAD Rentals 0.2 0.2 0.4 32 36 ccts 4,737.26 4,855.40 0.1 0.1 0.2 EAD LA Rentals 0.1 0.2 0.3 38 47 ccts 3,787.23 3,932.83 0.1 0.1 0.2 Other Rentals 1.1 0.2 1.3 (ux) (ux) (ux) (sx) (sx) 0.9 0.2 1.1 EAD Mainlink 0.0 0.0 0.0 140 129 km 180.00 180.00 0.0 0.0 0.0 Connections 0.7 0.7 1.4 245 196 ccts 2,915.51 3,378.65 0.1 0.1 0.2 Other 0.2 0.1 0.3 923 437 fibre km 221.25 225.31 0.1 0.0 0.1 2.3 1.4 3.7 1.3 0.5 1.8 ECC Basket 0.5 0.4 0.9 (ux) (ux) (ux) (sx) (sx) 0.5 0.4 0.9 Accommodation basket - 0.1 0.1 (ux) (ux) (ux) (sx) (sx) - 0.1 0.1 TRC Basket 0.1 0.0 0.1 (ux) (ux) (ux) (sx) (sx) 0.1 0.0 0.1 Exempt Ancillary Services 0.1 0.2 0.3 (ux) (ux) (ux) (sx) (sx) 0.0 0.0 0.0 Other - Project services 0.2 0.1 0.3 (ux) (ux) (ux) (sx) (sx) 0.3 0.1 0.4 Access IFRS 15 (0.2 ) (0.5 ) (0.7 ) (ux) (ux) (ux) (sx) (sx) (0.2 ) (0.1 ) (0.3 )Access SLG (0.2 ) (0.2 ) (0.4 ) (ux) (ux) (ux) (sx) (sx) (0.2 ) (0.1 ) (0.3 ) Rounding (0.1 ) (0.1 ) (0.2 ) - (0.1 ) (0.1 )Total Ethernet Basket 14.2 12.5 26.7 10.8 9.3 20.1 Adjustment for internal (0.5 ) (0.4 ) (0.9 ) (0.5 ) (0.4 ) (0.9 )Total Ethernet Basket (excluding internal) 13.7 12.1 25.8 10.3 8.9 19.2
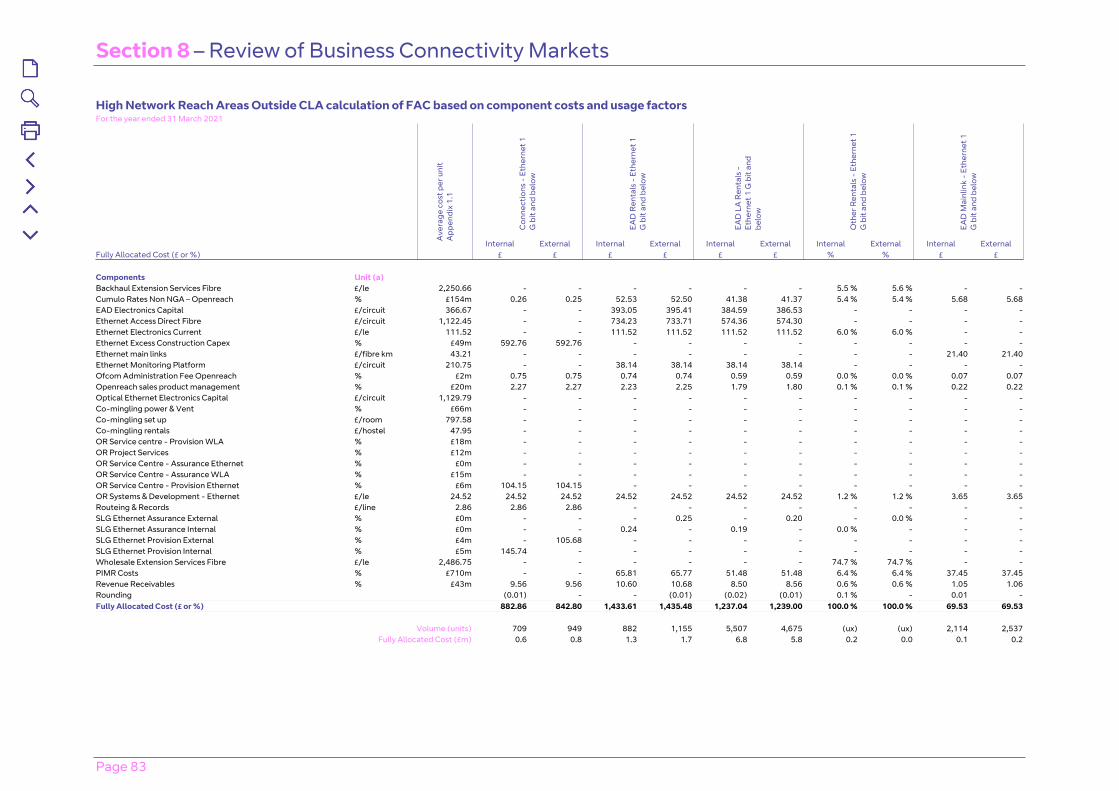
Section 8 – Review of Business Connectivity Markets
Page 83
High Network Reach Areas Outside CLA calculation of FAC based on component costs and usage factorsFor the year ended 31 March 2021
Con
nect
ions
- E
ther
net 1
G
bit
and
belo
w
EAD
Ren
tals
- E
ther
net 1
G
bit
and
belo
w
EAD
LA
Ren
tals
-
Ethe
rnet
1 G
bit
and
belo
w
Oth
er R
enta
ls -
Eth
erne
t 1
G b
it an
d be
low
EAD
Mai
nlin
k -
Ethe
rnet
1
G b
it an
d be
low
Ave
rage
cos
t per
uni
t A
ppen
dix
1.1
Internal External Internal External Internal External Internal External Internal ExternalFully Allocated Cost (£ or %) £ £ £ £ £ £ % % £ £ Components Unit (a) Backhaul Extension Services Fibre £/le 2,250.66 - - - - - - 5.5 % 5.6 % - -Cumulo Rates Non NGA – Openreach % £154m 0.26 0.25 52.53 52.50 41.38 41.37 5.4 % 5.4 % 5.68 5.68EAD Electronics Capital £/circuit 366.67 - - 393.05 395.41 384.59 386.53 - - - -Ethernet Access Direct Fibre £/circuit 1,122.45 - - 734.23 733.71 574.36 574.30 - - - -Ethernet Electronics Current £/le 111.52 - - 111.52 111.52 111.52 111.52 6.0 % 6.0 % - -Ethernet Excess Construction Capex % £49m 592.76 592.76 - - - - - - - -Ethernet main links £/fibre km 43.21 - - - - - - - - 21.40 21.40Ethernet Monitoring Platform £/circuit 210.75 - - 38.14 38.14 38.14 38.14 - - - -Ofcom Administration Fee Openreach % £2m 0.75 0.75 0.74 0.74 0.59 0.59 0.0 % 0.0 % 0.07 0.07Openreach sales product management % £20m 2.27 2.27 2.23 2.25 1.79 1.80 0.1 % 0.1 % 0.22 0.22Optical Ethernet Electronics Capital £/circuit 1,129.79 - - - - - - - - - -Co-mingling power & Vent % £66m - - - - - - - - - -Co-mingling set up £/room 797.58 - - - - - - - - - -Co-mingling rentals £/hostel 47.95 - - - - - - - - - -OR Service centre - Provision WLA % £18m - - - - - - - - - -OR Project Services % £12m - - - - - - - - - -OR Service Centre - Assurance Ethernet % £0m - - - - - - - - - -OR Service Centre - Assurance WLA % £15m - - - - - - - - - -OR Service Centre - Provision Ethernet % £6m 104.15 104.15 - - - - - - - -OR Systems & Development - Ethernet £/le 24.52 24.52 24.52 24.52 24.52 24.52 24.52 1.2 % 1.2 % 3.65 3.65Routeing & Records £/line 2.86 2.86 2.86 - - - - - - - -SLG Ethernet Assurance External % £0m - - - 0.25 - 0.20 - 0.0 % - -SLG Ethernet Assurance Internal % £0m - - 0.24 - 0.19 - 0.0 % - - -SLG Ethernet Provision External % £4m - 105.68 - - - - - - - -SLG Ethernet Provision Internal % £5m 145.74 - - - - - - - - -Wholesale Extension Services Fibre £/le 2,486.75 - - - - - - 74.7 % 74.7 % - -PIMR Costs % £710m - - 65.81 65.77 51.48 51.48 6.4 % 6.4 % 37.45 37.45Revenue Receivables % £43m 9.56 9.56 10.60 10.68 8.50 8.56 0.6 % 0.6 % 1.05 1.06Rounding (0.01) - - (0.01) (0.02) (0.01) 0.1 % - 0.01 -Fully Allocated Cost (£ or %) 882.86 842.80 1,433.61 1,435.48 1,237.04 1,239.00 100.0 % 100.0 % 69.53 69.53
Volume (units) 709 949 882 1,155 5,507 4,675 (ux) (ux) 2,114 2,537
Fully Allocated Cost (£m) 0.6 0.8 1.3 1.7 6.8 5.8 0.2 0.0 0.1 0.2
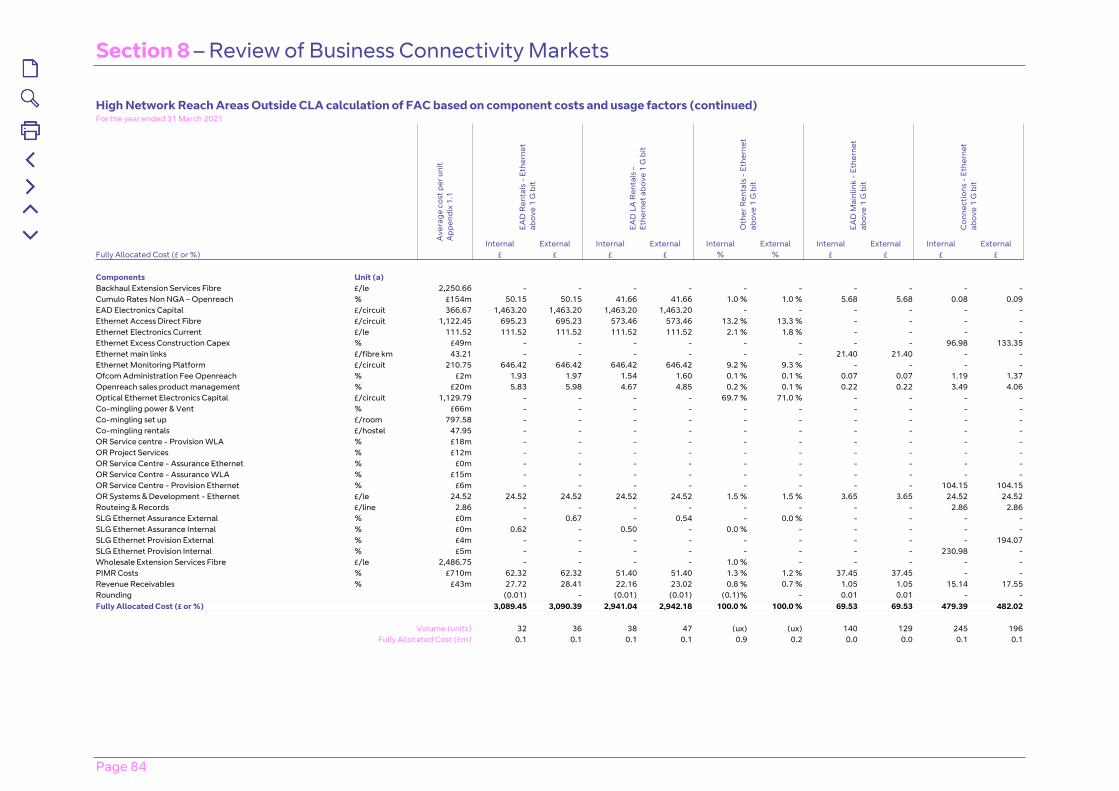
Section 8 – Review of Business Connectivity Markets
Page 84
High Network Reach Areas Outside CLA calculation of FAC based on component costs and usage factors (continued)For the year ended 31 March 2021
EAD
Ren
tals
- E
ther
net
abov
e 1
G b
it
EAD
LA
Ren
tals
-
Ethe
rnet
abo
ve 1
G b
it
Oth
er R
enta
ls -
Eth
erne
t ab
ove
1 G
bit
EAD
Mai
nlin
k -
Ethe
rnet
ab
ove
1 G
bit
Con
nect
ions
- E
ther
net
abov
e 1
G b
it
Ave
rage
cos
t per
uni
t A
ppen
dix
1.1
Internal External Internal External Internal External Internal External Internal ExternalFully Allocated Cost (£ or %) £ £ £ £ % % £ £ £ £ Components Unit (a) Backhaul Extension Services Fibre £/le 2,250.66 - - - - - - - - - -Cumulo Rates Non NGA – Openreach % £154m 50.15 50.15 41.66 41.66 1.0 % 1.0 % 5.68 5.68 0.08 0.09EAD Electronics Capital £/circuit 366.67 1,463.20 1,463.20 1,463.20 1,463.20 - - - - - -Ethernet Access Direct Fibre £/circuit 1,122.45 695.23 695.23 573.46 573.46 13.2 % 13.3 % - - - -Ethernet Electronics Current £/le 111.52 111.52 111.52 111.52 111.52 2.1 % 1.8 % - - - -Ethernet Excess Construction Capex % £49m - - - - - - - - 96.98 133.35Ethernet main links £/fibre km 43.21 - - - - - - 21.40 21.40 - -Ethernet Monitoring Platform £/circuit 210.75 646.42 646.42 646.42 646.42 9.2 % 9.3 % - - - -Ofcom Administration Fee Openreach % £2m 1.93 1.97 1.54 1.60 0.1 % 0.1 % 0.07 0.07 1.19 1.37Openreach sales product management % £20m 5.83 5.98 4.67 4.85 0.2 % 0.1 % 0.22 0.22 3.49 4.06Optical Ethernet Electronics Capital £/circuit 1,129.79 - - - - 69.7 % 71.0 % - - - -Co-mingling power & Vent % £66m - - - - - - - - - -Co-mingling set up £/room 797.58 - - - - - - - - - -Co-mingling rentals £/hostel 47.95 - - - - - - - - - -OR Service centre - Provision WLA % £18m - - - - - - - - - -OR Project Services % £12m - - - - - - - - - -OR Service Centre - Assurance Ethernet % £0m - - - - - - - - - -OR Service Centre - Assurance WLA % £15m - - - - - - - - - -OR Service Centre - Provision Ethernet % £6m - - - - - - - - 104.15 104.15OR Systems & Development - Ethernet £/le 24.52 24.52 24.52 24.52 24.52 1.5 % 1.5 % 3.65 3.65 24.52 24.52Routeing & Records £/line 2.86 - - - - - - - - 2.86 2.86SLG Ethernet Assurance External % £0m - 0.67 - 0.54 - 0.0 % - - - -SLG Ethernet Assurance Internal % £0m 0.62 - 0.50 - 0.0 % - - - - -SLG Ethernet Provision External % £4m - - - - - - - - - 194.07SLG Ethernet Provision Internal % £5m - - - - - - - - 230.98 -Wholesale Extension Services Fibre £/le 2,486.75 - - - - 1.0 % - - - - -PIMR Costs % £710m 62.32 62.32 51.40 51.40 1.3 % 1.2 % 37.45 37.45 - -Revenue Receivables % £43m 27.72 28.41 22.16 23.02 0.8 % 0.7 % 1.05 1.05 15.14 17.55Rounding (0.01) - (0.01) (0.01) (0.1)% - 0.01 0.01 - -Fully Allocated Cost (£ or %) 3,089.45 3,090.39 2,941.04 2,942.18 100.0 % 100.0 % 69.53 69.53 479.39 482.02
Volume (units) 32 36 38 47 (ux) (ux) 140 129 245 196
Fully Allocated Cost (£m) 0.1 0.1 0.1 0.1 0.9 0.2 0.0 0.0 0.1 0.1
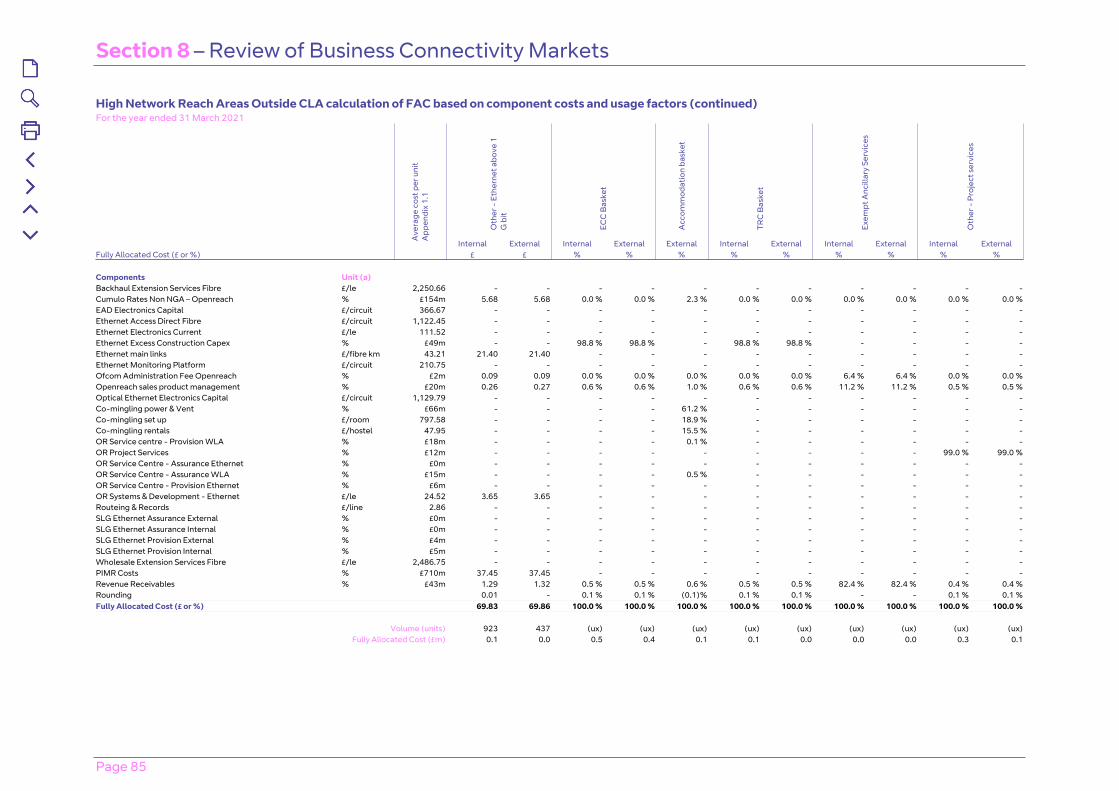
Section 8 – Review of Business Connectivity Markets
Page 85
High Network Reach Areas Outside CLA calculation of FAC based on component costs and usage factors (continued)For the year ended 31 March 2021
Oth
er -
Eth
erne
t abo
ve 1
G
bit
ECC
Bas
ket
Acc
omm
odat
ion
bask
et
TRC
Bas
ket
Exem
pt A
ncill
ary
Serv
ices
Oth
er -
Pro
ject
ser
vice
s
Ave
rage
cos
t per
uni
t A
ppen
dix
1.1
Internal External Internal External External Internal External Internal External Internal ExternalFully Allocated Cost (£ or %) £ £ % % % % % % % % %
Components Unit (a)Backhaul Extension Services Fibre £/le 2,250.66 - - - - - - - - - - -Cumulo Rates Non NGA – Openreach % £154m 5.68 5.68 0.0 % 0.0 % 2.3 % 0.0 % 0.0 % 0.0 % 0.0 % 0.0 % 0.0 %EAD Electronics Capital £/circuit 366.67 - - - - - - - - - - -Ethernet Access Direct Fibre £/circuit 1,122.45 - - - - - - - - - - -Ethernet Electronics Current £/le 111.52 - - - - - - - - - - -Ethernet Excess Construction Capex % £49m - - 98.8 % 98.8 % - 98.8 % 98.8 % - - - -Ethernet main links £/fibre km 43.21 21.40 21.40 - - - - - - - - -Ethernet Monitoring Platform £/circuit 210.75 - - - - - - - - - - -Ofcom Administration Fee Openreach % £2m 0.09 0.09 0.0 % 0.0 % 0.0 % 0.0 % 0.0 % 6.4 % 6.4 % 0.0 % 0.0 %Openreach sales product management % £20m 0.26 0.27 0.6 % 0.6 % 1.0 % 0.6 % 0.6 % 11.2 % 11.2 % 0.5 % 0.5 %Optical Ethernet Electronics Capital £/circuit 1,129.79 - - - - - - - - - - -Co-mingling power & Vent % £66m - - - - 61.2 % - - - - - -Co-mingling set up £/room 797.58 - - - - 18.9 % - - - - - -Co-mingling rentals £/hostel 47.95 - - - - 15.5 % - - - - - -OR Service centre - Provision WLA % £18m - - - - 0.1 % - - - - - -OR Project Services % £12m - - - - - - - - - 99.0 % 99.0 %OR Service Centre - Assurance Ethernet % £0m - - - - - - - - - - -OR Service Centre - Assurance WLA % £15m - - - - 0.5 % - - - - - -OR Service Centre - Provision Ethernet % £6m - - - - - - - - - - -OR Systems & Development - Ethernet £/le 24.52 3.65 3.65 - - - - - - - - -Routeing & Records £/line 2.86 - - - - - - - - - - -SLG Ethernet Assurance External % £0m - - - - - - - - - - -SLG Ethernet Assurance Internal % £0m - - - - - - - - - - -SLG Ethernet Provision External % £4m - - - - - - - - - - -SLG Ethernet Provision Internal % £5m - - - - - - - - - - -Wholesale Extension Services Fibre £/le 2,486.75 - - - - - - - - - - -PIMR Costs % £710m 37.45 37.45 - - - - - - - - -Revenue Receivables % £43m 1.29 1.32 0.5 % 0.5 % 0.6 % 0.5 % 0.5 % 82.4 % 82.4 % 0.4 % 0.4 %Rounding 0.01 - 0.1 % 0.1 % (0.1)% 0.1 % 0.1 % - - 0.1 % 0.1 %Fully Allocated Cost (£ or %) 69.83 69.86 100.0 % 100.0 % 100.0 % 100.0 % 100.0 % 100.0 % 100.0 % 100.0 % 100.0 %
Volume (units) 923 437 (ux) (ux) (ux) (ux) (ux) (ux) (ux) (ux) (ux)Fully Allocated Cost (£m) 0.1 0.0 0.5 0.4 0.1 0.1 0.0 0.0 0.0 0.3 0.1
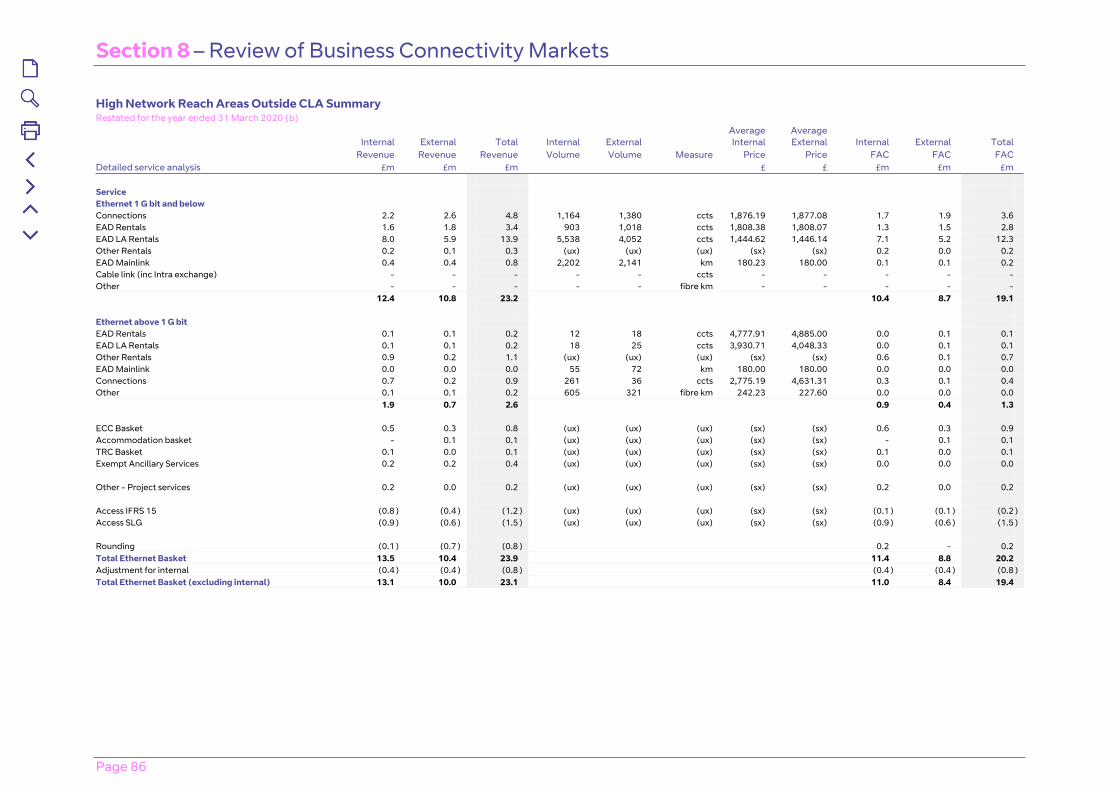
Section 8 – Review of Business Connectivity Markets
Page 86
High Network Reach Areas Outside CLA Summary Restated for the year ended 31 March 2020 (b)
Internal External Total Internal External Average Internal
Average External Internal External Total
Revenue Revenue Revenue Volume Volume Measure Price Price FAC FAC FAC Detailed service analysis £m £m £m £ £ £m £m £m Service Ethernet 1 G bit and below Connections 2.2 2.6 4.8 1,164 1,380 ccts 1,876.19 1,877.08 1.7 1.9 3.6 EAD Rentals 1.6 1.8 3.4 903 1,018 ccts 1,808.38 1,808.07 1.3 1.5 2.8 EAD LA Rentals 8.0 5.9 13.9 5,538 4,052 ccts 1,444.62 1,446.14 7.1 5.2 12.3 Other Rentals 0.2 0.1 0.3 (ux) (ux) (ux) (sx) (sx) 0.2 0.0 0.2 EAD Mainlink 0.4 0.4 0.8 2,202 2,141 km 180.23 180.00 0.1 0.1 0.2 Cable link (inc Intra exchange) - - - - - ccts - - - - - Other - - - - - fibre km - - - - - 12.4 10.8 23.2 10.4 8.7 19.1 Ethernet above 1 G bit EAD Rentals 0.1 0.1 0.2 12 18 ccts 4,777.91 4,885.00 0.0 0.1 0.1 EAD LA Rentals 0.1 0.1 0.2 18 25 ccts 3,930.71 4,048.33 0.0 0.1 0.1 Other Rentals 0.9 0.2 1.1 (ux) (ux) (ux) (sx) (sx) 0.6 0.1 0.7 EAD Mainlink 0.0 0.0 0.0 55 72 km 180.00 180.00 0.0 0.0 0.0 Connections 0.7 0.2 0.9 261 36 ccts 2,775.19 4,631.31 0.3 0.1 0.4 Other 0.1 0.1 0.2 605 321 fibre km 242.23 227.60 0.0 0.0 0.0 1.9 0.7 2.6 0.9 0.4 1.3 ECC Basket 0.5 0.3 0.8 (ux) (ux) (ux) (sx) (sx) 0.6 0.3 0.9 Accommodation basket - 0.1 0.1 (ux) (ux) (ux) (sx) (sx) - 0.1 0.1 TRC Basket 0.1 0.0 0.1 (ux) (ux) (ux) (sx) (sx) 0.1 0.0 0.1 Exempt Ancillary Services 0.2 0.2 0.4 (ux) (ux) (ux) (sx) (sx) 0.0 0.0 0.0 Other - Project services 0.2 0.0 0.2 (ux) (ux) (ux) (sx) (sx) 0.2 0.0 0.2 Access IFRS 15 (0.8 ) (0.4 ) (1.2 ) (ux) (ux) (ux) (sx) (sx) (0.1 ) (0.1 ) (0.2 )Access SLG (0.9 ) (0.6 ) (1.5 ) (ux) (ux) (ux) (sx) (sx) (0.9 ) (0.6 ) (1.5 ) Rounding (0.1 ) (0.7 ) (0.8 ) 0.2 - 0.2 Total Ethernet Basket 13.5 10.4 23.9 11.4 8.8 20.2 Adjustment for internal (0.4 ) (0.4 ) (0.8 ) (0.4 ) (0.4 ) (0.8 )Total Ethernet Basket (excluding internal) 13.1 10.0 23.1 11.0 8.4 19.4
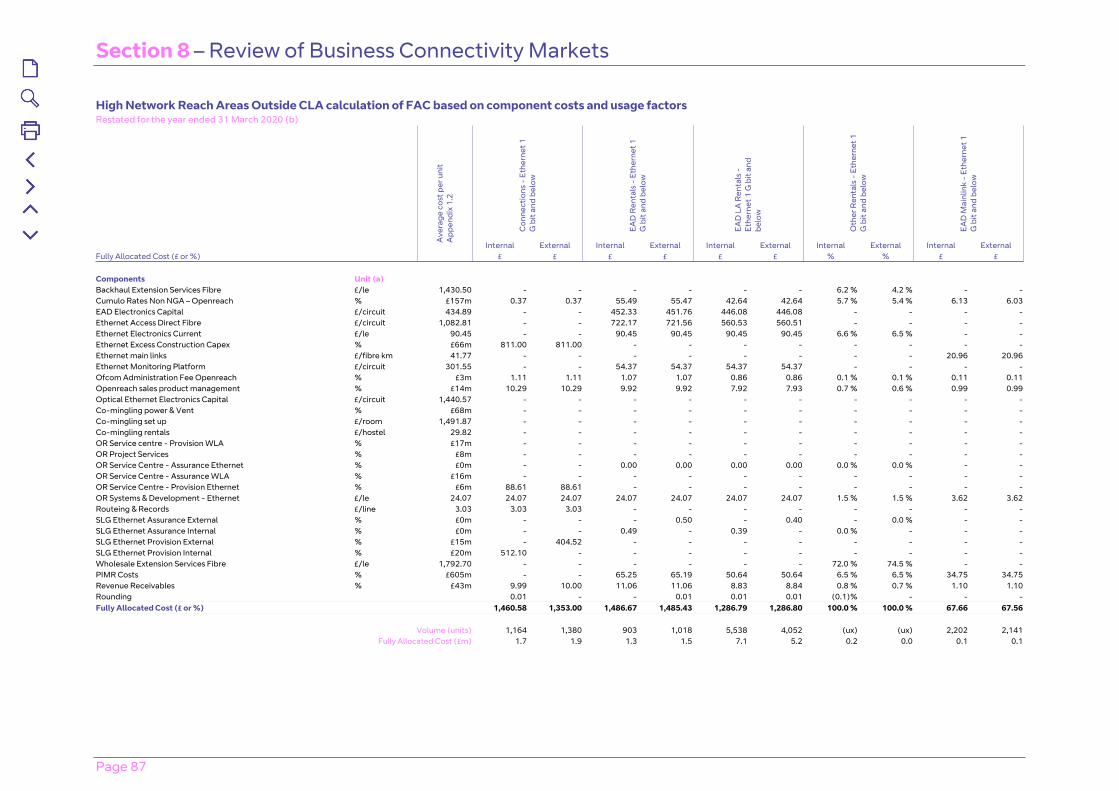
Section 8 – Review of Business Connectivity Markets
Page 87
High Network Reach Areas Outside CLA calculation of FAC based on component costs and usage factorsRestated for the year ended 31 March 2020 (b)
Con
nect
ions
- E
ther
net 1
G
bit
and
belo
w
EAD
Ren
tals
- E
ther
net 1
G
bit
and
belo
w
EAD
LA
Ren
tals
-
Ethe
rnet
1 G
bit
and
belo
w
Oth
er R
enta
ls -
Eth
erne
t 1
G b
it an
d be
low
EAD
Mai
nlin
k -
Ethe
rnet
1
G b
it an
d be
low
Ave
rage
cos
t per
uni
t A
ppen
dix
1.2
Internal External Internal External Internal External Internal External Internal ExternalFully Allocated Cost (£ or %) £ £ £ £ £ £ % % £ £ Components Unit (a) Backhaul Extension Services Fibre £/le 1,430.50 - - - - - - 6.2 % 4.2 % - -Cumulo Rates Non NGA – Openreach % £157m 0.37 0.37 55.49 55.47 42.64 42.64 5.7 % 5.4 % 6.13 6.03EAD Electronics Capital £/circuit 434.89 - - 452.33 451.76 446.08 446.08 - - - -Ethernet Access Direct Fibre £/circuit 1,082.81 - - 722.17 721.56 560.53 560.51 - - - -Ethernet Electronics Current £/le 90.45 - - 90.45 90.45 90.45 90.45 6.6 % 6.5 % - -Ethernet Excess Construction Capex % £66m 811.00 811.00 - - - - - - - -Ethernet main links £/fibre km 41.77 - - - - - - - - 20.96 20.96Ethernet Monitoring Platform £/circuit 301.55 - - 54.37 54.37 54.37 54.37 - - - -Ofcom Administration Fee Openreach % £3m 1.11 1.11 1.07 1.07 0.86 0.86 0.1 % 0.1 % 0.11 0.11Openreach sales product management % £14m 10.29 10.29 9.92 9.92 7.92 7.93 0.7 % 0.6 % 0.99 0.99Optical Ethernet Electronics Capital £/circuit 1,440.57 - - - - - - - - - -Co-mingling power & Vent % £68m - - - - - - - - - -Co-mingling set up £/room 1,491.87 - - - - - - - - - -Co-mingling rentals £/hostel 29.82 - - - - - - - - - -OR Service centre - Provision WLA % £17m - - - - - - - - - -OR Project Services % £8m - - - - - - - - - -OR Service Centre - Assurance Ethernet % £0m - - 0.00 0.00 0.00 0.00 0.0 % 0.0 % - -OR Service Centre - Assurance WLA % £16m - - - - - - - - - -OR Service Centre - Provision Ethernet % £6m 88.61 88.61 - - - - - - - -OR Systems & Development - Ethernet £/le 24.07 24.07 24.07 24.07 24.07 24.07 24.07 1.5 % 1.5 % 3.62 3.62Routeing & Records £/line 3.03 3.03 3.03 - - - - - - - -SLG Ethernet Assurance External % £0m - - - 0.50 - 0.40 - 0.0 % - -SLG Ethernet Assurance Internal % £0m - - 0.49 - 0.39 - 0.0 % - - -SLG Ethernet Provision External % £15m - 404.52 - - - - - - - -SLG Ethernet Provision Internal % £20m 512.10 - - - - - - - - -Wholesale Extension Services Fibre £/le 1,792.70 - - - - - - 72.0 % 74.5 % - -PIMR Costs % £605m - - 65.25 65.19 50.64 50.64 6.5 % 6.5 % 34.75 34.75Revenue Receivables % £43m 9.99 10.00 11.06 11.06 8.83 8.84 0.8 % 0.7 % 1.10 1.10Rounding 0.01 - - 0.01 0.01 0.01 (0.1)% - - -Fully Allocated Cost (£ or %) 1,460.58 1,353.00 1,486.67 1,485.43 1,286.79 1,286.80 100.0 % 100.0 % 67.66 67.56
Volume (units) 1,164 1,380 903 1,018 5,538 4,052 (ux) (ux) 2,202 2,141
Fully Allocated Cost (£m) 1.7 1.9 1.3 1.5 7.1 5.2 0.2 0.0 0.1 0.1
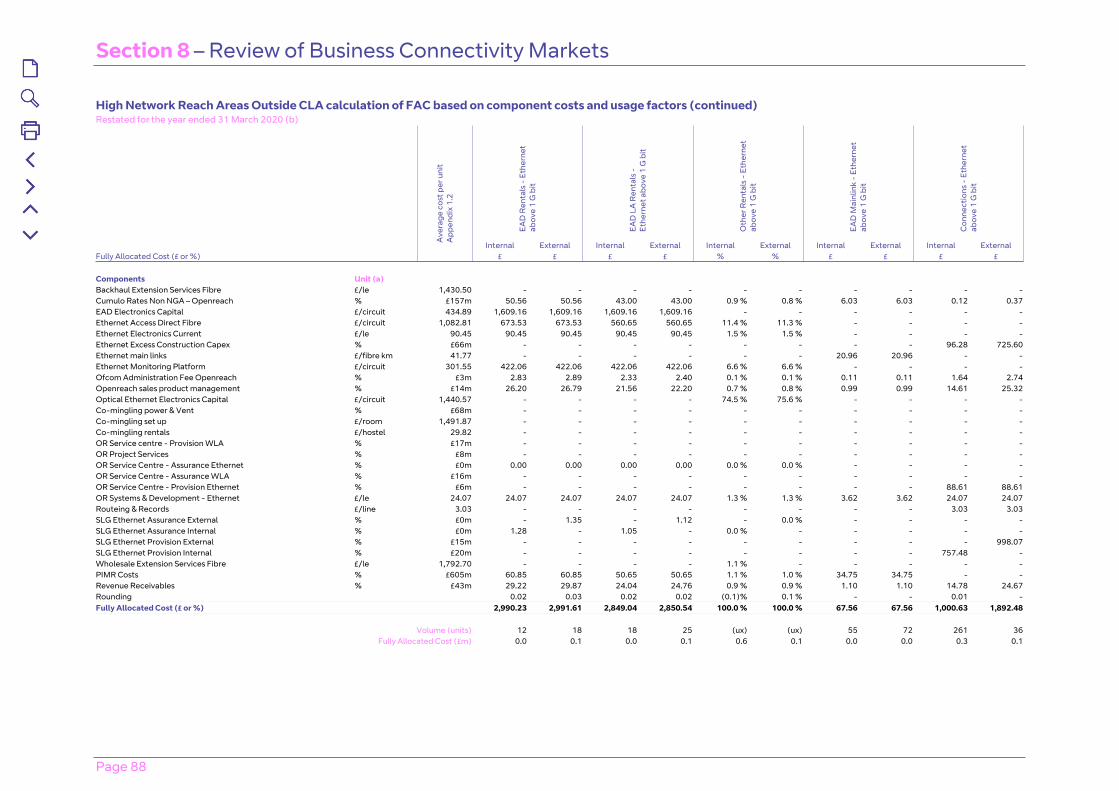
Section 8 – Review of Business Connectivity Markets
Page 88
High Network Reach Areas Outside CLA calculation of FAC based on component costs and usage factors (continued)Restated for the year ended 31 March 2020 (b)
EAD
Ren
tals
- E
ther
net
abov
e 1
G b
it
EAD
LA
Ren
tals
-
Ethe
rnet
abo
ve 1
G b
it
Oth
er R
enta
ls -
Eth
erne
t ab
ove
1 G
bit
EAD
Mai
nlin
k -
Ethe
rnet
ab
ove
1 G
bit
Con
nect
ions
- E
ther
net
abov
e 1
G b
it
Ave
rage
cos
t per
uni
t A
ppen
dix
1.2
Internal External Internal External Internal External Internal External Internal ExternalFully Allocated Cost (£ or %) £ £ £ £ % % £ £ £ £ Components Unit (a) Backhaul Extension Services Fibre £/le 1,430.50 - - - - - - - - - -Cumulo Rates Non NGA – Openreach % £157m 50.56 50.56 43.00 43.00 0.9 % 0.8 % 6.03 6.03 0.12 0.37EAD Electronics Capital £/circuit 434.89 1,609.16 1,609.16 1,609.16 1,609.16 - - - - - -Ethernet Access Direct Fibre £/circuit 1,082.81 673.53 673.53 560.65 560.65 11.4 % 11.3 % - - - -Ethernet Electronics Current £/le 90.45 90.45 90.45 90.45 90.45 1.5 % 1.5 % - - - -Ethernet Excess Construction Capex % £66m - - - - - - - - 96.28 725.60Ethernet main links £/fibre km 41.77 - - - - - - 20.96 20.96 - -Ethernet Monitoring Platform £/circuit 301.55 422.06 422.06 422.06 422.06 6.6 % 6.6 % - - - -Ofcom Administration Fee Openreach % £3m 2.83 2.89 2.33 2.40 0.1 % 0.1 % 0.11 0.11 1.64 2.74Openreach sales product management % £14m 26.20 26.79 21.56 22.20 0.7 % 0.8 % 0.99 0.99 14.61 25.32Optical Ethernet Electronics Capital £/circuit 1,440.57 - - - - 74.5 % 75.6 % - - - -Co-mingling power & Vent % £68m - - - - - - - - - -Co-mingling set up £/room 1,491.87 - - - - - - - - - -Co-mingling rentals £/hostel 29.82 - - - - - - - - - -OR Service centre - Provision WLA % £17m - - - - - - - - - -OR Project Services % £8m - - - - - - - - - -OR Service Centre - Assurance Ethernet % £0m 0.00 0.00 0.00 0.00 0.0 % 0.0 % - - - -OR Service Centre - Assurance WLA % £16m - - - - - - - - - -OR Service Centre - Provision Ethernet % £6m - - - - - - - - 88.61 88.61OR Systems & Development - Ethernet £/le 24.07 24.07 24.07 24.07 24.07 1.3 % 1.3 % 3.62 3.62 24.07 24.07Routeing & Records £/line 3.03 - - - - - - - - 3.03 3.03SLG Ethernet Assurance External % £0m - 1.35 - 1.12 - 0.0 % - - - -SLG Ethernet Assurance Internal % £0m 1.28 - 1.05 - 0.0 % - - - - -SLG Ethernet Provision External % £15m - - - - - - - - - 998.07SLG Ethernet Provision Internal % £20m - - - - - - - - 757.48 -Wholesale Extension Services Fibre £/le 1,792.70 - - - - 1.1 % - - - - -PIMR Costs % £605m 60.85 60.85 50.65 50.65 1.1 % 1.0 % 34.75 34.75 - -Revenue Receivables % £43m 29.22 29.87 24.04 24.76 0.9 % 0.9 % 1.10 1.10 14.78 24.67Rounding 0.02 0.03 0.02 0.02 (0.1)% 0.1 % - - 0.01 -Fully Allocated Cost (£ or %) 2,990.23 2,991.61 2,849.04 2,850.54 100.0 % 100.0 % 67.56 67.56 1,000.63 1,892.48
Volume (units) 12 18 18 25 (ux) (ux) 55 72 261 36
Fully Allocated Cost (£m) 0.0 0.1 0.0 0.1 0.6 0.1 0.0 0.0 0.3 0.1
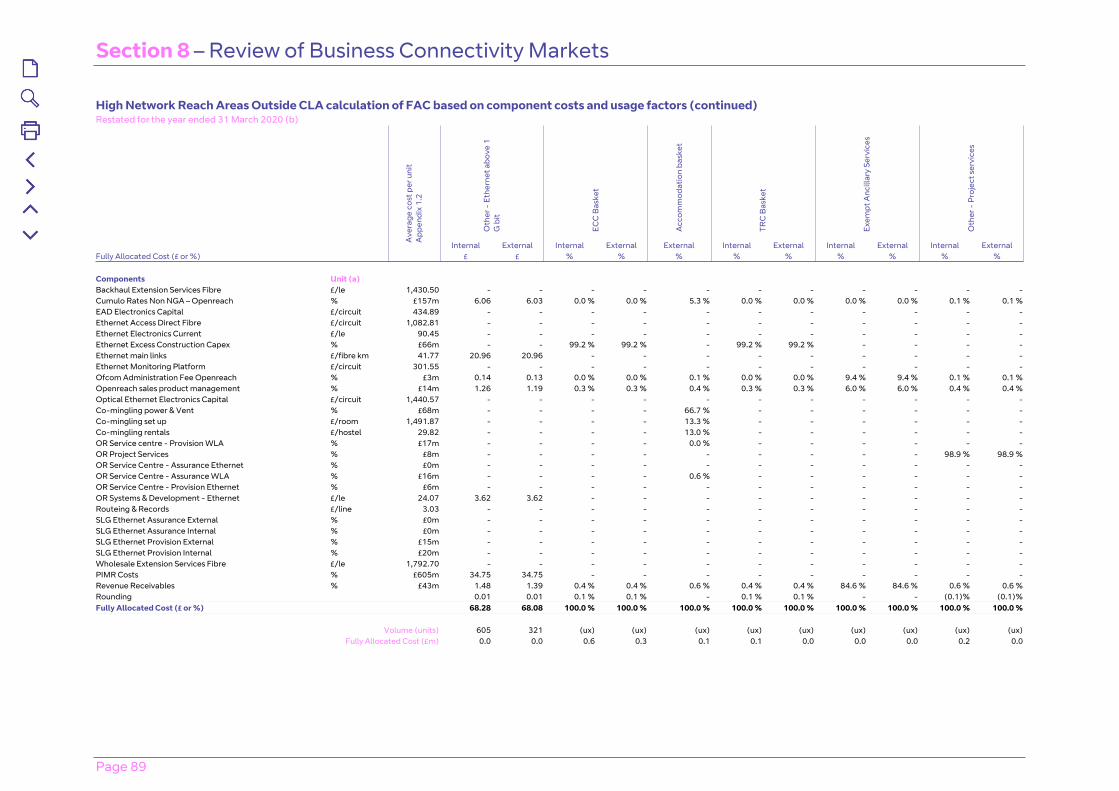
Section 8 – Review of Business Connectivity Markets
Page 89
High Network Reach Areas Outside CLA calculation of FAC based on component costs and usage factors (continued)Restated for the year ended 31 March 2020 (b)
Oth
er -
Eth
erne
t abo
ve 1
G
bit
ECC
Bas
ket
Acc
omm
odat
ion
bask
et
TRC
Bas
ket
Exem
pt A
ncill
ary
Serv
ices
Oth
er -
Pro
ject
ser
vice
s
Ave
rage
cos
t per
uni
t A
ppen
dix
1.2
Internal External Internal External External Internal External Internal External Internal ExternalFully Allocated Cost (£ or %) £ £ % % % % % % % % % Components Unit (a) Backhaul Extension Services Fibre £/le 1,430.50 - - - - - - - - - - -Cumulo Rates Non NGA – Openreach % £157m 6.06 6.03 0.0 % 0.0 % 5.3 % 0.0 % 0.0 % 0.0 % 0.0 % 0.1 % 0.1 %EAD Electronics Capital £/circuit 434.89 - - - - - - - - - - -Ethernet Access Direct Fibre £/circuit 1,082.81 - - - - - - - - - - -Ethernet Electronics Current £/le 90.45 - - - - - - - - - - -Ethernet Excess Construction Capex % £66m - - 99.2 % 99.2 % - 99.2 % 99.2 % - - - -Ethernet main links £/fibre km 41.77 20.96 20.96 - - - - - - - - -Ethernet Monitoring Platform £/circuit 301.55 - - - - - - - - - - -Ofcom Administration Fee Openreach % £3m 0.14 0.13 0.0 % 0.0 % 0.1 % 0.0 % 0.0 % 9.4 % 9.4 % 0.1 % 0.1 %Openreach sales product management % £14m 1.26 1.19 0.3 % 0.3 % 0.4 % 0.3 % 0.3 % 6.0 % 6.0 % 0.4 % 0.4 %Optical Ethernet Electronics Capital £/circuit 1,440.57 - - - - - - - - - - -Co-mingling power & Vent % £68m - - - - 66.7 % - - - - - -Co-mingling set up £/room 1,491.87 - - - - 13.3 % - - - - - -Co-mingling rentals £/hostel 29.82 - - - - 13.0 % - - - - - -OR Service centre - Provision WLA % £17m - - - - 0.0 % - - - - - -OR Project Services % £8m - - - - - - - - - 98.9 % 98.9 %OR Service Centre - Assurance Ethernet % £0m - - - - - - - - - - -OR Service Centre - Assurance WLA % £16m - - - - 0.6 % - - - - - -OR Service Centre - Provision Ethernet % £6m - - - - - - - - - - -OR Systems & Development - Ethernet £/le 24.07 3.62 3.62 - - - - - - - - -Routeing & Records £/line 3.03 - - - - - - - - - - -SLG Ethernet Assurance External % £0m - - - - - - - - - - -SLG Ethernet Assurance Internal % £0m - - - - - - - - - - -SLG Ethernet Provision External % £15m - - - - - - - - - - -SLG Ethernet Provision Internal % £20m - - - - - - - - - - -Wholesale Extension Services Fibre £/le 1,792.70 - - - - - - - - - - -PIMR Costs % £605m 34.75 34.75 - - - - - - - - -Revenue Receivables % £43m 1.48 1.39 0.4 % 0.4 % 0.6 % 0.4 % 0.4 % 84.6 % 84.6 % 0.6 % 0.6 %Rounding 0.01 0.01 0.1 % 0.1 % - 0.1 % 0.1 % - - (0.1)% (0.1)%Fully Allocated Cost (£ or %) 68.28 68.08 100.0 % 100.0 % 100.0 % 100.0 % 100.0 % 100.0 % 100.0 % 100.0 % 100.0 %
Volume (units) 605 321 (ux) (ux) (ux) (ux) (ux) (ux) (ux) (ux) (ux)
Fully Allocated Cost (£m) 0.0 0.0 0.6 0.3 0.1 0.1 0.0 0.0 0.0 0.2 0.0
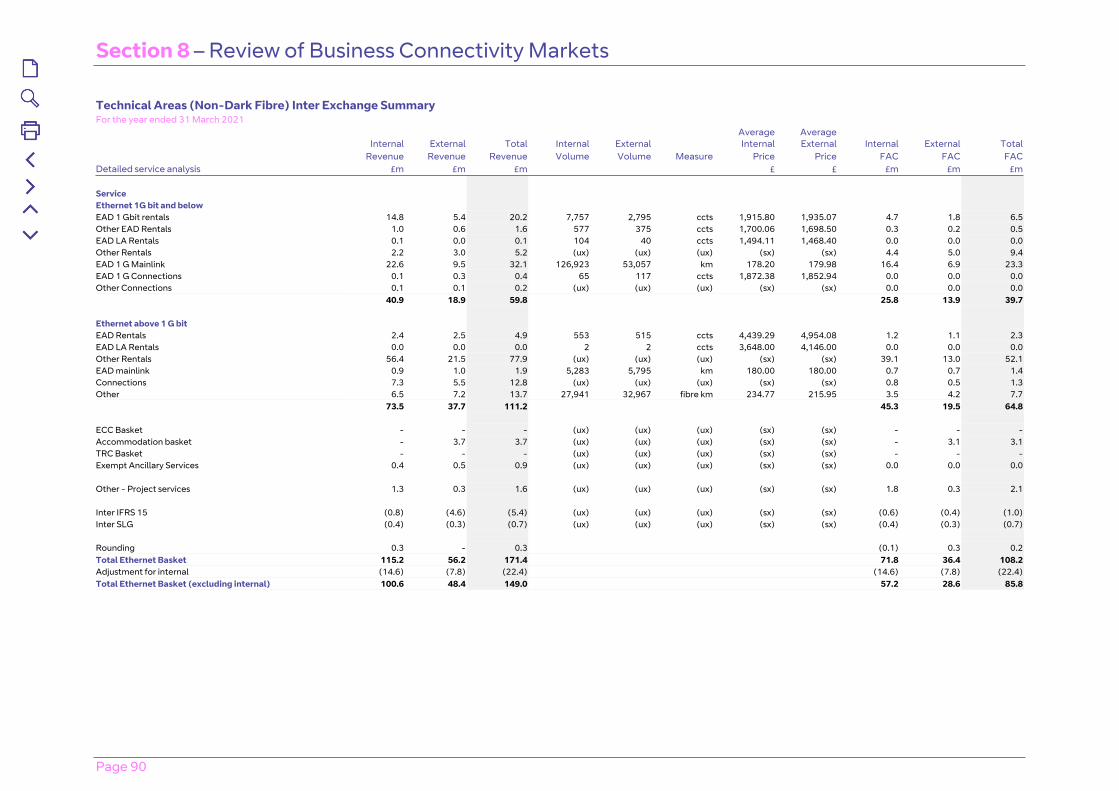
Section 8 – Review of Business Connectivity Markets
Page 90
Technical Areas (Non-Dark Fibre) Inter Exchange SummaryFor the year ended 31 March 2021
Internal External Total Internal External Average Internal
Average External Internal External Total
Revenue Revenue Revenue Volume Volume Measure Price Price FAC FAC FACDetailed service analysis £m £m £m £ £ £m £m £m Service Ethernet 1G bit and below EAD 1 Gbit rentals 14.8 5.4 20.2 7,757 2,795 ccts 1,915.80 1,935.07 4.7 1.8 6.5Other EAD Rentals 1.0 0.6 1.6 577 375 ccts 1,700.06 1,698.50 0.3 0.2 0.5EAD LA Rentals 0.1 0.0 0.1 104 40 ccts 1,494.11 1,468.40 0.0 0.0 0.0Other Rentals 2.2 3.0 5.2 (ux) (ux) (ux) (sx) (sx) 4.4 5.0 9.4EAD 1 G Mainlink 22.6 9.5 32.1 126,923 53,057 km 178.20 179.98 16.4 6.9 23.3EAD 1 G Connections 0.1 0.3 0.4 65 117 ccts 1,872.38 1,852.94 0.0 0.0 0.0Other Connections 0.1 0.1 0.2 (ux) (ux) (ux) (sx) (sx) 0.0 0.0 0.0 40.9 18.9 59.8 25.8 13.9 39.7 Ethernet above 1 G bit EAD Rentals 2.4 2.5 4.9 553 515 ccts 4,439.29 4,954.08 1.2 1.1 2.3EAD LA Rentals 0.0 0.0 0.0 2 2 ccts 3,648.00 4,146.00 0.0 0.0 0.0Other Rentals 56.4 21.5 77.9 (ux) (ux) (ux) (sx) (sx) 39.1 13.0 52.1EAD mainlink 0.9 1.0 1.9 5,283 5,795 km 180.00 180.00 0.7 0.7 1.4Connections 7.3 5.5 12.8 (ux) (ux) (ux) (sx) (sx) 0.8 0.5 1.3Other 6.5 7.2 13.7 27,941 32,967 fibre km 234.77 215.95 3.5 4.2 7.7 73.5 37.7 111.2 45.3 19.5 64.8 ECC Basket - - - (ux) (ux) (ux) (sx) (sx) - - -Accommodation basket - 3.7 3.7 (ux) (ux) (ux) (sx) (sx) - 3.1 3.1TRC Basket - - - (ux) (ux) (ux) (sx) (sx) - - -Exempt Ancillary Services 0.4 0.5 0.9 (ux) (ux) (ux) (sx) (sx) 0.0 0.0 0.0 Other - Project services 1.3 0.3 1.6 (ux) (ux) (ux) (sx) (sx) 1.8 0.3 2.1 Inter IFRS 15 (0.8) (4.6) (5.4) (ux) (ux) (ux) (sx) (sx) (0.6) (0.4) (1.0)Inter SLG (0.4) (0.3) (0.7) (ux) (ux) (ux) (sx) (sx) (0.4) (0.3) (0.7) Rounding 0.3 - 0.3 (0.1) 0.3 0.2Total Ethernet Basket 115.2 56.2 171.4 71.8 36.4 108.2Adjustment for internal (14.6) (7.8) (22.4) (14.6) (7.8) (22.4)Total Ethernet Basket (excluding internal) 100.6 48.4 149.0 57.2 28.6 85.8
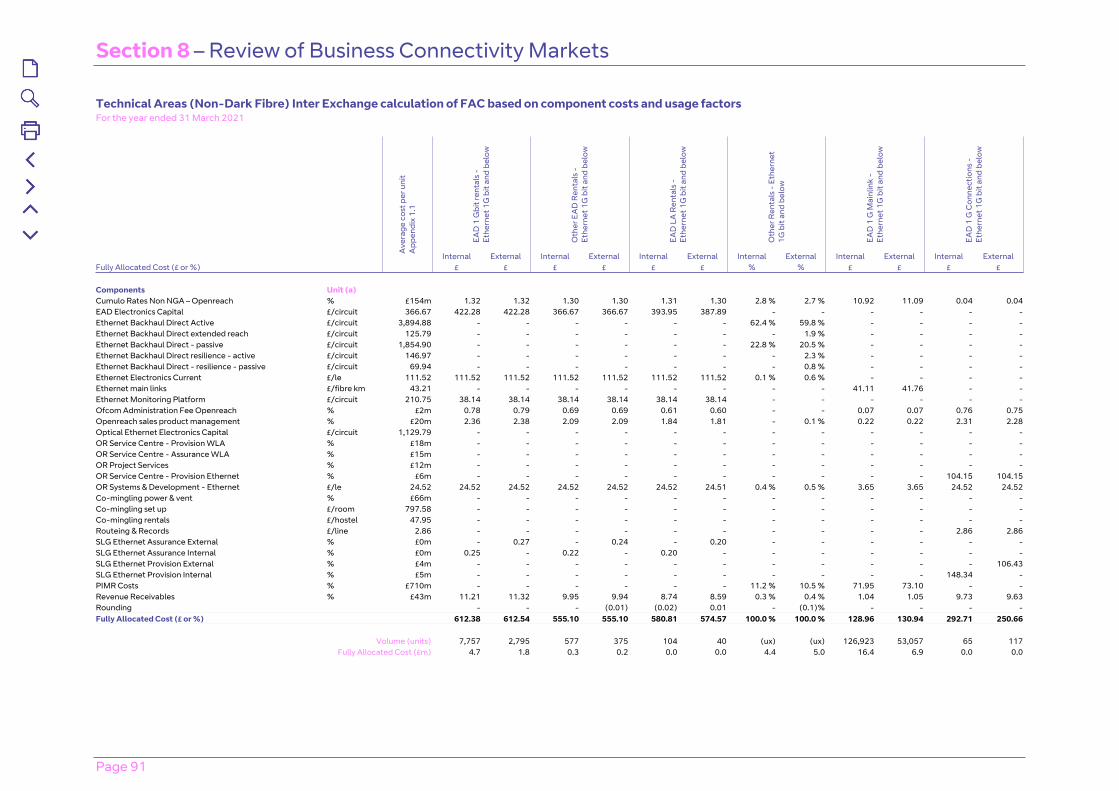
Section 8 – Review of Business Connectivity Markets
Page 91
Technical Areas (Non-Dark Fibre) Inter Exchange calculation of FAC based on component costs and usage factorsFor the year ended 31 March 2021
EAD
1 G
bit r
enta
ls -
Et
hern
et 1
G b
it an
d be
low
Oth
er E
AD
Ren
tals
-
Ethe
rnet
1G
bit
and
belo
w
EAD
LA
Ren
tals
-
Ethe
rnet
1G
bit
and
belo
w
Oth
er R
enta
ls -
Eth
erne
t 1G
bit
and
belo
w
EAD
1 G
Mai
nlin
k -
Ethe
rnet
1G
bit
and
belo
w
EAD
1 G
Con
nect
ions
-
Ethe
rnet
1G
bit
and
belo
w
Ave
rage
cos
t per
uni
t A
ppen
dix
1.1
Internal External Internal External Internal External Internal External Internal External Internal ExternalFully Allocated Cost (£ or %) £ £ £ £ £ £ % % £ £ £ £ Components Unit (a) Cumulo Rates Non NGA – Openreach % £154m 1.32 1.32 1.30 1.30 1.31 1.30 2.8 % 2.7 % 10.92 11.09 0.04 0.04EAD Electronics Capital £/circuit 366.67 422.28 422.28 366.67 366.67 393.95 387.89 - - - - - -Ethernet Backhaul Direct Active £/circuit 3,894.88 - - - - - - 62.4 % 59.8 % - - - -Ethernet Backhaul Direct extended reach £/circuit 125.79 - - - - - - - 1.9 % - - - -Ethernet Backhaul Direct - passive £/circuit 1,854.90 - - - - - - 22.8 % 20.5 % - - - -Ethernet Backhaul Direct resilience - active £/circuit 146.97 - - - - - - - 2.3 % - - - -Ethernet Backhaul Direct - resilience - passive £/circuit 69.94 - - - - - - - 0.8 % - - - -Ethernet Electronics Current £/le 111.52 111.52 111.52 111.52 111.52 111.52 111.52 0.1 % 0.6 % - - - -Ethernet main links £/fibre km 43.21 - - - - - - - - 41.11 41.76 - -Ethernet Monitoring Platform £/circuit 210.75 38.14 38.14 38.14 38.14 38.14 38.14 - - - - - -Ofcom Administration Fee Openreach % £2m 0.78 0.79 0.69 0.69 0.61 0.60 - - 0.07 0.07 0.76 0.75Openreach sales product management % £20m 2.36 2.38 2.09 2.09 1.84 1.81 - 0.1 % 0.22 0.22 2.31 2.28Optical Ethernet Electronics Capital £/circuit 1,129.79 - - - - - - - - - - - -OR Service Centre - Provision WLA % £18m - - - - - - - - - - - -OR Service Centre - Assurance WLA % £15m - - - - - - - - - - - -OR Project Services % £12m - - - - - - - - - - - -OR Service Centre - Provision Ethernet % £6m - - - - - - - - - - 104.15 104.15OR Systems & Development - Ethernet £/le 24.52 24.52 24.52 24.52 24.52 24.52 24.51 0.4 % 0.5 % 3.65 3.65 24.52 24.52Co-mingling power & vent % £66m - - - - - - - - - - - -Co-mingling set up £/room 797.58 - - - - - - - - - - - -Co-mingling rentals £/hostel 47.95 - - - - - - - - - - - -Routeing & Records £/line 2.86 - - - - - - - - - - 2.86 2.86SLG Ethernet Assurance External % £0m - 0.27 - 0.24 - 0.20 - - - - - -SLG Ethernet Assurance Internal % £0m 0.25 - 0.22 - 0.20 - - - - - - -SLG Ethernet Provision External % £4m - - - - - - - - - - - 106.43SLG Ethernet Provision Internal % £5m - - - - - - - - - - 148.34 -PIMR Costs % £710m - - - - - - 11.2 % 10.5 % 71.95 73.10 - -Revenue Receivables % £43m 11.21 11.32 9.95 9.94 8.74 8.59 0.3 % 0.4 % 1.04 1.05 9.73 9.63Rounding - - - (0.01) (0.02) 0.01 - (0.1)% - - - -Fully Allocated Cost (£ or %) 612.38 612.54 555.10 555.10 580.81 574.57 100.0 % 100.0 % 128.96 130.94 292.71 250.66
Volume (units) 7,757 2,795 577 375 104 40 (ux) (ux) 126,923 53,057 65 117
Fully Allocated Cost (£m) 4.7 1.8 0.3 0.2 0.0 0.0 4.4 5.0 16.4 6.9 0.0 0.0
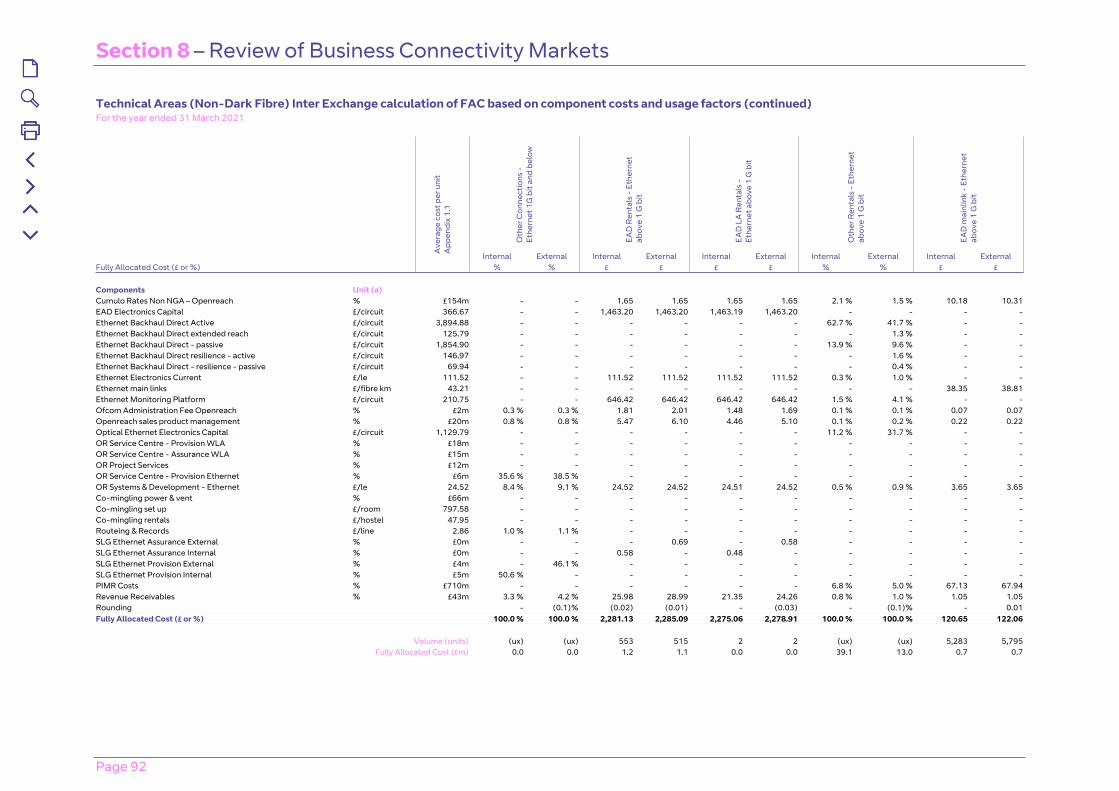
Section 8 – Review of Business Connectivity Markets
Page 92
Technical Areas (Non-Dark Fibre) Inter Exchange calculation of FAC based on component costs and usage factors (continued)For the year ended 31 March 2021
Oth
er C
onne
ctio
ns -
Et
hern
et 1
G b
it an
d be
low
EAD
Ren
tals
- E
ther
net
abov
e 1
G b
it
EAD
LA
Ren
tals
-
Ethe
rnet
abo
ve 1
G b
it
Oth
er R
enta
ls -
Eth
erne
t ab
ove
1 G
bit
EAD
mai
nlin
k -
Ethe
rnet
ab
ove
1 G
bit
Ave
rage
cos
t per
uni
t A
ppen
dix
1.1
Internal External Internal External Internal External Internal External Internal ExternalFully Allocated Cost (£ or %) % % £ £ £ £ % % £ £ Components Unit (a) Cumulo Rates Non NGA – Openreach % £154m - - 1.65 1.65 1.65 1.65 2.1 % 1.5 % 10.18 10.31EAD Electronics Capital £/circuit 366.67 - - 1,463.20 1,463.20 1,463.19 1,463.20 - - - -Ethernet Backhaul Direct Active £/circuit 3,894.88 - - - - - - 62.7 % 41.7 % - -Ethernet Backhaul Direct extended reach £/circuit 125.79 - - - - - - - 1.3 % - -Ethernet Backhaul Direct - passive £/circuit 1,854.90 - - - - - - 13.9 % 9.6 % - -Ethernet Backhaul Direct resilience - active £/circuit 146.97 - - - - - - - 1.6 % - -Ethernet Backhaul Direct - resilience - passive £/circuit 69.94 - - - - - - - 0.4 % - -Ethernet Electronics Current £/le 111.52 - - 111.52 111.52 111.52 111.52 0.3 % 1.0 % - -Ethernet main links £/fibre km 43.21 - - - - - - - - 38.35 38.81Ethernet Monitoring Platform £/circuit 210.75 - - 646.42 646.42 646.42 646.42 1.5 % 4.1 % - -Ofcom Administration Fee Openreach % £2m 0.3 % 0.3 % 1.81 2.01 1.48 1.69 0.1 % 0.1 % 0.07 0.07Openreach sales product management % £20m 0.8 % 0.8 % 5.47 6.10 4.46 5.10 0.1 % 0.2 % 0.22 0.22Optical Ethernet Electronics Capital £/circuit 1,129.79 - - - - - - 11.2 % 31.7 % - -OR Service Centre - Provision WLA % £18m - - - - - - - - - -OR Service Centre - Assurance WLA % £15m - - - - - - - - - -OR Project Services % £12m - - - - - - - - - -OR Service Centre - Provision Ethernet % £6m 35.6 % 38.5 % - - - - - - - -OR Systems & Development - Ethernet £/le 24.52 8.4 % 9.1 % 24.52 24.52 24.51 24.52 0.5 % 0.9 % 3.65 3.65Co-mingling power & vent % £66m - - - - - - - - - -Co-mingling set up £/room 797.58 - - - - - - - - - -Co-mingling rentals £/hostel 47.95 - - - - - - - - - -Routeing & Records £/line 2.86 1.0 % 1.1 % - - - - - - - -SLG Ethernet Assurance External % £0m - - - 0.69 - 0.58 - - - -SLG Ethernet Assurance Internal % £0m - - 0.58 - 0.48 - - - - -SLG Ethernet Provision External % £4m - 46.1 % - - - - - - - -SLG Ethernet Provision Internal % £5m 50.6 % - - - - - - - - -PIMR Costs % £710m - - - - - - 6.8 % 5.0 % 67.13 67.94Revenue Receivables % £43m 3.3 % 4.2 % 25.98 28.99 21.35 24.26 0.8 % 1.0 % 1.05 1.05Rounding - (0.1)% (0.02) (0.01) - (0.03) - (0.1)% - 0.01Fully Allocated Cost (£ or %) 100.0 % 100.0 % 2,281.13 2,285.09 2,275.06 2,278.91 100.0 % 100.0 % 120.65 122.06
Volume (units) (ux) (ux) 553 515 2 2 (ux) (ux) 5,283 5,795
Fully Allocated Cost (£m) 0.0 0.0 1.2 1.1 0.0 0.0 39.1 13.0 0.7 0.7
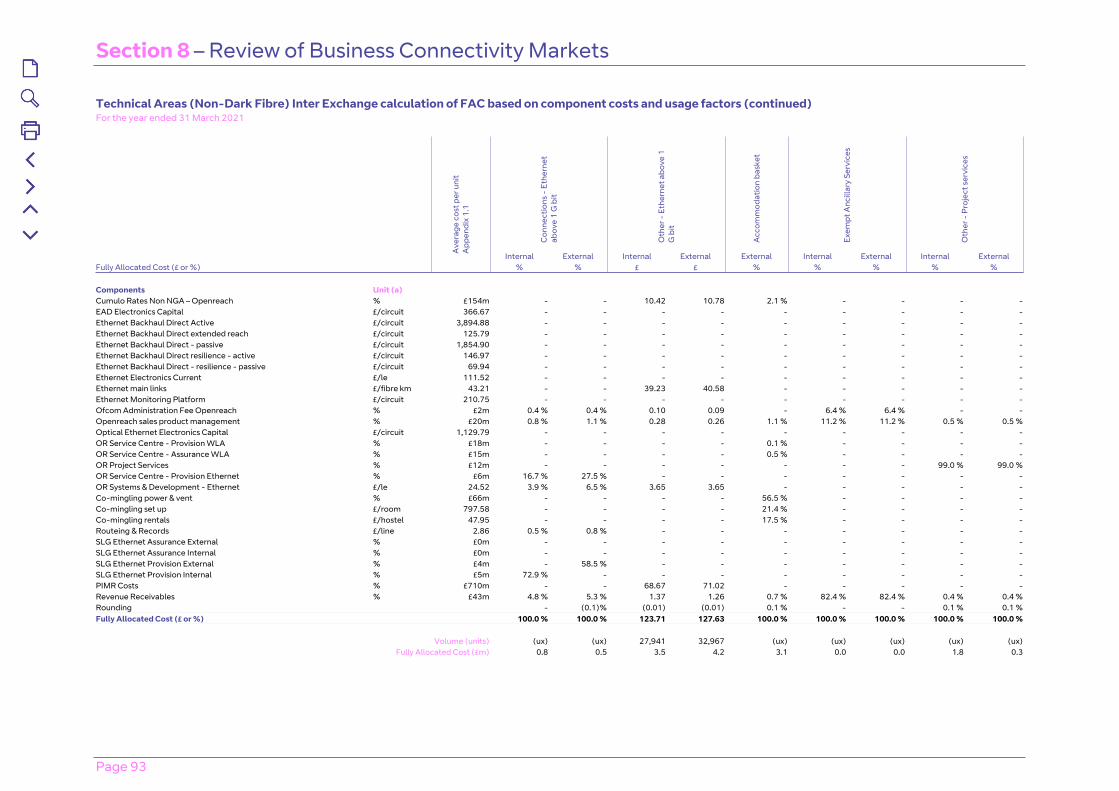
Section 8 – Review of Business Connectivity Markets
Page 93
Technical Areas (Non-Dark Fibre) Inter Exchange calculation of FAC based on component costs and usage factors (continued)For the year ended 31 March 2021
Con
nect
ions
- E
ther
net
abov
e 1
G b
it
Oth
er -
Eth
erne
t abo
ve 1
G
bit
Acc
omm
odat
ion
bask
et
Exem
pt A
ncill
ary
Serv
ices
Oth
er -
Pro
ject
ser
vice
s
Ave
rage
cos
t per
uni
t A
ppen
dix
1.1
Internal External Internal External External Internal External Internal ExternalFully Allocated Cost (£ or %) % % £ £ % % % % % Components Unit (a) Cumulo Rates Non NGA – Openreach % £154m - - 10.42 10.78 2.1 % - - - -EAD Electronics Capital £/circuit 366.67 - - - - - - - - -Ethernet Backhaul Direct Active £/circuit 3,894.88 - - - - - - - - -Ethernet Backhaul Direct extended reach £/circuit 125.79 - - - - - - - - -Ethernet Backhaul Direct - passive £/circuit 1,854.90 - - - - - - - - -Ethernet Backhaul Direct resilience - active £/circuit 146.97 - - - - - - - - -Ethernet Backhaul Direct - resilience - passive £/circuit 69.94 - - - - - - - - -Ethernet Electronics Current £/le 111.52 - - - - - - - - -Ethernet main links £/fibre km 43.21 - - 39.23 40.58 - - - - -Ethernet Monitoring Platform £/circuit 210.75 - - - - - - - - -Ofcom Administration Fee Openreach % £2m 0.4 % 0.4 % 0.10 0.09 - 6.4 % 6.4 % - -Openreach sales product management % £20m 0.8 % 1.1 % 0.28 0.26 1.1 % 11.2 % 11.2 % 0.5 % 0.5 %Optical Ethernet Electronics Capital £/circuit 1,129.79 - - - - - - - - -OR Service Centre - Provision WLA % £18m - - - - 0.1 % - - - -OR Service Centre - Assurance WLA % £15m - - - - 0.5 % - - - -OR Project Services % £12m - - - - - - - 99.0 % 99.0 %OR Service Centre - Provision Ethernet % £6m 16.7 % 27.5 % - - - - - - -OR Systems & Development - Ethernet £/le 24.52 3.9 % 6.5 % 3.65 3.65 - - - - -Co-mingling power & vent % £66m - - - - 56.5 % - - - -Co-mingling set up £/room 797.58 - - - - 21.4 % - - - -Co-mingling rentals £/hostel 47.95 - - - - 17.5 % - - - -Routeing & Records £/line 2.86 0.5 % 0.8 % - - - - - - -SLG Ethernet Assurance External % £0m - - - - - - - - -SLG Ethernet Assurance Internal % £0m - - - - - - - - -SLG Ethernet Provision External % £4m - 58.5 % - - - - - - -SLG Ethernet Provision Internal % £5m 72.9 % - - - - - - - -PIMR Costs % £710m - - 68.67 71.02 - - - - -Revenue Receivables % £43m 4.8 % 5.3 % 1.37 1.26 0.7 % 82.4 % 82.4 % 0.4 % 0.4 %Rounding - (0.1)% (0.01) (0.01) 0.1 % - - 0.1 % 0.1 %Fully Allocated Cost (£ or %) 100.0 % 100.0 % 123.71 127.63 100.0 % 100.0 % 100.0 % 100.0 % 100.0 %
Volume (units) (ux) (ux) 27,941 32,967 (ux) (ux) (ux) (ux) (ux)
Fully Allocated Cost (£m) 0.8 0.5 3.5 4.2 3.1 0.0 0.0 1.8 0.3
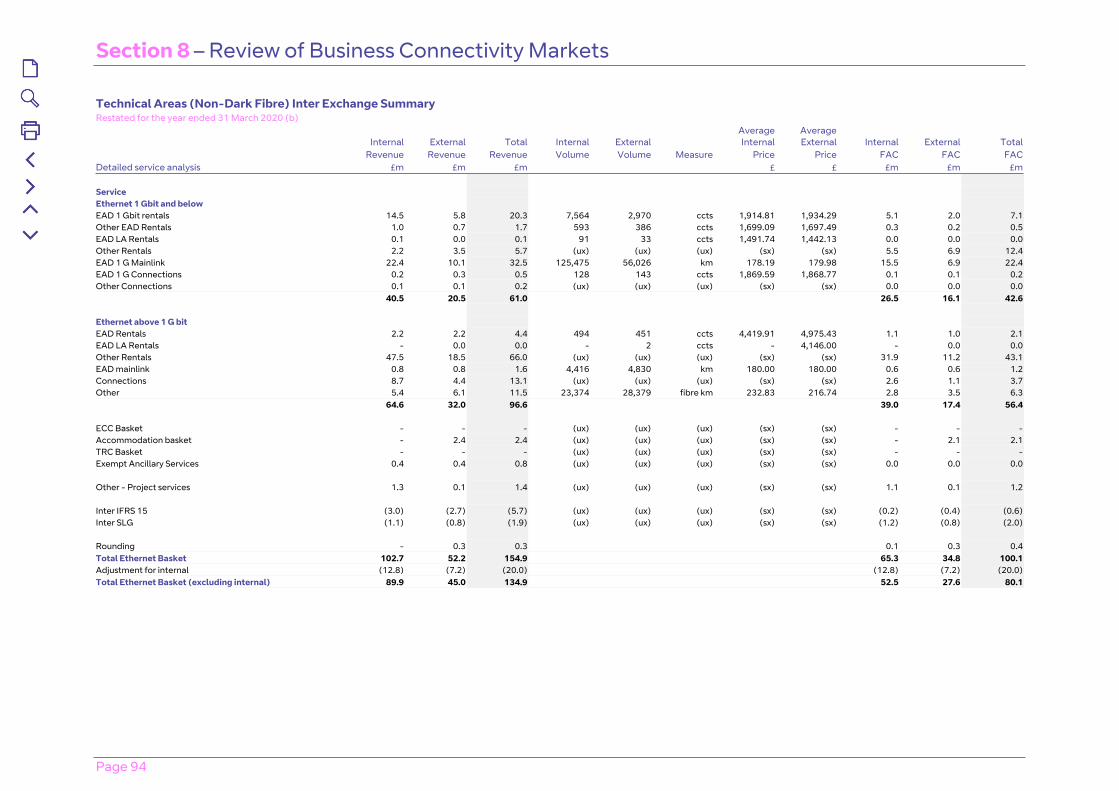
Section 8 – Review of Business Connectivity Markets
Page 94
Technical Areas (Non-Dark Fibre) Inter Exchange SummaryRestated for the year ended 31 March 2020 (b)
Internal External Total Internal External Average Internal
Average External Internal External Total
Revenue Revenue Revenue Volume Volume Measure Price Price FAC FAC FACDetailed service analysis £m £m £m £ £ £m £m £m Service Ethernet 1 Gbit and below EAD 1 Gbit rentals 14.5 5.8 20.3 7,564 2,970 ccts 1,914.81 1,934.29 5.1 2.0 7.1Other EAD Rentals 1.0 0.7 1.7 593 386 ccts 1,699.09 1,697.49 0.3 0.2 0.5EAD LA Rentals 0.1 0.0 0.1 91 33 ccts 1,491.74 1,442.13 0.0 0.0 0.0Other Rentals 2.2 3.5 5.7 (ux) (ux) (ux) (sx) (sx) 5.5 6.9 12.4EAD 1 G Mainlink 22.4 10.1 32.5 125,475 56,026 km 178.19 179.98 15.5 6.9 22.4EAD 1 G Connections 0.2 0.3 0.5 128 143 ccts 1,869.59 1,868.77 0.1 0.1 0.2Other Connections 0.1 0.1 0.2 (ux) (ux) (ux) (sx) (sx) 0.0 0.0 0.0 40.5 20.5 61.0 26.5 16.1 42.6 Ethernet above 1 G bit EAD Rentals 2.2 2.2 4.4 494 451 ccts 4,419.91 4,975.43 1.1 1.0 2.1EAD LA Rentals - 0.0 0.0 - 2 ccts - 4,146.00 - 0.0 0.0Other Rentals 47.5 18.5 66.0 (ux) (ux) (ux) (sx) (sx) 31.9 11.2 43.1EAD mainlink 0.8 0.8 1.6 4,416 4,830 km 180.00 180.00 0.6 0.6 1.2Connections 8.7 4.4 13.1 (ux) (ux) (ux) (sx) (sx) 2.6 1.1 3.7Other 5.4 6.1 11.5 23,374 28,379 fibre km 232.83 216.74 2.8 3.5 6.3 64.6 32.0 96.6 39.0 17.4 56.4 ECC Basket - - - (ux) (ux) (ux) (sx) (sx) - - -Accommodation basket - 2.4 2.4 (ux) (ux) (ux) (sx) (sx) - 2.1 2.1TRC Basket - - - (ux) (ux) (ux) (sx) (sx) - - -Exempt Ancillary Services 0.4 0.4 0.8 (ux) (ux) (ux) (sx) (sx) 0.0 0.0 0.0 Other - Project services 1.3 0.1 1.4 (ux) (ux) (ux) (sx) (sx) 1.1 0.1 1.2 Inter IFRS 15 (3.0) (2.7) (5.7) (ux) (ux) (ux) (sx) (sx) (0.2) (0.4) (0.6)Inter SLG (1.1) (0.8) (1.9) (ux) (ux) (ux) (sx) (sx) (1.2) (0.8) (2.0) Rounding - 0.3 0.3 0.1 0.3 0.4Total Ethernet Basket 102.7 52.2 154.9 65.3 34.8 100.1Adjustment for internal (12.8) (7.2) (20.0) (12.8) (7.2) (20.0)Total Ethernet Basket (excluding internal) 89.9 45.0 134.9 52.5 27.6 80.1
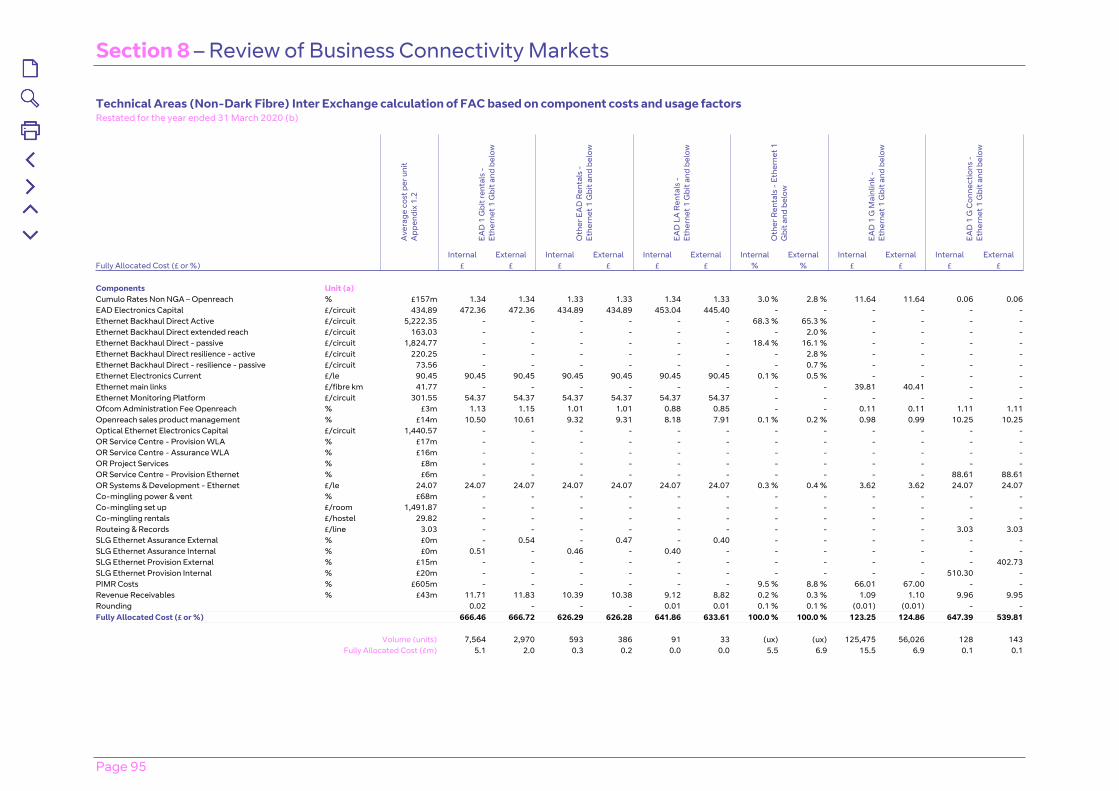
Section 8 – Review of Business Connectivity Markets
Page 95
Technical Areas (Non-Dark Fibre) Inter Exchange calculation of FAC based on component costs and usage factorsRestated for the year ended 31 March 2020 (b)
Ave
rage
cos
t per
uni
t A
ppen
dix
1.2
EAD
1 G
bit r
enta
ls -
Et
hern
et 1
Gbi
t and
bel
ow
Oth
er E
AD
Ren
tals
-
Ethe
rnet
1 G
bit a
nd b
elow
EAD
LA
Ren
tals
-
Ethe
rnet
1 G
bit a
nd b
elow
Oth
er R
enta
ls -
Eth
erne
t 1
Gbi
t and
bel
ow
EAD
1 G
Mai
nlin
k -
Ethe
rnet
1 G
bit a
nd b
elow
EAD
1 G
Con
nect
ions
-
Ethe
rnet
1 G
bit a
nd b
elow
Internal External Internal External Internal External Internal External Internal External Internal ExternalFully Allocated Cost (£ or %) £ £ £ £ £ £ % % £ £ £ £ Components Unit (a) Cumulo Rates Non NGA – Openreach % £157m 1.34 1.34 1.33 1.33 1.34 1.33 3.0 % 2.8 % 11.64 11.64 0.06 0.06EAD Electronics Capital £/circuit 434.89 472.36 472.36 434.89 434.89 453.04 445.40 - - - - - -Ethernet Backhaul Direct Active £/circuit 5,222.35 - - - - - - 68.3 % 65.3 % - - - -Ethernet Backhaul Direct extended reach £/circuit 163.03 - - - - - - - 2.0 % - - - -Ethernet Backhaul Direct - passive £/circuit 1,824.77 - - - - - - 18.4 % 16.1 % - - - -Ethernet Backhaul Direct resilience - active £/circuit 220.25 - - - - - - - 2.8 % - - - -Ethernet Backhaul Direct - resilience - passive £/circuit 73.56 - - - - - - - 0.7 % - - - -Ethernet Electronics Current £/le 90.45 90.45 90.45 90.45 90.45 90.45 90.45 0.1 % 0.5 % - - - -Ethernet main links £/fibre km 41.77 - - - - - - - - 39.81 40.41 - -Ethernet Monitoring Platform £/circuit 301.55 54.37 54.37 54.37 54.37 54.37 54.37 - - - - - -Ofcom Administration Fee Openreach % £3m 1.13 1.15 1.01 1.01 0.88 0.85 - - 0.11 0.11 1.11 1.11Openreach sales product management % £14m 10.50 10.61 9.32 9.31 8.18 7.91 0.1 % 0.2 % 0.98 0.99 10.25 10.25Optical Ethernet Electronics Capital £/circuit 1,440.57 - - - - - - - - - - - -OR Service Centre - Provision WLA % £17m - - - - - - - - - - - -OR Service Centre - Assurance WLA % £16m - - - - - - - - - - - -OR Project Services % £8m - - - - - - - - - - - -OR Service Centre - Provision Ethernet % £6m - - - - - - - - - - 88.61 88.61OR Systems & Development - Ethernet £/le 24.07 24.07 24.07 24.07 24.07 24.07 24.07 0.3 % 0.4 % 3.62 3.62 24.07 24.07Co-mingling power & vent % £68m - - - - - - - - - - - -Co-mingling set up £/room 1,491.87 - - - - - - - - - - - -Co-mingling rentals £/hostel 29.82 - - - - - - - - - - - -Routeing & Records £/line 3.03 - - - - - - - - - - 3.03 3.03SLG Ethernet Assurance External % £0m - 0.54 - 0.47 - 0.40 - - - - - -SLG Ethernet Assurance Internal % £0m 0.51 - 0.46 - 0.40 - - - - - - -SLG Ethernet Provision External % £15m - - - - - - - - - - - 402.73SLG Ethernet Provision Internal % £20m - - - - - - - - - - 510.30 -PIMR Costs % £605m - - - - - - 9.5 % 8.8 % 66.01 67.00 - -Revenue Receivables % £43m 11.71 11.83 10.39 10.38 9.12 8.82 0.2 % 0.3 % 1.09 1.10 9.96 9.95Rounding 0.02 - - - 0.01 0.01 0.1 % 0.1 % (0.01) (0.01) - -Fully Allocated Cost (£ or %) 666.46 666.72 626.29 626.28 641.86 633.61 100.0 % 100.0 % 123.25 124.86 647.39 539.81
Volume (units) 7,564 2,970 593 386 91 33 (ux) (ux) 125,475 56,026 128 143
Fully Allocated Cost (£m) 5.1 2.0 0.3 0.2 0.0 0.0 5.5 6.9 15.5 6.9 0.1 0.1
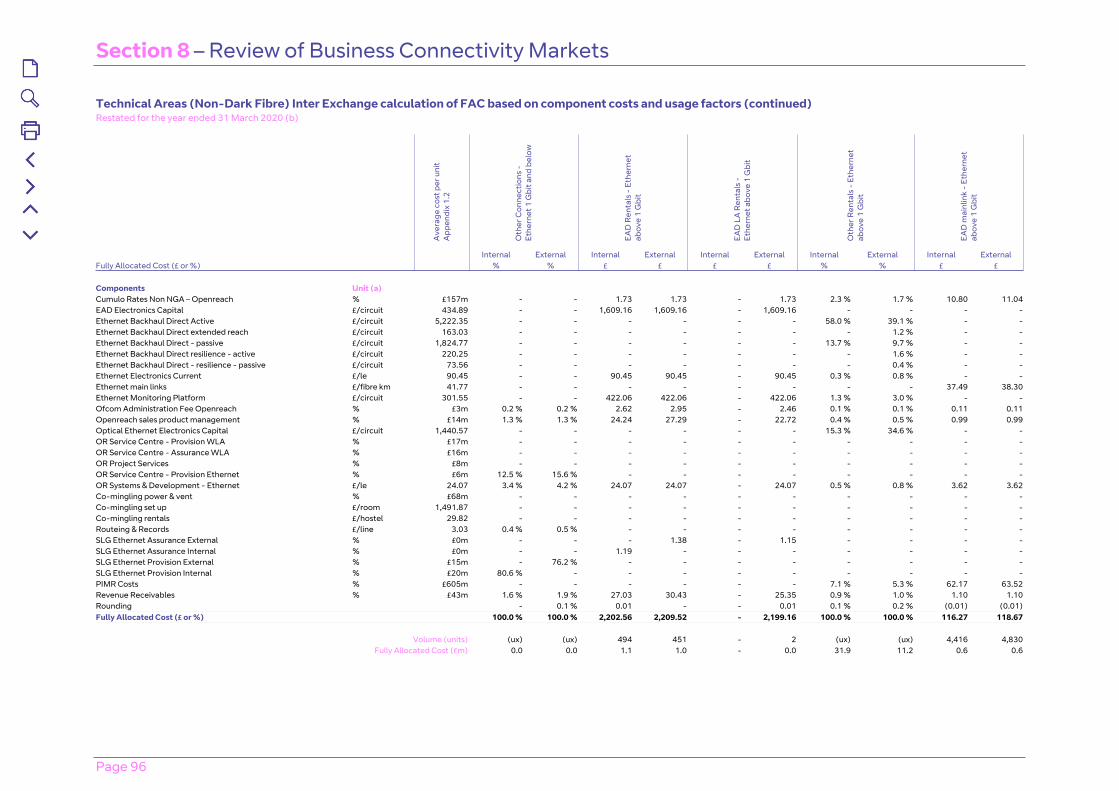
Section 8 – Review of Business Connectivity Markets
Page 96
Technical Areas (Non-Dark Fibre) Inter Exchange calculation of FAC based on component costs and usage factors (continued)Restated for the year ended 31 March 2020 (b)
Ave
rage
cos
t per
uni
t A
ppen
dix
1.2
Oth
er C
onne
ctio
ns -
Et
hern
et 1
Gbi
t and
bel
ow
EAD
Ren
tals
- E
ther
net
abov
e 1
Gbi
t
EAD
LA
Ren
tals
-
Ethe
rnet
abo
ve 1
Gbi
t
Oth
er R
enta
ls -
Eth
erne
t ab
ove
1 G
bit
EAD
mai
nlin
k -
Ethe
rnet
ab
ove
1 G
bit
Internal External Internal External Internal External Internal External Internal ExternalFully Allocated Cost (£ or %) % % £ £ £ £ % % £ £ Components Unit (a) Cumulo Rates Non NGA – Openreach % £157m - - 1.73 1.73 - 1.73 2.3 % 1.7 % 10.80 11.04EAD Electronics Capital £/circuit 434.89 - - 1,609.16 1,609.16 - 1,609.16 - - - -Ethernet Backhaul Direct Active £/circuit 5,222.35 - - - - - - 58.0 % 39.1 % - -Ethernet Backhaul Direct extended reach £/circuit 163.03 - - - - - - - 1.2 % - -Ethernet Backhaul Direct - passive £/circuit 1,824.77 - - - - - - 13.7 % 9.7 % - -Ethernet Backhaul Direct resilience - active £/circuit 220.25 - - - - - - - 1.6 % - -Ethernet Backhaul Direct - resilience - passive £/circuit 73.56 - - - - - - - 0.4 % - -Ethernet Electronics Current £/le 90.45 - - 90.45 90.45 - 90.45 0.3 % 0.8 % - -Ethernet main links £/fibre km 41.77 - - - - - - - - 37.49 38.30Ethernet Monitoring Platform £/circuit 301.55 - - 422.06 422.06 - 422.06 1.3 % 3.0 % - -Ofcom Administration Fee Openreach % £3m 0.2 % 0.2 % 2.62 2.95 - 2.46 0.1 % 0.1 % 0.11 0.11Openreach sales product management % £14m 1.3 % 1.3 % 24.24 27.29 - 22.72 0.4 % 0.5 % 0.99 0.99Optical Ethernet Electronics Capital £/circuit 1,440.57 - - - - - - 15.3 % 34.6 % - -OR Service Centre - Provision WLA % £17m - - - - - - - - - -OR Service Centre - Assurance WLA % £16m - - - - - - - - - -OR Project Services % £8m - - - - - - - - - -OR Service Centre - Provision Ethernet % £6m 12.5 % 15.6 % - - - - - - - -OR Systems & Development - Ethernet £/le 24.07 3.4 % 4.2 % 24.07 24.07 - 24.07 0.5 % 0.8 % 3.62 3.62Co-mingling power & vent % £68m - - - - - - - - - -Co-mingling set up £/room 1,491.87 - - - - - - - - - -Co-mingling rentals £/hostel 29.82 - - - - - - - - - -Routeing & Records £/line 3.03 0.4 % 0.5 % - - - - - - - -SLG Ethernet Assurance External % £0m - - - 1.38 - 1.15 - - - -SLG Ethernet Assurance Internal % £0m - - 1.19 - - - - - - -SLG Ethernet Provision External % £15m - 76.2 % - - - - - - - -SLG Ethernet Provision Internal % £20m 80.6 % - - - - - - - - -PIMR Costs % £605m - - - - - - 7.1 % 5.3 % 62.17 63.52Revenue Receivables % £43m 1.6 % 1.9 % 27.03 30.43 - 25.35 0.9 % 1.0 % 1.10 1.10Rounding - 0.1 % 0.01 - - 0.01 0.1 % 0.2 % (0.01) (0.01)Fully Allocated Cost (£ or %) 100.0 % 100.0 % 2,202.56 2,209.52 - 2,199.16 100.0 % 100.0 % 116.27 118.67
Volume (units) (ux) (ux) 494 451 - 2 (ux) (ux) 4,416 4,830
Fully Allocated Cost (£m) 0.0 0.0 1.1 1.0 - 0.0 31.9 11.2 0.6 0.6
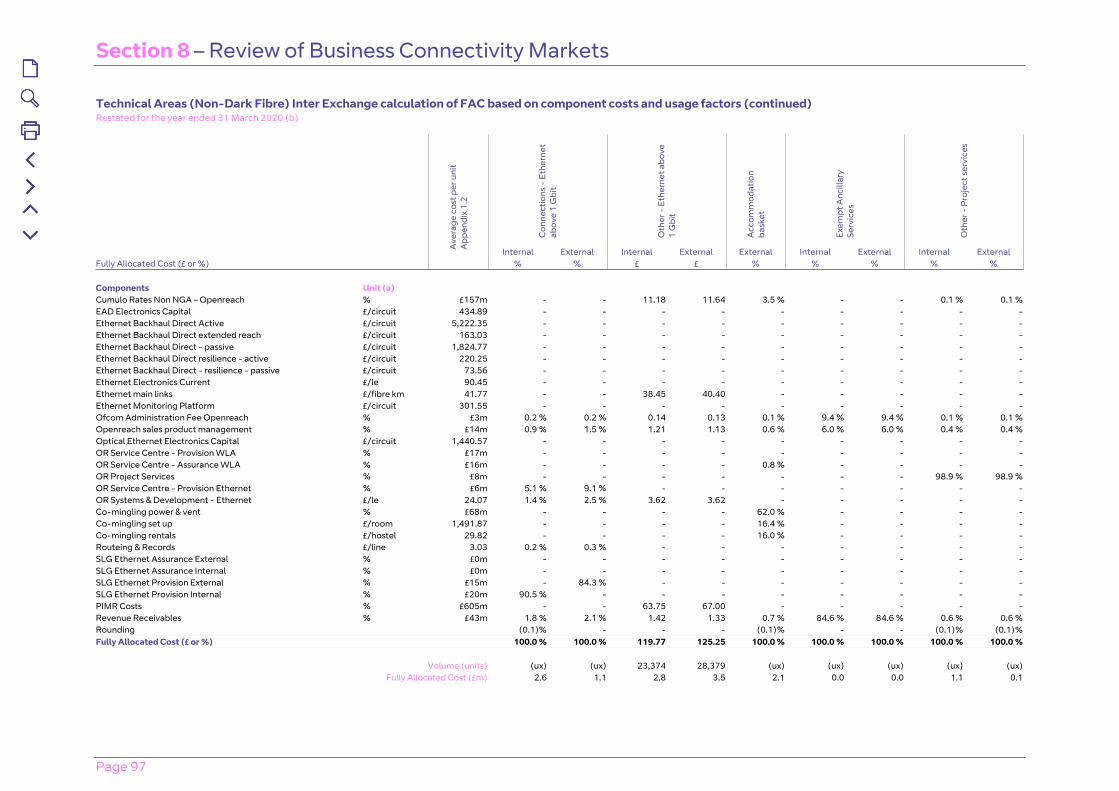
Section 8 – Review of Business Connectivity Markets
Page 97
Technical Areas (Non-Dark Fibre) Inter Exchange calculation of FAC based on component costs and usage factors (continued)Restated for the year ended 31 March 2020 (b)
Con
nect
ions
- E
ther
net
abov
e 1
Gbi
t
Oth
er -
Eth
erne
t abo
ve
1 G
bit
Acc
omm
odat
ion
bask
et
Exem
pt A
ncill
ary
Serv
ices
Oth
er -
Pro
ject
ser
vice
s
Ave
rage
cos
t per
uni
t A
ppen
dix
1.2
Internal External Internal External External Internal External Internal ExternalFully Allocated Cost (£ or %) % % £ £ % % % % %
Components Unit (a)Cumulo Rates Non NGA – Openreach % £157m - - 11.18 11.64 3.5 % - - 0.1 % 0.1 %EAD Electronics Capital £/circuit 434.89 - - - - - - - - -Ethernet Backhaul Direct Active £/circuit 5,222.35 - - - - - - - - -Ethernet Backhaul Direct extended reach £/circuit 163.03 - - - - - - - - -Ethernet Backhaul Direct - passive £/circuit 1,824.77 - - - - - - - - -Ethernet Backhaul Direct resilience - active £/circuit 220.25 - - - - - - - - -Ethernet Backhaul Direct - resilience - passive £/circuit 73.56 - - - - - - - - -Ethernet Electronics Current £/le 90.45 - - - - - - - - -Ethernet main links £/fibre km 41.77 - - 38.45 40.40 - - - - -Ethernet Monitoring Platform £/circuit 301.55 - - - - - - - - -Ofcom Administration Fee Openreach % £3m 0.2 % 0.2 % 0.14 0.13 0.1 % 9.4 % 9.4 % 0.1 % 0.1 %Openreach sales product management % £14m 0.9 % 1.5 % 1.21 1.13 0.6 % 6.0 % 6.0 % 0.4 % 0.4 %Optical Ethernet Electronics Capital £/circuit 1,440.57 - - - - - - - - -OR Service Centre - Provision WLA % £17m - - - - - - - - -OR Service Centre - Assurance WLA % £16m - - - - 0.8 % - - - -OR Project Services % £8m - - - - - - - 98.9 % 98.9 %OR Service Centre - Provision Ethernet % £6m 5.1 % 9.1 % - - - - - - -OR Systems & Development - Ethernet £/le 24.07 1.4 % 2.5 % 3.62 3.62 - - - - -Co-mingling power & vent % £68m - - - - 62.0 % - - - -Co-mingling set up £/room 1,491.87 - - - - 16.4 % - - - -Co-mingling rentals £/hostel 29.82 - - - - 16.0 % - - - -Routeing & Records £/line 3.03 0.2 % 0.3 % - - - - - - -SLG Ethernet Assurance External % £0m - - - - - - - - -SLG Ethernet Assurance Internal % £0m - - - - - - - - -SLG Ethernet Provision External % £15m - 84.3 % - - - - - - -SLG Ethernet Provision Internal % £20m 90.5 % - - - - - - - -PIMR Costs % £605m - - 63.75 67.00 - - - - -Revenue Receivables % £43m 1.8 % 2.1 % 1.42 1.33 0.7 % 84.6 % 84.6 % 0.6 % 0.6 %Rounding (0.1)% - - - (0.1)% - - (0.1)% (0.1)%Fully Allocated Cost (£ or %) 100.0 % 100.0 % 119.77 125.25 100.0 % 100.0 % 100.0 % 100.0 % 100.0 %
Volume (units) (ux) (ux) 23,374 28,379 (ux) (ux) (ux) (ux) (ux)Fully Allocated Cost (£m) 2.6 1.1 2.8 3.5 2.1 0.0 0.0 1.1 0.1
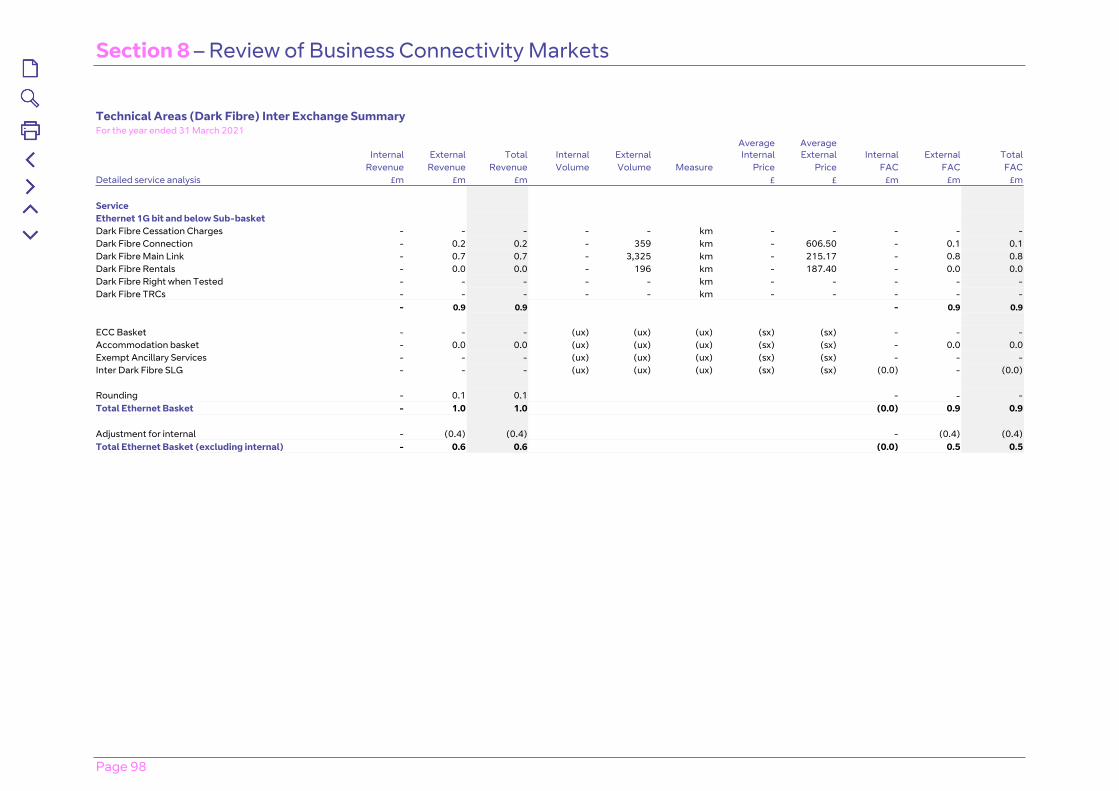
Section 8 – Review of Business Connectivity Markets
Page 98
Technical Areas (Dark Fibre) Inter Exchange SummaryFor the year ended 31 March 2021
Internal External Total Internal ExternalAverage Internal
Average External Internal External Total
Revenue Revenue Revenue Volume Volume Measure Price Price FAC FAC FACDetailed service analysis £m £m £m £ £ £m £m £m
ServiceEthernet 1G bit and below Sub-basketDark Fibre Cessation Charges - - - - - km - - - - -Dark Fibre Connection - 0.2 0.2 - 359 km - 606.50 - 0.1 0.1Dark Fibre Main Link - 0.7 0.7 - 3,325 km - 215.17 - 0.8 0.8Dark Fibre Rentals - 0.0 0.0 - 196 km - 187.40 - 0.0 0.0Dark Fibre Right when Tested - - - - - km - - - - -Dark Fibre TRCs - - - - - km - - - - -
- 0.9 0.9 - 0.9 0.9
ECC Basket - - - (ux) (ux) (ux) (sx) (sx) - - -Accommodation basket - 0.0 0.0 (ux) (ux) (ux) (sx) (sx) - 0.0 0.0Exempt Ancillary Services - - - (ux) (ux) (ux) (sx) (sx) - - -Inter Dark Fibre SLG - - - (ux) (ux) (ux) (sx) (sx) (0.0) - (0.0)
Rounding - 0.1 0.1 - -Total Ethernet Basket - 1.0 1.0 (0.0) 0.9 0.9
Adjustment for internal - (0.4) (0.4) - (0.4) (0.4)Total Ethernet Basket (excluding internal) - 0.6 0.6 (0.0) 0.5 0.5
-
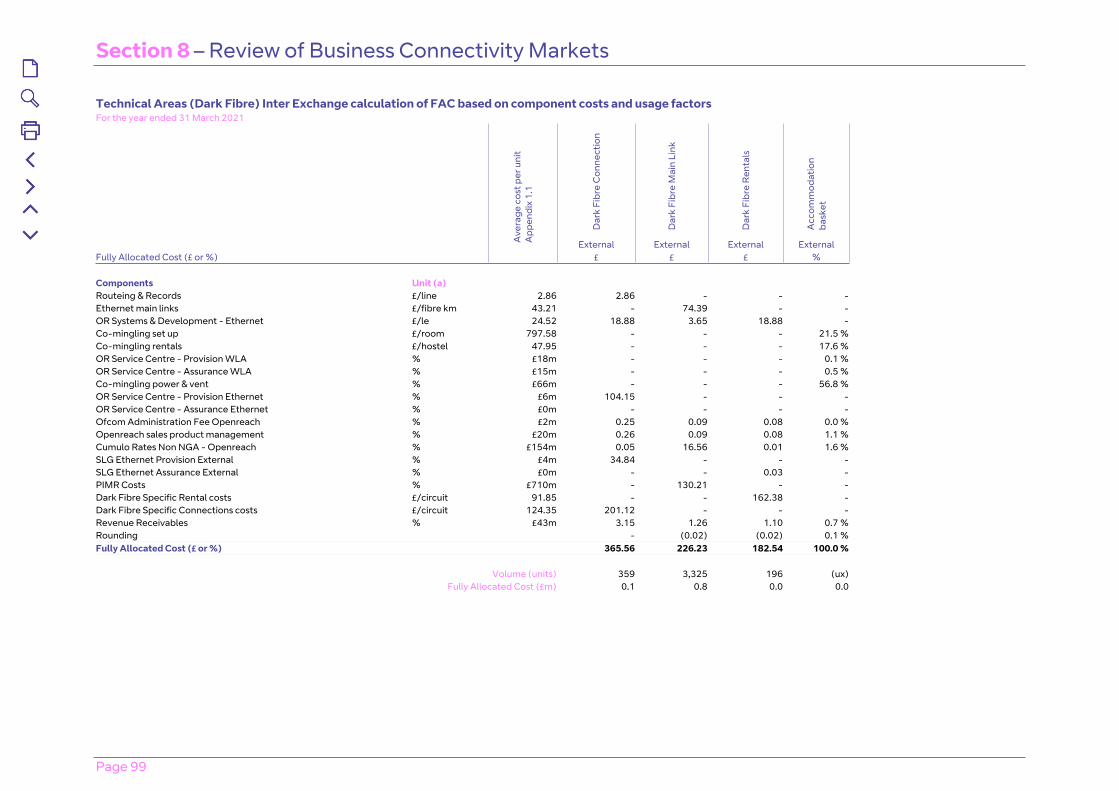
Section 8 – Review of Business Connectivity Markets
Page 99
Technical Areas (Dark Fibre) Inter Exchange calculation of FAC based on component costs and usage factorsFor the year ended 31 March 2021
Dar
k Fi
bre
Con
nect
ion
Dar
k Fi
bre
Mai
n Li
nk
Dar
k Fi
bre
Ren
tals
Acc
omm
odat
ion
bask
et
Ave
rage
cos
t per
uni
t A
ppen
dix
1.1
External External External ExternalFully Allocated Cost (£ or %) £ £ £ %
Components Unit (a)Routeing & Records £/line 2.86 2.86 - - -Ethernet main links £/fibre km 43.21 - 74.39 - -OR Systems & Development - Ethernet £/le 24.52 18.88 3.65 18.88 -Co-mingling set up £/room 797.58 - - - 21.5 %Co-mingling rentals £/hostel 47.95 - - - 17.6 %OR Service Centre - Provision WLA % £18m - - - 0.1 %OR Service Centre - Assurance WLA % £15m - - - 0.5 %Co-mingling power & vent % £66m - - - 56.8 %OR Service Centre - Provision Ethernet % £6m 104.15 - - -OR Service Centre - Assurance Ethernet % £0m - - - -Ofcom Administration Fee Openreach % £2m 0.25 0.09 0.08 0.0 %Openreach sales product management % £20m 0.26 0.09 0.08 1.1 %Cumulo Rates Non NGA - Openreach % £154m 0.05 16.56 0.01 1.6 %SLG Ethernet Provision External % £4m 34.84 - - -SLG Ethernet Assurance External % £0m - - 0.03 -PIMR Costs % £710m - 130.21 - -Dark Fibre Specific Rental costs £/circuit 91.85 - - 162.38 -Dark Fibre Specific Connections costs £/circuit 124.35 201.12 - - -Revenue Receivables % £43m 3.15 1.26 1.10 0.7 %Rounding - (0.02) (0.02) 0.1 %Fully Allocated Cost (£ or %) 365.56 226.23 182.54 100.0 %
Volume (units) 359 3,325 196 (ux)Fully Allocated Cost (£m) 0.1 0.8 0.0 0.0
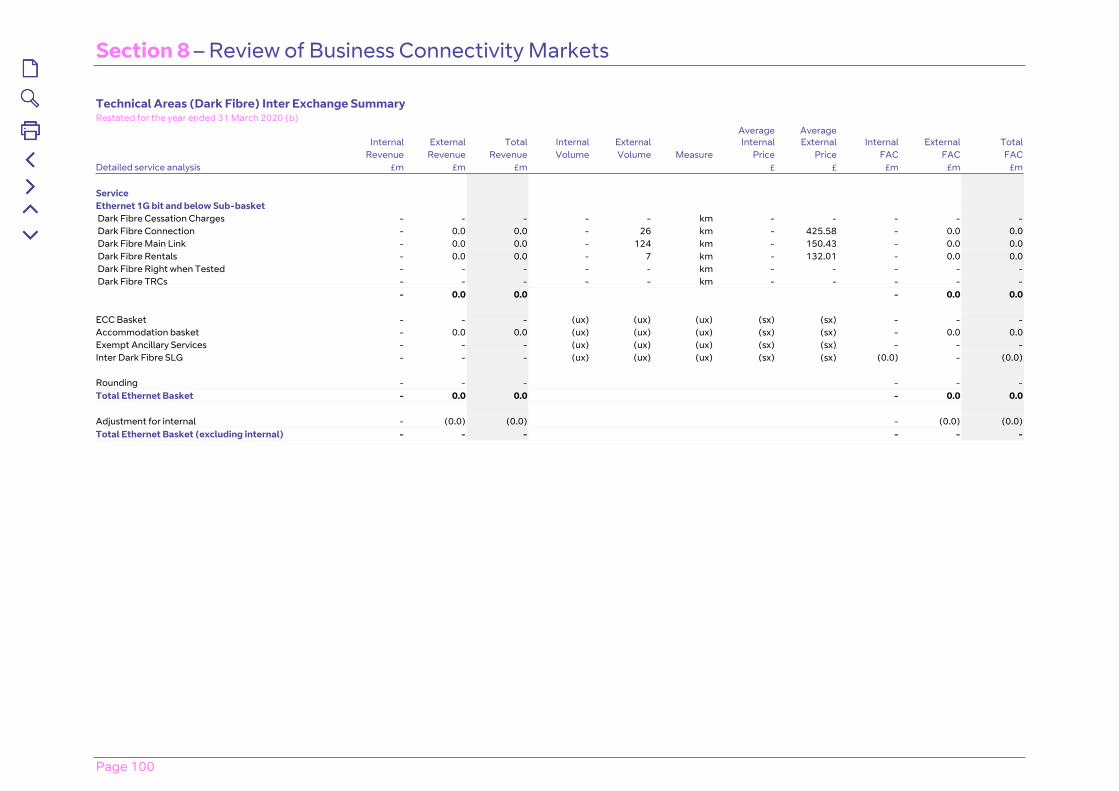
Section 8 – Review of Business Connectivity Markets
Page 100
Technical Areas (Dark Fibre) Inter Exchange SummaryRestated for the year ended 31 March 2020 (b)
Internal External Total Internal ExternalAverage Internal
Average External Internal External Total
Revenue Revenue Revenue Volume Volume Measure Price Price FAC FAC FACDetailed service analysis £m £m £m £ £ £m £m £m
ServiceEthernet 1G bit and below Sub-basket Dark Fibre Cessation Charges - - - - - km - - - - - Dark Fibre Connection - 0.0 0.0 - 26 km - 425.58 - 0.0 0.0 Dark Fibre Main Link - 0.0 0.0 - 124 km - 150.43 - 0.0 0.0 Dark Fibre Rentals - 0.0 0.0 - 7 km - 132.01 - 0.0 0.0 Dark Fibre Right when Tested - - - - - km - - - - - Dark Fibre TRCs - - - - - km - - - - -
- 0.0 0.0 - 0.0 0.0
ECC Basket - - - (ux) (ux) (ux) (sx) (sx) - - -Accommodation basket - 0.0 0.0 (ux) (ux) (ux) (sx) (sx) - 0.0 0.0Exempt Ancillary Services - - - (ux) (ux) (ux) (sx) (sx) - - -Inter Dark Fibre SLG - - - (ux) (ux) (ux) (sx) (sx) (0.0) - (0.0)
Rounding - - - - - -Total Ethernet Basket - 0.0 0.0 - 0.0 0.0
Adjustment for internal - (0.0) (0.0) - (0.0) (0.0)Total Ethernet Basket (excluding internal) - - - - - -

Section 8 – Review of Business Connectivity Markets
Page 101
Technical Areas (Dark Fibre) Inter Exchange calculation of FAC based on component costs and usage factorsRestated for the year ended 31 March 2020 (b)
Dar
k Fi
bre
Con
nect
ion
Dar
k Fi
bre
Mai
n Li
nk
Dar
k Fi
bre
Ren
tals
Acc
omm
odat
ion
bask
et
Ave
rage
cos
t per
uni
t A
ppen
dix
1.2
External External External ExternalFully Allocated Cost (£ or %) £ £ £ %
Components Unit (a)Routeing & Records £/line 3.03 3.03 - - -Ethernet main links £/fibre km 41.77 - 50.26 - -OR Systems & Development - Ethernet £/le 24.07 18.54 3.62 18.54 -Co-mingling set up £/room 1,491.87 - - - 16.6 %Co-mingling rentals £/hostel 29.82 - - - 16.2 %OR Service Centre - Provision WLA % £17m - - - 0.0 %OR Service Centre - Assurance WLA % £16m - - - 0.8 %Co-mingling power & vent % £68m - - - 62.7 %OR Service Centre - Provision Ethernet % £6m 88.61 - - -OR Service Centre - Assurance Ethernet % £0m - - 0.00 -Ofcom Administration Fee Openreach % £3m 0.25 0.09 0.08 0.1 %Openreach sales product management % £14m 0.14 0.05 0.03 0.5 %Cumulo Rates Non NGA - Openreach % £157m 0.01 4.90 0.01 2.3 %SLG Ethernet Provision External % £15m 91.71 - - -SLG Ethernet Assurance External % £0m - - 0.04 -PIMR Costs % £605m - 83.35 - -Dark Fibre Specific Rental costs £/circuit 90.20 - - 112.33 -Dark Fibre Specific Connections costs £/circuit 122.12 138.59 - - -Revenue Receivables % £43m 2.27 0.92 0.81 0.7 %Rounding - - (0.01) 0.1 %Fully Allocated Cost (£ or %) 343.15 143.19 131.83 100.0 %
Volume (units) 26 124 7 (ux)Fully Allocated Cost (£m) 0.0 0.0 0.0 0.0

Page 102
Section 9Review of Narrowband Markets
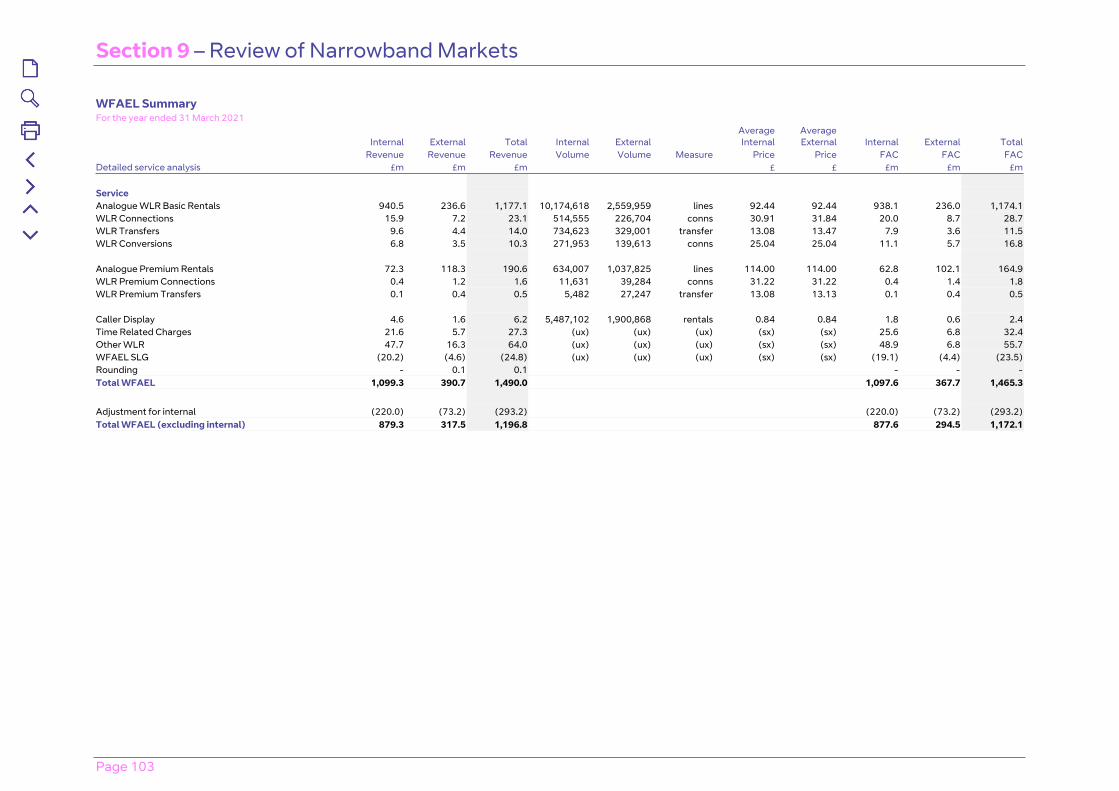
Section 9 – Review of Narrowband Markets
Page 103
WFAEL SummaryFor the year ended 31 March 2021
Internal External Total Internal External Average Internal
Average External Internal External Total
Revenue Revenue Revenue Volume Volume Measure Price Price FAC FAC FACDetailed service analysis £m £m £m £ £ £m £m £m Service Analogue WLR Basic Rentals 940.5 236.6 1,177.1 10,174,618 2,559,959 lines 92.44 92.44 938.1 236.0 1,174.1WLR Connections 15.9 7.2 23.1 514,555 226,704 conns 30.91 31.84 20.0 8.7 28.7WLR Transfers 9.6 4.4 14.0 734,623 329,001 transfer 13.08 13.47 7.9 3.6 11.5WLR Conversions 6.8 3.5 10.3 271,953 139,613 conns 25.04 25.04 11.1 5.7 16.8 Analogue Premium Rentals 72.3 118.3 190.6 634,007 1,037,825 lines 114.00 114.00 62.8 102.1 164.9WLR Premium Connections 0.4 1.2 1.6 11,631 39,284 conns 31.22 31.22 0.4 1.4 1.8WLR Premium Transfers 0.1 0.4 0.5 5,482 27,247 transfer 13.08 13.13 0.1 0.4 0.5 Caller Display 4.6 1.6 6.2 5,487,102 1,900,868 rentals 0.84 0.84 1.8 0.6 2.4Time Related Charges 21.6 5.7 27.3 (ux) (ux) (ux) (sx) (sx) 25.6 6.8 32.4Other WLR 47.7 16.3 64.0 (ux) (ux) (ux) (sx) (sx) 48.9 6.8 55.7WFAEL SLG (20.2) (4.6) (24.8) (ux) (ux) (ux) (sx) (sx) (19.1) (4.4) (23.5)Rounding - 0.1 0.1 - - -Total WFAEL 1,099.3 390.7 1,490.0 1,097.6 367.7 1,465.3
Adjustment for internal (220.0) (73.2) (293.2) (220.0) (73.2) (293.2)Total WFAEL (excluding internal) 879.3 317.5 1,196.8 877.6 294.5 1,172.1
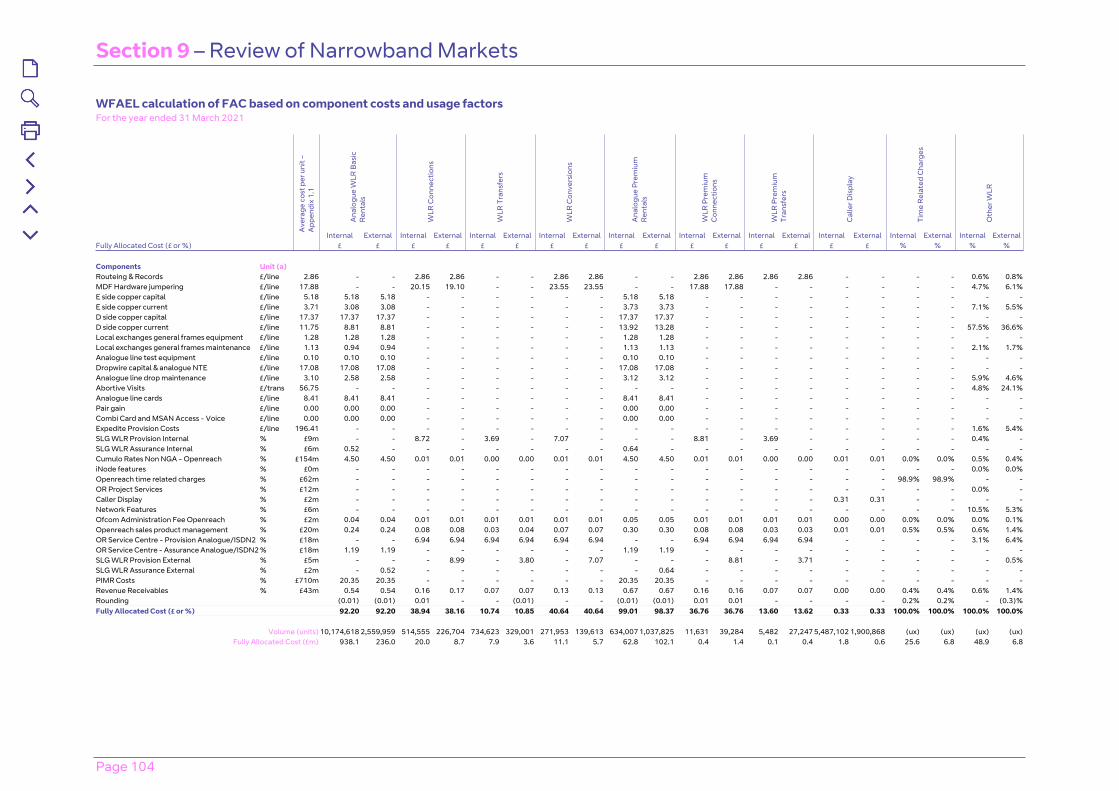
Section 9 – Review of Narrowband Markets
Page 104
WFAEL calculation of FAC based on component costs and usage factorsFor the year ended 31 March 2021
Ana
logu
e W
LR B
asic
R
enta
ls
WLR
Con
nect
ions
WLR
Tra
nsfe
rs
WLR
Con
vers
ions
Ana
logu
e P
rem
ium
R
enta
ls
WLR
Pre
miu
m
Con
nect
ions
WLR
Pre
miu
m
Tran
sfer
s
Cal
ler D
ispl
ay
Tim
e R
elat
ed C
harg
es
Oth
er W
LR
Ave
rage
cos
t per
uni
t –
App
endi
x 1.
1
Internal External Internal External Internal External Internal External Internal External Internal External Internal External Internal External Internal External Internal ExternalFully Allocated Cost (£ or %) £ £ £ £ £ £ £ £ £ £ £ £ £ £ £ £ % % % %
Components Unit (a)Routeing & Records £/line 2.86 - - 2.86 2.86 - - 2.86 2.86 - - 2.86 2.86 2.86 2.86 - - - - 0.6% 0.8%MDF Hardware jumpering £/line 17.88 - - 20.15 19.10 - - 23.55 23.55 - - 17.88 17.88 - - - - - - 4.7% 6.1%E side copper capital £/line 5.18 5.18 5.18 - - - - - - 5.18 5.18 - - - - - - - - - -E side copper current £/line 3.71 3.08 3.08 - - - - - - 3.73 3.73 - - - - - - - - 7.1% 5.5%D side copper capital £/line 17.37 17.37 17.37 - - - - - - 17.37 17.37 - - - - - - - - - -D side copper current £/line 11.75 8.81 8.81 - - - - - - 13.92 13.28 - - - - - - - - 57.5% 36.6%Local exchanges general frames equipment £/line 1.28 1.28 1.28 - - - - - - 1.28 1.28 - - - - - - - - - -Local exchanges general frames maintenance £/line 1.13 0.94 0.94 - - - - - - 1.13 1.13 - - - - - - - - 2.1% 1.7%Analogue line test equipment £/line 0.10 0.10 0.10 - - - - - - 0.10 0.10 - - - - - - - - - -Dropwire capital & analogue NTE £/line 17.08 17.08 17.08 - - - - - - 17.08 17.08 - - - - - - - - - -Analogue line drop maintenance £/line 3.10 2.58 2.58 - - - - - - 3.12 3.12 - - - - - - - - 5.9% 4.6%Abortive Visits £/trans 56.75 - - - - - - - - - - - - - - - - - - 4.8% 24.1%Analogue line cards £/line 8.41 8.41 8.41 - - - - - - 8.41 8.41 - - - - - - - - - -Pair gain £/line 0.00 0.00 0.00 - - - - - - 0.00 0.00 - - - - - - - - - -Combi Card and MSAN Access - Voice £/line 0.00 0.00 0.00 - - - - - - 0.00 0.00 - - - - - - - - - -Expedite Provision Costs £/line 196.41 - - - - - - - - - - - - - - - - - - 1.6% 5.4%SLG WLR Provision Internal % £9m - - 8.72 - 3.69 - 7.07 - - - 8.81 - 3.69 - - - - - 0.4% -SLG WLR Assurance Internal % £6m 0.52 - - - - - - - 0.64 - - - - - - - - - - -Cumulo Rates Non NGA - Openreach % £154m 4.50 4.50 0.01 0.01 0.00 0.00 0.01 0.01 4.50 4.50 0.01 0.01 0.00 0.00 0.01 0.01 0.0% 0.0% 0.5% 0.4%iNode features % £0m - - - - - - - - - - - - - - - - - - 0.0% 0.0%Openreach time related charges % £62m - - - - - - - - - - - - - - - - 98.9% 98.9% - -OR Project Services % £12m - - - - - - - - - - - - - - - - - - 0.0% -Caller Display % £2m - - - - - - - - - - - - - - 0.31 0.31 - - - -Network Features % £6m - - - - - - - - - - - - - - - - - - 10.5% 5.3%Ofcom Administration Fee Openreach % £2m 0.04 0.04 0.01 0.01 0.01 0.01 0.01 0.01 0.05 0.05 0.01 0.01 0.01 0.01 0.00 0.00 0.0% 0.0% 0.0% 0.1%Openreach sales product management % £20m 0.24 0.24 0.08 0.08 0.03 0.04 0.07 0.07 0.30 0.30 0.08 0.08 0.03 0.03 0.01 0.01 0.5% 0.5% 0.6% 1.4%OR Service Centre - Provision Analogue/ISDN2 % £18m - - 6.94 6.94 6.94 6.94 6.94 6.94 - - 6.94 6.94 6.94 6.94 - - - - 3.1% 6.4%OR Service Centre - Assurance Analogue/ISDN2 % £18m 1.19 1.19 - - - - - - 1.19 1.19 - - - - - - - - - -SLG WLR Provision External % £5m - - - 8.99 - 3.80 - 7.07 - - - 8.81 - 3.71 - - - - - 0.5%SLG WLR Assurance External % £2m - 0.52 - - - - - - - 0.64 - - - - - - - - - -PIMR Costs % £710m 20.35 20.35 - - - - - - 20.35 20.35 - - - - - - - - - -Revenue Receivables % £43m 0.54 0.54 0.16 0.17 0.07 0.07 0.13 0.13 0.67 0.67 0.16 0.16 0.07 0.07 0.00 0.00 0.4% 0.4% 0.6% 1.4%Rounding (0.01) (0.01) 0.01 - - (0.01) - - (0.01) (0.01) 0.01 0.01 - - - - 0.2% 0.2% - (0.3)%Fully Allocated Cost (£ or %) 92.20 92.20 38.94 38.16 10.74 10.85 40.64 40.64 99.01 98.37 36.76 36.76 13.60 13.62 0.33 0.33 100.0% 100.0% 100.0% 100.0%
Volume (units) 10,174,618 2,559,959 514,555 226,704 734,623 329,001 271,953 139,613 634,007 1,037,825 11,631 39,284 5,482 27,247 5,487,102 1,900,868 (ux) (ux) (ux) (ux)Fully Allocated Cost (£m) 938.1 236.0 20.0 8.7 7.9 3.6 11.1 5.7 62.8 102.1 0.4 1.4 0.1 0.4 1.8 0.6 25.6 6.8 48.9 6.8
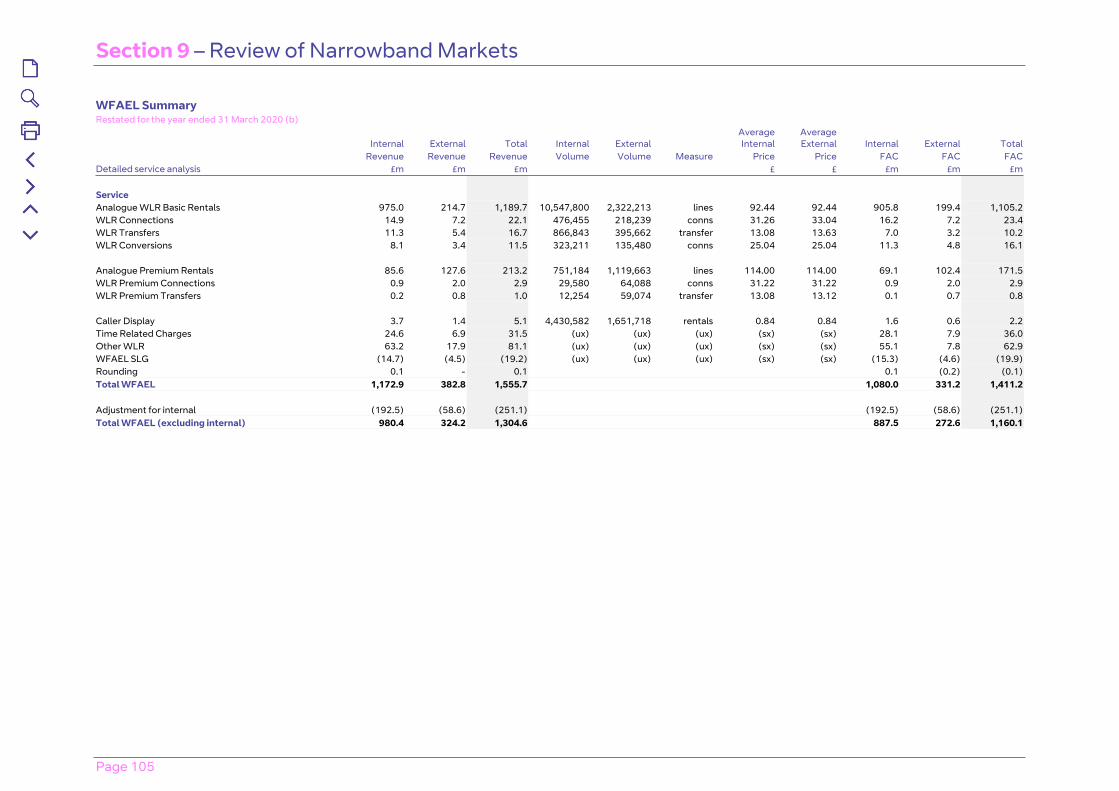
Section 9 – Review of Narrowband Markets
Page 105
WFAEL SummaryRestated for the year ended 31 March 2020 (b)
Internal External Total Internal External Average Internal
Average External Internal External Total
Revenue Revenue Revenue Volume Volume Measure Price Price FAC FAC FACDetailed service analysis £m £m £m £ £ £m £m £m Service Analogue WLR Basic Rentals 975.0 214.7 1,189.7 10,547,800 2,322,213 lines 92.44 92.44 905.8 199.4 1,105.2WLR Connections 14.9 7.2 22.1 476,455 218,239 conns 31.26 33.04 16.2 7.2 23.4WLR Transfers 11.3 5.4 16.7 866,843 395,662 transfer 13.08 13.63 7.0 3.2 10.2WLR Conversions 8.1 3.4 11.5 323,211 135,480 conns 25.04 25.04 11.3 4.8 16.1 Analogue Premium Rentals 85.6 127.6 213.2 751,184 1,119,663 lines 114.00 114.00 69.1 102.4 171.5WLR Premium Connections 0.9 2.0 2.9 29,580 64,088 conns 31.22 31.22 0.9 2.0 2.9WLR Premium Transfers 0.2 0.8 1.0 12,254 59,074 transfer 13.08 13.12 0.1 0.7 0.8 Caller Display 3.7 1.4 5.1 4,430,582 1,651,718 rentals 0.84 0.84 1.6 0.6 2.2Time Related Charges 24.6 6.9 31.5 (ux) (ux) (ux) (sx) (sx) 28.1 7.9 36.0Other WLR 63.2 17.9 81.1 (ux) (ux) (ux) (sx) (sx) 55.1 7.8 62.9WFAEL SLG (14.7) (4.5) (19.2) (ux) (ux) (ux) (sx) (sx) (15.3) (4.6) (19.9)Rounding 0.1 - 0.1 0.1 (0.2) (0.1)Total WFAEL 1,172.9 382.8 1,555.7 1,080.0 331.2 1,411.2 Adjustment for internal (192.5) (58.6) (251.1) (192.5) (58.6) (251.1)Total WFAEL (excluding internal) 980.4 324.2 1,304.6 887.5 272.6 1,160.1

Section 9 – Review of Narrowband Markets
Page 106
WFAEL calculation of FAC based on component costs and usage factorsRestated for the year ended 31 March 2020 (b)
Ana
logu
e W
LR B
asic
R
enta
ls
WLR
Con
nect
ions
WLR
Tra
nsfe
rs
WLR
Con
vers
ions
Ana
logu
e P
rem
ium
R
enta
ls
WLR
Pre
miu
m
Con
nect
ions
WLR
Pre
miu
m
Tran
sfer
s
Cal
ler D
ispl
ay
Tim
e R
elat
ed C
harg
es
Oth
er W
LR
Ave
rage
cos
t per
uni
t A
ppen
dix
1.2
Internal External Internal External Internal External Internal External Internal External Internal External Internal External Internal External Internal External Internal ExternalFully Allocated Cost (£ or %) £ £ £ £ £ £ £ £ £ £ £ £ £ £ £ £ % % % %
Components Unit (a)Routeing & Records £/line 3.03 - - 3.03 3.03 - - 3.03 3.03 - - 3.03 3.03 3.03 3.03 - - - - 0.8% 1.4%MDF Hardware jumpering £/line 16.12 - - 18.75 17.30 - - 21.24 21.24 - - 16.12 16.12 - - - - - - 5.5% 9.6%E side copper capital £/line 4.21 4.21 4.21 - - - - - - 4.21 4.21 - - - - - - - - - -E side copper current £/line 3.60 2.99 2.99 - - - - - - 3.62 3.62 - - - - - - - - 6.5% 4.7%D side copper capital £/line 18.37 18.37 18.37 - - - - - - 18.37 18.37 - - - - - - - - - -D side copper current £/line 10.69 7.84 7.84 - - - - - - 12.28 11.77 - - - - - - - - 56.1% 28.0%Local exchanges general frames equipment £/line 1.20 1.20 1.20 - - - - - - 1.20 1.20 - - - - - - - - - -Local exchanges general frames maintenance £/line 1.28 1.06 1.06 - - - - - - 1.29 1.29 - - - - - - - - 2.3% 1.7%Analogue line test equipment £/line 0.07 0.07 0.07 - - - - - - 0.07 0.07 - - - - - - - - - -Dropwire capital & analogue NTE £/line 16.40 16.40 16.40 - - - - - - 16.40 16.40 - - - - - - - - - -Analogue line drop maintenance £/line 2.77 2.30 2.30 - - - - - - 2.78 2.78 - - - - - - - - 5.0% 3.6%Abortive Visits £/trans 59.94 - - - - - - - - - - - - - - - - - - 7.1% 31.2%Analogue line cards £/line 7.39 7.39 7.39 - - - - - - 7.39 7.39 - - - - - - - - - -Pair gain £/line 0.00 0.00 0.00 - - - - - - 0.00 0.00 - - - - - - - - - -Combi Card and MSAN Access - Voice £/line 0.00 0.00 0.00 - - - - - - 0.00 0.00 - - - - - - - - - -Expedite Provision Costs £/line 130.01 - - - - - - - - - - - - - - - - - - 1.3% 3.1%SLG WLR Provision Internal % £8m - - 6.97 - 2.92 - 5.58 - - - 6.96 - 2.92 - - - - - 0.4% -SLG WLR Assurance Internal % £6m 0.50 - - - - - - - 0.62 - - - - - - - - - - -Cumulo Rates Non NGA - Openreach % £157m 4.60 4.60 0.01 0.01 0.00 0.00 0.01 0.01 4.60 4.60 0.01 0.01 0.00 0.00 0.01 0.01 0.1% 0.1% 0.5% 0.4%iNode features % £1m - - - - - - - - - - - - - - - - - - 1.2% 0.7%Openreach time related charges % £63m - - - - - - - - - - - - - - - - 99.1% 99.1% - -OR Project Services % £8m - - - - - - - - - - - - - - - - - - 0.3% 0.8%Caller Display % £2m - - - - - - - - - - - - - - 0.34 0.34 - - - -Network Features % £6m - - - - - - - - - - - - - - - - - - 9.4% 6.0%Ofcom Administration Fee Openreach % £3m 0.05 0.05 0.02 0.02 0.01 0.01 0.01 0.01 0.07 0.07 0.02 0.02 0.01 0.01 0.00 0.00 0.1% 0.1% 0.1% 0.1%Openreach sales product management % £14m 0.08 0.08 0.03 0.03 0.01 0.01 0.02 0.02 0.10 0.10 0.03 0.03 0.01 0.01 0.00 0.00 0.3% 0.3% 0.4% 0.7%OR Service Centre - Provision Analogue/ISDN2 % £15m - - 5.07 5.07 5.07 5.07 5.07 5.07 - - 5.07 5.07 5.07 5.07 - - - - 2.5% 5.9%OR Service Centre - Assurance Analogue/ISDN2 % £18m 1.18 1.18 - - - - - - 1.18 1.18 - - - - - - - - - -SLG WLR Provision External % £4m - - - 7.37 - 3.04 - 5.58 - - - 6.96 - 2.93 - - - - - 0.6%SLG WLR Assurance External % £2m - 0.50 - - - - - - - 0.62 - - - - - - - - - -PIMR Costs % £605m 17.04 17.04 - - - - - - 17.04 17.04 - - - - - - - - - -Revenue Receivables % £43m 0.57 0.57 0.17 0.18 0.07 0.07 0.13 0.13 0.70 0.70 0.17 0.17 0.07 0.07 0.01 0.01 0.5% 0.5% 0.7% 1.4%Rounding 0.02 0.02 (0.01) - - - 0.01 0.01 - - (0.01) (0.01) (0.01) (0.01) - - (0.1)% (0.1)% (0.1)% 0.1%Fully Allocated Cost (£ or %) 85.87 85.87 34.04 33.01 8.08 8.20 35.10 35.10 91.92 91.41 31.40 31.40 11.10 11.11 0.36 0.36 100.0% 100.0% 100.0% 100.0%
Volume (units) 10,547,800 2,322,213 476,455 218,239 866,843 395,662 323,211 135,480 751,184 1,119,663 29,580 64,088 12,254 59,074 4,430,582 1,651,718 (ux) (ux) (ux) (ux)Fully Allocated Cost (£m) 905.8 199.4 16.2 7.2 7.0 3.2 11.3 4.8 69.1 102.4 0.9 2.0 0.1 0.7 1.6 0.6 28.1 7.9 55.1 7.8
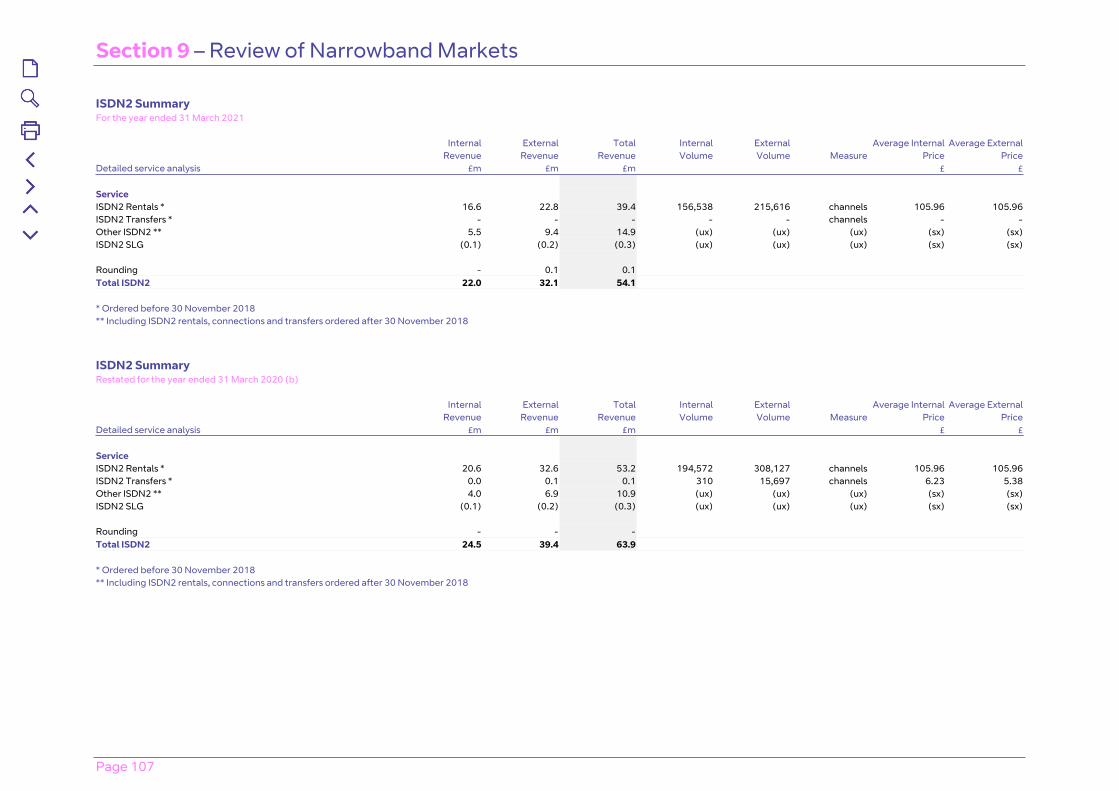
Section 9 – Review of Narrowband Markets
Page 107
ISDN2 SummaryFor the year ended 31 March 2021
Internal External Total Internal External Average Internal Average ExternalRevenue Revenue Revenue Volume Volume Measure Price Price
Detailed service analysis £m £m £m £ £
ServiceISDN2 Rentals * 16.6 22.8 39.4 156,538 215,616 channels 105.96 105.96ISDN2 Transfers * - - - - - channels - -Other ISDN2 ** 5.5 9.4 14.9 (ux) (ux) (ux) (sx) (sx)ISDN2 SLG (0.1) (0.2) (0.3) (ux) (ux) (ux) (sx) (sx)
Rounding - 0.1 0.1Total ISDN2 22.0 32.1 54.1
* Ordered before 30 November 2018** Including ISDN2 rentals, connections and transfers ordered after 30 November 2018
ISDN2 SummaryRestated for the year ended 31 March 2020 (b)
Internal External Total Internal External Average Internal Average ExternalRevenue Revenue Revenue Volume Volume Measure Price Price
Detailed service analysis £m £m £m £ £
ServiceISDN2 Rentals * 20.6 32.6 53.2 194,572 308,127 channels 105.96 105.96ISDN2 Transfers * 0.0 0.1 0.1 310 15,697 channels 6.23 5.38Other ISDN2 ** 4.0 6.9 10.9 (ux) (ux) (ux) (sx) (sx)ISDN2 SLG (0.1) (0.2) (0.3) (ux) (ux) (ux) (sx) (sx)
Rounding - - -Total ISDN2 24.5 39.4 63.9
* Ordered before 30 November 2018** Including ISDN2 rentals, connections and transfers ordered after 30 November 2018
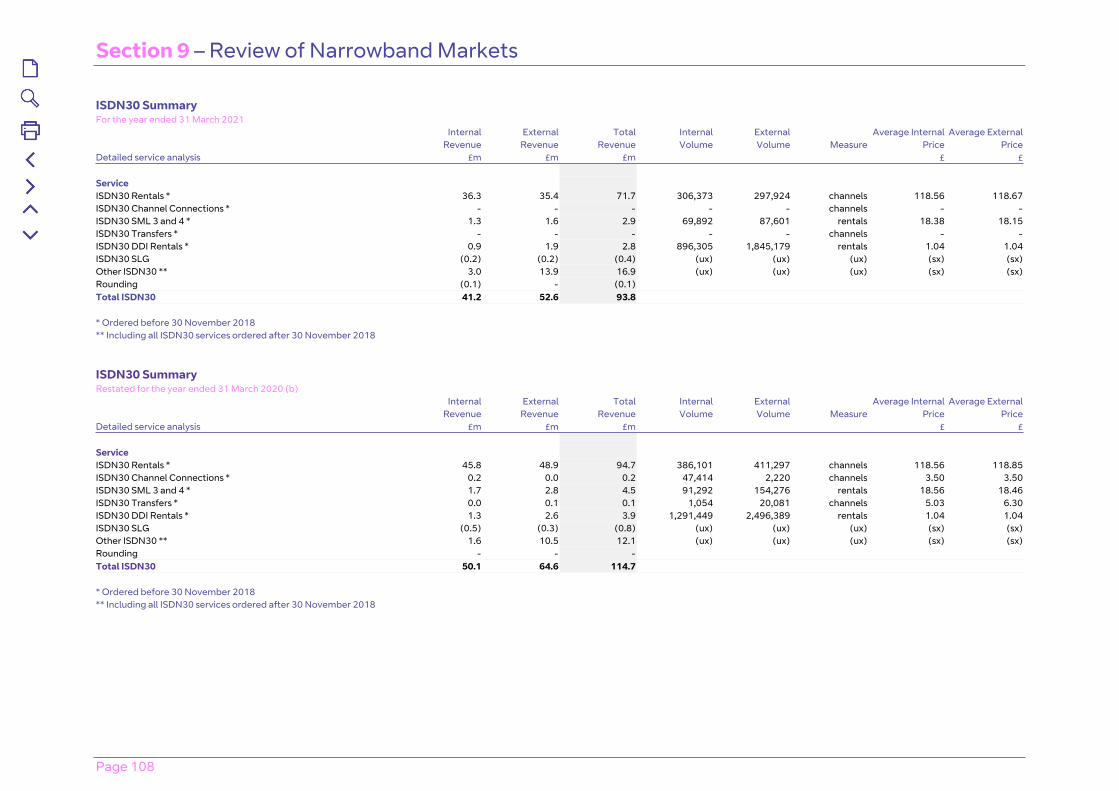
Section 9 – Review of Narrowband Markets
Page 108
ISDN30 Summary For the year ended 31 March 2021
Internal External Total Internal External Average Internal Average External Revenue Revenue Revenue Volume Volume Measure Price Price
Detailed service analysis £m £m £m £ £ Service ISDN30 Rentals * 36.3 35.4 71.7 306,373 297,924 channels 118.56 118.67ISDN30 Channel Connections * - - - - - channels - -ISDN30 SML 3 and 4 * 1.3 1.6 2.9 69,892 87,601 rentals 18.38 18.15ISDN30 Transfers * - - - - - channels - -ISDN30 DDI Rentals * 0.9 1.9 2.8 896,305 1,845,179 rentals 1.04 1.04ISDN30 SLG (0.2) (0.2) (0.4) (ux) (ux) (ux) (sx) (sx)Other ISDN30 ** 3.0 13.9 16.9 (ux) (ux) (ux) (sx) (sx)Rounding (0.1) - (0.1) Total ISDN30 41.2 52.6 93.8 * Ordered before 30 November 2018** Including all ISDN30 services ordered after 30 November 2018
ISDN30 Summary Restated for the year ended 31 March 2020 (b)
Internal External Total Internal External Average Internal Average External Revenue Revenue Revenue Volume Volume Measure Price Price
Detailed service analysis £m £m £m £ £ Service ISDN30 Rentals * 45.8 48.9 94.7 386,101 411,297 channels 118.56 118.85ISDN30 Channel Connections * 0.2 0.0 0.2 47,414 2,220 channels 3.50 3.50ISDN30 SML 3 and 4 * 1.7 2.8 4.5 91,292 154,276 rentals 18.56 18.46ISDN30 Transfers * 0.0 0.1 0.1 1,054 20,081 channels 5.03 6.30ISDN30 DDI Rentals * 1.3 2.6 3.9 1,291,449 2,496,389 rentals 1.04 1.04ISDN30 SLG (0.5) (0.3) (0.8) (ux) (ux) (ux) (sx) (sx)Other ISDN30 ** 1.6 10.5 12.1 (ux) (ux) (ux) (sx) (sx)Rounding - - - Total ISDN30 50.1 64.6 114.7 * Ordered before 30 November 2018** Including all ISDN30 services ordered after 30 November 2018
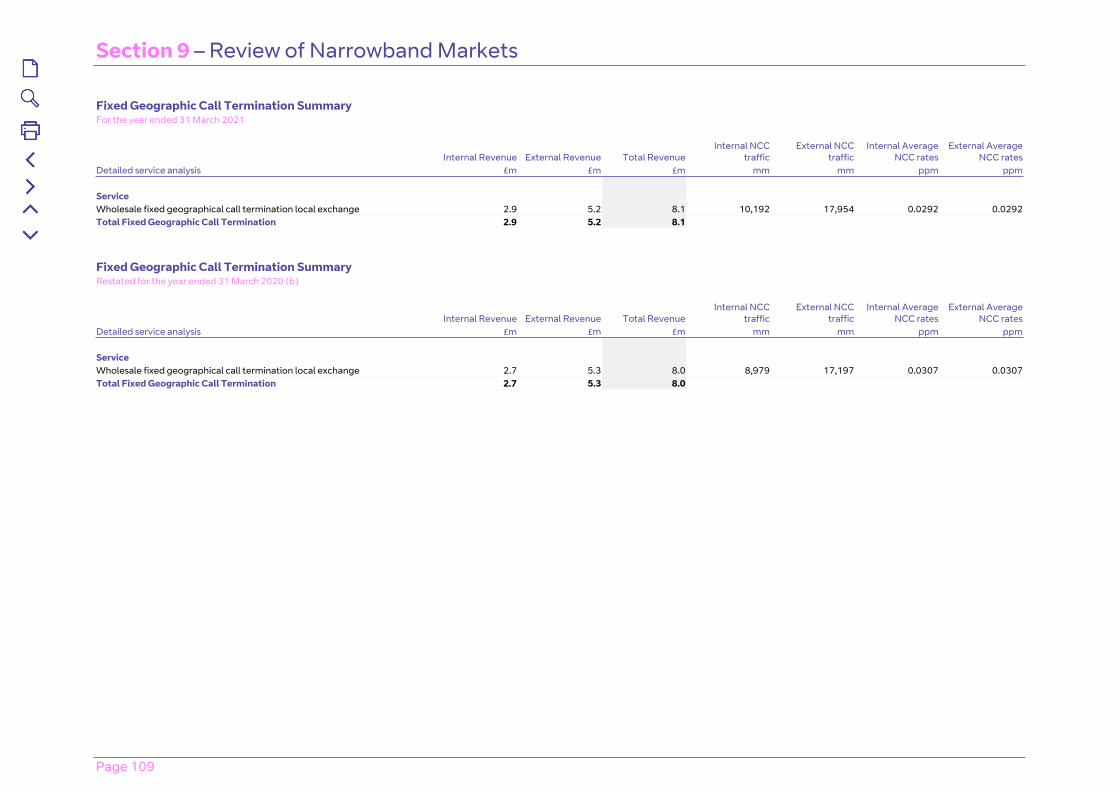
Section 9 – Review of Narrowband Markets
Page 109
Fixed Geographic Call Termination SummaryFor the year ended 31 March 2021
Internal Revenue External Revenue Total RevenueInternal NCC
trafficExternal NCC
trafficInternal Average
NCC ratesExternal Average
NCC ratesDetailed service analysis £m £m £m mm mm ppm ppm
ServiceWholesale fixed geographical call termination local exchange 2.9 5.2 8.1 10,192 17,954 0.0292 0.0292Total Fixed Geographic Call Termination 2.9 5.2 8.1
Fixed Geographic Call Termination SummaryRestated for the year ended 31 March 2020 (b)
Internal Revenue External Revenue Total RevenueInternal NCC
trafficExternal NCC
trafficInternal Average
NCC ratesExternal Average
NCC ratesDetailed service analysis £m £m £m mm mm ppm ppm
ServiceWholesale fixed geographical call termination local exchange 2.7 5.3 8.0 8,979 17,197 0.0307 0.0307Total Fixed Geographic Call Termination 2.7 5.3 8.0
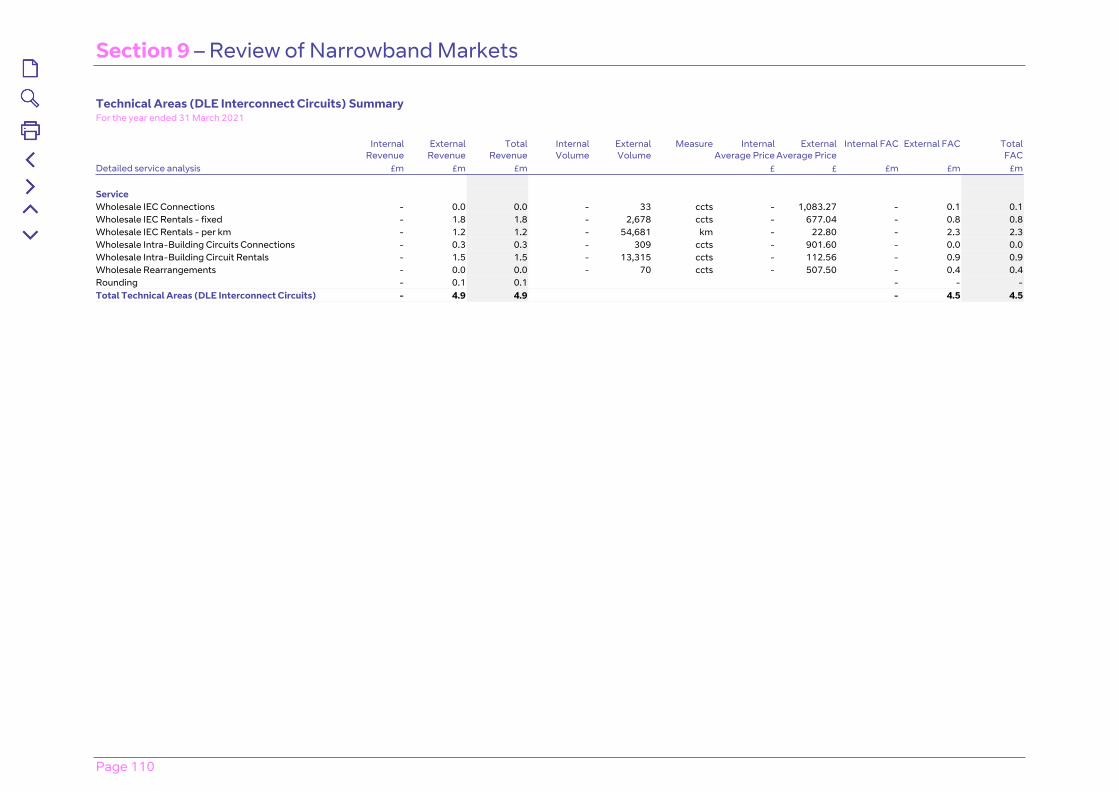
Section 9 – Review of Narrowband Markets
Page 110
Technical Areas (DLE Interconnect Circuits) SummaryFor the year ended 31 March 2021
Internal Revenue
External Revenue
Total Revenue
Internal Volume
External Volume
Measure Internal Average Price
External Average Price
Internal FAC External FAC TotalFAC
Detailed service analysis £m £m £m £ £ £m £m £m
ServiceWholesale IEC Connections - 0.0 0.0 - 33 ccts - 1,083.27 - 0.1 0.1Wholesale IEC Rentals - fixed - 1.8 1.8 - 2,678 ccts - 677.04 - 0.8 0.8Wholesale IEC Rentals - per km - 1.2 1.2 - 54,681 km - 22.80 - 2.3 2.3Wholesale Intra-Building Circuits Connections - 0.3 0.3 - 309 ccts - 901.60 - 0.0 0.0Wholesale Intra-Building Circuit Rentals - 1.5 1.5 - 13,315 ccts - 112.56 - 0.9 0.9Wholesale Rearrangements - 0.0 0.0 - 70 ccts - 507.50 - 0.4 0.4Rounding - 0.1 0.1 - - -Total Technical Areas (DLE Interconnect Circuits) - 4.9 4.9 - 4.5 4.5
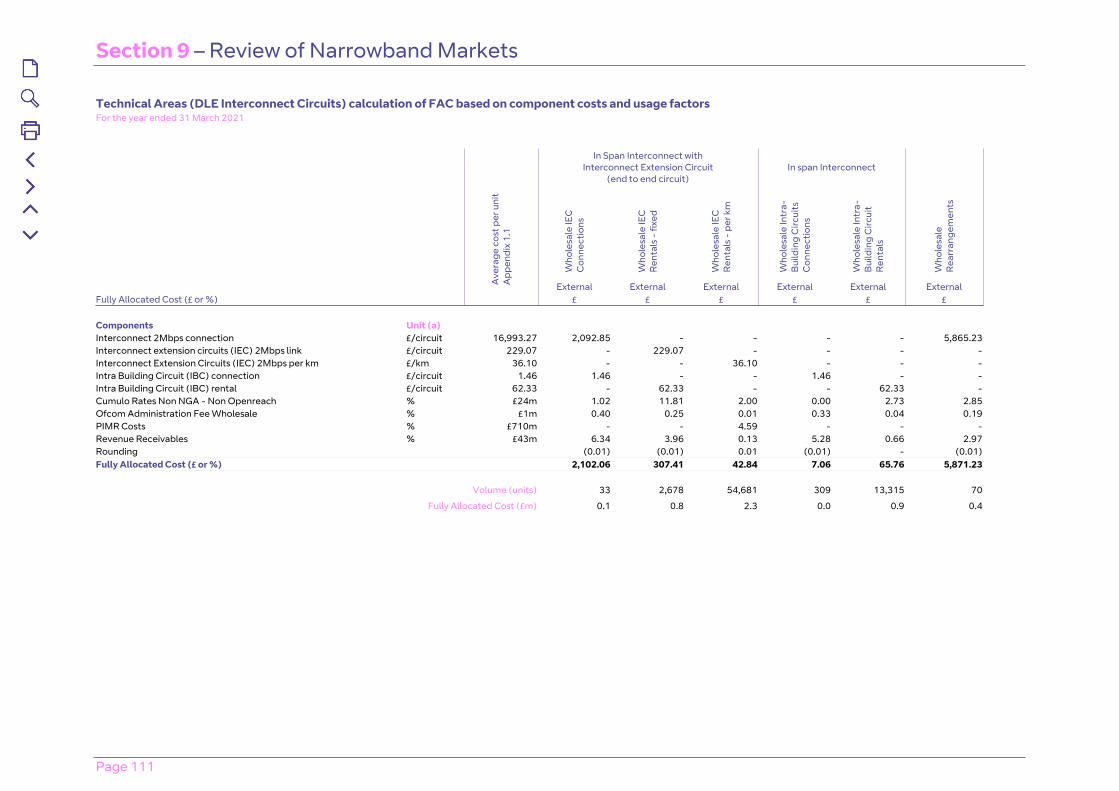
Section 9 – Review of Narrowband Markets
Page 111
Technical Areas (DLE Interconnect Circuits) calculation of FAC based on component costs and usage factorsFor the year ended 31 March 2021
In Span Interconnect withInterconnect Extension Circuit
(end to end circuit)In span Interconnect
Who
lesa
le IE
C
Con
nect
ions
Who
lesa
le IE
C
Ren
tals
- fi
xed
Who
lesa
le IE
C
Ren
tals
- p
er k
m
Who
lesa
le In
tra-
Bui
ldin
g C
ircui
ts
Con
nect
ions
Who
lesa
le In
tra-
Bui
ldin
g C
ircui
t R
enta
ls
Who
lesa
le
Rea
rran
gem
ents
Ave
rage
cos
t per
uni
t A
ppen
dix
1.1
External External External External External ExternalFully Allocated Cost (£ or %) £ £ £ £ £ £
Components Unit (a)Interconnect 2Mbps connection £/circuit 16,993.27 2,092.85 - - - - 5,865.23 Interconnect extension circuits (IEC) 2Mbps link £/circuit 229.07 - 229.07 - - - - Interconnect Extension Circuits (IEC) 2Mbps per km £/km 36.10 - - 36.10 - - - Intra Building Circuit (IBC) connection £/circuit 1.46 1.46 - - 1.46 - - Intra Building Circuit (IBC) rental £/circuit 62.33 - 62.33 - - 62.33 - Cumulo Rates Non NGA - Non Openreach % £24m 1.02 11.81 2.00 0.00 2.73 2.85 Ofcom Administration Fee Wholesale % £1m 0.40 0.25 0.01 0.33 0.04 0.19 PIMR Costs % £710m - - 4.59 - - - Revenue Receivables % £43m 6.34 3.96 0.13 5.28 0.66 2.97 Rounding (0.01) (0.01) 0.01 (0.01) - (0.01)Fully Allocated Cost (£ or %) 2,102.06 307.41 42.84 7.06 65.76 5,871.23
Volume (units) 33 2,678 54,681 309 13,315 70
Fully Allocated Cost (£m) 0.1 0.8 2.3 0.0 0.9 0.4
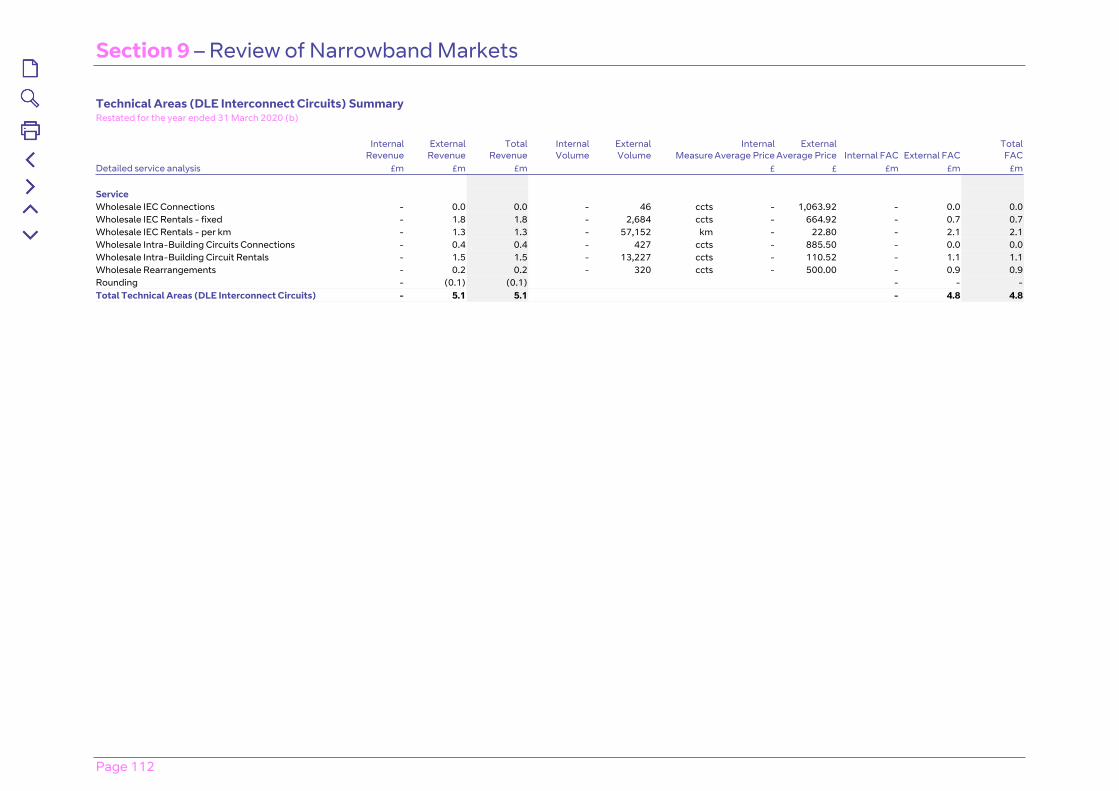
Section 9 – Review of Narrowband Markets
Page 112
Technical Areas (DLE Interconnect Circuits) SummaryRestated for the year ended 31 March 2020 (b)
Internal Revenue
External Revenue
Total Revenue
Internal Volume
External Volume Measure
Internal Average Price
External Average Price Internal FAC External FAC
TotalFAC
Detailed service analysis £m £m £m £ £ £m £m £m
ServiceWholesale IEC Connections - 0.0 0.0 - 46 ccts - 1,063.92 - 0.0 0.0Wholesale IEC Rentals - fixed - 1.8 1.8 - 2,684 ccts - 664.92 - 0.7 0.7Wholesale IEC Rentals - per km - 1.3 1.3 - 57,152 km - 22.80 - 2.1 2.1Wholesale Intra-Building Circuits Connections - 0.4 0.4 - 427 ccts - 885.50 - 0.0 0.0Wholesale Intra-Building Circuit Rentals - 1.5 1.5 - 13,227 ccts - 110.52 - 1.1 1.1Wholesale Rearrangements - 0.2 0.2 - 320 ccts - 500.00 - 0.9 0.9Rounding - (0.1) (0.1) - - -Total Technical Areas (DLE Interconnect Circuits) - 5.1 5.1 - 4.8 4.8
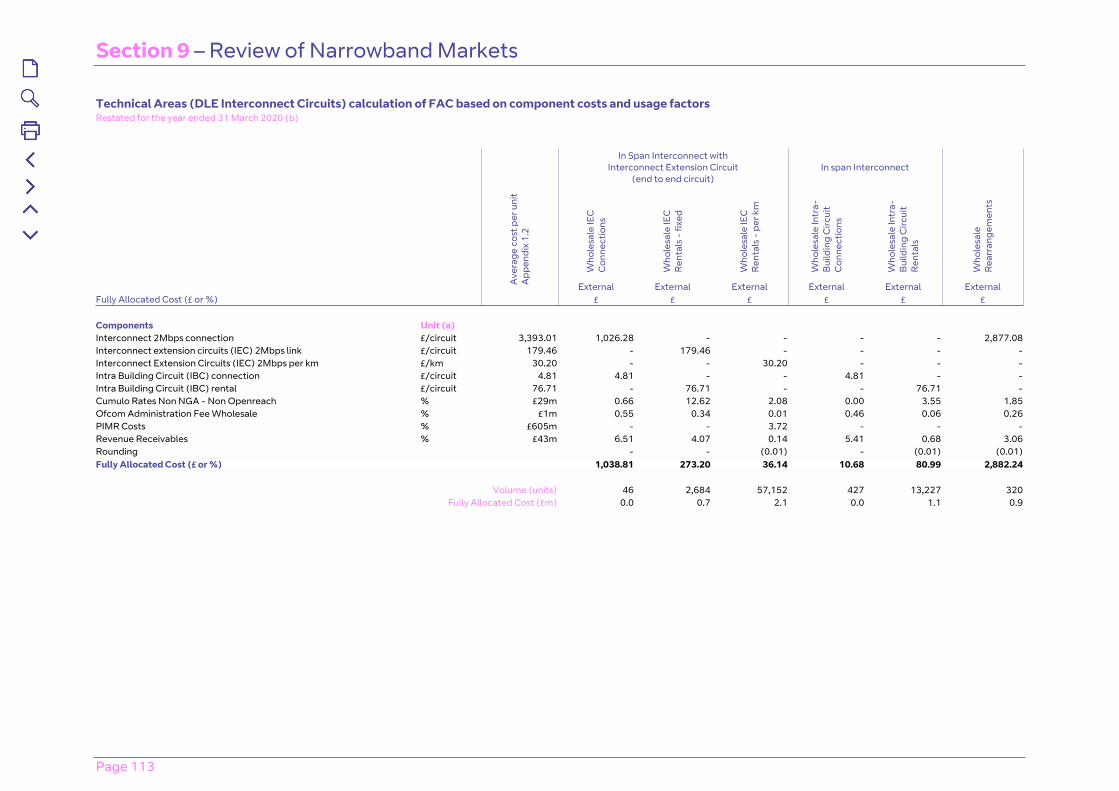
Section 9 – Review of Narrowband Markets
Page 113
Technical Areas (DLE Interconnect Circuits) calculation of FAC based on component costs and usage factorsRestated for the year ended 31 March 2020 (b)
In Span Interconnect withInterconnect Extension Circuit
(end to end circuit)In span Interconnect
Who
lesa
le IE
C
Con
nect
ions
Who
lesa
le IE
C
Ren
tals
- fi
xed
Who
lesa
le IE
C
Ren
tals
- p
er k
m
Who
lesa
le In
tra-
Bui
ldin
g C
ircui
t C
onne
ctio
ns
Who
lesa
le In
tra-
Bui
ldin
g C
ircui
t R
enta
ls
Who
lesa
le
Rea
rran
gem
ents
Ave
rage
cos
t per
uni
t A
ppen
dix
1.2
External External External External External ExternalFully Allocated Cost (£ or %) £ £ £ £ £ £
Components Unit (a)Interconnect 2Mbps connection £/circuit 3,393.01 1,026.28 - - - - 2,877.08Interconnect extension circuits (IEC) 2Mbps link £/circuit 179.46 - 179.46 - - - -Interconnect Extension Circuits (IEC) 2Mbps per km £/km 30.20 - - 30.20 - - -Intra Building Circuit (IBC) connection £/circuit 4.81 4.81 - - 4.81 - -Intra Building Circuit (IBC) rental £/circuit 76.71 - 76.71 - - 76.71 -Cumulo Rates Non NGA - Non Openreach % £29m 0.66 12.62 2.08 0.00 3.55 1.85Ofcom Administration Fee Wholesale % £1m 0.55 0.34 0.01 0.46 0.06 0.26PIMR Costs % £605m - - 3.72 - - -Revenue Receivables % £43m 6.51 4.07 0.14 5.41 0.68 3.06Rounding - - (0.01) - (0.01) (0.01)Fully Allocated Cost (£ or %) 1,038.81 273.20 36.14 10.68 80.99 2,882.24
Volume (units) 46 2,684 57,152 427 13,227 320Fully Allocated Cost (£m) 0.0 0.7 2.1 0.0 1.1 0.9
Page 114
Section 10Review of Wholesale Broadband Access Markets
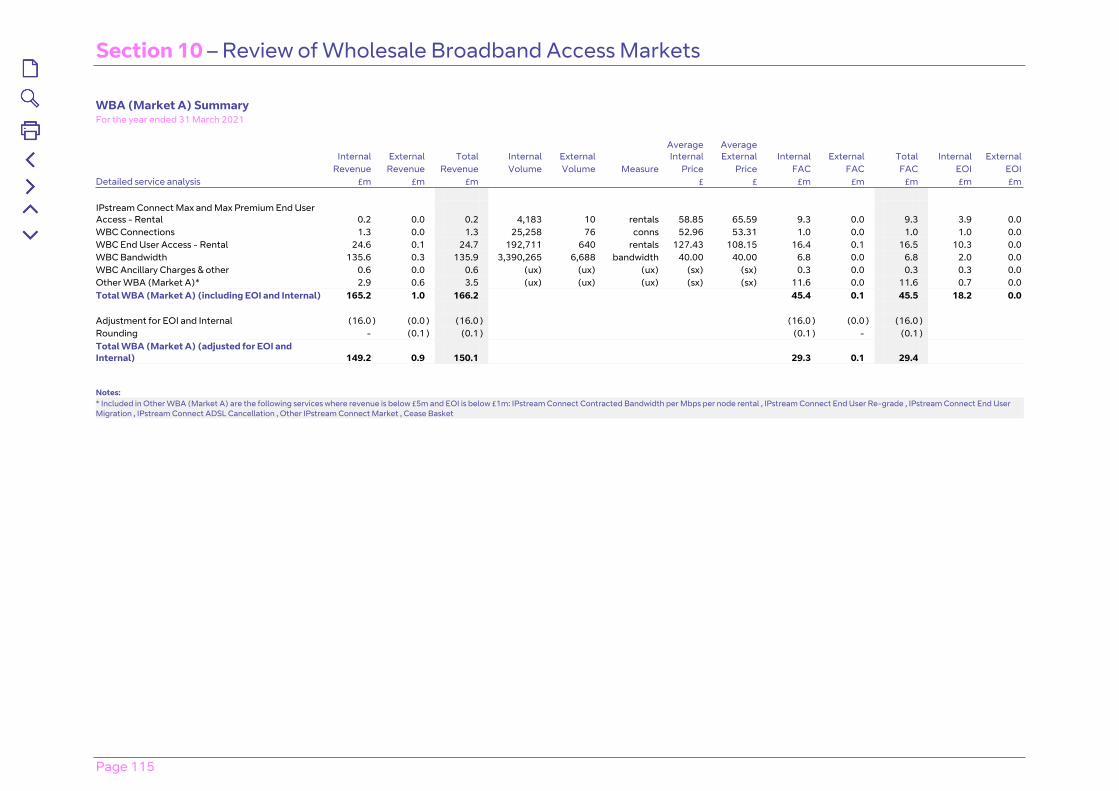
Section 10 – Review of Wholesale Broadband Access Markets
Page 115
WBA (Market A) SummaryFor the year ended 31 March 2021
Internal External Total Internal External Average Internal
Average External Internal External Total Internal External
Revenue Revenue Revenue Volume Volume Measure Price Price FAC FAC FAC EOI EOI Detailed service analysis £m £m £m £ £ £m £m £m £m £m
IPstream Connect Max and Max Premium End User Access - Rental 0.2 0.0 0.2 4,183 10 rentals 58.85 65.59 9.3 0.0 9.3 3.9 0.0 WBC Connections 1.3 0.0 1.3 25,258 76 conns 52.96 53.31 1.0 0.0 1.0 1.0 0.0 WBC End User Access - Rental 24.6 0.1 24.7 192,711 640 rentals 127.43 108.15 16.4 0.1 16.5 10.3 0.0 WBC Bandwidth 135.6 0.3 135.9 3,390,265 6,688 bandwidth 40.00 40.00 6.8 0.0 6.8 2.0 0.0 WBC Ancillary Charges & other 0.6 0.0 0.6 (ux) (ux) (ux) (sx) (sx) 0.3 0.0 0.3 0.3 0.0 Other WBA (Market A)* 2.9 0.6 3.5 (ux) (ux) (ux) (sx) (sx) 11.6 0.0 11.6 0.7 0.0 Total WBA (Market A) (including EOI and Internal) 165.2 1.0 166.2 45.4 0.1 45.5 18.2 0.0
Adjustment for EOI and Internal (16.0 ) (0.0 ) (16.0 ) (16.0 ) (0.0 ) (16.0 )Rounding - (0.1 ) (0.1 ) (0.1 ) - (0.1 )Total WBA (Market A) (adjusted for EOI and Internal) 149.2 0.9 150.1 29.3 0.1 29.4
Notes:* Included in Other WBA (Market A) are the following services where revenue is below £5m and EOI is below £1m: IPstream Connect Contracted Bandwidth per Mbps per node rental , IPstream Connect End User Re-grade , IPstream Connect End User Migration , IPstream Connect ADSL Cancellation , Other IPstream Connect Market , Cease Basket

Section 10 – Review of Wholesale Broadband Access Markets
Page 116
WBA (Market A) EOIFor the year ended 31 March 2021
Ave
rage
EO
I Inp
ut p
er u
nit
IPst
ream
Con
nect
Max
an
d M
ax P
rem
ium
End
U
ser A
cces
s -
Ren
tal
WB
C C
onne
ctio
ns
WB
C E
nd U
ser A
cces
s -
Ren
tal
WB
C B
andw
idth
WB
C A
ncill
ary
Cha
rges
&
othe
r
EOI O
ther
Ser
vice
s*
Internal External Internal External Internal External Internal External Internal External Internal ExternalEOI Charge (£ or %) £ £ £ £ £ £ £ £ % % % %
Part Service Description Unit (a)SMPF New Provides Costs - Internal EOI Charges conns 22.71 - - 10.01 8.07 - - - - - - 0.9% 0.8%SMPF Single Migrations Costs - Internal EOI Charges migrations 25.05 - - - - - - - - 8.7% 10.4% 0.2% -SMPF Rentals Costs - Internal EOI Charges rentals 6.16 6.16 6.16 - - 3.10 4.15 - - - - 0.8% 0.2%Other LLU ancillaries basket Costs - Internal EOI Charges ancillaries 455.57 - - - - - - - - 51.3% 51.5% 2.6% -SMPF Bulk Migrations Costs - Internal EOI Charges migrations 18.12 - - - - - - - - 0.0% 0.0% 0.0% -MPF Hard Ceases Costs - Internal EOI Charges ceases 17.87 - - - - - - - - - - 0.6% 0.9%SMPF Hard Ceases Costs - Internal EOI Charges ceases 14.48 - - - - - - - - - - 28.5% 45.7%Other Tie-cables and Comingling Costs - Internal EOI Charges % 22.75 415.98 415.98 - - 2.55 3.41 - - - - - -GEA FTTC rentals (all other speeds except 40/10) - Internal EOI Charges rentals 76.75 - - - - 26.00 17.15 - - - - - -GEA FTTC 40/10 Rentals - Internal EOI Charges rentals 59.97 - - - - 6.47 4.27 - - - - - -GEA Other Rentals (all other speeds except 40/10) - Internal EOI Charges rentals 188.80 - - - - 7.08 4.67 - - - - - -GEA Other 40/10 Rentals - Internal EOI Charges rentals 156.78 - - - - 0.55 0.36 - - - - - -MPF Cancellation of orders - Internal EOI Charges ancillaries 5.55 - - - - - - - - 0.1% 0.1% 0.0% -GEA Other FTTC PCP Only Install Connections - Internal EOI Charges conns 46.84 - - 10.38 12.40 - - - - - - - -GEA FTTC 40/10 PCP Only Install Connections - Internal EOI Charges conns 46.84 - - 7.25 8.65 - - - - - - - -GEA FTTC connections - Internal EOI Charges conns 98.90 - - 1.19 1.42 - - - - - - - -GEA FTTP connections - Internal EOI Charges conns 54.49 - - 6.84 8.17 - - - - - - - -GEA FTTC 40/10 Connections - Internal EOI Charges conns 99.00 - - 0.81 0.96 - - - - - - - -GEA Other FTTC Start of a Stopped Line Connections - Internal EOI Charges conns 3.06 - - 0.12 0.15 - - - - - - - -GEA 40/10 FTTP Other Connections - Internal EOI Charges conns 55.30 - - 0.31 0.37 - - - - - - - -GEA FTTC 40/10 Start of a Stopped Line Connections - Internal EOI Charges conns 3.06 - - 0.07 0.08 - - - - - - - -GEA FTTP 40/10 Conns Voice and Data - Internal EOI Charges conns 98.48 - - 0.00 0.00 - - - - - - - -GEA CP to CP Migration Costs - Internal EOI Charges migrations 3.06 - - - - - - - - 39.9% 38.1% - -G Fast Rentals - Internal EOI Charges % 108.20 - - - - 0.65 0.43 - - - - - -G Fast Connections - Internal EOI Charges % 32.98 - - 1.29 1.54 - - - - - - - -EBD ONBS Rentals - Internal EOI Charges (Inter - BT Only) rentals 3,030.13 - - - - - - 0.00 0.01 - - - -EBD ONBS >1Gbps Rentals - Internal EOI Charges (Inter - BT Only) rentals 11,172.66 - - - - - - 0.09 0.09 - - - -EBD ONBS Connection - Internal EOI Charges (Inter - BT Only) conns 2,100.00 - - - - - - 0.00 0.00 - - - -EBD ONBS >1Gbps Connections - Internal EOI Charges (Inter - BT Only) conns 7,236.83 - - - - - - 0.01 0.01 - - - -EBD ONBS Rentals - Internal EOI Charges (Inter - BT+1) rentals 2,797.05 - - - - - - 0.00 0.00 - - - -EBD ONBS >1Gbps Rentals - Internal EOI Charges (Inter - BT+1) rentals 10,108.55 - - - - - - 0.08 0.08 - - - -EBD ONBS Connection - Internal EOI Charges (Inter - BT+1) conns 2,100.00 - - - - - - 0.00 0.00 - - - -EBD ONBS >1Gbps Connections - Internal EOI Charges (Inter - BT+1) conns 7,237.70 - - - - - - 0.01 0.01 - - - -Subtotal 422.14 422.14 38.27 41.81 46.40 34.44 0.19 0.20 100.0% 100.1% 33.6% 47.6%

Section 10 – Review of Wholesale Broadband Access Markets
Page 117
WBA (Market A) EOI (continued)For the year ended 31 March 2021
Ave
rage
EO
I Inp
ut p
er u
nit
IPst
ream
Con
nect
Max
an
d M
ax P
rem
ium
End
U
ser A
cces
s -
Ren
tal
WB
C C
onne
ctio
ns
WB
C E
nd U
ser A
cces
s -
Ren
tal
WB
C B
andw
idth
WB
C A
ncill
ary
Cha
rges
&
othe
r
EOI O
ther
Ser
vice
s*
Internal External Internal External Internal External Internal External Internal External Internal ExternalEOI Charge (£ or %) £ £ £ £ £ £ £ £ % % % %
Part Service Description Unit (a)EBD ONBS Rentals - Internal EOI Charges (Inter - BT+2 or more) rentals 2,654.62 - - - - - - 0.00 0.00 - - - -EBD ONBS >1Gbps Rentals - Internal EOI Charges (Inter - BT+2 or more) rentals 9,844.46 - - - - - - 0.08 0.08 - - - -EBD ONBS >1Gbps Connections - Internal EOI Charges (Inter - BT+2 or more) 7,218.80 - - - - - - 0.01 0.01 - - - -Special Faults Investigation - Internal EOI Charges ancillaries 102.92 1.93 1.93 - - 0.97 1.30 - - - - 25.6% 10.0%Tie Cables Costs - Internal EOI Charges ancillaries 32.96 513.23 513.23 - - 2.55 3.42 - - - - - -21CN Backhaul EAD - Internal EOI Charges ccts 5,313.13 - - - - - - 0.30 0.21 - - - -WLA Time Related Charges Costs - Internal EOI Charges ancillaries 77.24 1.42 - - - 1.37 1.00 - - - - 0.1% 0.9%SMPF Expedites - Internal EOI Charges ancillaries 82.43 - - - - - - - - - - 1.3% 0.8%NGA Expedites - Internal EOI Charges ancillaries 101.38 - - - - - - - - - - 1.3% 1.2%SMPF Enhanced Care - Internal EOI Charges ancillaries 37.72 - - - - - - - - - - 33.5% 36.9%NGA Enhanced Care - Internal EOI Charges ancillaries 41.28 - - - - - - - - - - 4.6% 2.6%NGA Visit Assure EOI - Internal EOI Charges ancillaries 130.00 - - - - 2.40 1.59 - - - - - -Copper Broadband Boost - Internal EOI Charges ancillaries 152.36 - - - - - - - - - - 0.1% -Roundings - 0.01 1.02 - 0.01 - - - - (0.1)% (0.1)% -EOI cost (£) or % 938.72 937.31 39.29 41.81 53.70 41.75 0.58 0.50 100.0% 100.0% 100.0% 100.0%
Volumes 4,183 10 25,258 76 192,711 640 3,390,265 6,688 (ux) (ux) (ux) (ux)Unit Rentals Rentals Conns Conns Rentals Rentals Bandwidth Bandwidth
Total EOI Cost (£m) 3.9 0.0 1.0 0.0 10.3 0.0 2.0 0.0 0.3 0.0 0.7 0.0
Notes:* Included in EOI Other Services are the following services where EOI is below £1m: IPstream Connect Contracted Bandwidth per Mbps per node rental , IPStream Connect End User Re-grade , IPstream Connect End User Migration , IPstream Connect ADSL Cancellation , Other IPstream Connect Market , Cease Basket
conns
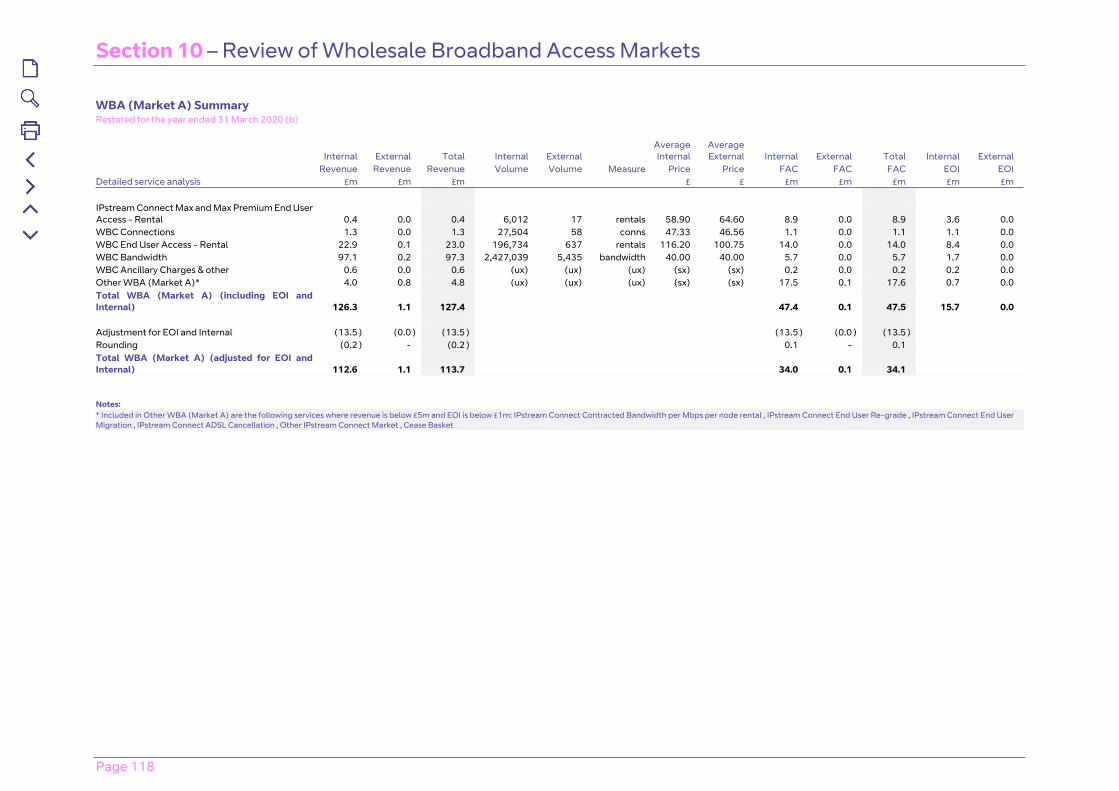
Section 10 – Review of Wholesale Broadband Access Markets
Page 118
WBA (Market A) SummaryRestated for the year ended 31 March 2020 (b)
Internal External Total Internal External Average Internal
Average External Internal External Total Internal External
Revenue Revenue Revenue Volume Volume Measure Price Price FAC FAC FAC EOI EOI Detailed service analysis £m £m £m £ £ £m £m £m £m £m
IPstream Connect Max and Max Premium End User Access - Rental 0.4 0.0 0.4 6,012 17 rentals 58.90 64.60 8.9 0.0 8.9 3.6 0.0 WBC Connections 1.3 0.0 1.3 27,504 58 conns 47.33 46.56 1.1 0.0 1.1 1.1 0.0 WBC End User Access - Rental 22.9 0.1 23.0 196,734 637 rentals 116.20 100.75 14.0 0.0 14.0 8.4 0.0 WBC Bandwidth 97.1 0.2 97.3 2,427,039 5,435 bandwidth 40.00 40.00 5.7 0.0 5.7 1.7 0.0 WBC Ancillary Charges & other 0.6 0.0 0.6 (ux) (ux) (ux) (sx) (sx) 0.2 0.0 0.2 0.2 0.0 Other WBA (Market A)* 4.0 0.8 4.8 (ux) (ux) (ux) (sx) (sx) 17.5 0.1 17.6 0.7 0.0 Total WBA (Market A) (including EOI and Internal) 126.3 1.1 127.4 47.4 0.1 47.5 15.7 0.0
Adjustment for EOI and Internal (13.5 ) (0.0 ) (13.5 ) (13.5 ) (0.0 ) (13.5 )Rounding (0.2 ) - (0.2 ) 0.1 - 0.1Total WBA (Market A) (adjusted for EOI and Internal) 112.6 1.1 113.7 34.0 0.1 34.1
Notes:* Included in Other WBA (Market A) are the following services where revenue is below £5m and EOI is below £1m: IPstream Connect Contracted Bandwidth per Mbps per node rental , IPstream Connect End User Re-grade , IPstream Connect End User Migration , IPstream Connect ADSL Cancellation , Other IPstream Connect Market , Cease Basket
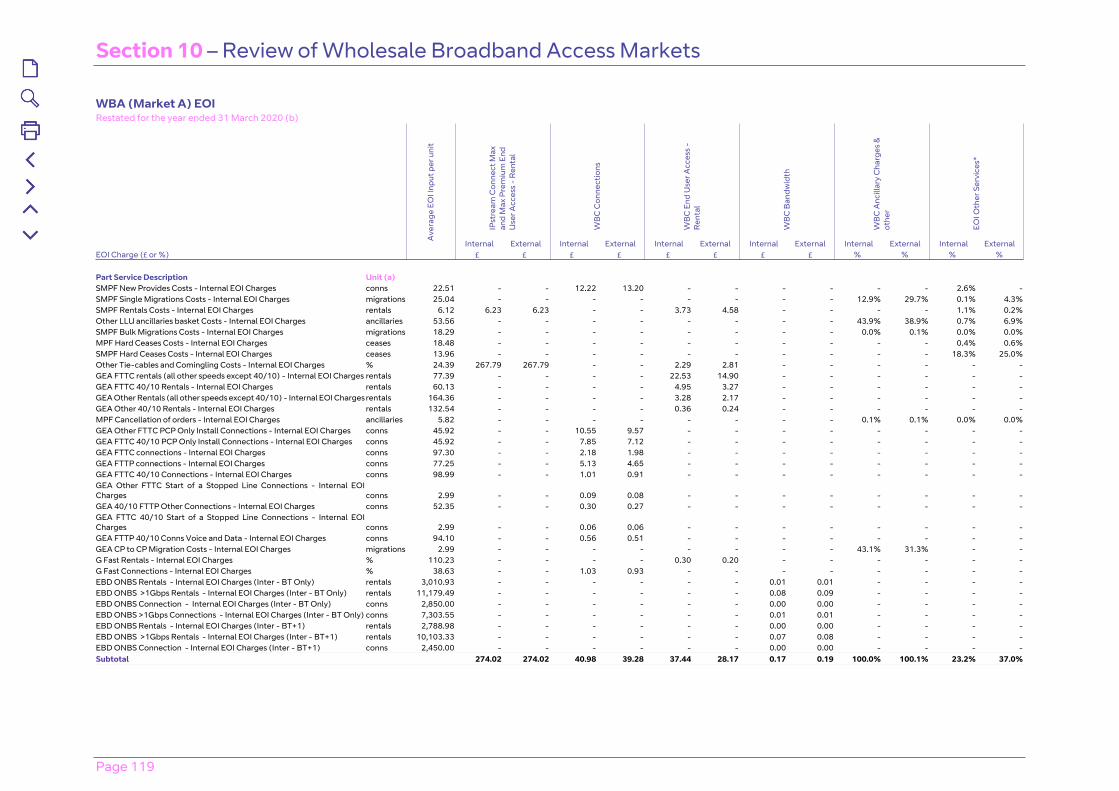
Section 10 – Review of Wholesale Broadband Access Markets
Page 119
WBA (Market A) EOIRestated for the year ended 31 March 2020 (b)
IPst
ream
Con
nect
Max
an
d M
ax P
rem
ium
End
U
ser A
cces
s -
Ren
tal
WB
C C
onne
ctio
ns
WB
C E
nd U
ser A
cces
s -
Ren
tal
WB
C B
andw
idth
WB
C A
ncill
ary
Cha
rges
&
othe
r
EOI O
ther
Ser
vice
s*
Ave
rage
EO
I Inp
ut p
er u
nit
Internal External Internal External Internal External Internal External Internal External Internal ExternalEOI Charge (£ or %) £ £ £ £ £ £ £ £ % % % %
Part Service Description Unit (a)SMPF New Provides Costs - Internal EOI Charges conns 22.51 - - 12.22 13.20 - - - - - - 2.6% -SMPF Single Migrations Costs - Internal EOI Charges migrations 25.04 - - - - - - - - 12.9% 29.7% 0.1% 4.3%SMPF Rentals Costs - Internal EOI Charges rentals 6.12 6.23 6.23 - - 3.73 4.58 - - - - 1.1% 0.2%Other LLU ancillaries basket Costs - Internal EOI Charges ancillaries 53.56 - - - - - - - - 43.9% 38.9% 0.7% 6.9%SMPF Bulk Migrations Costs - Internal EOI Charges migrations 18.29 - - - - - - - - 0.0% 0.1% 0.0% 0.0%MPF Hard Ceases Costs - Internal EOI Charges ceases 18.48 - - - - - - - - - - 0.4% 0.6%SMPF Hard Ceases Costs - Internal EOI Charges ceases 13.96 - - - - - - - - - - 18.3% 25.0%Other Tie-cables and Comingling Costs - Internal EOI Charges % 24.39 267.79 267.79 - - 2.29 2.81 - - - - - -GEA FTTC rentals (all other speeds except 40/10) - Internal EOI Charges rentals 77.39 - - - - 22.53 14.90 - - - - - -GEA FTTC 40/10 Rentals - Internal EOI Charges rentals 60.13 - - - - 4.95 3.27 - - - - - -GEA Other Rentals (all other speeds except 40/10) - Internal EOI Charges rentals 164.36 - - - - 3.28 2.17 - - - - - -GEA Other 40/10 Rentals - Internal EOI Charges rentals 132.54 - - - - 0.36 0.24 - - - - - -MPF Cancellation of orders - Internal EOI Charges ancillaries 5.82 - - - - - - - - 0.1% 0.1% 0.0% 0.0%GEA Other FTTC PCP Only Install Connections - Internal EOI Charges conns 45.92 - - 10.55 9.57 - - - - - - - -GEA FTTC 40/10 PCP Only Install Connections - Internal EOI Charges conns 45.92 - - 7.85 7.12 - - - - - - - -GEA FTTC connections - Internal EOI Charges conns 97.30 - - 2.18 1.98 - - - - - - - -GEA FTTP connections - Internal EOI Charges conns 77.25 - - 5.13 4.65 - - - - - - - -GEA FTTC 40/10 Connections - Internal EOI Charges conns 98.99 - - 1.01 0.91 - - - - - - - -GEA Other FTTC Start of a Stopped Line Connections - Internal EOI Charges conns 2.99 - - 0.09 0.08 - - - - - - - -GEA 40/10 FTTP Other Connections - Internal EOI Charges conns 52.35 - - 0.30 0.27 - - - - - - - -GEA FTTC 40/10 Start of a Stopped Line Connections - Internal EOI Charges conns 2.99 - - 0.06 0.06 - - - - - - - -GEA FTTP 40/10 Conns Voice and Data - Internal EOI Charges conns 94.10 - - 0.56 0.51 - - - - - - - -GEA CP to CP Migration Costs - Internal EOI Charges migrations 2.99 - - - - - - - - 43.1% 31.3% - -G Fast Rentals - Internal EOI Charges % 110.23 - - - - 0.30 0.20 - - - - - -G Fast Connections - Internal EOI Charges % 38.63 - - 1.03 0.93 - - - - - - - -EBD ONBS Rentals - Internal EOI Charges (Inter - BT Only) rentals 3,010.93 - - - - - - 0.01 0.01 - - - -EBD ONBS >1Gbps Rentals - Internal EOI Charges (Inter - BT Only) rentals 11,179.49 - - - - - - 0.08 0.09 - - - -EBD ONBS Connection - Internal EOI Charges (Inter - BT Only) conns 2,850.00 - - - - - - 0.00 0.00 - - - -EBD ONBS >1Gbps Connections - Internal EOI Charges (Inter - BT Only) conns 7,303.55 - - - - - - 0.01 0.01 - - - -EBD ONBS Rentals - Internal EOI Charges (Inter - BT+1) rentals 2,788.98 - - - - - - 0.00 0.00 - - - -EBD ONBS >1Gbps Rentals - Internal EOI Charges (Inter - BT+1) rentals 10,103.33 - - - - - - 0.07 0.08 - - - -EBD ONBS Connection - Internal EOI Charges (Inter - BT+1) conns 2,450.00 - - - - - - 0.00 0.00 - - - -Subtotal 274.02 274.02 40.98 39.28 37.44 28.17 0.17 0.19 100.0% 100.1% 23.2% 37.0%
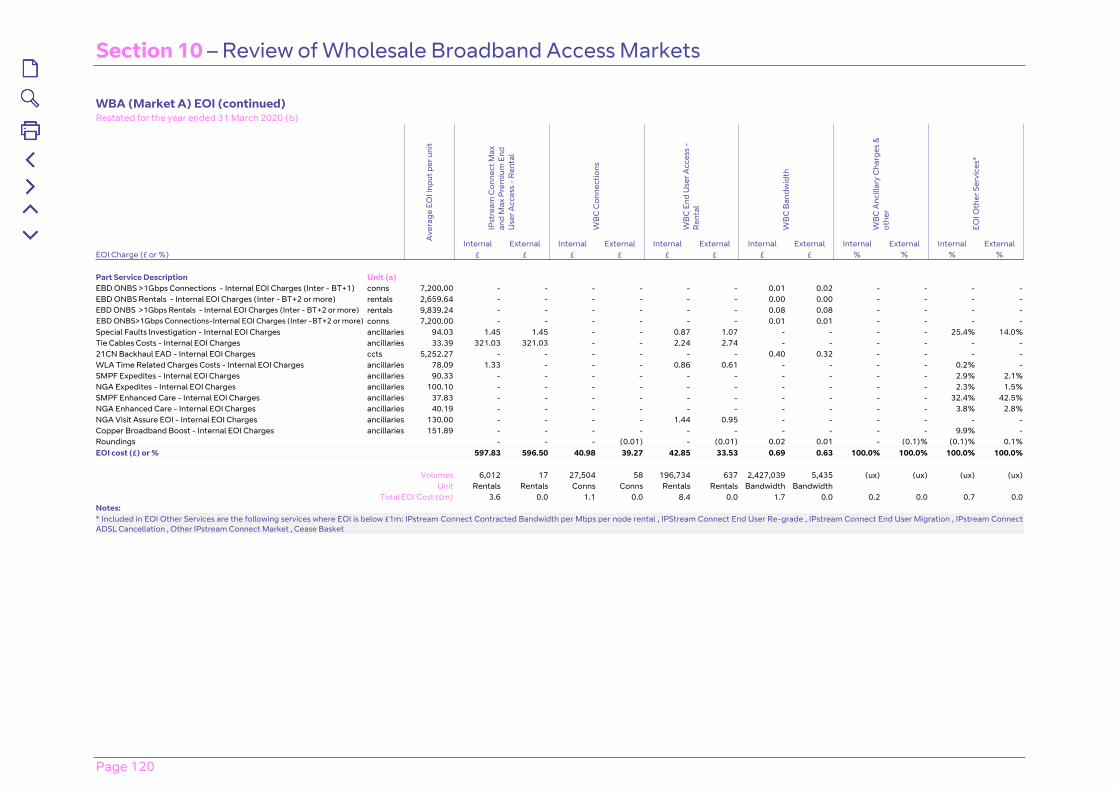
Section 10 – Review of Wholesale Broadband Access Markets
Page 120
WBA (Market A) EOI (continued)Restated for the year ended 31 March 2020 (b)
IPst
ream
Con
nect
Max
an
d M
ax P
rem
ium
End
U
ser A
cces
s -
Ren
tal
WB
C C
onne
ctio
ns
WB
C E
nd U
ser A
cces
s -
Ren
tal
WB
C B
andw
idth
WB
C A
ncill
ary
Cha
rges
&
othe
r
EOI O
ther
Ser
vice
s*
Ave
rage
EO
I Inp
ut p
er u
nit
Internal External Internal External Internal External Internal External Internal External Internal ExternalEOI Charge (£ or %) £ £ £ £ £ £ £ £ % % % %
Part Service Description Unit (a)EBD ONBS >1Gbps Connections - Internal EOI Charges (Inter - BT+1) conns 7,200.00 - - - - - - 0.01 0.02 - - - -EBD ONBS Rentals - Internal EOI Charges (Inter - BT+2 or more) rentals 2,659.64 - - - - - - 0.00 0.00 - - - -EBD ONBS >1Gbps Rentals - Internal EOI Charges (Inter - BT+2 or more) rentals 9,839.24 - - - - - - 0.08 0.08 - - - -EBD ONBS>1Gbps Connections-Internal EOI Charges (Inter -BT+2 or more) conns 7,200.00 - - - - - - 0.01 0.01 - - - -Special Faults Investigation - Internal EOI Charges ancillaries 94.03 1.45 1.45 - - 0.87 1.07 - - - - 25.4% 14.0%Tie Cables Costs - Internal EOI Charges ancillaries 33.39 321.03 321.03 - - 2.24 2.74 - - - - - -21CN Backhaul EAD - Internal EOI Charges ccts 5,252.27 - - - - - - 0.40 0.32 - - - -WLA Time Related Charges Costs - Internal EOI Charges ancillaries 78.09 1.33 - - - 0.86 0.61 - - - - 0.2% -SMPF Expedites - Internal EOI Charges ancillaries 90.33 - - - - - - - - - - 2.9% 2.1%NGA Expedites - Internal EOI Charges ancillaries 100.10 - - - - - - - - - - 2.3% 1.5%SMPF Enhanced Care - Internal EOI Charges ancillaries 37.83 - - - - - - - - - - 32.4% 42.5%NGA Enhanced Care - Internal EOI Charges ancillaries 40.19 - - - - - - - - - - 3.8% 2.8%NGA Visit Assure EOI - Internal EOI Charges ancillaries 130.00 - - - - 1.44 0.95 - - - - - -Copper Broadband Boost - Internal EOI Charges ancillaries 151.89 - - - - - - - - - - 9.9% -Roundings - - - (0.01) - (0.01) 0.02 0.01 - (0.1)% (0.1)% 0.1%EOI cost (£) or % 597.83 596.50 40.98 39.27 42.85 33.53 0.69 0.63 100.0% 100.0% 100.0% 100.0%
Volumes 6,012 17 27,504 58 196,734 637 2,427,039 5,435 (ux) (ux) (ux) (ux)Unit Rentals Rentals Conns Conns Rentals Rentals Bandwidth Bandwidth
Total EOI Cost (£m) 3.6 0.0 1.1 0.0 8.4 0.0 1.7 0.0 0.2 0.0 0.7 0.0Notes:* Included in EOI Other Services are the following services where EOI is below £1m: IPstream Connect Contracted Bandwidth per Mbps per node rental , IPStream Connect End User Re-grade , IPstream Connect End User Migration , IPstream Connect ADSL Cancellation , Other IPstream Connect Market , Cease Basket

Page 121
Appendix 1Network Activity Statements
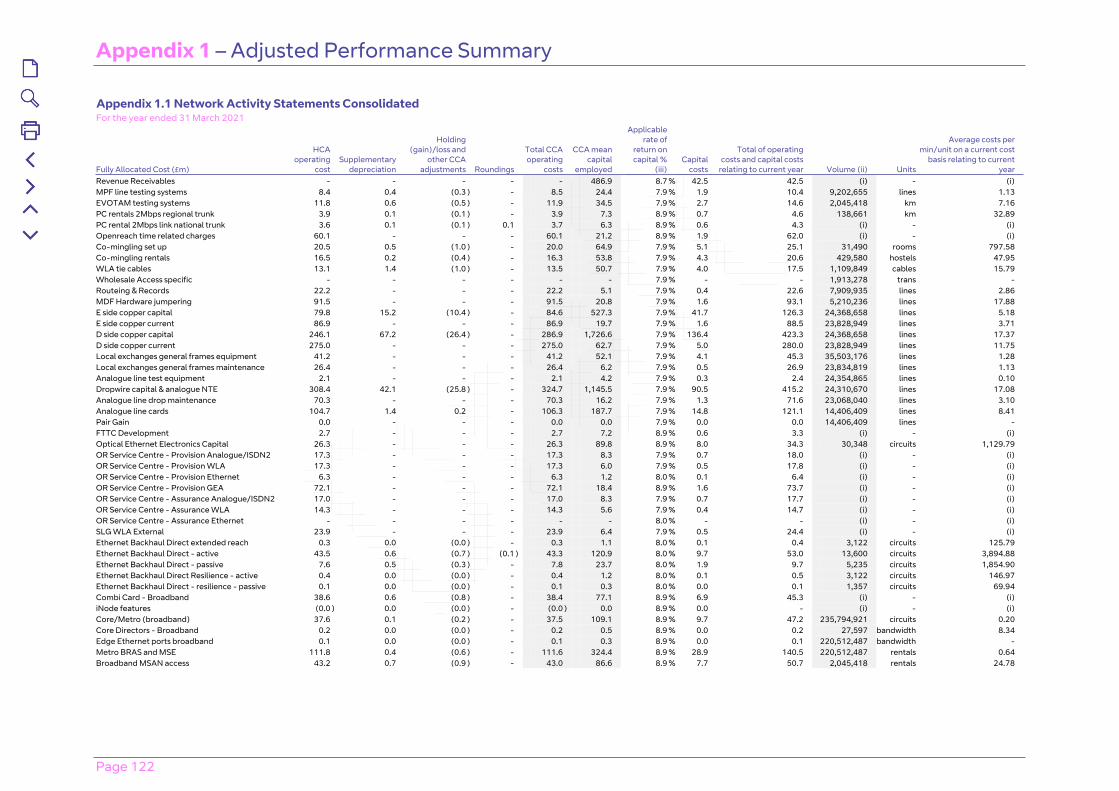
Appendix 1 – Adjusted Performance Summary
Page 122
Appendix 1.1 Network Activity Statements ConsolidatedFor the year ended 31 March 2021
Fully Allocated Cost (£m)
HCA operating
cost Supplementary
depreciation
Holding (gain)/loss and
other CCA adjustments Roundings
Total CCA operating
costs
CCA mean capital
employed
Applicable rate of
return on capital %
(iii) Capital
costs
Total of operating costs and capital costs
relating to current year Volume (ii) Units
Average costs per min/unit on a current cost
basis relating to current year
Revenue Receivables - - - - - 486.9 8.7 % 42.5 42.5 (i) - (i) MPF line testing systems 8.4 0.4 (0.3 ) - 8.5 24.4 7.9 % 1.9 10.4 9,202,655 lines 1.13 EVOTAM testing systems 11.8 0.6 (0.5 ) - 11.9 34.5 7.9 % 2.7 14.6 2,045,418 km 7.16 PC rentals 2Mbps regional trunk 3.9 0.1 (0.1 ) - 3.9 7.3 8.9 % 0.7 4.6 138,661 km 32.89 PC rental 2Mbps link national trunk 3.6 0.1 (0.1 ) 0.1 3.7 6.3 8.9 % 0.6 4.3 (i) - (i) Openreach time related charges 60.1 - - - 60.1 21.2 8.9 % 1.9 62.0 (i) - (i) Co-mingling set up 20.5 0.5 (1.0 ) - 20.0 64.9 7.9 % 5.1 25.1 31,490 rooms 797.58 Co-mingling rentals 16.5 0.2 (0.4 ) - 16.3 53.8 7.9 % 4.3 20.6 429,580 hostels 47.95 WLA tie cables 13.1 1.4 (1.0 ) - 13.5 50.7 7.9 % 4.0 17.5 1,109,849 cables 15.79 Wholesale Access specific - - - - - - 7.9 % - - 1,913,278 trans - Routeing & Records 22.2 - - - 22.2 5.1 7.9 % 0.4 22.6 7,909,935 lines 2.86 MDF Hardware jumpering 91.5 - - - 91.5 20.8 7.9 % 1.6 93.1 5,210,236 lines 17.88 E side copper capital 79.8 15.2 (10.4 ) - 84.6 527.3 7.9 % 41.7 126.3 24,368,658 lines 5.18 E side copper current 86.9 - - - 86.9 19.7 7.9 % 1.6 88.5 23,828,949 lines 3.71 D side copper capital 246.1 67.2 (26.4 ) - 286.9 1,726.6 7.9 % 136.4 423.3 24,368,658 lines 17.37 D side copper current 275.0 - - - 275.0 62.7 7.9 % 5.0 280.0 23,828,949 lines 11.75 Local exchanges general frames equipment 41.2 - - - 41.2 52.1 7.9 % 4.1 45.3 35,503,176 lines 1.28 Local exchanges general frames maintenance 26.4 - - - 26.4 6.2 7.9 % 0.5 26.9 23,834,819 lines 1.13 Analogue line test equipment 2.1 - - - 2.1 4.2 7.9 % 0.3 2.4 24,354,865 lines 0.10 Dropwire capital & analogue NTE 308.4 42.1 (25.8 ) - 324.7 1,145.5 7.9 % 90.5 415.2 24,310,670 lines 17.08 Analogue line drop maintenance 70.3 - - - 70.3 16.2 7.9 % 1.3 71.6 23,068,040 lines 3.10 Analogue line cards 104.7 1.4 0.2 - 106.3 187.7 7.9 % 14.8 121.1 14,406,409 lines 8.41 Pair Gain 0.0 - - - 0.0 0.0 7.9 % 0.0 0.0 14,406,409 lines - FTTC Development 2.7 - - - 2.7 7.2 8.9 % 0.6 3.3 (i) - (i) Optical Ethernet Electronics Capital 26.3 - - - 26.3 89.8 8.9 % 8.0 34.3 30,348 circuits 1,129.79 OR Service Centre - Provision Analogue/ISDN2 17.3 - - - 17.3 8.3 7.9 % 0.7 18.0 (i) - (i) OR Service Centre - Provision WLA 17.3 - - - 17.3 6.0 7.9 % 0.5 17.8 (i) - (i) OR Service Centre - Provision Ethernet 6.3 - - - 6.3 1.2 8.0 % 0.1 6.4 (i) - (i) OR Service Centre - Provision GEA 72.1 - - - 72.1 18.4 8.9 % 1.6 73.7 (i) - (i) OR Service Centre - Assurance Analogue/ISDN2 17.0 - - - 17.0 8.3 7.9 % 0.7 17.7 (i) - (i) OR Service Centre - Assurance WLA 14.3 - - - 14.3 5.6 7.9 % 0.4 14.7 (i) - (i) OR Service Centre - Assurance Ethernet - - - - - - 8.0 % - - (i) - (i) SLG WLA External 23.9 - - - 23.9 6.4 7.9 % 0.5 24.4 (i) - (i) Ethernet Backhaul Direct extended reach 0.3 0.0 (0.0 ) - 0.3 1.1 8.0 % 0.1 0.4 3,122 circuits 125.79 Ethernet Backhaul Direct - active 43.5 0.6 (0.7 ) (0.1 ) 43.3 120.9 8.0 % 9.7 53.0 13,600 circuits 3,894.88 Ethernet Backhaul Direct - passive 7.6 0.5 (0.3 ) - 7.8 23.7 8.0 % 1.9 9.7 5,235 circuits 1,854.90 Ethernet Backhaul Direct Resilience - active 0.4 0.0 (0.0 ) - 0.4 1.2 8.0 % 0.1 0.5 3,122 circuits 146.97 Ethernet Backhaul Direct - resilience - passive 0.1 0.0 (0.0 ) - 0.1 0.3 8.0 % 0.0 0.1 1,357 circuits 69.94 Combi Card - Broadband 38.6 0.6 (0.8 ) - 38.4 77.1 8.9 % 6.9 45.3 (i) - (i) iNode features (0.0 ) 0.0 (0.0 ) - (0.0 ) 0.0 8.9 % 0.0 - (i) - (i) Core/Metro (broadband) 37.6 0.1 (0.2 ) - 37.5 109.1 8.9 % 9.7 47.2 235,794,921 circuits 0.20 Core Directors - Broadband 0.2 0.0 (0.0 ) - 0.2 0.5 8.9 % 0.0 0.2 27,597 bandwidth 8.34 Edge Ethernet ports broadband 0.1 0.0 (0.0 ) - 0.1 0.3 8.9 % 0.0 0.1 220,512,487 bandwidth - Metro BRAS and MSE 111.8 0.4 (0.6 ) - 111.6 324.4 8.9 % 28.9 140.5 220,512,487 rentals 0.64 Broadband MSAN access 43.2 0.7 (0.9 ) - 43.0 86.6 8.9 % 7.7 50.7 2,045,418 rentals 24.78
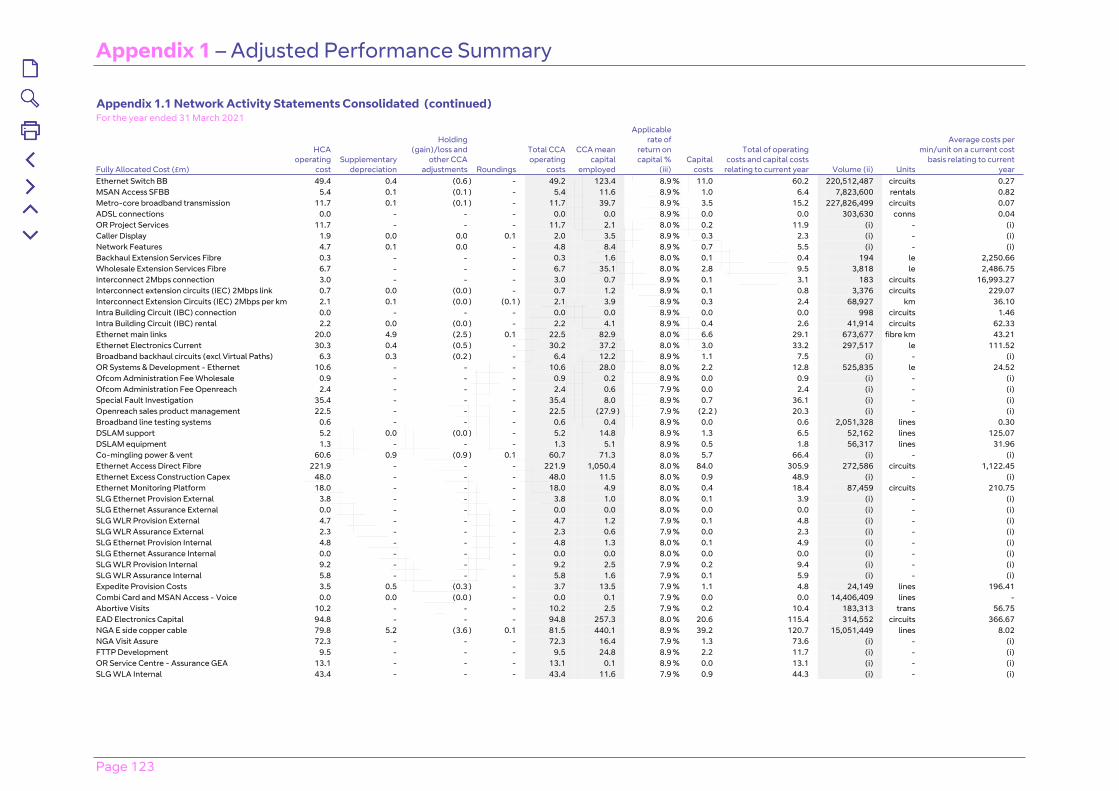
Appendix 1 – Adjusted Performance Summary
Page 123
Appendix 1.1 Network Activity Statements Consolidated (continued)For the year ended 31 March 2021
Fully Allocated Cost (£m)
HCA operating
cost Supplementary
depreciation
Holding (gain)/loss and
other CCA adjustments Roundings
Total CCA operating
costs
CCA mean capital
employed
Applicable rate of
return on capital %
(iii) Capital
costs
Total of operating costs and capital costs
relating to current year Volume (ii) Units
Average costs per min/unit on a current cost
basis relating to current year
Ethernet Switch BB 49.4 0.4 (0.6 ) - 49.2 123.4 8.9 % 11.0 60.2 220,512,487 circuits 0.27 MSAN Access SFBB 5.4 0.1 (0.1 ) - 5.4 11.6 8.9 % 1.0 6.4 7,823,600 rentals 0.82 Metro-core broadband transmission 11.7 0.1 (0.1 ) - 11.7 39.7 8.9 % 3.5 15.2 227,826,499 circuits 0.07 ADSL connections 0.0 - - - 0.0 0.0 8.9 % 0.0 0.0 303,630 conns 0.04 OR Project Services 11.7 - - - 11.7 2.1 8.0 % 0.2 11.9 (i) - (i) Caller Display 1.9 0.0 0.0 0.1 2.0 3.5 8.9 % 0.3 2.3 (i) - (i) Network Features 4.7 0.1 0.0 - 4.8 8.4 8.9 % 0.7 5.5 (i) - (i) Backhaul Extension Services Fibre 0.3 - - - 0.3 1.6 8.0 % 0.1 0.4 194 le 2,250.66 Wholesale Extension Services Fibre 6.7 - - - 6.7 35.1 8.0 % 2.8 9.5 3,818 le 2,486.75 Interconnect 2Mbps connection 3.0 - - - 3.0 0.7 8.9 % 0.1 3.1 183 circuits 16,993.27 Interconnect extension circuits (IEC) 2Mbps link 0.7 0.0 (0.0 ) - 0.7 1.2 8.9 % 0.1 0.8 3,376 circuits 229.07 Interconnect Extension Circuits (IEC) 2Mbps per km 2.1 0.1 (0.0 ) (0.1 ) 2.1 3.9 8.9 % 0.3 2.4 68,927 km 36.10 Intra Building Circuit (IBC) connection 0.0 - - - 0.0 0.0 8.9 % 0.0 0.0 998 circuits 1.46 Intra Building Circuit (IBC) rental 2.2 0.0 (0.0 ) - 2.2 4.1 8.9 % 0.4 2.6 41,914 circuits 62.33 Ethernet main links 20.0 4.9 (2.5 ) 0.1 22.5 82.9 8.0 % 6.6 29.1 673,677 fibre km 43.21 Ethernet Electronics Current 30.3 0.4 (0.5 ) - 30.2 37.2 8.0 % 3.0 33.2 297,517 le 111.52 Broadband backhaul circuits (excl Virtual Paths) 6.3 0.3 (0.2 ) - 6.4 12.2 8.9 % 1.1 7.5 (i) - (i) OR Systems & Development - Ethernet 10.6 - - - 10.6 28.0 8.0 % 2.2 12.8 525,835 le 24.52 Ofcom Administration Fee Wholesale 0.9 - - - 0.9 0.2 8.9 % 0.0 0.9 (i) - (i) Ofcom Administration Fee Openreach 2.4 - - - 2.4 0.6 7.9 % 0.0 2.4 (i) - (i) Special Fault Investigation 35.4 - - - 35.4 8.0 8.9 % 0.7 36.1 (i) - (i) Openreach sales product management 22.5 - - - 22.5 (27.9 ) 7.9 % (2.2 ) 20.3 (i) - (i) Broadband line testing systems 0.6 - - - 0.6 0.4 8.9 % 0.0 0.6 2,051,328 lines 0.30 DSLAM support 5.2 0.0 (0.0 ) - 5.2 14.8 8.9 % 1.3 6.5 52,162 lines 125.07 DSLAM equipment 1.3 - - - 1.3 5.1 8.9 % 0.5 1.8 56,317 lines 31.96 Co-mingling power & vent 60.6 0.9 (0.9 ) 0.1 60.7 71.3 8.0 % 5.7 66.4 (i) - (i) Ethernet Access Direct Fibre 221.9 - - - 221.9 1,050.4 8.0 % 84.0 305.9 272,586 circuits 1,122.45 Ethernet Excess Construction Capex 48.0 - - - 48.0 11.5 8.0 % 0.9 48.9 (i) - (i) Ethernet Monitoring Platform 18.0 - - - 18.0 4.9 8.0 % 0.4 18.4 87,459 circuits 210.75 SLG Ethernet Provision External 3.8 - - - 3.8 1.0 8.0 % 0.1 3.9 (i) - (i) SLG Ethernet Assurance External 0.0 - - - 0.0 0.0 8.0 % 0.0 0.0 (i) - (i) SLG WLR Provision External 4.7 - - - 4.7 1.2 7.9 % 0.1 4.8 (i) - (i) SLG WLR Assurance External 2.3 - - - 2.3 0.6 7.9 % 0.0 2.3 (i) - (i) SLG Ethernet Provision Internal 4.8 - - - 4.8 1.3 8.0 % 0.1 4.9 (i) - (i) SLG Ethernet Assurance Internal 0.0 - - - 0.0 0.0 8.0 % 0.0 0.0 (i) - (i) SLG WLR Provision Internal 9.2 - - - 9.2 2.5 7.9 % 0.2 9.4 (i) - (i) SLG WLR Assurance Internal 5.8 - - - 5.8 1.6 7.9 % 0.1 5.9 (i) - (i) Expedite Provision Costs 3.5 0.5 (0.3 ) - 3.7 13.5 7.9 % 1.1 4.8 24,149 lines 196.41 Combi Card and MSAN Access - Voice 0.0 0.0 (0.0 ) - 0.0 0.1 7.9 % 0.0 0.0 14,406,409 lines - Abortive Visits 10.2 - - - 10.2 2.5 7.9 % 0.2 10.4 183,313 trans 56.75 EAD Electronics Capital 94.8 - - - 94.8 257.3 8.0 % 20.6 115.4 314,552 circuits 366.67 NGA E side copper cable 79.8 5.2 (3.6 ) 0.1 81.5 440.1 8.9 % 39.2 120.7 15,051,449 lines 8.02 NGA Visit Assure 72.3 - - - 72.3 16.4 7.9 % 1.3 73.6 (i) - (i) FTTP Development 9.5 - - - 9.5 24.8 8.9 % 2.2 11.7 (i) - (i) OR Service Centre - Assurance GEA 13.1 - - - 13.1 0.1 8.9 % 0.0 13.1 (i) - (i) SLG WLA Internal 43.4 - - - 43.4 11.6 7.9 % 0.9 44.3 (i) - (i)
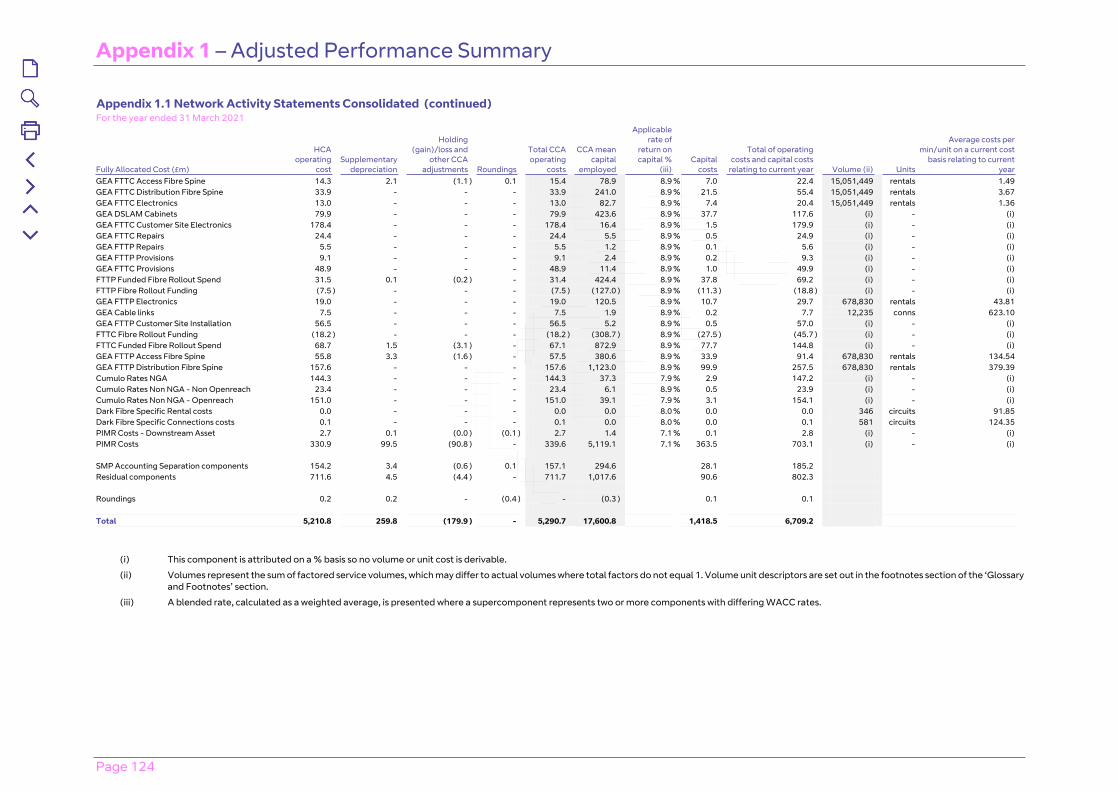
Appendix 1 – Adjusted Performance Summary
Page 124
Appendix 1.1 Network Activity Statements Consolidated (continued)For the year ended 31 March 2021
Fully Allocated Cost (£m)
HCA operating
cost Supplementary
depreciation
Holding (gain)/loss and
other CCA adjustments Roundings
Total CCA operating
costs
CCA mean capital
employed
Applicable rate of
return on capital %
(iii) Capital
costs
Total of operating costs and capital costs
relating to current year Volume (ii) Units
Average costs per min/unit on a current cost
basis relating to current year
GEA FTTC Access Fibre Spine 14.3 2.1 (1.1 ) 0.1 15.4 78.9 8.9 % 7.0 22.4 15,051,449 rentals 1.49 GEA FTTC Distribution Fibre Spine 33.9 - - - 33.9 241.0 8.9 % 21.5 55.4 15,051,449 rentals 3.67 GEA FTTC Electronics 13.0 - - - 13.0 82.7 8.9 % 7.4 20.4 15,051,449 rentals 1.36 GEA DSLAM Cabinets 79.9 - - - 79.9 423.6 8.9 % 37.7 117.6 (i) - (i) GEA FTTC Customer Site Electronics 178.4 - - - 178.4 16.4 8.9 % 1.5 179.9 (i) - (i) GEA FTTC Repairs 24.4 - - - 24.4 5.5 8.9 % 0.5 24.9 (i) - (i) GEA FTTP Repairs 5.5 - - - 5.5 1.2 8.9 % 0.1 5.6 (i) - (i) GEA FTTP Provisions 9.1 - - - 9.1 2.4 8.9 % 0.2 9.3 (i) - (i) GEA FTTC Provisions 48.9 - - - 48.9 11.4 8.9 % 1.0 49.9 (i) - (i) FTTP Funded Fibre Rollout Spend 31.5 0.1 (0.2 ) - 31.4 424.4 8.9 % 37.8 69.2 (i) - (i) FTTP Fibre Rollout Funding (7.5 ) - - - (7.5 ) (127.0 ) 8.9 % (11.3 ) (18.8 ) (i) - (i) GEA FTTP Electronics 19.0 - - - 19.0 120.5 8.9 % 10.7 29.7 678,830 rentals 43.81 GEA Cable links 7.5 - - - 7.5 1.9 8.9 % 0.2 7.7 12,235 conns 623.10 GEA FTTP Customer Site Installation 56.5 - - - 56.5 5.2 8.9 % 0.5 57.0 (i) - (i) FTTC Fibre Rollout Funding (18.2 ) - - - (18.2 ) (308.7 ) 8.9 % (27.5 ) (45.7 ) (i) - (i) FTTC Funded Fibre Rollout Spend 68.7 1.5 (3.1 ) - 67.1 872.9 8.9 % 77.7 144.8 (i) - (i) GEA FTTP Access Fibre Spine 55.8 3.3 (1.6 ) - 57.5 380.6 8.9 % 33.9 91.4 678,830 rentals 134.54 GEA FTTP Distribution Fibre Spine 157.6 - - - 157.6 1,123.0 8.9 % 99.9 257.5 678,830 rentals 379.39 Cumulo Rates NGA 144.3 - - - 144.3 37.3 7.9 % 2.9 147.2 (i) - (i) Cumulo Rates Non NGA - Non Openreach 23.4 - - - 23.4 6.1 8.9 % 0.5 23.9 (i) - (i) Cumulo Rates Non NGA - Openreach 151.0 - - - 151.0 39.1 7.9 % 3.1 154.1 (i) - (i) Dark Fibre Specific Rental costs 0.0 - - - 0.0 0.0 8.0 % 0.0 0.0 346 circuits 91.85 Dark Fibre Specific Connections costs 0.1 - - - 0.1 0.0 8.0 % 0.0 0.1 581 circuits 124.35 PIMR Costs - Downstream Asset 2.7 0.1 (0.0 ) (0.1 ) 2.7 1.4 7.1 % 0.1 2.8 (i) - (i) PIMR Costs 330.9 99.5 (90.8 ) - 339.6 5,119.1 7.1 % 363.5 703.1 (i) - (i)
SMP Accounting Separation components 154.2 3.4 (0.6 ) 0.1 157.1 294.6 28.1 185.2 Residual components 711.6 4.5 (4.4 ) - 711.7 1,017.6 90.6 802.3
Roundings 0.2 0.2 - (0.4 ) - (0.3 ) 0.1 0.1
Total 5,210.8 259.8 (179.9 ) - 5,290.7 17,600.8 1,418.5 6,709.2
(i) This component is attributed on a % basis so no volume or unit cost is derivable.
(ii) Volumes represent the sum of factored service volumes, which may differ to actual volumes where total factors do not equal 1. Volume unit descriptors are set out in the footnotes section of the ‘Glossary and Footnotes’ section.
(iii) A blended rate, calculated as a weighted average, is presented where a supercomponent represents two or more components with differing WACC rates.
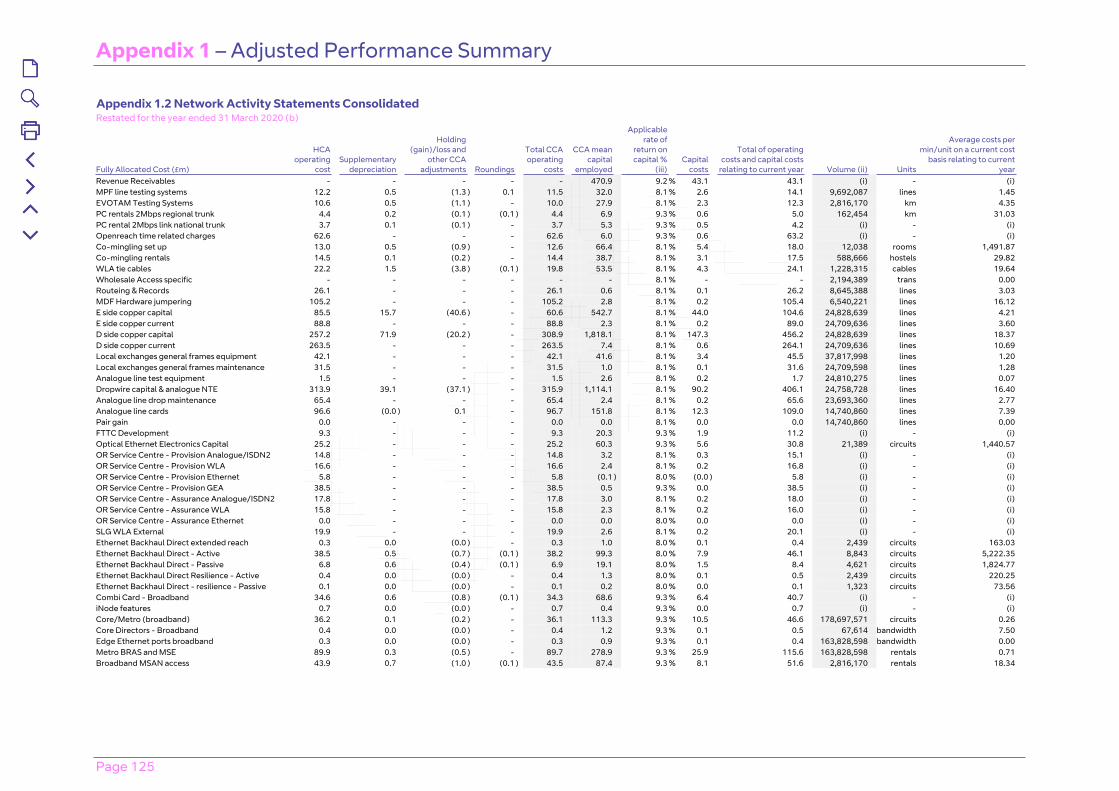
Appendix 1 – Adjusted Performance Summary
Page 125
Appendix 1.2 Network Activity Statements Consolidated Restated for the year ended 31 March 2020 (b)
Fully Allocated Cost (£m)
HCA operating
cost Supplementary
depreciation
Holding (gain)/loss and
other CCA adjustments Roundings
Total CCA operating
costs
CCA mean capital
employed
Applicable rate of
return on capital %
(iii) Capital
costs
Total of operating costs and capital costs
relating to current year Volume (ii) Units
Average costs per min/unit on a current cost
basis relating to current year
Revenue Receivables - - - - - 470.9 9.2 % 43.1 43.1 (i) - (i) MPF line testing systems 12.2 0.5 (1.3 ) 0.1 11.5 32.0 8.1 % 2.6 14.1 9,692,087 lines 1.45 EVOTAM Testing Systems 10.6 0.5 (1.1 ) - 10.0 27.9 8.1 % 2.3 12.3 2,816,170 km 4.35 PC rentals 2Mbps regional trunk 4.4 0.2 (0.1 ) (0.1 ) 4.4 6.9 9.3 % 0.6 5.0 162,454 km 31.03 PC rental 2Mbps link national trunk 3.7 0.1 (0.1 ) - 3.7 5.3 9.3 % 0.5 4.2 (i) - (i) Openreach time related charges 62.6 - - - 62.6 6.0 9.3 % 0.6 63.2 (i) - (i) Co-mingling set up 13.0 0.5 (0.9 ) - 12.6 66.4 8.1 % 5.4 18.0 12,038 rooms 1,491.87 Co-mingling rentals 14.5 0.1 (0.2 ) - 14.4 38.7 8.1 % 3.1 17.5 588,666 hostels 29.82 WLA tie cables 22.2 1.5 (3.8 ) (0.1 ) 19.8 53.5 8.1 % 4.3 24.1 1,228,315 cables 19.64 Wholesale Access specific - - - - - - 8.1 % - - 2,194,389 trans 0.00 Routeing & Records 26.1 - - - 26.1 0.6 8.1 % 0.1 26.2 8,645,388 lines 3.03 MDF Hardware jumpering 105.2 - - - 105.2 2.8 8.1 % 0.2 105.4 6,540,221 lines 16.12 E side copper capital 85.5 15.7 (40.6 ) - 60.6 542.7 8.1 % 44.0 104.6 24,828,639 lines 4.21 E side copper current 88.8 - - - 88.8 2.3 8.1 % 0.2 89.0 24,709,636 lines 3.60 D side copper capital 257.2 71.9 (20.2 ) - 308.9 1,818.1 8.1 % 147.3 456.2 24,828,639 lines 18.37 D side copper current 263.5 - - - 263.5 7.4 8.1 % 0.6 264.1 24,709,636 lines 10.69 Local exchanges general frames equipment 42.1 - - - 42.1 41.6 8.1 % 3.4 45.5 37,817,998 lines 1.20 Local exchanges general frames maintenance 31.5 - - - 31.5 1.0 8.1 % 0.1 31.6 24,709,598 lines 1.28 Analogue line test equipment 1.5 - - - 1.5 2.6 8.1 % 0.2 1.7 24,810,275 lines 0.07 Dropwire capital & analogue NTE 313.9 39.1 (37.1 ) - 315.9 1,114.1 8.1 % 90.2 406.1 24,758,728 lines 16.40 Analogue line drop maintenance 65.4 - - - 65.4 2.4 8.1 % 0.2 65.6 23,693,360 lines 2.77 Analogue line cards 96.6 (0.0 ) 0.1 - 96.7 151.8 8.1 % 12.3 109.0 14,740,860 lines 7.39 Pair gain 0.0 - - - 0.0 0.0 8.1 % 0.0 0.0 14,740,860 lines 0.00 FTTC Development 9.3 - - - 9.3 20.3 9.3 % 1.9 11.2 (i) - (i) Optical Ethernet Electronics Capital 25.2 - - - 25.2 60.3 9.3 % 5.6 30.8 21,389 circuits 1,440.57 OR Service Centre - Provision Analogue/ISDN2 14.8 - - - 14.8 3.2 8.1 % 0.3 15.1 (i) - (i) OR Service Centre - Provision WLA 16.6 - - - 16.6 2.4 8.1 % 0.2 16.8 (i) - (i) OR Service Centre - Provision Ethernet 5.8 - - - 5.8 (0.1 ) 8.0 % (0.0 ) 5.8 (i) - (i) OR Service Centre - Provision GEA 38.5 - - - 38.5 0.5 9.3 % 0.0 38.5 (i) - (i) OR Service Centre - Assurance Analogue/ISDN2 17.8 - - - 17.8 3.0 8.1 % 0.2 18.0 (i) - (i) OR Service Centre - Assurance WLA 15.8 - - - 15.8 2.3 8.1 % 0.2 16.0 (i) - (i) OR Service Centre - Assurance Ethernet 0.0 - - - 0.0 0.0 8.0 % 0.0 0.0 (i) - (i) SLG WLA External 19.9 - - - 19.9 2.6 8.1 % 0.2 20.1 (i) - (i) Ethernet Backhaul Direct extended reach 0.3 0.0 (0.0 ) - 0.3 1.0 8.0 % 0.1 0.4 2,439 circuits 163.03 Ethernet Backhaul Direct - Active 38.5 0.5 (0.7 ) (0.1 ) 38.2 99.3 8.0 % 7.9 46.1 8,843 circuits 5,222.35 Ethernet Backhaul Direct - Passive 6.8 0.6 (0.4 ) (0.1 ) 6.9 19.1 8.0 % 1.5 8.4 4,621 circuits 1,824.77 Ethernet Backhaul Direct Resilience - Active 0.4 0.0 (0.0 ) - 0.4 1.3 8.0 % 0.1 0.5 2,439 circuits 220.25 Ethernet Backhaul Direct - resilience - Passive 0.1 0.0 (0.0 ) - 0.1 0.2 8.0 % 0.0 0.1 1,323 circuits 73.56 Combi Card - Broadband 34.6 0.6 (0.8 ) (0.1 ) 34.3 68.6 9.3 % 6.4 40.7 (i) - (i) iNode features 0.7 0.0 (0.0 ) - 0.7 0.4 9.3 % 0.0 0.7 (i) - (i) Core/Metro (broadband) 36.2 0.1 (0.2 ) - 36.1 113.3 9.3 % 10.5 46.6 178,697,571 circuits 0.26 Core Directors - Broadband 0.4 0.0 (0.0 ) - 0.4 1.2 9.3 % 0.1 0.5 67,614 bandwidth 7.50 Edge Ethernet ports broadband 0.3 0.0 (0.0 ) - 0.3 0.9 9.3 % 0.1 0.4 163,828,598 bandwidth 0.00 Metro BRAS and MSE 89.9 0.3 (0.5 ) - 89.7 278.9 9.3 % 25.9 115.6 163,828,598 rentals 0.71 Broadband MSAN access 43.9 0.7 (1.0 ) (0.1 ) 43.5 87.4 9.3 % 8.1 51.6 2,816,170 rentals 18.34
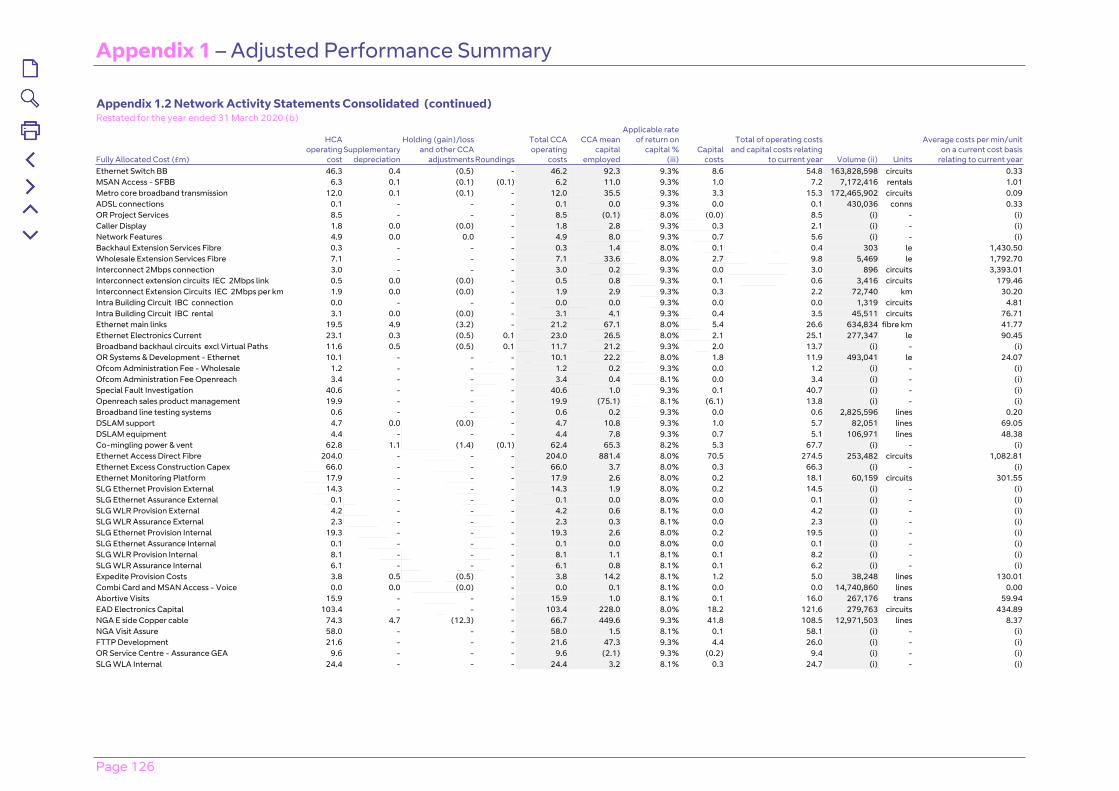
Appendix 1 – Adjusted Performance Summary
Page 126
Appendix 1.2 Network Activity Statements Consolidated (continued)Restated for the year ended 31 March 2020 (b)
Fully Allocated Cost (£m)
HCA operating
costSupplementary
depreciation
Holding (gain)/loss and other CCA
adjustments Roundings
Total CCA operating
costs
CCA mean capital
employed
Applicable rate of return on
capital % (iii)
Capital costs
Total of operating costs and capital costs relating
to current year Volume (ii) Units
Average costs per min/unit on a current cost basis
relating to current yearEthernet Switch BB 46.3 0.4 (0.5) - 46.2 92.3 9.3% 8.6 54.8 163,828,598 circuits 0.33MSAN Access - SFBB 6.3 0.1 (0.1) (0.1) 6.2 11.0 9.3% 1.0 7.2 7,172,416 rentals 1.01Metro core broadband transmission 12.0 0.1 (0.1) - 12.0 35.5 9.3% 3.3 15.3 172,465,902 circuits 0.09ADSL connections 0.1 - - - 0.1 0.0 9.3% 0.0 0.1 430,036 conns 0.33OR Project Services 8.5 - - - 8.5 (0.1) 8.0% (0.0) 8.5 (i) - (i)Caller Display 1.8 0.0 (0.0) - 1.8 2.8 9.3% 0.3 2.1 (i) - (i)Network Features 4.9 0.0 0.0 - 4.9 8.0 9.3% 0.7 5.6 (i) - (i)Backhaul Extension Services Fibre 0.3 - - - 0.3 1.4 8.0% 0.1 0.4 303 le 1,430.50Wholesale Extension Services Fibre 7.1 - - - 7.1 33.6 8.0% 2.7 9.8 5,469 le 1,792.70Interconnect 2Mbps connection 3.0 - - - 3.0 0.2 9.3% 0.0 3.0 896 circuits 3,393.01Interconnect extension circuits IEC 2Mbps link 0.5 0.0 (0.0) - 0.5 0.8 9.3% 0.1 0.6 3,416 circuits 179.46Interconnect Extension Circuits IEC 2Mbps per km 1.9 0.0 (0.0) - 1.9 2.9 9.3% 0.3 2.2 72,740 km 30.20Intra Building Circuit IBC connection 0.0 - - - 0.0 0.0 9.3% 0.0 0.0 1,319 circuits 4.81Intra Building Circuit IBC rental 3.1 0.0 (0.0) - 3.1 4.1 9.3% 0.4 3.5 45,511 circuits 76.71Ethernet main links 19.5 4.9 (3.2) - 21.2 67.1 8.0% 5.4 26.6 634,834 fibre km 41.77Ethernet Electronics Current 23.1 0.3 (0.5) 0.1 23.0 26.5 8.0% 2.1 25.1 277,347 le 90.45Broadband backhaul circuits excl Virtual Paths 11.6 0.5 (0.5) 0.1 11.7 21.2 9.3% 2.0 13.7 (i) - (i)OR Systems & Development - Ethernet 10.1 - - - 10.1 22.2 8.0% 1.8 11.9 493,041 le 24.07Ofcom Administration Fee - Wholesale 1.2 - - - 1.2 0.2 9.3% 0.0 1.2 (i) - (i)Ofcom Administration Fee Openreach 3.4 - - - 3.4 0.4 8.1% 0.0 3.4 (i) - (i)Special Fault Investigation 40.6 - - - 40.6 1.0 9.3% 0.1 40.7 (i) - (i)Openreach sales product management 19.9 - - - 19.9 (75.1) 8.1% (6.1) 13.8 (i) - (i)Broadband line testing systems 0.6 - - - 0.6 0.2 9.3% 0.0 0.6 2,825,596 lines 0.20DSLAM support 4.7 0.0 (0.0) - 4.7 10.8 9.3% 1.0 5.7 82,051 lines 69.05DSLAM equipment 4.4 - - - 4.4 7.8 9.3% 0.7 5.1 106,971 lines 48.38Co-mingling power & vent 62.8 1.1 (1.4) (0.1) 62.4 65.3 8.2% 5.3 67.7 (i) - (i)Ethernet Access Direct Fibre 204.0 - - - 204.0 881.4 8.0% 70.5 274.5 253,482 circuits 1,082.81Ethernet Excess Construction Capex 66.0 - - - 66.0 3.7 8.0% 0.3 66.3 (i) - (i)Ethernet Monitoring Platform 17.9 - - - 17.9 2.6 8.0% 0.2 18.1 60,159 circuits 301.55SLG Ethernet Provision External 14.3 - - - 14.3 1.9 8.0% 0.2 14.5 (i) - (i)SLG Ethernet Assurance External 0.1 - - - 0.1 0.0 8.0% 0.0 0.1 (i) - (i)SLG WLR Provision External 4.2 - - - 4.2 0.6 8.1% 0.0 4.2 (i) - (i)SLG WLR Assurance External 2.3 - - - 2.3 0.3 8.1% 0.0 2.3 (i) - (i)SLG Ethernet Provision Internal 19.3 - - - 19.3 2.6 8.0% 0.2 19.5 (i) - (i)SLG Ethernet Assurance Internal 0.1 - - - 0.1 0.0 8.0% 0.0 0.1 (i) - (i)SLG WLR Provision Internal 8.1 - - - 8.1 1.1 8.1% 0.1 8.2 (i) - (i)SLG WLR Assurance Internal 6.1 - - - 6.1 0.8 8.1% 0.1 6.2 (i) - (i)Expedite Provision Costs 3.8 0.5 (0.5) - 3.8 14.2 8.1% 1.2 5.0 38,248 lines 130.01Combi Card and MSAN Access - Voice 0.0 0.0 (0.0) - 0.0 0.1 8.1% 0.0 0.0 14,740,860 lines 0.00Abortive Visits 15.9 - - - 15.9 1.0 8.1% 0.1 16.0 267,176 trans 59.94EAD Electronics Capital 103.4 - - - 103.4 228.0 8.0% 18.2 121.6 279,763 circuits 434.89NGA E side Copper cable 74.3 4.7 (12.3) - 66.7 449.6 9.3% 41.8 108.5 12,971,503 lines 8.37NGA Visit Assure 58.0 - - - 58.0 1.5 8.1% 0.1 58.1 (i) - (i)FTTP Development 21.6 - - - 21.6 47.3 9.3% 4.4 26.0 (i) - (i)OR Service Centre - Assurance GEA 9.6 - - - 9.6 (2.1) 9.3% (0.2) 9.4 (i) - (i)SLG WLA Internal 24.4 - - - 24.4 3.2 8.1% 0.3 24.7 (i) - (i)
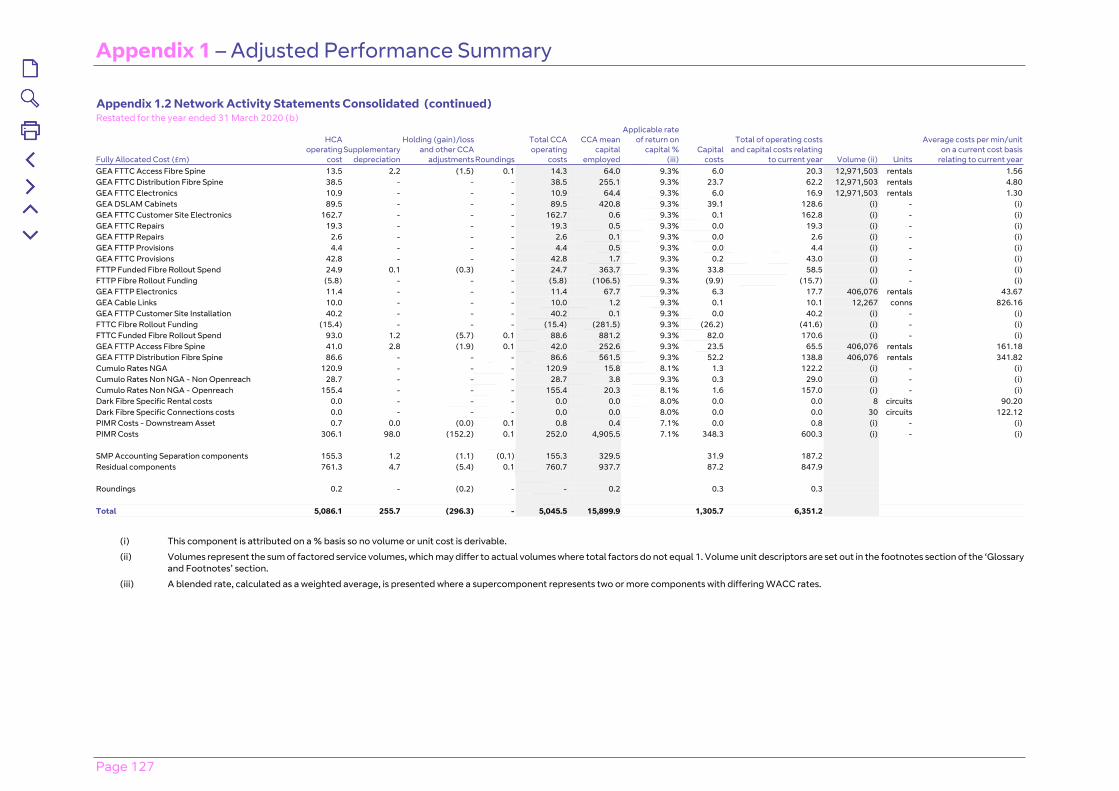
Appendix 1 – Adjusted Performance Summary
Page 127
Appendix 1.2 Network Activity Statements Consolidated (continued)Restated for the year ended 31 March 2020 (b)
Fully Allocated Cost (£m)
HCA operating
costSupplementary
depreciation
Holding (gain)/loss and other CCA
adjustments Roundings
Total CCA operating
costs
CCA mean capital
employed
Applicable rate of return on
capital % (iii)
Capital costs
Total of operating costs and capital costs relating
to current year Volume (ii) Units
Average costs per min/unit on a current cost basis
relating to current yearGEA FTTC Access Fibre Spine 13.5 2.2 (1.5) 0.1 14.3 64.0 9.3% 6.0 20.3 12,971,503 rentals 1.56GEA FTTC Distribution Fibre Spine 38.5 - - - 38.5 255.1 9.3% 23.7 62.2 12,971,503 rentals 4.80GEA FTTC Electronics 10.9 - - - 10.9 64.4 9.3% 6.0 16.9 12,971,503 rentals 1.30GEA DSLAM Cabinets 89.5 - - - 89.5 420.8 9.3% 39.1 128.6 (i) - (i)GEA FTTC Customer Site Electronics 162.7 - - - 162.7 0.6 9.3% 0.1 162.8 (i) - (i)GEA FTTC Repairs 19.3 - - - 19.3 0.5 9.3% 0.0 19.3 (i) - (i)GEA FTTP Repairs 2.6 - - - 2.6 0.1 9.3% 0.0 2.6 (i) - (i)GEA FTTP Provisions 4.4 - - - 4.4 0.5 9.3% 0.0 4.4 (i) - (i)GEA FTTC Provisions 42.8 - - - 42.8 1.7 9.3% 0.2 43.0 (i) - (i)FTTP Funded Fibre Rollout Spend 24.9 0.1 (0.3) - 24.7 363.7 9.3% 33.8 58.5 (i) - (i)FTTP Fibre Rollout Funding (5.8) - - - (5.8) (106.5) 9.3% (9.9) (15.7) (i) - (i)GEA FTTP Electronics 11.4 - - - 11.4 67.7 9.3% 6.3 17.7 406,076 rentals 43.67GEA Cable Links 10.0 - - - 10.0 1.2 9.3% 0.1 10.1 12,267 conns 826.16GEA FTTP Customer Site Installation 40.2 - - - 40.2 0.1 9.3% 0.0 40.2 (i) - (i)FTTC Fibre Rollout Funding (15.4) - - - (15.4) (281.5) 9.3% (26.2) (41.6) (i) - (i)FTTC Funded Fibre Rollout Spend 93.0 1.2 (5.7) 0.1 88.6 881.2 9.3% 82.0 170.6 (i) - (i)GEA FTTP Access Fibre Spine 41.0 2.8 (1.9) 0.1 42.0 252.6 9.3% 23.5 65.5 406,076 rentals 161.18GEA FTTP Distribution Fibre Spine 86.6 - - - 86.6 561.5 9.3% 52.2 138.8 406,076 rentals 341.82Cumulo Rates NGA 120.9 - - - 120.9 15.8 8.1% 1.3 122.2 (i) - (i)Cumulo Rates Non NGA - Non Openreach 28.7 - - - 28.7 3.8 9.3% 0.3 29.0 (i) - (i)Cumulo Rates Non NGA - Openreach 155.4 - - - 155.4 20.3 8.1% 1.6 157.0 (i) - (i)Dark Fibre Specific Rental costs 0.0 - - - 0.0 0.0 8.0% 0.0 0.0 8 circuits 90.20Dark Fibre Specific Connections costs 0.0 - - - 0.0 0.0 8.0% 0.0 0.0 30 circuits 122.12PIMR Costs - Downstream Asset 0.7 0.0 (0.0) 0.1 0.8 0.4 7.1% 0.0 0.8 (i) - (i)PIMR Costs 306.1 98.0 (152.2) 0.1 252.0 4,905.5 7.1% 348.3 600.3 (i) - (i)
SMP Accounting Separation components 155.3 1.2 (1.1) (0.1) 155.3 329.5 31.9 187.2Residual components 761.3 4.7 (5.4) 0.1 760.7 937.7 87.2 847.9
Roundings 0.2 - (0.2) - - 0.2 0.3 0.3
Total 5,086.1 255.7 (296.3) - 5,045.5 15,899.9 1,305.7 6,351.2
(i) This component is attributed on a % basis so no volume or unit cost is derivable.
(ii) Volumes represent the sum of factored service volumes, which may differ to actual volumes where total factors do not equal 1. Volume unit descriptors are set out in the footnotes section of the ‘Glossary and Footnotes’ section.
(iii) A blended rate, calculated as a weighted average, is presented where a supercomponent represents two or more components with differing WACC rates.
Page 128
Appendix 2Time Related Charges and Special Fault Investigation Costs
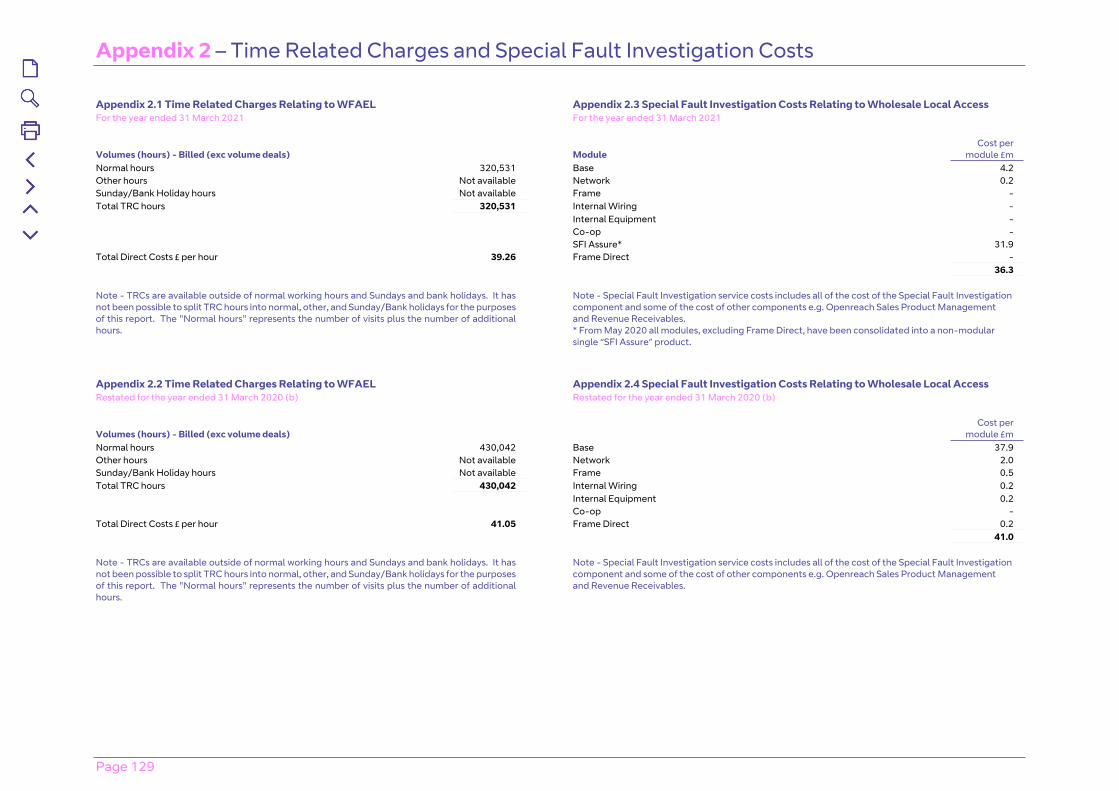
Appendix 2 – Time Related Charges and Special Fault Investigation Costs
Page 129
Appendix 2.1 Time Related Charges Relating to WFAEL Appendix 2.3 Special Fault Investigation Costs Relating to Wholesale Local AccessFor the year ended 31 March 2021 For the year ended 31 March 2021
Volumes (hours) - Billed (exc volume deals) ModuleCost per
module £m Normal hours 320,531 Base 4.2 Other hours Not available Network 0.2 Sunday/Bank Holiday hours Not available Frame - Total TRC hours 320,531 Internal Wiring -
Internal Equipment - Co-op - SFI Assure* 31.9
Total Direct Costs £ per hour 39.26 Frame Direct - 36.3
Note - TRCs are available outside of normal working hours and Sundays and bank holidays. It has not been possible to split TRC hours into normal, other, and Sunday/Bank holidays for the purposes of this report. The "Normal hours" represents the number of visits plus the number of additional hours.
Note - Special Fault Investigation service costs includes all of the cost of the Special Fault Investigation component and some of the cost of other components e.g. Openreach Sales Product Management and Revenue Receivables.* From May 2020 all modules, excluding Frame Direct, have been consolidated into a non-modular single “SFI Assure” product.
Appendix 2.2 Time Related Charges Relating to WFAEL Appendix 2.4 Special Fault Investigation Costs Relating to Wholesale Local AccessRestated for the year ended 31 March 2020 (b) Restated for the year ended 31 March 2020 (b)
Volumes (hours) - Billed (exc volume deals)Cost per
module £m Normal hours 430,042 Base 37.9 Other hours Not available Network 2.0 Sunday/Bank Holiday hours Not available Frame 0.5 Total TRC hours 430,042 Internal Wiring 0.2
Internal Equipment 0.2 Co-op -
Total Direct Costs £ per hour 41.05 Frame Direct 0.2 41.0
Note - TRCs are available outside of normal working hours and Sundays and bank holidays. It has not been possible to split TRC hours into normal, other, and Sunday/Bank holidays for the purposes of this report. The "Normal hours" represents the number of visits plus the number of additional hours.
Note - Special Fault Investigation service costs includes all of the cost of the Special Fault Investigation component and some of the cost of other components e.g. Openreach Sales Product Management and Revenue Receivables.
Page 130
Appendix 3PIA Network Adjustments
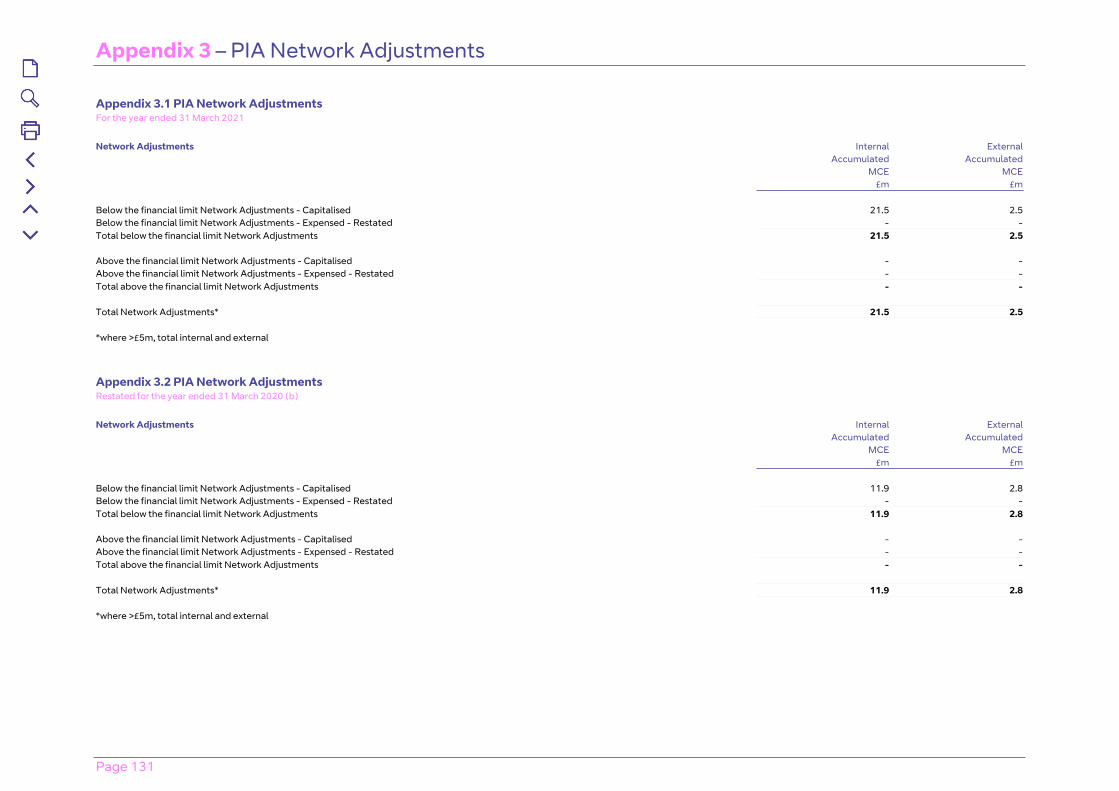
Appendix 3 – PIA Network Adjustments
Page 131
Appendix 3.1 PIA Network Adjustments For the year ended 31 March 2021 Network Adjustments Internal External Accumulated Accumulated MCE MCE £m £m Below the financial limit Network Adjustments - Capitalised 21.5 2.5Below the financial limit Network Adjustments - Expensed - Restated - -Total below the financial limit Network Adjustments 21.5 2.5 Above the financial limit Network Adjustments - Capitalised - -Above the financial limit Network Adjustments - Expensed - Restated - -Total above the financial limit Network Adjustments - - Total Network Adjustments* 21.5 2.5 *where >£5m, total internal and external
Appendix 3.2 PIA Network Adjustments Restated for the year ended 31 March 2020 (b) Network Adjustments Internal External Accumulated Accumulated MCE MCE £m £m Below the financial limit Network Adjustments - Capitalised 11.9 2.8Below the financial limit Network Adjustments - Expensed - Restated - -Total below the financial limit Network Adjustments 11.9 2.8 Above the financial limit Network Adjustments - Capitalised - -Above the financial limit Network Adjustments - Expensed - Restated - -Total above the financial limit Network Adjustments - - Total Network Adjustments* 11.9 2.8 *where >£5m, total internal and external
Page 132
Appendix 4Reconciliation Report – Impact of Methodology Changes and Errors
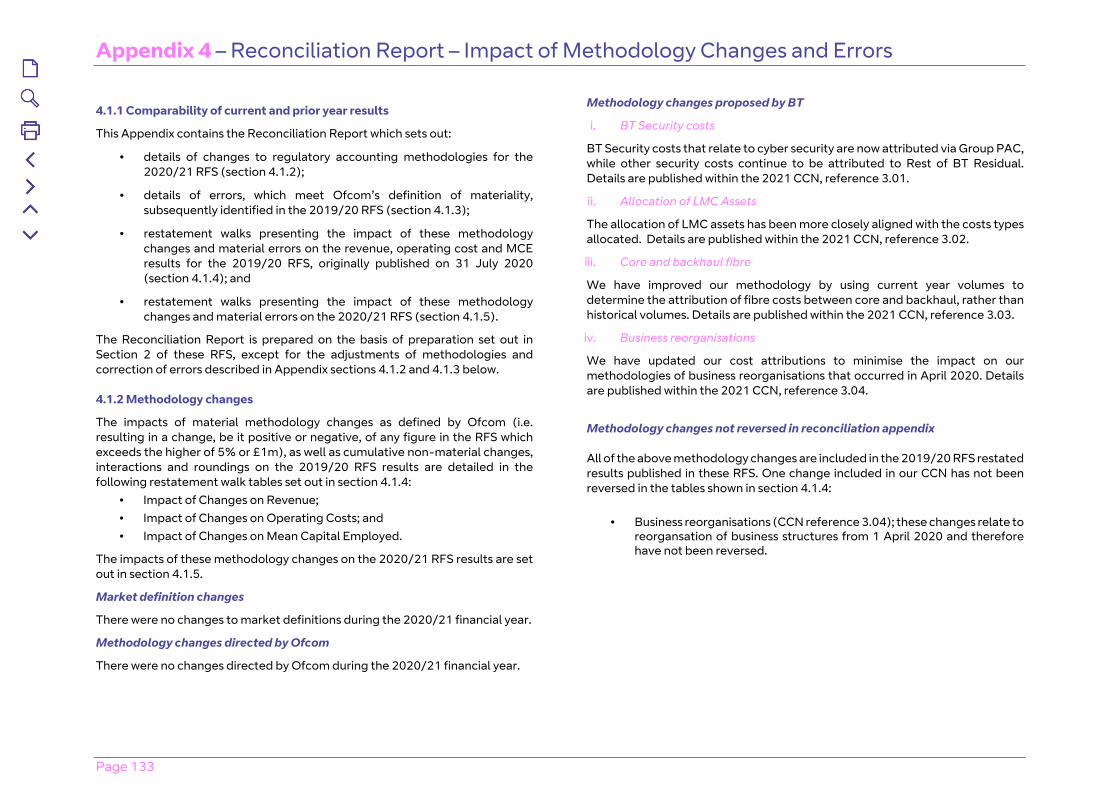
Appendix 4 – Reconciliation Report – Impact of Methodology Changes and Errors
Page 133
4.1.1 Comparability of current and prior year results
This Appendix contains the Reconciliation Report which sets out:
• details of changes to regulatory accounting methodologies for the 2020/21 RFS (section 4.1.2);
• details of errors, which meet Ofcom’s definition of materiality, subsequently identified in the 2019/20 RFS (section 4.1.3);
• restatement walks presenting the impact of these methodology changes and material errors on the revenue, operating cost and MCE results for the 2019/20 RFS, originally published on 31 July 2020 (section 4.1.4); and
• restatement walks presenting the impact of these methodology changes and material errors on the 2020/21 RFS (section 4.1.5).
The Reconciliation Report is prepared on the basis of preparation set out in Section 2 of these RFS, except for the adjustments of methodologies and correction of errors described in Appendix sections 4.1.2 and 4.1.3 below.
4.1.2 Methodology changes
The impacts of material methodology changes as defined by Ofcom (i.e. resulting in a change, be it positive or negative, of any figure in the RFS which exceeds the higher of 5% or £1m), as well as cumulative non-material changes, interactions and roundings on the 2019/20 RFS results are detailed in the following restatement walk tables set out in section 4.1.4:
• Impact of Changes on Revenue;• Impact of Changes on Operating Costs; and • Impact of Changes on Mean Capital Employed.
The impacts of these methodology changes on the 2020/21 RFS results are set out in section 4.1.5.
Market definition changes
There were no changes to market definitions during the 2020/21 financial year.
Methodology changes directed by Ofcom
There were no changes directed by Ofcom during the 2020/21 financial year.
Methodology changes proposed by BT
i. BT Security costs
BT Security costs that relate to cyber security are now attributed via Group PAC, while other security costs continue to be attributed to Rest of BT Residual. Details are published within the 2021 CCN, reference 3.01.
ii. Allocation of LMC Assets
The allocation of LMC assets has been more closely aligned with the costs types allocated. Details are published within the 2021 CCN, reference 3.02.
iii. Core and backhaul fibre
We have improved our methodology by using current year volumes to determine the attribution of fibre costs between core and backhaul, rather than historical volumes. Details are published within the 2021 CCN, reference 3.03.
iv. Business reorganisations
We have updated our cost attributions to minimise the impact on our methodologies of business reorganisations that occurred in April 2020. Details are published within the 2021 CCN, reference 3.04.
Methodology changes not reversed in reconciliation appendix
All of the above methodology changes are included in the 2019/20 RFS restated results published in these RFS. One change included in our CCN has not been reversed in the tables shown in section 4.1.4:
• Business reorganisations (CCN reference 3.04); these changes relate to reorgansation of business structures from 1 April 2020 and therefore have not been reversed.
Appendix 4 – Reconciliation Report – Impact of Methodology Changes and Errors
Page 134
4.1.3 Errors Corrected in Prior Year Comparatives
The prior year comparatives have been restated to reflect the correction of errors which meet Ofcom’s definition of a Material Error. Ofcom defines a Material Error as one which results in a correction (be it positive or negative) to any figure in the RFS which exceeds the higher of 5% or £1 million. The error must fulfil at least one of the following conditions:
(a) the error has arisen within the Regulatory Attribution System; or(b) the error has been brought to the attention of the Audit and Risk
Committee by the Regulatory Auditor.
The impacts of correcting these errors on the 2019/20 RFS results are detailed in the restatement walk tables set out in section 4.1.4:
• Impact of Changes on Revenue; • Impact of Changes on Operating Costs; and • Impact of Changes on Mean Capital Employed,
The errors identified in the 2019/20 RFS are detailed below:
i. Openreach provision expedites error
An error was identified in the attribution of network provision costs to Openreach provision expedites, whereby the volumes included current year and not historical data. This error was identified during routine process reviews.
ii. Mapping errors
Errors were identified in the mapping of GL and F8 codes. The error predominately affects the split of costs between RFS wholesale cost sectors. There is also a small impact at a market level . These errors were identified during discussion with Ofcom.
iii. WLA Service level guarantees (SLGs) error
An error was identified in SLG data for internal and external WLA SLG components. Internal data was incorrectly used to calculate attributions to the external component, and vice versa. This error was identified during routine process reviews.
iv. CCA mapping errors
Errors were identified in how we split CCA adjustments between ‘supplementary depreciation’ and ‘other CCA’ for duct, as well as in the mapping of the Fixed Asset Register to indices used to calculate the Gross Replacement Cost and Current Cost Accumulated Depreciation. These mapping errors were identified during routine process reviews.
v. Abortive visit charges (AVCs) errors
Errors were identified in the calculation and attribution of costs for Openreach AVCs. Labour rates used in the calculation of AVCs did not align to the assets decapitalised, and engineer travel time was overstated in the calculation. These errors were identified during routine process reviews.
vi. Ethernet circuits mapping error
An error was identified in the mapping of certain ethernet circuits between geographical areas following the BCMR market change implemented in the 2019/20 RFS. This error was identified during routine process reviews.
vii. PIA productisation costs error
An error was identified in the calculation of factors used to apportion productisation costs between internal and external PIA services. The volumes used to calculate the factors were not aligned. This error was identified during routine process reviews.
viii. WLA co-mingling new provide and rental services errors
Errors were identified in the mapping of products between the co-mingling new provide and rental services and unregulated tie-cable services within the WLA market. This led to revenues for co-mingling being understated in the 2019/20 RFS. These errors were identified during routine process reviews.
Appendix 4 – Reconciliation Report – Impact of Methodology Changes and Errors
Page 135
4.1.4 Restatement walks – 2019/20 RFS results restated for methodologies changes and error corrections
Impact of Changes on RevenueBusiness Connectivity Narrowband
Ref
eren
ce to
Sec
tions
4.1
.2
and
4.1.
3
PIA
WLA
CI A
cces
s Se
rvic
es -
BT
Onl
y A
reas
CI A
cces
s Se
rvic
es -
BT
plus
O
ne A
reas
Hig
h N
etw
ork
Rea
ch A
reas
ou
tsid
e C
LA
Tech
nica
l Are
a -
Inte
rexc
hang
e C
onne
ctiv
ity
(Non
-Dar
k Fi
bre
Circ
uits
)
Tech
nica
l Are
a -
Inte
rexc
hang
e C
onne
ctiv
ity
(Dar
k Fi
bre
Circ
uits
)
WFA
EL
ISD
N2
ISD
N30
Tota
l Ope
nrea
ch S
MP
Ope
nrea
ch R
esid
ual
Elim
inat
ions
Tota
l Ope
nrea
ch
£m £m £m £m £m £m £m £m £m £m £m £m £m £m
2019/20 Published RFS figures 604 2,434 400 154 19 155 - 1,556 64 115 5,501 212 (573) 5,140
CCN MethodologiesMethodology changes proposed by BTBT security costs i 1 - - - - - - - - - 1 - (2) (1)Allocation of LMC assets ii - - - - - - - - - - - - - -Core and backhaul fibre allocation iii - - - - - - - - - - - - - -Business reorganisations iv - - - - - - - - - - - - - -Methodology Changes proposed by BT 1 - - - - - - - - - 1 - (2) (1)
Cumulative non-material changes, interactions and roundings 1 - - - - 1 - - - - 2 - 1 3Total CCN Methodologies 2 - - - - 1 - - - - 3 - (1) 2
2019/20 RFS market figures reflecting all methodology changes 606 2,434 400 154 19 156 - 1,556 64 115 5,504 212 (574) 5,142
Changes due to Errors Corrected in Prior Year ComparativesOpenreach provision expedites i - - - - - - - - - - - - - -WLA SLGs ii - - - - - - - - - - - - - -Mapping errors iii - - - - - - - - - - - - - -CCA Errors iv - - - - - - - - - - - - - -Abortive visit charges v - - - - - - - - - - - - - -Ethernet circuits mapping vi - - (33) 20 5 (1) - - - - (9) 9 - -PIA productisation vii - - - - - - - - - - - - (1) (1)WLA co-mingling new provides and rentals viii - - - - - - - - - - - 1 - 1Changes due to Errors Corrected in Prior Year Comparatives - - (33) 20 5 (1) - - - - (9) 10 (1) -
Total changes 2 - (33) 20 5 - - - - - (6) 10 (2) 2
2019/20 restated for 2020/21 methodologies 606 2,434 367 174 24 155 - 1,556 64 115 5,495 222 (575) 5,142
Appendix 4 – Reconciliation Report – Impact of Methodology Changes and Errors
Page 136
4.1.4 Restatement walks – 2019/20 RFS results restated for methodologies changes and error corrections (continued)
Impact of Changes on Revenue (continued) . Openreach Residual
Ref
eren
ce to
Sec
tions
4.1
.2
and
4.1.
3
Fixe
d C
all O
rigin
atio
n
Fixe
d G
eogr
aphi
c C
all
Term
inat
ion
Tech
nica
l Are
as
WB
A M
arke
t A
Tota
l Res
t of B
T SM
P
Res
t of B
T R
esid
ual
Tota
l Res
t of B
T
Elim
inat
ions
Rou
ndin
g
Tota
l Mar
kets
Tota
l SM
P M
arke
ts
£m £m £m £m £m £m £m £m £m £m £m
2019/20 Published RFS figures 119 8 5 127 259 22,265 22,524 (4,759) - 22,905 5,760 CCN Methodologies Methodology changes proposed by BT BT security costs i - - - - - 2 2 (2) 1 - 1Allocation of LMC assets ii - - - - - - - - - - -Core and backhaul fibre allocation iii - - - - - (4) (4) 4 - - -Business reorganisations iv - - - - - - - - - - -Methodology Changes proposed by BT - - - - - (2) (2) 2 1 - 1 Cumulative non-material changes, interactions and roundings - - - - - (3) (3) 3 (3) - 2Total CCN Methodologies - - - - - (5) (5) 5 (2) - 3 2019/20 RFS market figures reflecting all methodology changes 119 8 5 127 259 22,260 22,519 (4,754) (2) 22,905 5,763 Changes due to Errors Corrected in Prior Year Comparatives Openreach provision expedites i - - - - - - - - - - -WLA SLGs ii - - - - - - - - - - -Mapping errors iii - - - - - - - - - - -CCA Errors iv - - - - - (1) (1) 1 - - -Abortive visit charges v - - - - - - - - - - -Ethernet circuits mapping vi - - - - - - - - - - (9)PIA productisation vii - - - - - - - - 1 - -WLA co-mingling new provides and rentals viii - - - - - - - (1) - - -Changes due to Errors Corrected in Prior Year Comparatives - - - - - (1) (1) - 1 - (9) Total changes - - - - - (6) (6) 5 (1) - (6) 2019/20 restated for 2020/21 methodologies 119 8 5 127 259 22,259 22,518 (4,754) (1) 22,905 5,754
Appendix 4 – Reconciliation Report – Impact of Methodology Changes and Errors
Page 137
4.1.4 Restatement walks – 2019/20 RFS results restated for methodologies changes and error corrections (continued)
Impact of Changes on Operating Costs Business Connectivity Narrowband
Ref
eren
ce to
Sec
tions
4.1
.2
and
4.1.
3
PIA
WLA
CI A
cces
s Se
rvic
es -
BT
Onl
y A
reas
CI A
cces
s Se
rvic
es -
BT
plus
O
ne A
reas
Hig
h N
etw
ork
Rea
ch A
reas
ou
tsid
e C
LA
Tech
nica
l Are
a -
Inte
rexc
hang
e C
onne
ctiv
ity
(Non
-Dar
k Fi
bre
Circ
uits
)
Tech
nica
l Are
a -
Inte
rexc
hang
e C
onne
ctiv
ity
(Dar
k Fi
bre
Circ
uits
)
WFA
EL
ISD
N2
ISD
N30
Tota
l Ope
nrea
ch S
MP
Ope
nrea
ch R
esid
ual
Elim
inat
ions
Tota
l Ope
nrea
ch
£m £m £m £m £m £m £m £m £m £m £m £m £m £m
2019/20 Published RFS figures 253 2,092 371 125 14 86 - 1,216 36 77 4,270 103 (573) 3,800 CCN Methodologies Methodology changes proposed by BT BT security costs i 1 1 1 - - - - 1 - - 4 - (1) 3Allocation of LMC assets ii - 1 - - - - - (1) - - - - - -Core and backhaul fibre allocation iii - 3 2 - - 1 - - - - 6 1 - 7Business reorganisations iv - - - - - - - - - - - - - -Methodology Changes proposed by BT 1 5 3 - - 1 - - - - 10 1 (1) 10 Cumulative non-material changes, interactions and roundings 1 4 (1) (1) (1) 1 - (2) - - 1 - - 1Total CCN Methodologies 2 9 2 (1) (1) 2 - (2) - - 11 1 (1) 11 2019/20 RFS market figures reflecting all methodology changes 255 2,101 373 124 13 88 - 1,214 36 77 4,281 104 (574) 3,811 Changes due to Errors Corrected in Prior Year Comparatives - - - - - - - - - - - - - -Openreach provision expedites i - - - - - - - - - - - - - -WLA SLGs ii - - - - - - - - - - - - - -Mapping errors iii - - 4 2 - - - - - - 6 - - 6CCA Errors iv - - - - - - - - - - - - - -Abortive visit charges v - 1 - - - - - 4 - - 5 - - 5Ethernet circuits mapping vi - - (28) 17 4 - - - - - (7) 6 - (1)PIA productisation vii (1) 1 - - - - - - - - - - (1) (1)WLA co-mingling new provides and rentals viii - - - - - - - - - - - - - -Changes due to Errors Corrected in Prior Year Comparatives (1) 2 (24) 19 4 - - 4 - - 4 6 (1) 9 Total changes 1 11 (22) 18 3 2 - 2 - - 15 7 (2) 20 2019/20 restated for 2020/21 methodologies 254 2,103 349 143 17 88 - 1,218 36 77 4,285 110 (575) 3,820
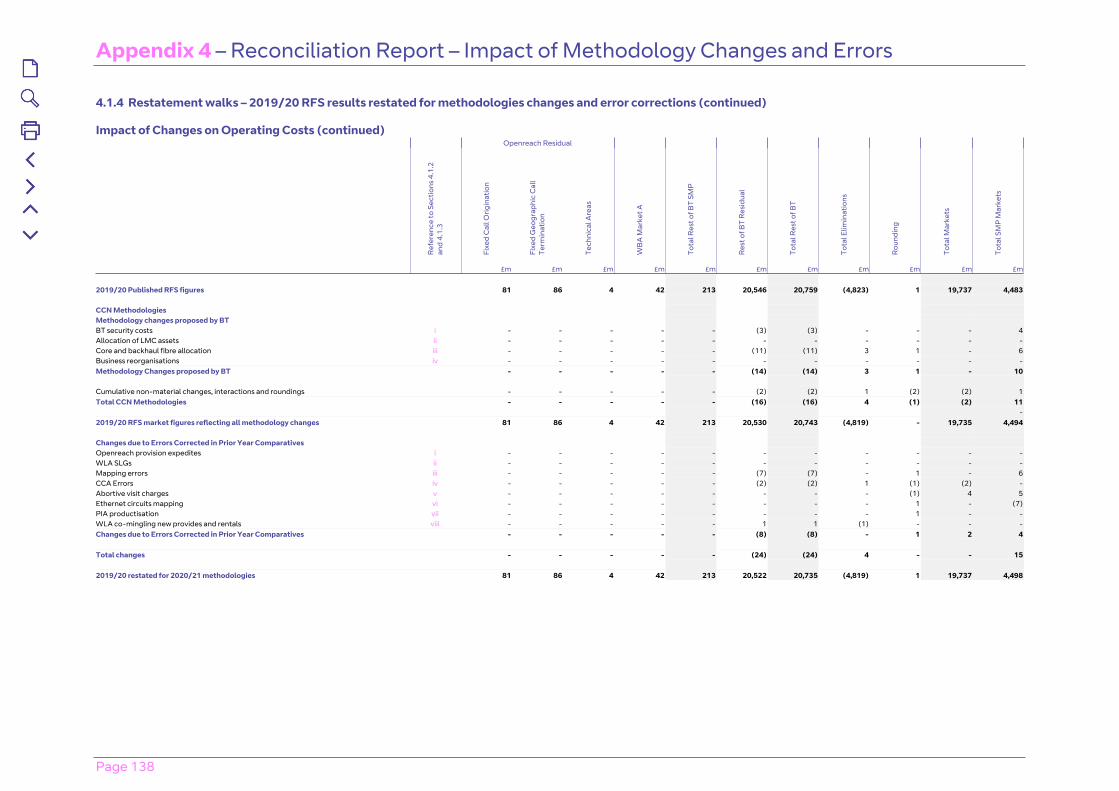
Appendix 4 – Reconciliation Report – Impact of Methodology Changes and Errors
Page 138
4.1.4 Restatement walks – 2019/20 RFS results restated for methodologies changes and error corrections (continued)
Impact of Changes on Operating Costs (continued) Openreach Residual
Ref
eren
ce to
Sec
tions
4.1
.2
and
4.1.
3
Fixe
d C
all O
rigin
atio
n
Fixe
d G
eogr
aphi
c C
all
Term
inat
ion
Tech
nica
l Are
as
WB
A M
arke
t A
Tota
l Res
t of B
T SM
P
Res
t of B
T R
esid
ual
Tota
l Res
t of B
T
Tota
l Elim
inat
ions
Rou
ndin
g
Tota
l Mar
kets
Tota
l SM
P M
arke
ts
£m £m £m £m £m £m £m £m £m £m £m
2019/20 Published RFS figures 81 86 4 42 213 20,546 20,759 (4,823) 1 19,737 4,483 CCN Methodologies Methodology changes proposed by BT BT security costs i - - - - - (3) (3) - - - 4Allocation of LMC assets ii - - - - - - - - - - -Core and backhaul fibre allocation iii - - - - - (11) (11) 3 1 - 6Business reorganisations iv - - - - - - - - - - -Methodology Changes proposed by BT - - - - - (14) (14) 3 1 - 10 Cumulative non-material changes, interactions and roundings - - - - - (2) (2) 1 (2) (2) 1Total CCN Methodologies - - - - - (16) (16) 4 (1) (2) 11 -2019/20 RFS market figures reflecting all methodology changes 81 86 4 42 213 20,530 20,743 (4,819) - 19,735 4,494 Changes due to Errors Corrected in Prior Year Comparatives Openreach provision expedites i - - - - - - - - - - -WLA SLGs ii - - - - - - - - - - -Mapping errors iii - - - - - (7) (7) - 1 - 6CCA Errors iv - - - - - (2) (2) 1 (1) (2) -Abortive visit charges v - - - - - - - - (1) 4 5Ethernet circuits mapping vi - - - - - - - - 1 - (7)PIA productisation vii - - - - - - - - 1 - -WLA co-mingling new provides and rentals viii - - - - - 1 1 (1) - - -Changes due to Errors Corrected in Prior Year Comparatives - - - - - (8) (8) - 1 2 4 Total changes - - - - - (24) (24) 4 - - 15 2019/20 restated for 2020/21 methodologies 81 86 4 42 213 20,522 20,735 (4,819) 1 19,737 4,498
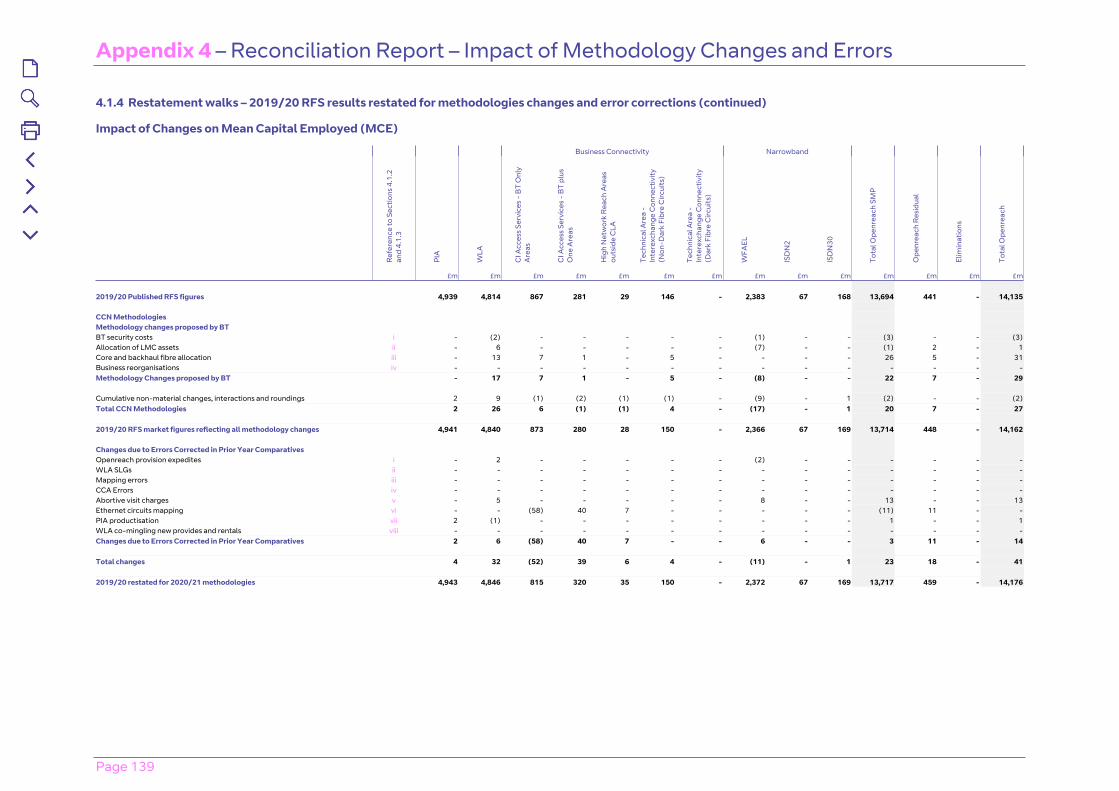
Appendix 4 – Reconciliation Report – Impact of Methodology Changes and Errors
Page 139
4.1.4 Restatement walks – 2019/20 RFS results restated for methodologies changes and error corrections (continued)
Impact of Changes on Mean Capital Employed (MCE)
Business Connectivity Narrowband
Ref
eren
ce to
Sec
tions
4.1
.2
and
4.1.
3
PIA
WLA
CI A
cces
s Se
rvic
es -
BT
Onl
y A
reas
CI A
cces
s Se
rvic
es -
BT
plus
O
ne A
reas
Hig
h N
etw
ork
Rea
ch A
reas
ou
tsid
e C
LA
Tech
nica
l Are
a -
Inte
rexc
hang
e C
onne
ctiv
ity
(Non
-Dar
k Fi
bre
Circ
uits
)
Tech
nica
l Are
a -
Inte
rexc
hang
e C
onne
ctiv
ity
(Dar
k Fi
bre
Circ
uits
)
WFA
EL
ISD
N2
ISD
N30
Tota
l Ope
nrea
ch S
MP
Ope
nrea
ch R
esid
ual
Elim
inat
ions
Tota
l Ope
nrea
ch
£m £m £m £m £m £m £m £m £m £m £m £m £m £m
2019/20 Published RFS figures 4,939 4,814 867 281 29 146 - 2,383 67 168 13,694 441 - 14,135 CCN Methodologies Methodology changes proposed by BT BT security costs i - (2) - - - - - (1) - - (3) - - (3)Allocation of LMC assets ii - 6 - - - - - (7) - - (1) 2 - 1Core and backhaul fibre allocation iii - 13 7 1 - 5 - - - - 26 5 - 31Business reorganisations iv - - - - - - - - - - - - - -Methodology Changes proposed by BT - 17 7 1 - 5 - (8) - - 22 7 - 29 Cumulative non-material changes, interactions and roundings 2 9 (1) (2) (1) (1) - (9) - 1 (2) - - (2)Total CCN Methodologies 2 26 6 (1) (1) 4 - (17) - 1 20 7 - 27 2019/20 RFS market figures reflecting all methodology changes 4,941 4,840 873 280 28 150 - 2,366 67 169 13,714 448 - 14,162 Changes due to Errors Corrected in Prior Year Comparatives Openreach provision expedites i - 2 - - - - - (2) - - - - - -WLA SLGs ii - - - - - - - - - - - - - -Mapping errors iii - - - - - - - - - - - - - -CCA Errors iv - - - - - - - - - - - - - -Abortive visit charges v - 5 - - - - - 8 - - 13 - - 13Ethernet circuits mapping vi - - (58) 40 7 - - - - - (11) 11 - -PIA productisation vii 2 (1) - - - - - - - - 1 - - 1WLA co-mingling new provides and rentals viii - - - - - - - - - - - - - -Changes due to Errors Corrected in Prior Year Comparatives 2 6 (58) 40 7 - - 6 - - 3 11 - 14 Total changes 4 32 (52) 39 6 4 - (11) - 1 23 18 - 41 2019/20 restated for 2020/21 methodologies 4,943 4,846 815 320 35 150 - 2,372 67 169 13,717 459 - 14,176
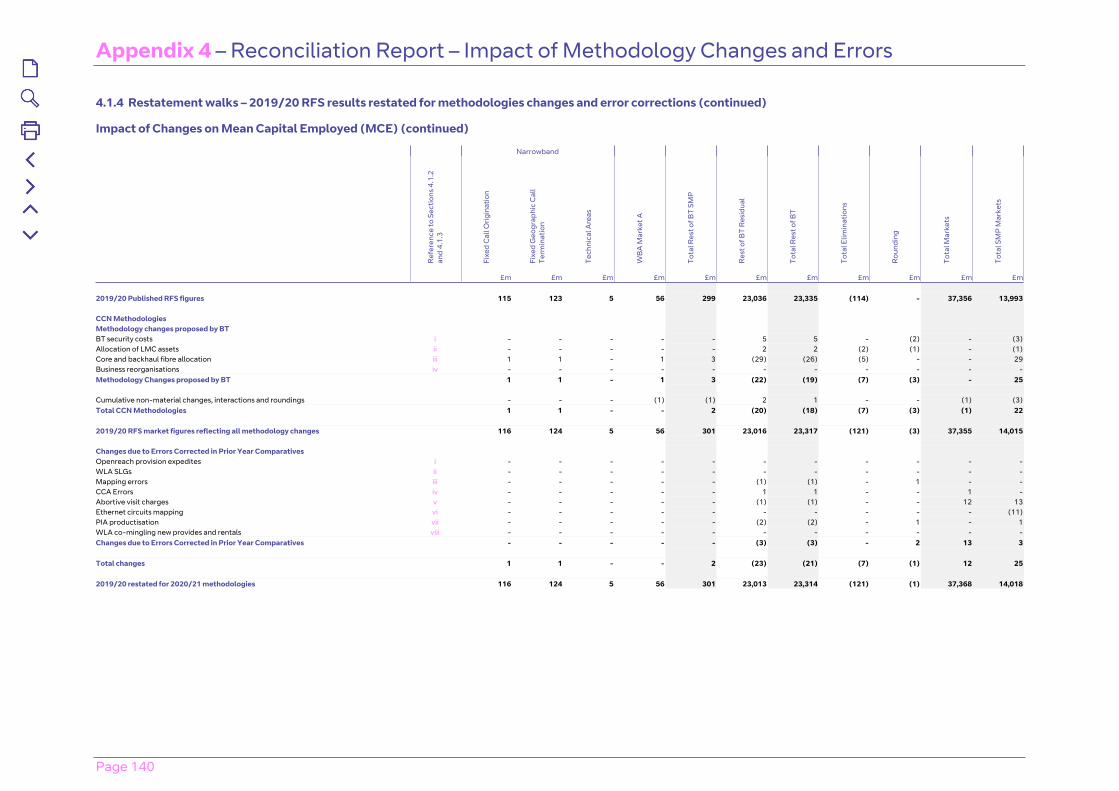
Appendix 4 – Reconciliation Report – Impact of Methodology Changes and Errors
Page 140
4.1.4 Restatement walks – 2019/20 RFS results restated for methodologies changes and error corrections (continued)
Impact of Changes on Mean Capital Employed (MCE) (continued)
Narrowband
Ref
eren
ce to
Sec
tions
4.1
.2
and
4.1.
3
Fixe
d C
all O
rigin
atio
n
Fixe
d G
eogr
aphi
c C
all
Term
inat
ion
Tech
nica
l Are
as
WB
A M
arke
t A
Tota
l Res
t of B
T SM
P
Res
t of B
T R
esid
ual
Tota
l Res
t of B
T
Tota
l Elim
inat
ions
Rou
ndin
g
Tota
l Mar
kets
Tota
l SM
P M
arke
ts
£m £m £m £m £m £m £m £m £m £m £m
2019/20 Published RFS figures 115 123 5 56 299 23,036 23,335 (114) - 37,356 13,993 CCN Methodologies Methodology changes proposed by BT BT security costs i - - - - - 5 5 - (2) - (3)Allocation of LMC assets ii - - - - - 2 2 (2) (1) - (1)Core and backhaul fibre allocation iii 1 1 - 1 3 (29) (26) (5) - - 29Business reorganisations iv - - - - - - - - - - -Methodology Changes proposed by BT 1 1 - 1 3 (22) (19) (7) (3) - 25 Cumulative non-material changes, interactions and roundings - - - (1) (1) 2 1 - - (1) (3)Total CCN Methodologies 1 1 - - 2 (20) (18) (7) (3) (1) 22 2019/20 RFS market figures reflecting all methodology changes 116 124 5 56 301 23,016 23,317 (121) (3) 37,355 14,015 Changes due to Errors Corrected in Prior Year Comparatives Openreach provision expedites i - - - - - - - - - - -WLA SLGs ii - - - - - - - - - - -Mapping errors iii - - - - - (1) (1) - 1 - -CCA Errors iv - - - - - 1 1 - - 1 -Abortive visit charges v - - - - - (1) (1) - - 12 13Ethernet circuits mapping vi - - - - - - - - - - (11)PIA productisation vii - - - - - (2) (2) - 1 - 1WLA co-mingling new provides and rentals viii - - - - - - - - - - -Changes due to Errors Corrected in Prior Year Comparatives - - - - - (3) (3) - 2 13 3 Total changes 1 1 - - 2 (23) (21) (7) (1) 12 25 2019/20 restated for 2020/21 methodologies 116 124 5 56 301 23,013 23,314 (121) (1) 37,368 14,018
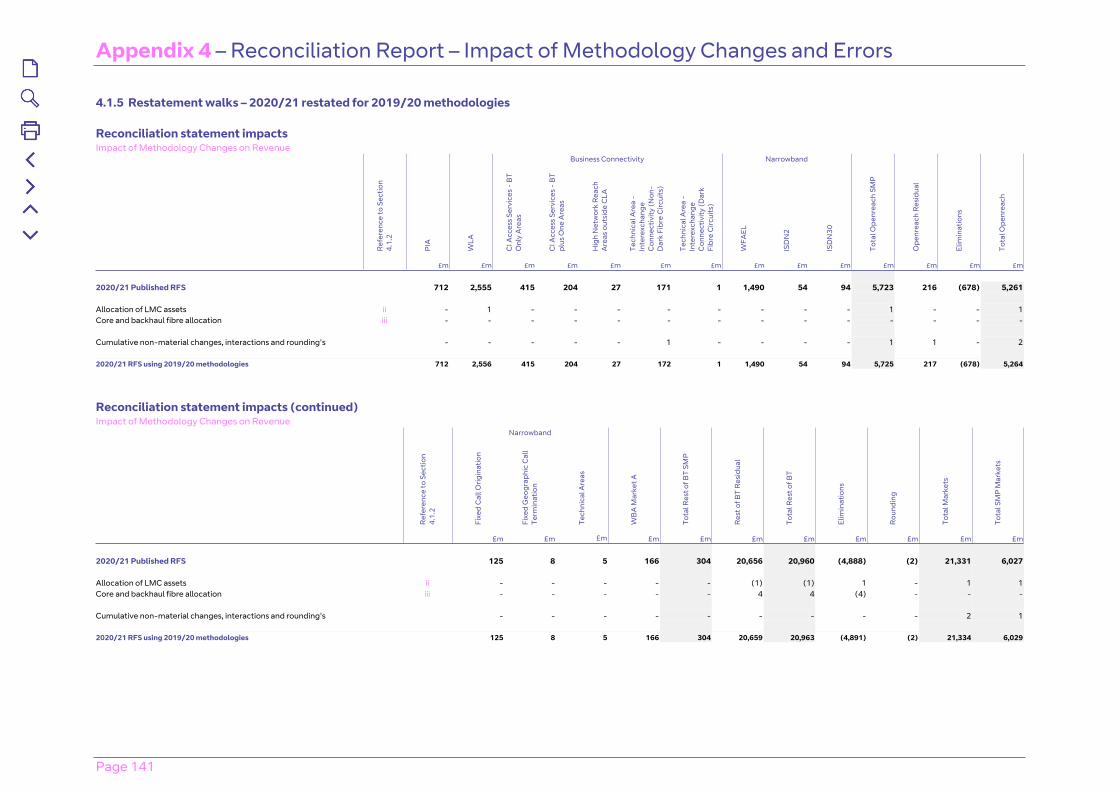
Appendix 4 – Reconciliation Report – Impact of Methodology Changes and Errors
Page 141
4.1.5 Restatement walks – 2020/21 restated for 2019/20 methodologies
Reconciliation statement impactsImpact of Methodology Changes on Revenue
Business Connectivity Narrowband
Ref
eren
ce to
Sec
tion
4.1.
2
PIA
WLA
CI A
cces
s Se
rvic
es -
BT
Onl
y A
reas
CI A
cces
s Se
rvic
es -
BT
plus
One
Are
as
Hig
h N
etw
ork
Rea
ch
Are
as o
utsi
de C
LA
Tech
nica
l Are
a -
Inte
rexc
hang
e C
onne
ctiv
ity (N
on-
Dar
k Fi
bre
Circ
uits
)
Tech
nica
l Are
a -
Inte
rexc
hang
e C
onne
ctiv
ity (D
ark
Fibr
e C
ircui
ts)
WFA
EL
ISD
N2
ISD
N30
Tota
l Ope
nrea
ch S
MP
Ope
nrea
ch R
esid
ual
Elim
inat
ions
Tota
l Ope
nrea
ch
£m £m £m £m £m £m £m £m £m £m £m £m £m £m
2020/21 Published RFS 712 2,555 415 204 27 171 1 1,490 54 94 5,723 216 (678) 5,261
Allocation of LMC assets ii - 1 - - - - - - - - 1 - - 1Core and backhaul fibre allocation iii - - - - - - - - - - - - - -
Cumulative non-material changes, interactions and rounding's - - - - - 1 - - - - 1 1 - 2
2020/21 RFS using 2019/20 methodologies 712 2,556 415 204 27 172 1 1,490 54 94 5,725 217 (678) 5,264
Reconciliation statement impacts (continued)Impact of Methodology Changes on Revenue
NarrowbandR
efer
ence
to S
ectio
n 4.
1.2
Fixe
d C
all O
rigin
atio
n
Fixe
d G
eogr
aphi
c C
all
Term
inat
ion
Tech
nica
l Are
as
WB
A M
arke
t A
Tota
l Res
t of B
T SM
P
Res
t of B
T R
esid
ual
Tota
l Res
t of B
T
Elim
inat
ions
Rou
ndin
g
Tota
l Mar
kets
Tota
l SM
P M
arke
ts
£m £m £m £m £m £m £m £m £m £m £m
2020/21 Published RFS 125 8 5 166 304 20,656 20,960 (4,888) (2) 21,331 6,027
Allocation of LMC assets ii - - - - - (1) (1) 1 - 1 1Core and backhaul fibre allocation iii - - - - - 4 4 (4) - - -
Cumulative non-material changes, interactions and rounding's - - - - - - - - - 2 1
2020/21 RFS using 2019/20 methodologies 125 8 5 166 304 20,659 20,963 (4,891) (2) 21,334 6,029

Appendix 4 – Reconciliation Report – Impact of Methodology Changes and Errors
Page 142
4.1.5 Restatement walks – 2020/21 restated for 2019/20 methodologies (continued)
Reconciliation statement impacts Impact of Methodology Changes on Operating Costs
Business Connectivity Narrowband
Ref
eren
ce to
Sec
tion
4.1.
2
PIA
WLA
CI A
cces
s Se
rvic
es -
BT
Onl
y A
reas
CI A
cces
s Se
rvic
es -
BT
plus
One
Are
as
Hig
h N
etw
ork
Rea
ch
Are
as o
utsi
de C
LA
Tech
nica
l Are
a -
Inte
rexc
hang
e C
onne
ctiv
ity (N
on-
Dar
k Fi
bre
Circ
uits
)
Tech
nica
l Are
a -
Inte
rexc
hang
e C
onne
ctiv
ity (D
ark
Fibr
e C
ircui
ts)
WFA
EL
ISD
N2
ISD
N30
Tota
l Ope
nrea
ch S
MP
Ope
nrea
ch R
esid
ual
Elim
inat
ions
Tota
l Ope
nrea
ch
£m £m £m £m £m £m £m £m £m £m £m £m £m £m
2020/21 Published RFS 344 2,320 360 145 17 93 1 1,271 37 70 4,658 130 (678) 4,110 Allocation of LMC assets ii - - - - - - - 1 - - 1 (1) - -Core and backhaul fibre allocation iii - (4) (2) - - (1) - - - - (7) (1) - (8) Cumulative non-material changes, interactions and rounding's - - - - - - - - - - - - - - 2020/21 RFS using 2019/20 methodologies 344 2,316 358 145 17 92 1 1,272 37 70 4,652 128 (678) 4,102
Reconciliation statement impacts (continued) Impact of Methodology Changes on Operating Costs
Narrowband
Ref
eren
ce to
Sec
tion
4.1.
2
Fixe
d C
all O
rigin
atio
n
Fixe
d G
eogr
aphi
c C
all
Term
inat
ion
Tech
nica
l Are
as
WB
A M
arke
t A
Tota
l Res
t of B
T SM
P
Res
t of B
T R
esid
ual
Tota
l Res
t of B
T
Elim
inat
ions
Rou
ndin
g
Tota
l Mar
kets
Tota
l SM
P M
arke
ts
£m £m £m £m £m £m £m £m £m £m £m
2020/21 Published RFS 85 94 4 40 223 19,552 19,775 (4,950) 1 18,936 4,881 Allocation of LMC assets ii - - - - - (2) (2) 1 - (1) 1Core and backhaul fibre allocation iii - - - - - 13 13 (3) - 2 (7) Cumulative non-material changes, interactions and rounding's - - - - - 1 1 1 (2) - - 2020/21 RFS using 2019/20 methodologies 85 94 4 40 223 19,564 19,787 (4,951) (1) 18,937 4,875
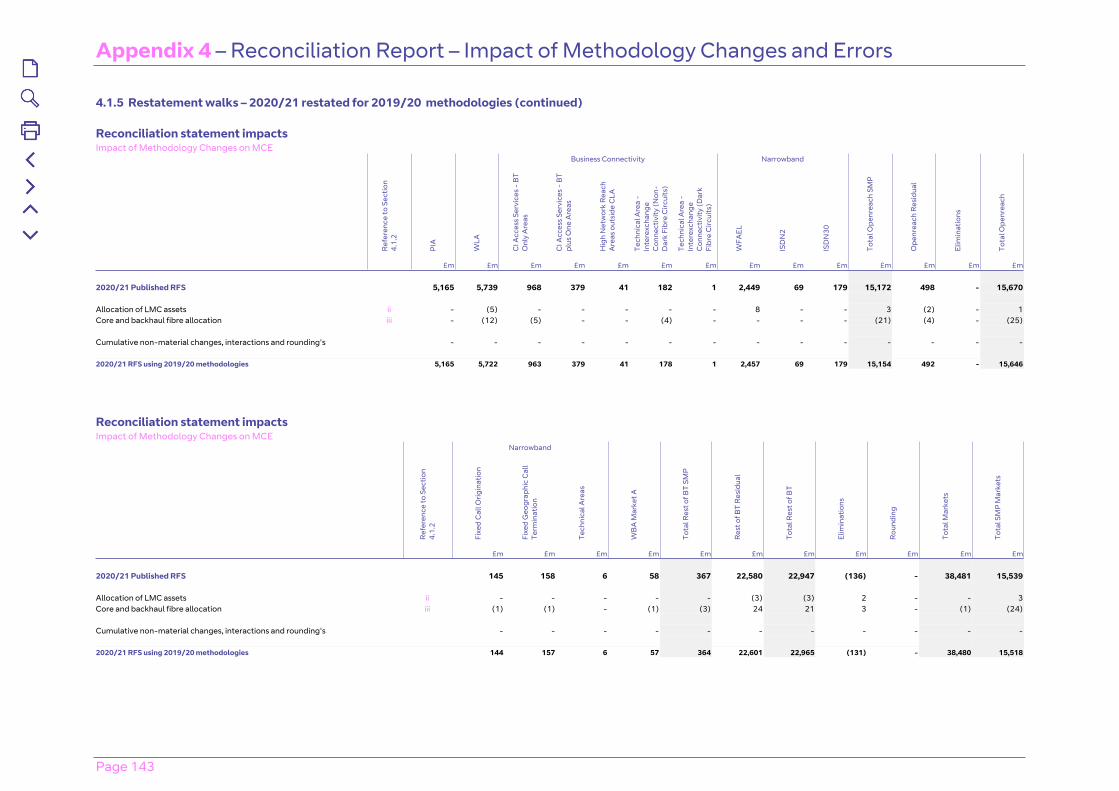
Appendix 4 – Reconciliation Report – Impact of Methodology Changes and Errors
Page 143
4.1.5 Restatement walks – 2020/21 restated for 2019/20 methodologies (continued)
Reconciliation statement impactsImpact of Methodology Changes on MCE
Business Connectivity Narrowband
Ref
eren
ce to
Sec
tion
4.1.
2
PIA
WLA
CI A
cces
s Se
rvic
es -
BT
Onl
y A
reas
CI A
cces
s Se
rvic
es -
BT
plus
One
Are
as
Hig
h N
etw
ork
Rea
ch
Are
as o
utsi
de C
LA
Tech
nica
l Are
a -
Inte
rexc
hang
e C
onne
ctiv
ity (N
on-
Dar
k Fi
bre
Circ
uits
)
Tech
nica
l Are
a -
Inte
rexc
hang
e C
onne
ctiv
ity (D
ark
Fibr
e C
ircui
ts)
WFA
EL
ISD
N2
ISD
N30
Tota
l Ope
nrea
ch S
MP
Ope
nrea
ch R
esid
ual
Elim
inat
ions
Tota
l Ope
nrea
ch
£m £m £m £m £m £m £m £m £m £m £m £m £m £m
2020/21 Published RFS 5,165 5,739 968 379 41 182 1 2,449 69 179 15,172 498 - 15,670
Allocation of LMC assets ii - (5) - - - - - 8 - - 3 (2) - 1Core and backhaul fibre allocation iii - (12) (5) - - (4) - - - - (21) (4) - (25)
Cumulative non-material changes, interactions and rounding's - - - - - - - - - - - - - -
2020/21 RFS using 2019/20 methodologies 5,165 5,722 963 379 41 178 1 2,457 69 179 15,154 492 - 15,646
Reconciliation statement impactsImpact of Methodology Changes on MCE
Narrowband
Ref
eren
ce to
Sec
tion
4.1.
2
Fixe
d C
all O
rigin
atio
n
Fixe
d G
eogr
aphi
c C
all
Term
inat
ion
Tech
nica
l Are
as
WB
A M
arke
t A
Tota
l Res
t of B
T SM
P
Res
t of B
T R
esid
ual
Tota
l Res
t of B
T
Elim
inat
ions
Rou
ndin
g
Tota
l Mar
kets
Tota
l SM
P M
arke
ts
£m £m £m £m £m £m £m £m £m £m £m
2020/21 Published RFS 145 158 6 58 367 22,580 22,947 (136) - 38,481 15,539
Allocation of LMC assets ii - - - - - (3) (3) 2 - - 3Core and backhaul fibre allocation iii (1) (1) - (1) (3) 24 21 3 - (1) (24)
Cumulative non-material changes, interactions and rounding's - - - - - - - - - - -
2020/21 RFS using 2019/20 methodologies 144 157 6 57 364 22,601 22,965 (131) - 38,480 15,518

Page 144
Glossary and Footnotes List
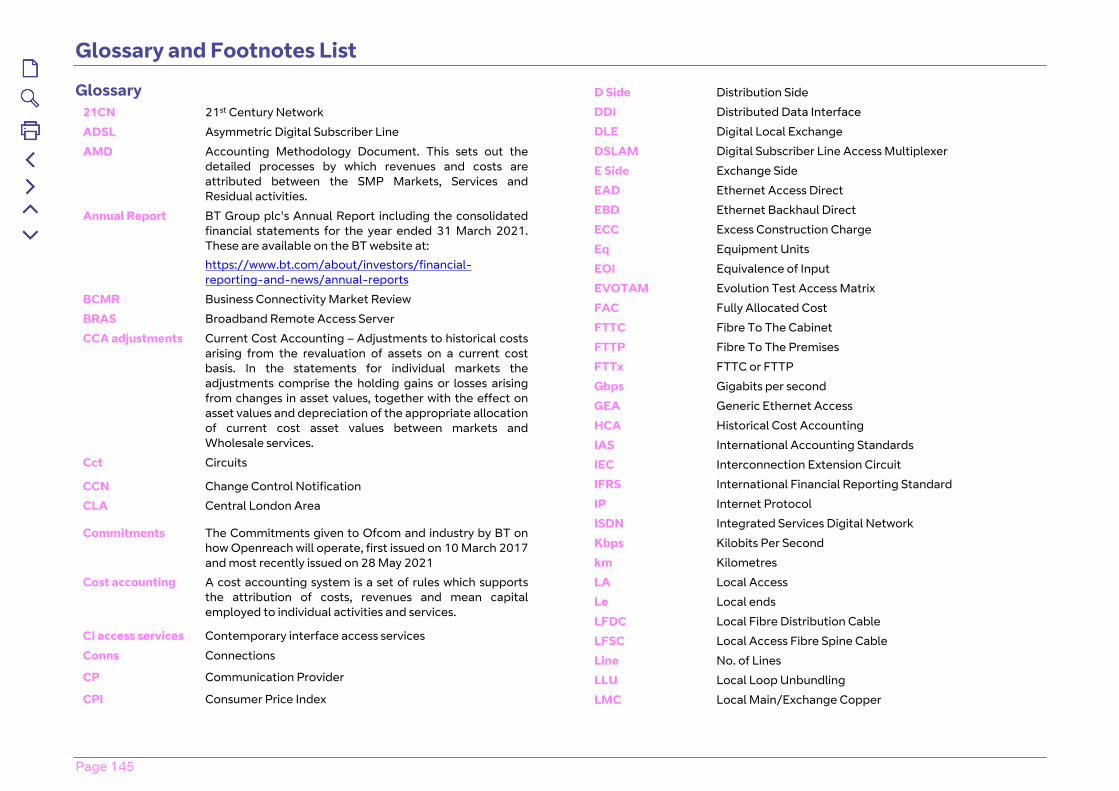
Glossary and Footnotes List
Page 145
Glossary21CN 21st Century Network
ADSL Asymmetric Digital Subscriber Line
AMD Accounting Methodology Document. This sets out the detailed processes by which revenues and costs are attributed between the SMP Markets, Services and Residual activities.
Annual Report BT Group plc's Annual Report including the consolidated financial statements for the year ended 31 March 2021. These are available on the BT website at:
https://www.bt.com/about/investors/financial-reporting-and-news/annual-reports
BCMR Business Connectivity Market Review
BRAS Broadband Remote Access Server
CCA adjustments Current Cost Accounting – Adjustments to historical costs arising from the revaluation of assets on a current cost basis. In the statements for individual markets the adjustments comprise the holding gains or losses arising from changes in asset values, together with the effect on asset values and depreciation of the appropriate allocation of current cost asset values between markets and Wholesale services.
Cct Circuits
CCN Change Control Notification
CLA Central London Area
Commitments The Commitments given to Ofcom and industry by BT on how Openreach will operate, first issued on 10 March 2017 and most recently issued on 28 May 2021
Cost accounting A cost accounting system is a set of rules which supports the attribution of costs, revenues and mean capital employed to individual activities and services.
CI access services Contemporary interface access services
Conns Connections
CP Communication Provider
CPI Consumer Price Index
D Side Distribution Side
DDI Distributed Data Interface
DLE Digital Local Exchange
DSLAM Digital Subscriber Line Access Multiplexer
E Side Exchange Side
EAD Ethernet Access Direct
EBD Ethernet Backhaul Direct
ECC Excess Construction Charge
Eq Equipment Units
EOI Equivalence of Input
EVOTAM Evolution Test Access Matrix
FAC Fully Allocated Cost
FTTC Fibre To The Cabinet
FTTP Fibre To The Premises
FTTx FTTC or FTTP
Gbps Gigabits per second
GEA Generic Ethernet Access
HCA Historical Cost Accounting
IAS International Accounting Standards
IEC Interconnection Extension Circuit
IFRS International Financial Reporting Standard
IP Internet Protocol
ISDN Integrated Services Digital Network
Kbps Kilobits Per Second
km Kilometres
LA Local Access
Le Local ends
LFDC Local Fibre Distribution Cable
LFSC Local Access Fibre Spine Cable
Line No. of Lines
LLU Local Loop Unbundling
LMC Local Main/Exchange Copper
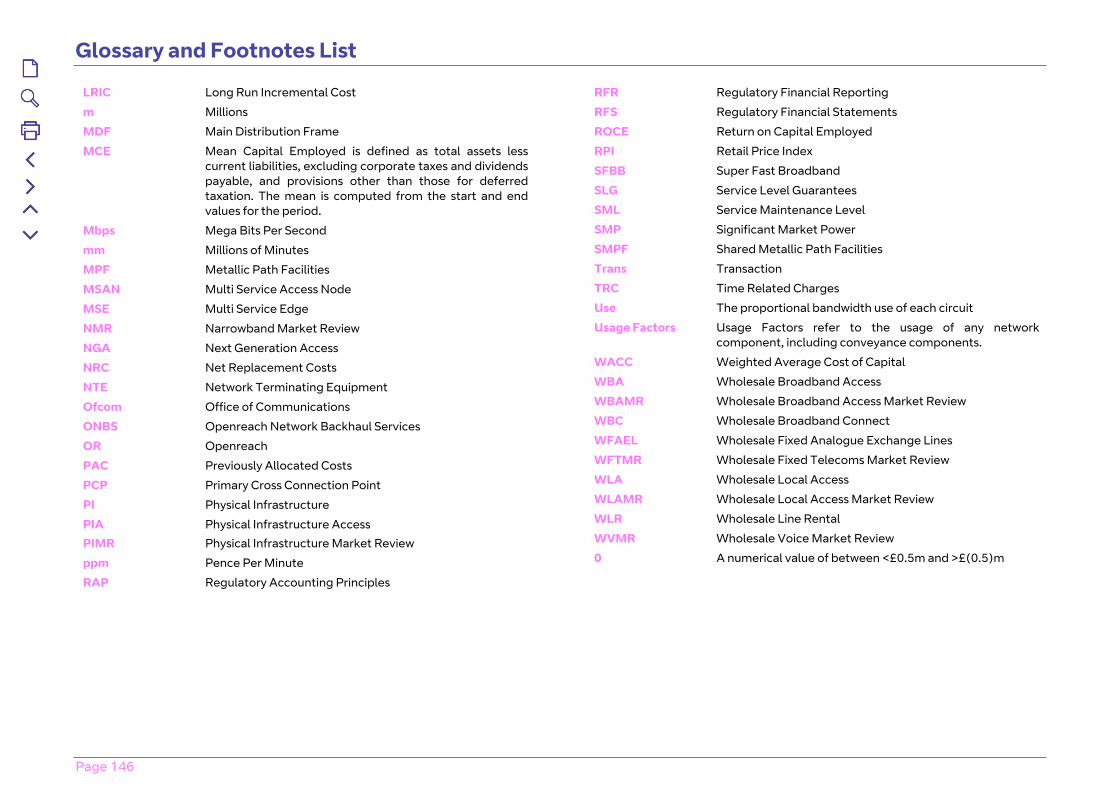
Glossary and Footnotes List
Page 146
LRIC Long Run Incremental Cost
m Millions
MDF Main Distribution Frame
MCE Mean Capital Employed is defined as total assets less current liabilities, excluding corporate taxes and dividends payable, and provisions other than those for deferred taxation. The mean is computed from the start and end values for the period.
Mbps Mega Bits Per Second
mm Millions of Minutes
MPF Metallic Path Facilities
MSAN Multi Service Access Node
MSE Multi Service Edge
NMR Narrowband Market Review
NGA Next Generation Access
NRC Net Replacement Costs
NTE Network Terminating Equipment
Ofcom Office of Communications
ONBS Openreach Network Backhaul Services
OR Openreach
PAC Previously Allocated Costs
PCP Primary Cross Connection Point
PI Physical Infrastructure
PIAPIMR
Physical Infrastructure Access
Physical Infrastructure Market Review
ppm Pence Per Minute
RAP Regulatory Accounting Principles
RFR Regulatory Financial Reporting
RFS Regulatory Financial Statements
ROCE Return on Capital Employed
RPI Retail Price Index
SFBB Super Fast Broadband
SLG Service Level Guarantees
SML Service Maintenance Level
SMP Significant Market Power
SMPF Shared Metallic Path Facilities
Trans Transaction
TRC Time Related Charges
Use The proportional bandwidth use of each circuit
Usage Factors Usage Factors refer to the usage of any network component, including conveyance components.
WACC Weighted Average Cost of Capital
WBA Wholesale Broadband Access
WBAMR Wholesale Broadband Access Market Review
WBC Wholesale Broadband Connect
WFAEL Wholesale Fixed Analogue Exchange Lines
WFTMR Wholesale Fixed Telecoms Market Review
WLA Wholesale Local Access
WLAMR Wholesale Local Access Market Review
WLR Wholesale Line Rental
WVMR Wholesale Voice Market Review
0 A numerical value of between <£0.5m and >£(0.5)m
Glossary and Footnotes List
Page 147
Footnotes(a) ppm = pence per minute; £/2Mbit cct = £ per 2 Mbps circuit; £/km =
£ per kilometre; £/100m = £ per 100 metres; £/trans = £ per transaction; £/circuit = £ per circuit; £/ hostel rental = £ per hostel rental; % = % utilisation; £/line = £ per line; £/room = £ per room; £/cable = £ per cable; £/link = £ per link; £/eq = £ per equipment units; £/le = £ per local end; £/conn = £ per connection; £/channel = £ per channel; £/fibre km = £ per fibre km.
(b) See Section 2 - Basis of Preparation and Appendix 4 for explanation of restatement.
(sx) This service comprises a number of individual prices as indicated by the value of x.
(ux) This service comprises a number of individual volume types as indicated by the value of x.
dditional Inf