rehabilitation research and training center on developmental disabilities and health
DESCRIPTION
Managed Care Long Term Services and Supports for People with Intellectual/Developmental Disabilities (DD) Tamar Heller, PhD Chicago Forum for Justice in Health Policy: People with DD and Managed CAre October 30, 2014. - PowerPoint PPT PresentationTRANSCRIPT
REHA B IL ITAT ION RESEA RCH A ND TRA IN ING CENTER ON
DEV ELOPMENTAL D ISA B IL IT IES A ND HEA LTHDEPA RTMENT OF D ISA B IL ITY A ND HUMA N
DEV ELOPMENTUNIV ERS ITY OF I LL INO IS AT CH IC AGO
HTTP: / /WWW.RRTCADD.ORG/
MANAGED CARE LONG TERM SERVICES AND SUPPORTS FOR PEOPLE WITH
INTELLECTUAL/DEVELOPMENTAL DISABILITIES (DD)
TAMAR HELLER, PHDCHICAGO FORUM FOR JUSTICE IN HEALTH POLICY: PEOPLE WITH DD AND MANAGED CARE
OCTOBER 30, 2014
DEMOGRAPHIC AND POLICY CONTEXT FOR PEOPLE WITH DD AND THEIR FAMILIES
• Longevity revolution• Rebalancing from institutions to group homes and to supported living• Increase in family support• Increase in consumer direction• Broader changes in state DD service systems toward managed care
2
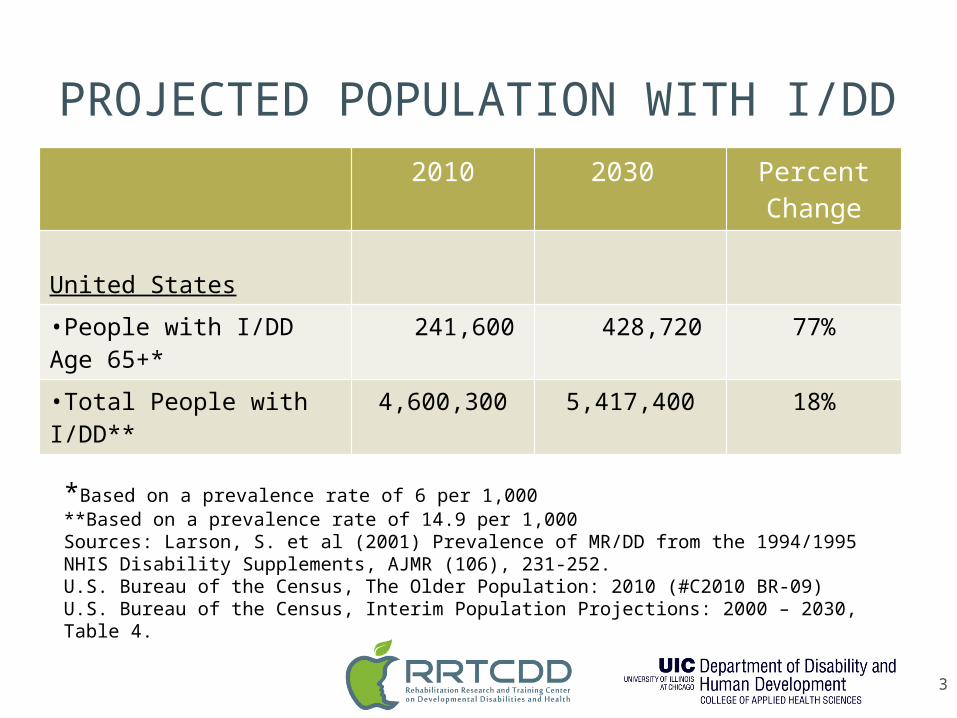
PROJECTED POPULATION WITH I/DD2010 2030 Percent
Change
United States
•People with I/DD Age 65+*
241,600 428,720 77%
•Total People with I/DD**
4,600,300 5,417,400 18%
3
*Based on a prevalence rate of 6 per 1,000**Based on a prevalence rate of 14.9 per 1,000Sources: Larson, S. et al (2001) Prevalence of MR/DD from the 1994/1995 NHIS Disability Supplements, AJMR (106), 231-252. U.S. Bureau of the Census, The Older Population: 2010 (#C2010 BR-09)U.S. Bureau of the Census, Interim Population Projections: 2000 – 2030, Table 4.
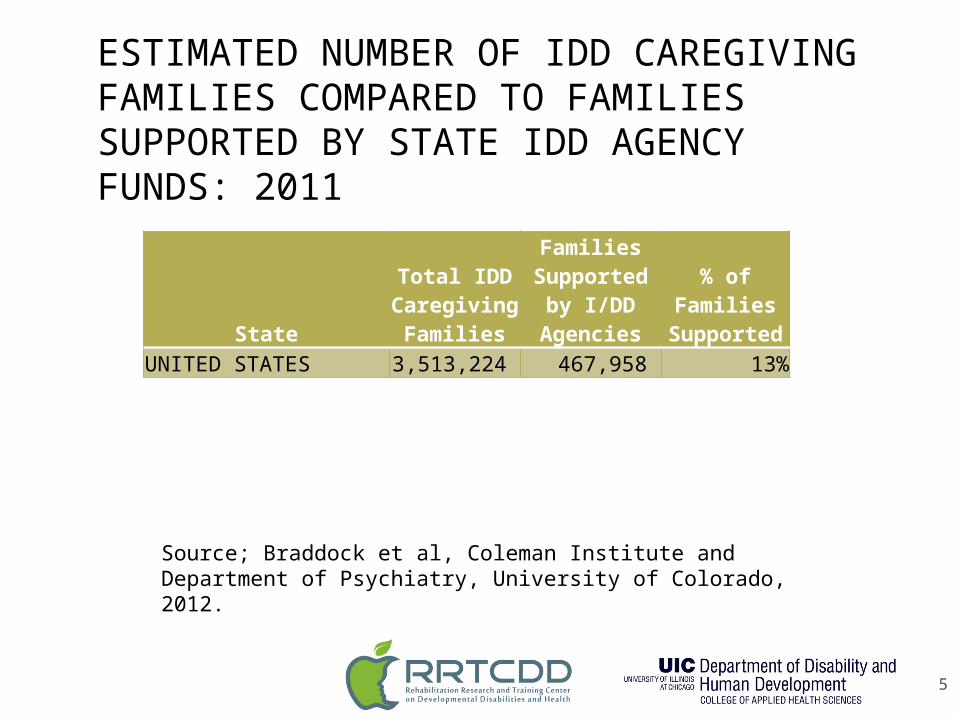
State
Total IDD Caregiving
Families
Families Supported
by I/DD Agencies
% of Families
SupportedUNITED STATES 3,513,224 467,958 13%
Source; Braddock et al, Coleman Institute and Department of Psychiatry, University of Colorado, 2012.
5
ESTIMATED NUMBER OF IDD CAREGIVING FAMILIES COMPARED TO FAMILIES SUPPORTED BY STATE IDD AGENCY FUNDS: 2011

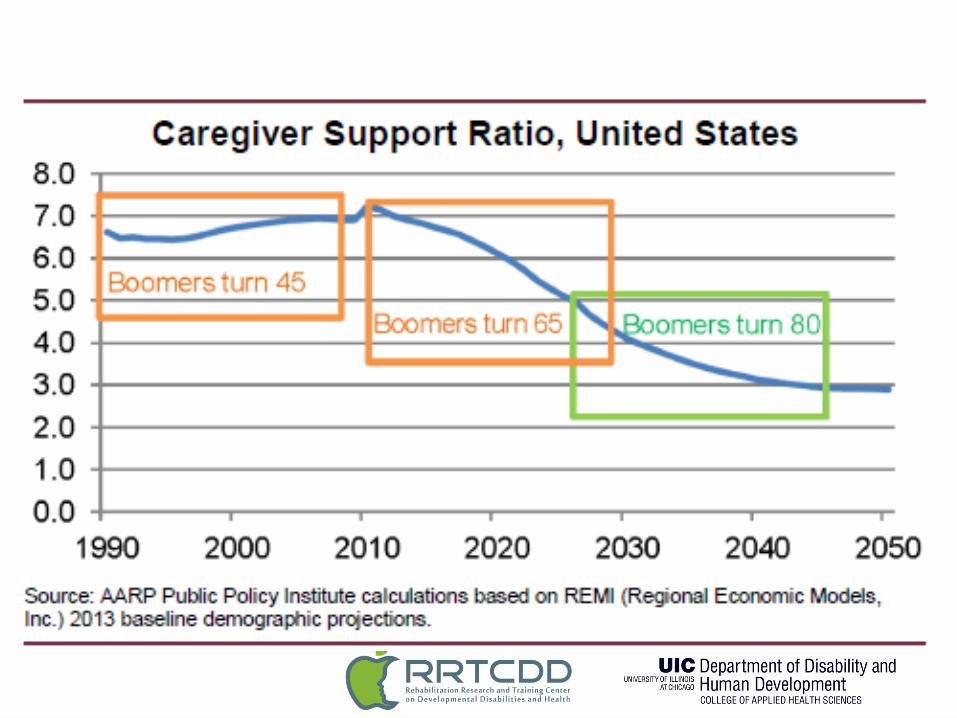
Emerging Challenges: Demographics
Source: Braddock, Hemp, & Rizzolo, 2012
Where People Live: US, 2011
With Family Caregiver
60%Supervised Res-idential Setting
12%
Own Household13%
With Spouse15%
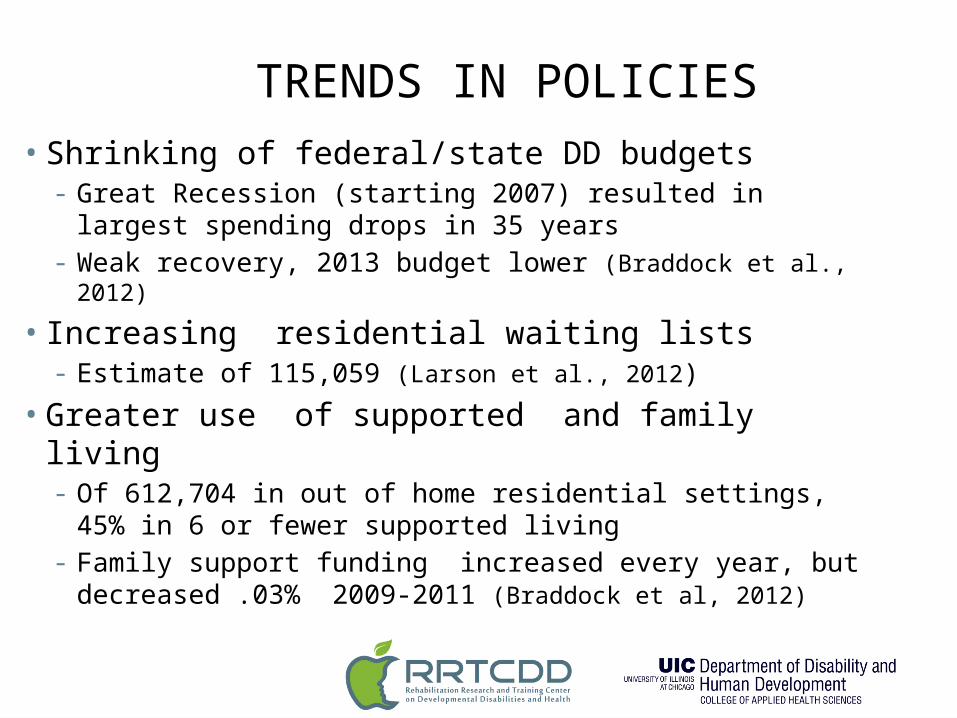
TRENDS IN POLICIES • Shrinking of federal/state DD budgets
- Great Recession (starting 2007) resulted in largest spending drops in 35 years
- Weak recovery, 2013 budget lower (Braddock et al., 2012)
• Increasing residential waiting lists - Estimate of 115,059 (Larson et al., 2012)
• Greater use of supported and family living - Of 612,704 in out of home residential settings, 45% in 6 or
fewer supported living- Family support funding increased every year, but
decreased .03% 2009-2011 (Braddock et al, 2012)
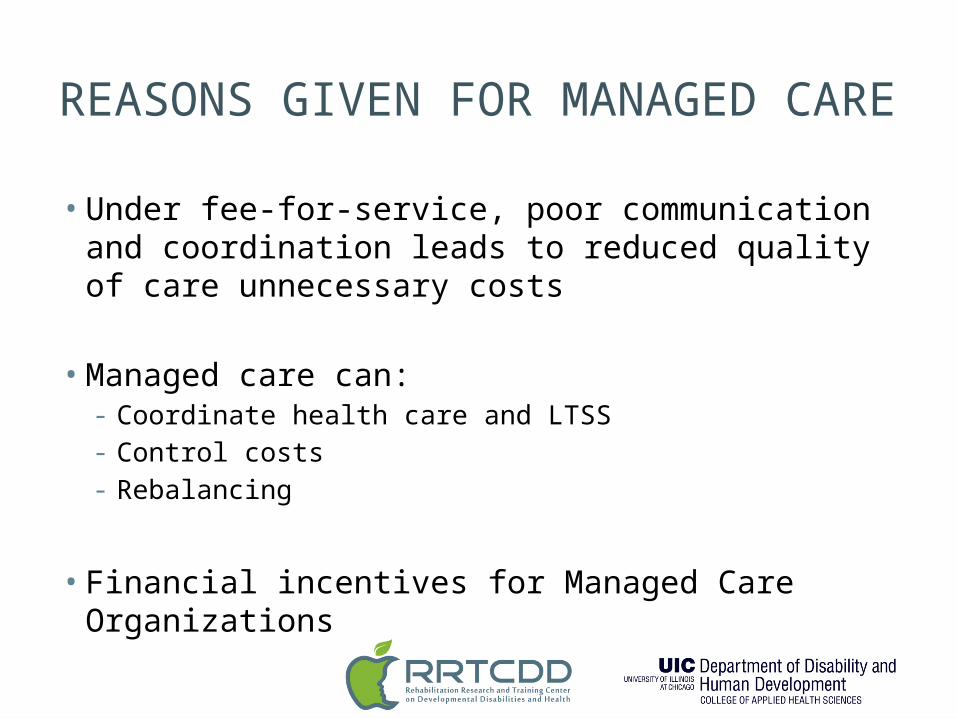
REASONS GIVEN FOR MANAGED CARE
• Under fee-for-service, poor communication and coordination leads to reduced quality of care unnecessary costs
• Managed care can:- Coordinate health care and LTSS- Control costs- Rebalancing
• Financial incentives for Managed Care Organizations
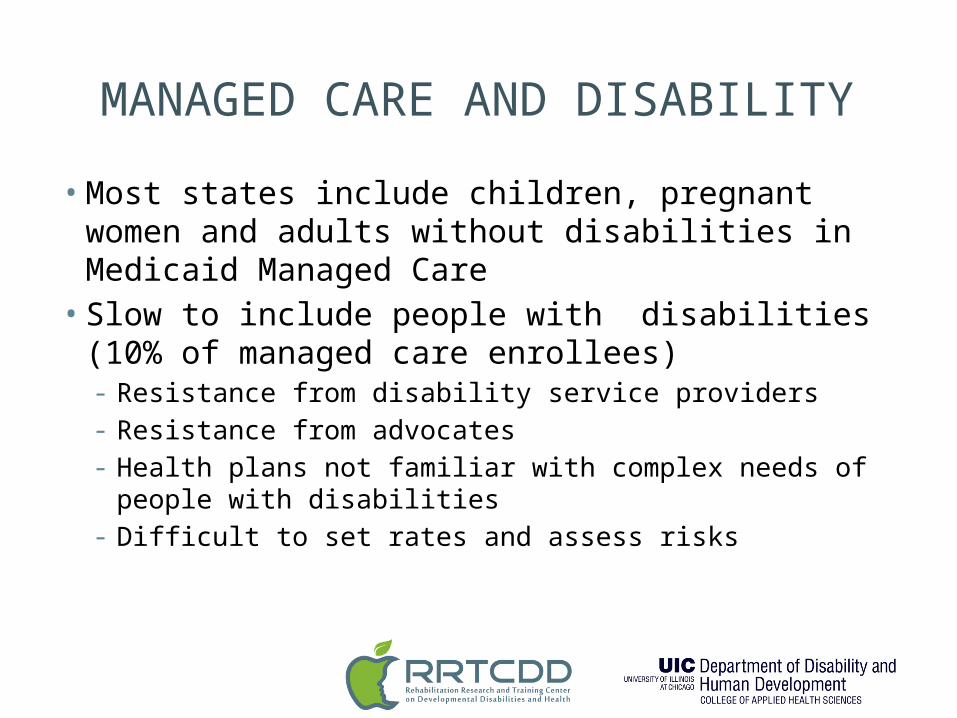
MANAGED CARE AND DISABILITY
• Most states include children, pregnant women and adults without disabilities in Medicaid Managed Care• Slow to include people with disabilities (10% of
managed care enrollees)- Resistance from disability service providers- Resistance from advocates- Health plans not familiar with complex needs of people
with disabilities- Difficult to set rates and assess risks
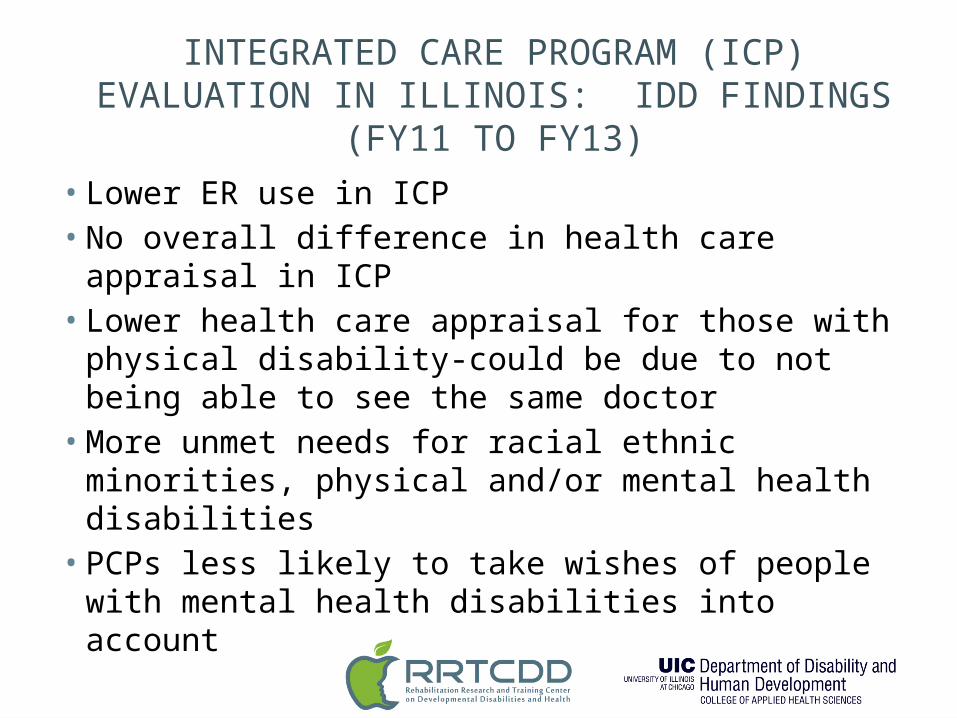
INTEGRATED CARE PROGRAM (ICP) EVALUATION IN ILLINOIS: IDD FINDINGS
(FY11 TO FY13)• Lower ER use in ICP• No overall difference in health care appraisal in ICP• Lower health care appraisal for those with physical
disability-could be due to not being able to see the same doctor• More unmet needs for racial ethnic minorities,
physical and/or mental health disabilities • PCPs less likely to take wishes of people with
mental health disabilities into account
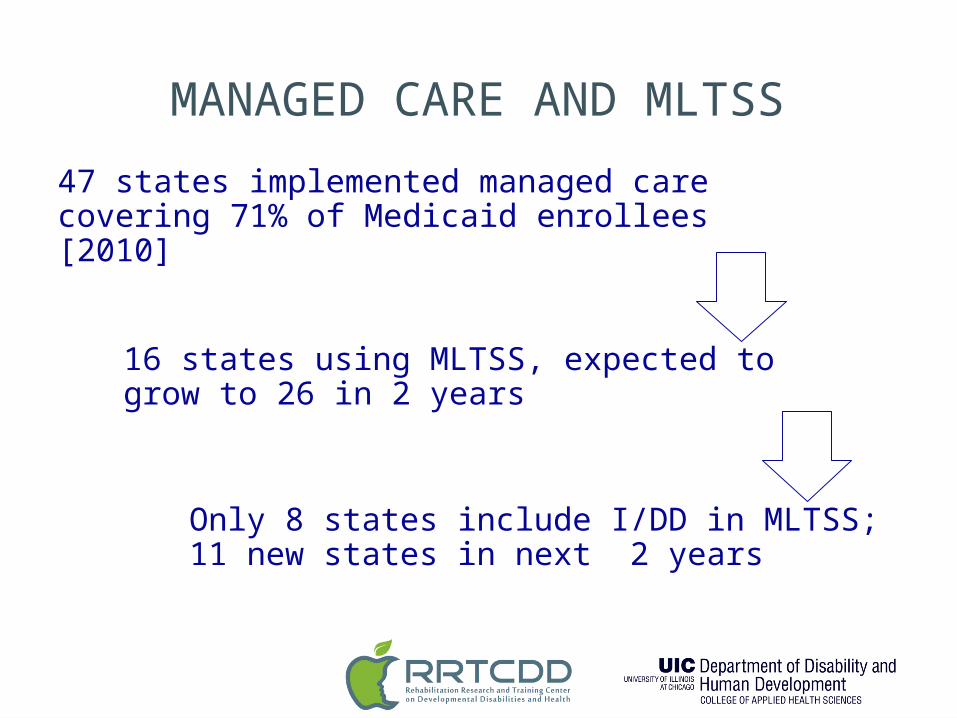
MANAGED CARE AND MLTSS
47 states implemented managed care covering 71% of Medicaid enrollees [2010]
16 states using MLTSS, expected to grow to 26 in 2 years
Only 8 states include I/DD in MLTSS; 11 new states in next 2 years
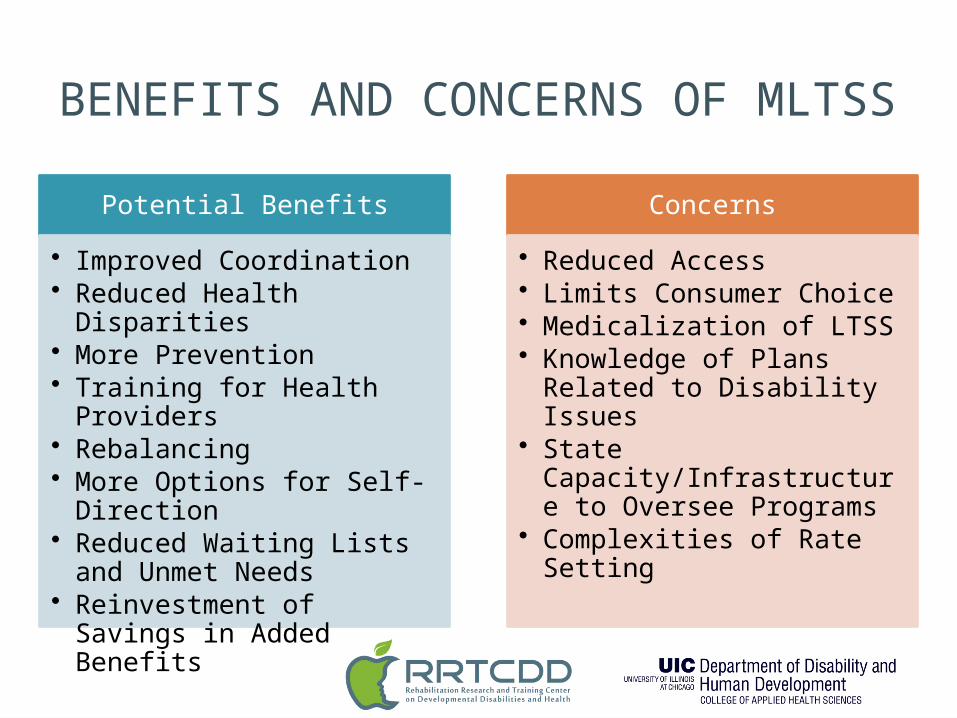
BENEFITS AND CONCERNS OF MLTSS
Potential Benefits
• Improved Coordination• Reduced Health
Disparities• More Prevention• Training for Health
Providers• Rebalancing• More Options for Self-
Direction• Reduced Waiting Lists and
Unmet Needs• Reinvestment of Savings
in Added Benefits
Concerns
• Reduced Access• Limits Consumer Choice• Medicalization of LTSS• Knowledge of Plans
Related to Disability Issues• State
Capacity/Infrastructure to Oversee Programs
• Complexities of Rate Setting
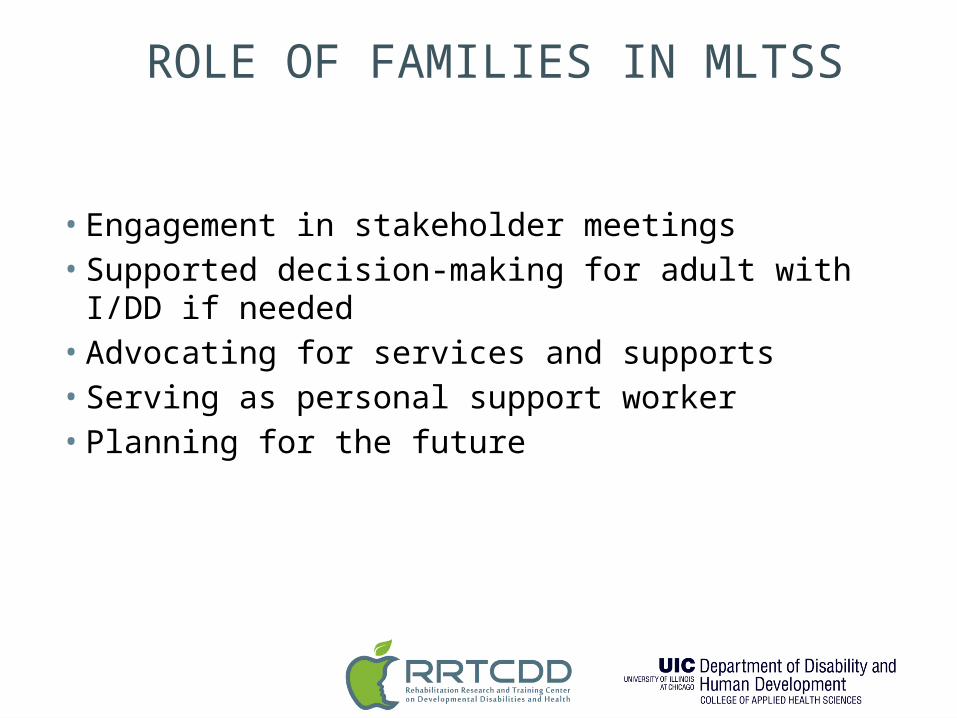
ROLE OF FAMILIES IN MLTSS
• Engagement in stakeholder meetings• Supported decision-making for adult with I/DD if
needed• Advocating for services and supports• Serving as personal support worker• Planning for the future
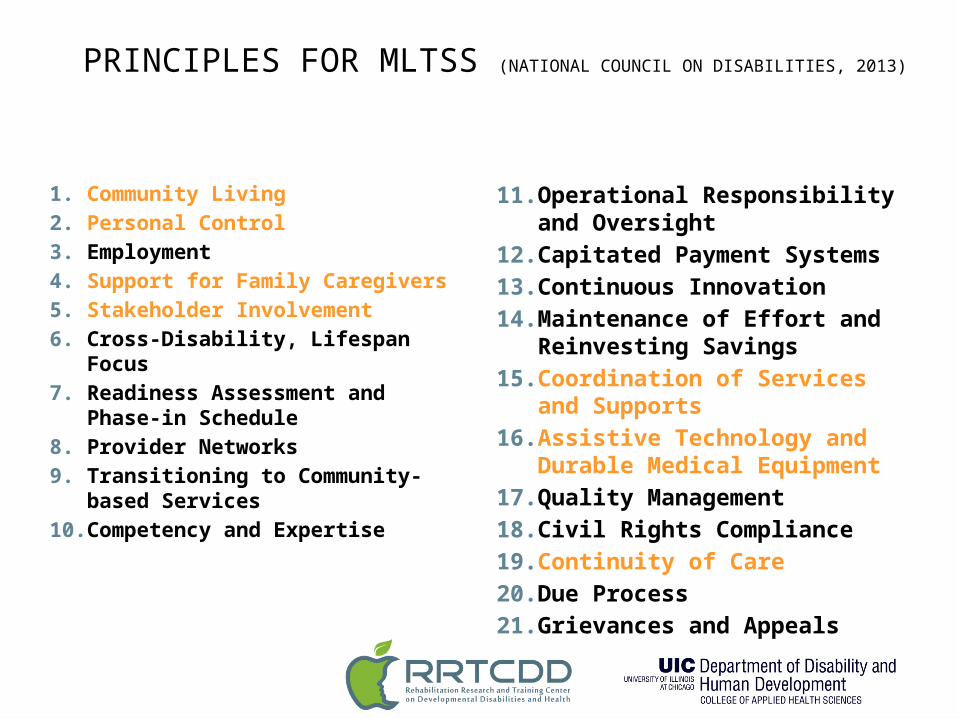
PRINCIPLES FOR MLTSS (NATIONAL COUNCIL ON DISABILITIES, 2013)
1. Community Living2. Personal Control3. Employment4. Support for Family Caregivers 5. Stakeholder Involvement6. Cross-Disability, Lifespan
Focus7. Readiness Assessment and
Phase-in Schedule8. Provider Networks9. Transitioning to Community-
based Services10. Competency and Expertise
11. Operational Responsibility and Oversight
12. Capitated Payment Systems13. Continuous Innovation14. Maintenance of Effort and
Reinvesting Savings15. Coordination of Services
and Supports16. Assistive Technology and
Durable Medical Equipment17. Quality Management18. Civil Rights Compliance19. Continuity of Care20. Due Process21. Grievances and Appeals
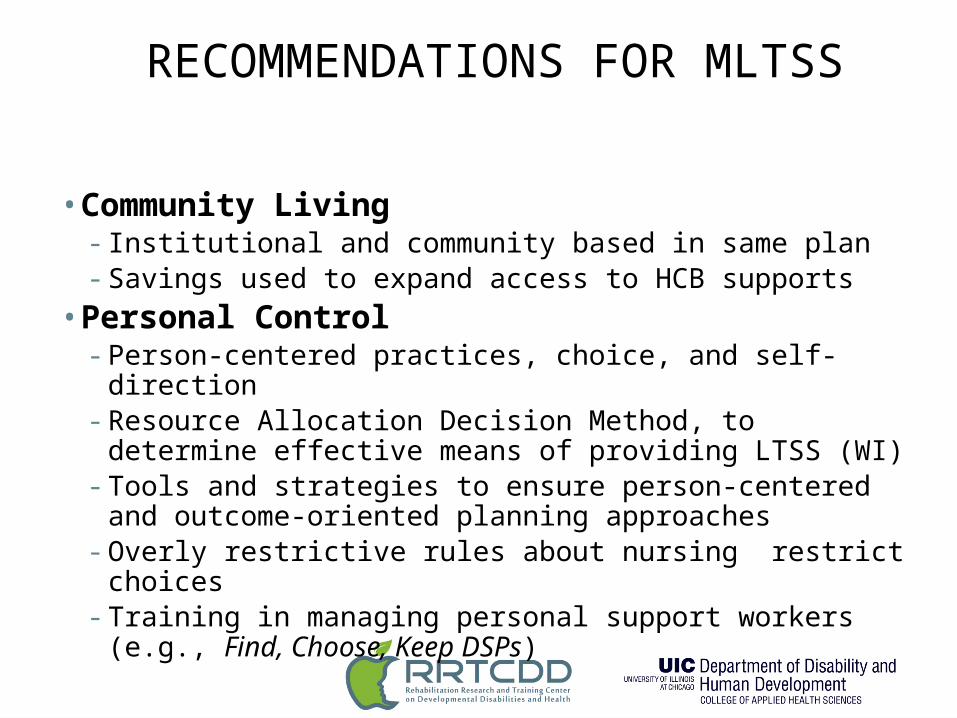
RECOMMENDATIONS FOR MLTSS
• Community Living- Institutional and community based in same plan- Savings used to expand access to HCB supports
• Personal Control- Person-centered practices, choice, and self-direction - Resource Allocation Decision Method, to determine
effective means of providing LTSS (WI)- Tools and strategies to ensure person-centered and
outcome-oriented planning approaches- Overly restrictive rules about nursing restrict
choices- Training in managing personal support workers (e.g.,
Find, Choose, Keep DSPs)
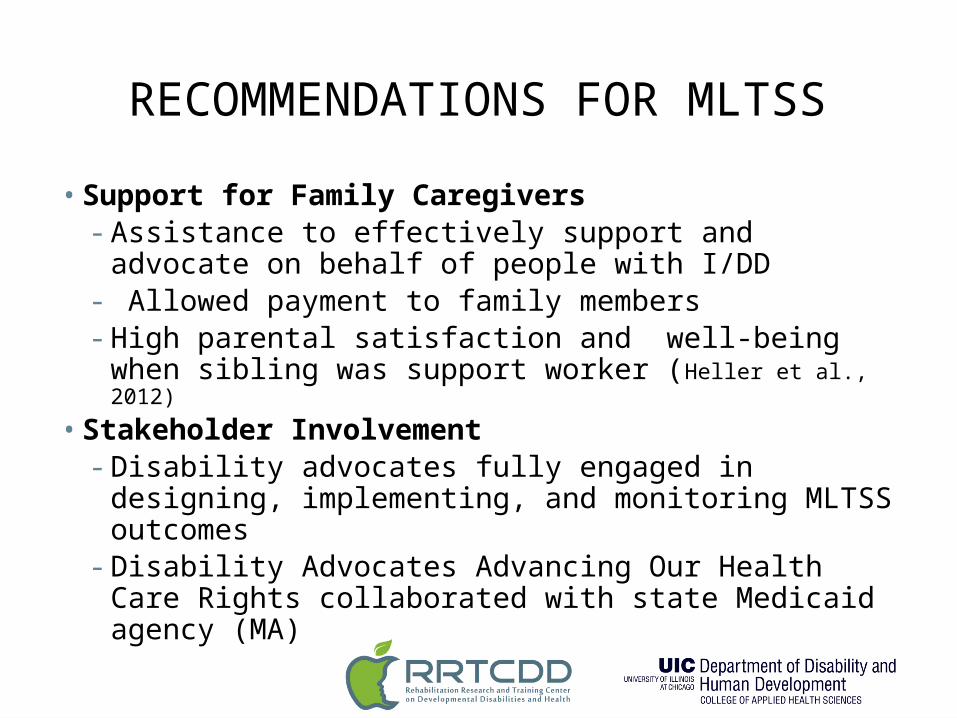
RECOMMENDATIONS FOR MLTSS
• Support for Family Caregivers- Assistance to effectively support and advocate
on behalf of people with I/DD - Allowed payment to family members- High parental satisfaction and well-being when
sibling was support worker (Heller et al., 2012)
• Stakeholder Involvement- Disability advocates fully engaged in designing,
implementing, and monitoring MLTSS outcomes - Disability Advocates Advancing Our Health Care
Rights collaborated with state Medicaid agency (MA)
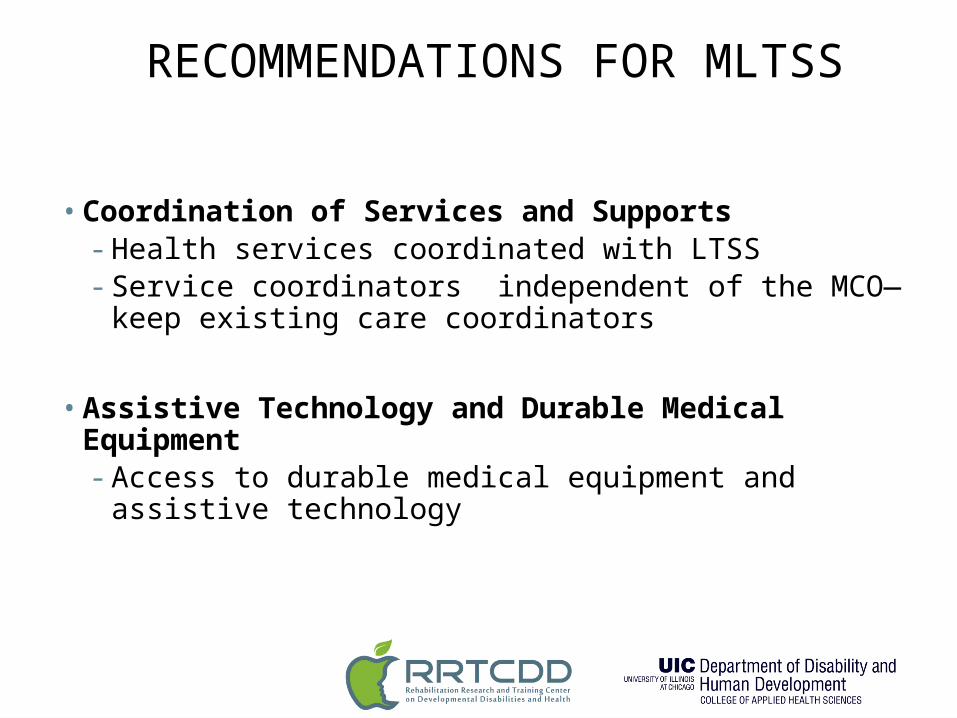
RECOMMENDATIONS FOR MLTSS
• Coordination of Services and Supports- Health services coordinated with LTSS - Service coordinators independent of the MCO—
keep existing care coordinators
• Assistive Technology and Durable Medical Equipment- Access to durable medical equipment and
assistive technology
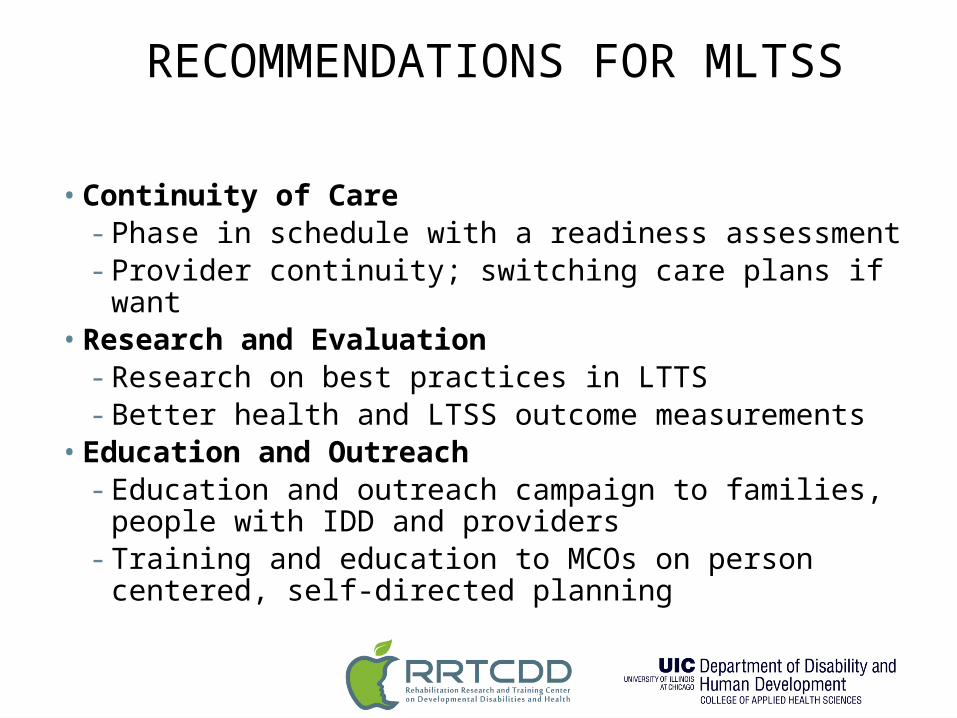
RECOMMENDATIONS FOR MLTSS
• Continuity of Care- Phase in schedule with a readiness assessment- Provider continuity; switching care plans if want
• Research and Evaluation- Research on best practices in LTTS- Better health and LTSS outcome measurements
• Education and Outreach- Education and outreach campaign to families,
people with IDD and providers- Training and education to MCOs on person
centered, self-directed planning
CONTACT US
The contents of this presentation were developed under grants from the Department of Education, NIDRR grant numbers H133B130007 and H133B130034. However, those contents do not necessarily represent the policy of the Department of Education, and you should not assume endorsement by the Federal Government.
Tamar [email protected]
www.RRTCDD.org