rehabilitation strategies (llprs) analysis for long life ... and productivity analysis for long life...
TRANSCRIPT

Constructability and ProductivityAnalysis for Long Life PavementRehabilitation Strategies (LLPRS)
May 4, 2001
EB. Lee, J. Harvey, CW. Ibbs
Pavement Research Center +Construction Engineering & Management
University of California, Berkeley

Backgroundof
Constructability Research

Motivation: CA Highway Situation• Needs Massive Rehabilitation
� Total 80,000 l-km Highway System� Built 50s-70s with 20 years Design Life� Service 30-40 years: Adverse Effects� 7,000 l-km Needs Immediate Care� Other States: Partnership (CA,WA,TX & MN)
• LLPRS: Caltrans’ Rehabilitation Strategies� SHOPP($10B): Rehab. 3,000 l-km (1998-2007)� Long Life Pavement Rehabilitation Strategies
�Provide 30-40 years of Service Life�6 lane-km Rehab./55-hour Weekend Closure

UCB LLPRS Constructability Research• Stage 1: Concrete Constructability Analysis
� Caltrans (CAL/APT)
• Stage 2: Concrete Case Study� I-10 Project with IPRF/FHWA
• Stage 3: Asphalt Constructability Analysis� Caltrans (P-PRC)
• Stage 4: Asphalt Case Study� I-710 Project with NAPA
• Stage 5: Analysis Simulation Software� 4 States Fund (CA/WA/MN/TX)

ConstructabilityInformation
Process
DOT(CALTRANS)
UCBPavementResearch
Center
UCBConstructionEngineeringManagement
ContractorsAssociation
(ACPA & NAPA)
FieldSections
LLPRSConstruction WindowsLane Closure Tactics
Technical AnalysisEconomic Analysis
Developing Innovations
Design CriteriaMaterial Design
Material Test
Provision of InformationVerification of Information
Site ObservationsCase Studies
Joint Research

Typical Failures of Rigid Pavement
(from PRC of UCB)
(a) Typical Faulting Distress
(b) Typical Transverse Fatigue and Corner Cracks
(c) Typical Longitudinal Cracks

Example of Typical Failures (I-10)

Two Types of Pavement Rehabilitation
Shoulder Non-Truck Lanes Truck Lanes Shoulder
Shoulder Non-Truck Lanes Truck Lanes Shoulder
• Remove Existing PCC & Base• Place Full Depth A/C
• Crack and Seat Slabs• Place Overlay (CSOL)
• Replace Broken Slabs
� Concrete Rehabilitation
� Asphalt Rehabilitation
• Remove Existing PCC & Base• PCC Reconstruction

PavingMaterial
DesignProfile
ConstructabilityAnalysis
ConstructionWindow
Curing orCooling Time
Continuous Closure Weekend Closure
Construction Window
Curing Time
203mm Slab 254 or 305 mm Slab
CONCRETE
Cooling Time
CSOL Full Depth
ASPHALT
LLPRS
Constructability Analysis Structure

Research Approach & Objectives• Define Typical Rehabilitation Strategies• Model Detailed Rehabilitation Process
� Hierarchical Analysis Structure• Prototype Analysis Software
� Estimate Production Capability• Parametric Study
� Constraints & Innovation for Improvement• Case Studies
� Validation / Calibration of Analysis Model• Professional Analysis Simulation Software

Two Analysis Modules• Deterministic Analysis
� Constants Parameters� Most Likely Number as Input� Estimate Average Production Capability
• Stochastic Analysis� Random Variable Analysis� “Mote Carlo Simulation” Technique� Crystal Ball / Excel / VBA Interface� PDF (Probability Distribution Function)� Predicted Production Capability
�Lower Boundary, Mean, Upper Boundary

Input Screen for Analysis Tool

Predicted Production (Deterministic)

Predicted Production (Stochastic)
Frequency Chart
Certainty is 68.00% from 1,266 to 1,581 lane-meters
Mean = 1,401.000
.008
.016
.023
.031
0
7.75
15.5
23.25
31
1,026 1,219 1,412 1,605 1,798
1,000 Trials 10 Outliers
Forecast: Distance (CSOL/Half/Profile "A")
Best ScenarioWorst ScenarioMost Likely

ConcreteAnalysis
Model

PavingMaterial
DesignProfile
WorkingMethod
ConstructabilityAnalysis
PavingLane
CuringTime
ConstructionWindow Construction Window
4hour: FSHCC 8 or 12hour: PCC
Curing Time
Single-Lane Double-Lane
Concurrent
Single Double
Sequential
203 mm Slab
4 hour 8 or 12hour
Curing
S D
C
S D
S
254 or 305 mm Slab
CONCRETE
LLPRS
Concrete Analysis Structure

TypicalConcreteProfiles (a) 203 mm Concrete Slab
(b) 254 mm Concrete Slab
(c) 305 mm Concrete Slab
Existing Profile New Profile
Removed Retained
CONCRETE 203mm (8")
CTB 102mm (4")
AB 305mm (12")
SG
CONCRETE 203mm (8")
CTB 102mm (4")
AB 305mm (12")
SG
CONCRETE 205mm (8")
CTB 102mm (4")
AB 305mm (12")
SG
NewPCC
NewCTB
CONCRETE 203mm (8")
CTB 102mm (4")
AB 305mm (12")
SG
CONCRETE 305mm (12")
CTB 152mm (6")
AB 152mm (6")
SG
CONCRETE 254mm (10")
CTB 152mm (6")
AB 203mm (8")
SGOriginal CaltransObjective:6 ln-kmper 55 hrs

(d) Linear Scheduling
0
2
4
6
8
0 10 20 30 40 50 60Schedule (hours)
Prog
ress
(lan
e-km
)
Mob. Demol CTBPaving Curing C.W.
(a) Concurrent / Single(T1)
S1 P1 P2 T1 T2 S2
Open PavingAccess
(b) Concurrent / Single(T2)
S1 P1 P2 T1 T2 S2
Open PavingAccess
(c) Concurrent / Double(T1+T2)(Counter-Flow Traffic)
S1 P1 P2 T1 T2 S2
Open PavingAccess
Concurrent Working Method

Sequential Working Method
(a) Sequential / Single(T1)
S1 P1 P2 T1 T2 S2
Open PavingAccess
(b) Sequential / Single(T2)
S1 P1 P2 T1 T2 S2
Open PavingAccess
(c) Sequential / Double(T1+T2)
S1 P1 P2 T1 T2 S2
Open PavingAccess
(d) Linear Scheduling
0
2
4
6
8
0 10 20 30 40 50 60
Schedule (hour)
Prog
ress
(lan
e-km
)
Mob. Demol CTBPaving Curing C.W

Typical CPM (Sequential Method)
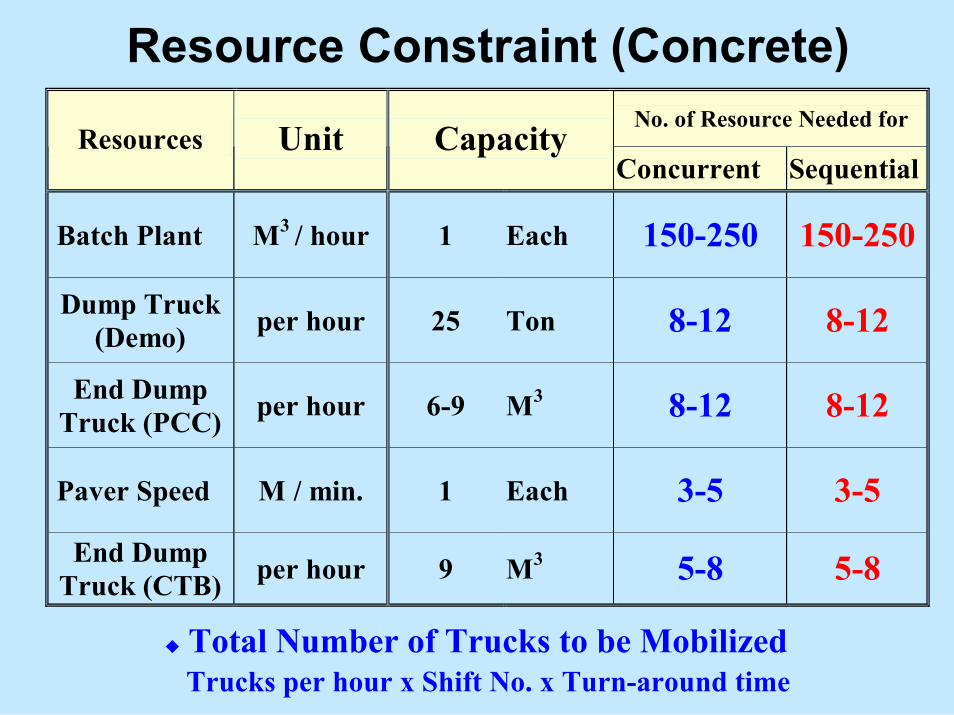
Resource Constraint (Concrete)No. of Resource Needed for
Resources Unit Capacity Concurrent Sequential
Batch Plant M3 / hour 1 Each 150-250 150-250
Dump Truck (Demo) per hour 25 Ton 8-12 8-12
End Dump Truck (PCC) per hour 6-9 M3 8-12 8-12
Paver Speed M / min. 1 Each 3-5 3-5
End Dump Truck (CTB) per hour 9 M3 5-8 5-8
� Total Number of Trucks to be Mobilized Trucks per hour x Shift No. x Turn-around time

Results ofConcreteAnalysis

Example of Single lane Production(unit: Lane-km)
Slab Thick. 203mm Concrete 254mm Concrete 305mm Concrete
Curing Time Concurrent Sequential Concurrent Sequential Concurrent Sequential
4 hour 3.8 2.4 1.9 1.5 1.7 1.3
8 hour 3.4 2.2 1.7 1.4 1.5 1.2
12 hour 3.0 2.0 1.5 1.3 1.3 1.1
Constraint Paver Speed Paver Speed Dump Truck Dump Truck Dump Truck Dump Truck
(Demo:Pave) N/A 1 : 1.31 N/A 1 : 0.71 N/A 1 : 0.76

Example of Concrete Analysis ResultsProgress vs. Curingtime
0.0
2.0
4.0
6.0
8.0
4 8 12 16 20 24Curing Time (hour)
Prog
ress
(lan
e-km
)8" 10" 12" Objective

SensitivityAnalysis
forConcrete
Options Comparison Reduction
Design 203 => 254 40% Profile 203 => 305 47%
254 => 305 12% Curing 4 hr => 8 hr 10% Time 8 hr => 12 hr 11%
4 hr => 12 hr 19% Work Method 203 mm 29%
(Concur. =>Sequen.) 254 or 305mm 21% Paving lane 203 mm 17% (Double=>Single) 254 or 305mm 7%
EDT Capacity 22 => 15 ton 15% Cycle Time 3 => 4 min 24%

Comparison of Construction WindowsC o m pa riso n o f C o nstruc tio n W in do w s
0.0
2.0
4.0
6.0
8.0
10.0
12.0
2 0 3 mm 2 5 4 mm 3 0 5 mmS la b T hick nes s
C-W
indo
w (W
eeks
)
Cont. (3 s hift) Cont. (1 Shift) W e e ke nd
Const. Window 203 mm 254 mm 305 mm DurationCont. (3 shift) 1.4 2.1 2.4 WeeksCont. (1 Shift) 4.0 5.9 6.6 Weeks
Weekend 6.2 10.1 11.4 No. of Weekend

• Caltrans’ Objectives for LLPRS� Maximum Target= 3.5 Truck lane-km / 55 HR
�Most likely = 2.0 - 3.0 lane-km
• Parametric Study (Critical Parameters)� Concrete Curing Time is Not the Most
Critical Parameter� Design Profile has the Biggest Impact� Delivery Trucks Constrain Production
• Unclear Benefits of FSHCC (vs. PCC)� Needs Production vs Cost Analysis
Preliminary Findings for Concrete

Summary ofConcrete
Case Study (I-10)

Case Study: Concrete on I-10Asphalt (AC) on I-710

I-10 Project: Work Scope
Eastbound Direction
Traffic Lane (#2) Rehabilitated Lane (#3) Construction Access Lane (#4) Shoulder (access + parking area)
Traffic Lane (#1)
10’12’12’12’12’
MCB
Sound Wall
� 20 lane-km (3 l-km Weekend + Nighttime)� Rebuild Two Truck lanes (No.3 & 4)� 8” Slab Replacement with FSHCC (4 hr curing)� Concurrent Work / Single Lane

I-10 Project: Traffic Conditions
Traffic before Rehabilitation
Traffic during Rehabilitation

I-10 Project: Slab Demolition (non-impact)
Non-Impact Demolition

Drilling Holes for Tie-bars
Installation of DowelBars and Tie Bars
I-10 Project: Tie-Bars and Dowel-Bars

Paving, Finish, and Texturing
I-10 Project: Screed for FSHCC Paving

I-10 Project: Washing / Chipping (FSHCC)
Washing Mixer Truck
Chipping FSHCCBuild-up

I-10 Project: Breakdown of M-T Cycle-timeBreakdown of a Mixer cycle-time (70 min.)
55
15
1055
5
5
15 waiting for pouring
concrete pouring
washing
move to batch plant
measure weight
waiting for charge
concrete charge
record slip
move to site

I-10 Project: Nighttimes vs Weekend
Nighttime Closure WeekendClosure
7-hourClosure
10-hourClosure
55-hourClosure
Main Work(hours) 2 hour 5 hours 43 hours
Auxiliary Work(hours) 5 hours 5 hours 8 hours
Slab No.Replaced 15 50 615
Productivity(slabs / hour) 7.5 10 14
MajorResources
7 D-T4 M-T
7 D-T8 M-T
21 D-T12 M-T

I-10 Project: Prediction from the UCB Model
Frequency Chart
Certainty is 85.00% from 2.4 to 3.4
.000
.006
.012
.018
.023
0
8.75
17.5
26.25
35
2.0 2.4 2.8 3.3 3.7
1,500 Trials 12 Outliers
Forecast: FSHCC-4hr
Estimate = 2.4 ~ 3.4 lane-km / 55 hoursMean = 2.9 lane-km / 55 hours

I-10 Project: Overall Rehabilitation Progress
Actual Performance = 2.8 lane-km / 55 hours
Progress of Rehabilitation
0
500
1000
1500
2000
2500
3000
0 5 10 15 20 25 30 35 40 45 50 55Time (hour)
Pro
gres
s (la
ne-m
eter
)
demolition paving
B-P Break-down
7 Mixers rejected
Screed break-down
Slow-down due toTraffic Regulation

Concrete Case Study: I-10 Project

I-10 Project: Traffic Flow Comparison
Mean = 2,000 Cars / hourSpeed = 50 ~ 80 mph
Comparison of Eastbound Traffic Volume
0
1500
3000
4500
6000
7500
90008-9
PM12
-1AM
4-5AM
8-9AM
12-1P
M4-5
PM8-9
PM12
-1AM
4-5AM
8-9AM
12-1P
M4-5
PM8-9
PM12
-1AM
4-5AM
55-hour Time Frame
Tota
l Veh
icle
per
hou
rThrough Volume (55-hour) Through Volume (Historical)Before Diversion (55-hour) Before Diversion (Historical)
c

AC (Asphalt) Analysis
Model

Cooling Time
FullCompletion
Full Closure
PartialCompletion
Full
Half Closure
Profile "A"
Full
Full
Partial Full
Half
Profile "B"
CSOL
Cooling Time
Single Lane Double Lane
Profile "A"
Single Double
Profile "B"
Full Depth
Asphalt Concrete (AC)
Asphalt (AC) Analysis Structure
complete
laneclosure
designprofile
layerprofile
coolingtime
designprofile

Change of Design Profile(CSOL: Crack Seat and Overlay)
Existing Pavement
PCC 203mm (8")
CTB 102mm (4")
AB 305mm (12")
SG
Layer Profile "A"
PCC 203mm (8")
CTB 102mm (4")
AB 305mm (12")
SG
25 mm
75 mm
75 mm
55 mm
0.5 hour
4 hour
4 hour
2 hour
Final Lift
2nd Lift
3rd Lift
1st Lift
Layer Thick. Cooling
OR
Total thick. = 230 mm (9")
Layer Profile "B"
PCC 203mm (8")
CTB 102mm (4")
AB 305mm (12")
SG
25 mm
75 mm50 mm50 mm
0.5 hour
4 hour2 hour2 hour
1st Lift
2nd Lift3rd Lift
Final Lift
Layer Thick. CoolingTotal thick. = 200 mm (8")
Retained AC(CSOL)Fabric

Work Plan (CSOL)
1. Full Closure + Full Completion
2. Half Closure + Full Completion
3. Half Closure + Partial Completion
(b) Sequence of Paving
(a) Plan View (1'st stage)
S1 P1 P2 T1 T2 S2
Open PavingAccess
SafetyBarrier(MCB)
PCC
1st Lift1st Lift2nd Lift
3rd LiftFinal Lift
2nd Lift3rd Lift
Final Lift
3'rdStage
FinalStage
1'stStage
2'ndStage
Lane P1+P2 Lane T1+T2

Change of Design Profile(Full Depth AC Replacement)
Existing Pavement Layer Profile "B"
Removed Retained AC
PCC 203mm(8")
CTB 102mm (4")
AB 305mm(12")
SG
76 mm
AB 203mm(8")
SG
76 mm76 mm76 mm51 mm51 mm
1 hour1.5 hour6 hour4 hour1.5 hour1 hour
1st Lift2nd Lift3rd Lift4th Lift5th Lift
Final Lift
Layer Thick. Cooling
OR
Total thick.=406 mm (16")Layer Thick. Cooling
Layer Profile "A"
76 mm
AB 279mm(11")
SG
76 mm77 mm76 mm25 mm
1 hour2 hour
6.5 hour1.5 hour
0.5 hour
1st Lift2nd Lift3rd Lift4th LiftFinal Lift
Total thick.=330mm (13")

Work Plan (Full Depth AC)
(a) Single-lane (T1: 1'st weekend)
S1 P1 P2 T1 T2 S2
Open PavingAccess
S1 P1 P2 T1 T2 S2
Open PavingAccess
(c) Double-lane (T1+T2)
S1 P1 P2 T1 T2 S2
Open PavingAccess
(d) Linear Scheduling
0
1
2
3
4
0 10 20 30 40 50 60Schedule (hour)
Prog
ress
(lan
e-km
)
Mobil. Demolition PavingDe-mobil. C.W
Safety Barrier(MCB)
(b) Single-lane (T2: 2'nd weekend)

Resource Constraint for AC Analysis
Resources Unit Capacity Number
AC Mixing Plant M3 / hour 1 Each 150 (100-200)
Dump Truck (Demo/Full Depth) per hour 25 Ton 10
(8-12)
Semi-bottom Truck (AC) per hour 25 Ton 12
(9-20)
Paver Speed Km/hour 1 Each 6.0 (4.5 – 7.5)
CalCoolAC Cooling Time
Analysis Software

AC Cooling-time Analysis: CalCool• Cooling-time Impact to Production
� Waiting Time (Next Layer Paving or Traffic Switch)• Parameters Considered
� Design� Sub-base� Environment� Delivery & Stop Temperature
Time
Average Pavement Temperature
Overstressed
Understressed
Optimal CompactionTemperatures
Optimal Compaction TimeFrame

CalCool Input Window

CalCool: Tabular and Graphic Output
• Download from the PRC or 4 States WEB• http://www.its.berkeley.edu/pavementresearch/CalCool/CalCool.exe

CalCool Validation (Multi-lift AC)Lompoc H-Street AC ConstructionPoint 11, 2 Lifts over Rich bottom
0
20
40
60
80
100
120
140
160
0:00 1:12 2:24 3:36 4:48 6:00 7:12 8:24 9:36 10:48
Time (hour)
Tem
pera
ture
(°C
)
In-depth (lift 2) Surface (lift 2)
Edge (lift 2) In-depth (lift 3)
Surface (lift 3) Edge (lift 3)
CalCool Lift 2 CalCool Lift 3
Date: October 8, 1999Time: 8:50, 11:22 AMAvg Air Temp: 23, 32 °CAvg Wind: 5.0, 0 kphExisting Surface: AC, ACExisting Surface Temp: 23, 58°CCloud Cover: Clear and dry, clear and dryMix Specification: DGACLift Thickness: 80, 80 mm

Result ofAC (Asphalt)
Analysis

AC Analysis:CSOL (Deterministic)CSOL Production Graph
(4 lanes: lane-meter)
2,000
4,000
6,000
8,000
2 3 4 5 6 7 8Cycle time of Semi Bottom Truck (min.)
Prod
uctio
n (la
ne-m
eter
)
full-close full-completeprofile "B" full-close full-completeprofile "A" half-close full-completeprofile "B" half-close full-completeprofile "A" half-close part-complete profile "B"

CSOL Stochastic Analysis (4 lanes: lane-meter)
3,000
5,000
7,000
full-close full-complete profile "B"
full-close full-complete profile "A"
half-close full-complete profile "B"
half-close full-complete profile "A"
half-close partl-complete profile "B"
Analysis Option (Closure / Completion / Profile)
Prod
uctio
n (la
ne-m
eter
)
Lower bound Mean Deterministic Upper bound
AC Analysis:CSOL (Stochastic)
Frequency Chart
Certainty is 68.00% from 1,266 to 1,581 lane-meters
Mean = 1,401.000
.008
.016
.023
.031
0
7.75
15.5
23.25
31
1,026 1,219 1,412 1,605 1,798
1,000 Trials 10 Outliers
Forecast: Distance (CSOL/Half/Profile "A")

AC Analysis:CSOL Comparison ClosureOption Full Closure Half Closure
Completion Option
Full Completion
Full Completion
PartialCompletion
ProfileOption
Profile“A”
Profile“B”
Profile“A”
Profile“B”
Profile“B”
AverageProduction 4,808 5,534 3,962 4,511 5,208
Comparison 87 % 100% 72% 82% 94%
Waiting(hours) 0 0 9 8.5 3
Coolingwaiting
Trafficswitch 0 0 0 0 2 7 2 6.5 0 3

AC Analysis:Full Depth (Stochastic)Full-Depth Stochastic Analysis
1,000
1,500
2,000
2,500
3,000
Single Lane Profile "A"
Single Lane Profile "B"
Double Lane Profile "A"
Double Lane Profile "B"
Analysis Option (Paving Lane / Layer Profile)
Pro
duct
ion
(lane
-met
er)
Lower bound MeanDeterministic Upper bound
Frequency Chart
Certainty is 68.00% from 1,211.45 to 1,784.22 lane-meter
Mean = 1,523.85.000
.007
.015
.022
.029
0
7.25
14.5
21.75
29
850.02 1,193.11 1,536.20 1,879.29 2,222.38
1,000 Trials 2 Outliers
Forecast: Production (Lane-Meter)

Construction Windows (Asphalt)
5.94.83.74.2Weekend406mm(16”)330mm(13”)200mm(8”)230mm(9”)Thickness
1.81.41.11.2Cont. (24H)2.62.11.61.8Cont. (16H)
Profile”B”Profile”A”Profile”B”Profile”A”Layer ProfileFull-Depth ACCSOLDesign
C o n s tr u c t io n W in d o w s C o m p a r is o n
0 .0
1 .0
2 .0
3 .0
4 .0
5 .0
6 .0
C S O L P ro f i le " A "
C S O L P ro fi le " B "
F u ll-D e p thP ro f i le " A "
F u ll-D e p thP ro f i le " B "
D e s ig n P r o f i le
No
of w
eek(
end)
W e e k e n d C o n ti n u o u s (1 6 h r /d a y ) C o n t i n u o u s (2 4 h r /d a y )

Sensitivity of AC Analysis• Sensitivity (AC vs. Concrete)
� AC Paving more Complex than Concrete� Sensitivity Study is Difficult
• Most Critical Parameters� Pavement Thickness (Proportional)� Asphalt Delivery Trucks� Demo. Hauling Trucks (Full Depth only)� Lane Closure Tactics (Cooling Time)� Mixing Plant, Paver

Preliminary Finding for AC Analysis• Production Objectives: 6 km per weekend
� CSOL�Achieve 40 % of target (2.5 lane-km Truck-lanes)�Faster, pave all lanes (30% for shoulders)
� Full depth AC�Achieve 30% of Target (2.0 lane-km Truck-lanes)�Slower, but fewer lanes (Truck Lanes only)
• Lane Closure Tactics� CSOL: Full- Closure is 20 % More Productive� Full Depth: Single-lane is 10 % More Productive

Asphalt ConcreteCase StudyI-710 Project

I-710 Project (Stage Construction)
Construction is Scheduled in 2001

I-710 Project Section Profiles
Existing PCCProfile
Removed Retained AC
PCC 203mm(8")
CTB 102mm (4")
AB 305mm(12")
SG
Layer Thick. Cooling
Full Depth AC
OR 76 mm
AB 178mm(7")
SG
76 mm77 mm76 mm25 mm
1 hour2 hour
6.5 hour1.5 hour
0.5 hour
1st Lift2nd Lift3rd Lift4th LiftFinal Lift
Total thick.=330mm (13")Deemolition =431mm(17")
more clearance = 101 m
m (4")
Existing Surface
CSOL
PCC 203mm(8")
CTB 102mm (4")
AB 305mm(12")
SG
25 mm
75 mm
75 mm
55 mm
0.5 hour
4 hour
4 hour
2 hour
Final Lift
2nd Lift
3rd Lift
1st Lift
Layer Thick. CoolingTotal thick. = 230 mm (9")
Fabric

I-710 Project Stage Construction (I)
CSOL
Full Depth

I-710 Project Stage Construction (II)

I-710 Project: UCB Model Prediction
710 (CSOL Stochastic Analysis )
0
1,000
2,000
3,000
4,000
5,000
6,000
Cente rline -me te r 3 lanes(Lane -me te r)Analysis Option
Pro
duct
ion
(met
er)
Low e r bound M e anDe te rm inis tic Uppe r bound
710 (Full-depth Stochastic Analysis )
0
500
1,000
1,500
2,000
Cente rline -me te r 3 lanes(Lane-me te r)Analysis Option
Pro
duct
ion
(met
er)
Low e r bound M e anDe te rm inis tic Uppe r bound

I-710 Project: UCB Prediction vs. Plan
I-710 (Plan)UCBModel
UnitOptionStage
4,5Stage
3,6
2.002.401.50Lane-km
0.650.800.50Centerline-kmFull
Depth
3.304.804.83Lane-km
1.101.601.55Centerline-km
CSOL

Further Steps(Current and Future)

Current Focus and Further Steps• Constructability Analysis Software
� 4 State Fund: CA, WA, MN, and TX DOTs� Knowledge-based Analysis Simulation Software� MS Access + Visual Basic� Deterministic & Stochastic Analysis Modules
• More Case Studies (Validation)� Validation & Calibration of UCB Model� Concrete Model: PCC vs. FSHCC� AC Model with I-710
• Life Cycle Cost Analysis� Direct Construction & Indirect User Delay Costs� Durability, Maintenance Cost, and Policy Aspects

Questionsand
Answers
If Need More Information …EB Lee Email:[email protected] Lee URL: http://www.ce.berkeley.edu/~eblee/PRC URL: http://www.its.berkeley.edu/pavementresearch/