reinforced nanocomposites for electrical applications
TRANSCRIPT

2010:138 CIV
M A S T E R ' S T H E S I S
Reinforced Nanocomposites forElectrical Applications
Maxime Roux
Luleå University of Technology
MSc Programmes in Engineering Materials Technology (EEIGM)
Department of Applied Physics and Mechanical EngineeringDivision of Polymer Engineering
2010:138 CIV - ISSN: 1402-1617 - ISRN: LTU-EX--10/138--SE
Maxime ROUX
Students in 5th year the EEIGM From February 1st, 2010 until July 31st, 2010
Supervised by Dr Sian F. Fennessey
ABB Corporate Research Center, Insulation and Polymer Technology (V2)
And Lennart Wallström LTU Luleå tekniska Universitet, Department of Applied Physics and Mechanical engineering,
Polymer Engineering
MASTER’S THESIS
Reinforced Nanocomposites For
Electrical Applications
ABB Corporate Research Center Segelhofestrasse 1K 5405 Baden-Dätwill SWITZERLAND
Luleå University of Technology (LTU) Department of applied physics and
mechanical engineering 971 87 Luleå
SWEDEN
)
EEIGM European School of Material Sciences and Engineering Rue Bastien Lepage 54 000 Nancy France

2
ABSTRACT This project is focused on studying the effects of particles for improving mechanical and
thermal properties of glass fiber reinforced epoxy composite. Submicro and nanosized particle
filled composites based on diglycidyl-ether of bisphenol A and anhydride-curing agents are
evaluated. The particles examined in this report are Particle 1 (P1 – 700nm) supplied in powder;
Particle 3 (P3 – 100nm), Particle 2 (P2 – 70nm), and Particle 4 (P4 – 45nm) supplied in
masterbatches. These particles have been successfully used in laminates with clean woven E-
glass fabric produced by vacuum assisted resin transfer molding (VARTM). Optical microscope
and scanning electron microscope is used to observe the particles and the composites.
Laminates of unfilled resin and unidirectional unwashed glass fabric are manufactured by wet
lay.
When the particles or the masterbatch are mixed with the epoxy resin, the viscosity is
increased significantly. Dynamic mechanical analyses of the epoxy and nanocomposite plates
and their corresponding laminates show an increase of the storage modulus with the addition of
particles, especially beyond Tg. The relative permittivity was always higher than the reference
epoxy for the filled resins and more especially for laminates at 40°C. The laminates with 30vol%
atlas 1/7 clean glass fabrics exhibit better results than the non-clean E-glass fabric (1). The
dielectric dissipation factor was lower for the laminates with 30vol% clean glass fabric than for
the matrix only, the laminates with 30vol% of ML clean fabric and atlas 1/7 normal fabric. The
flexural strength is measured, and the most interesting results were found for the laminates
with 30vol% atlas clean glass fabrics with 35,3wt% P3 particles in epoxy and with reference
epoxy. Concerning the flexural strength of the matrices, the most interesting were found to be
143MPa for the epoxy filled with 12,6wt% P4 particles (45nm).
Electrical breakdown setup was built to test flat laminate of 4mm in a SF6 gas chamber.
Three types of samples were tested, samples with only matrix of the reference epoxy, samples
with P3 particles filled epoxy plate and laminate of reference epoxy with 30vol% of clean atlas
glass fabric.
Particles 5 (P5 – 15/30nm) supplied in masterbatch are also introduced in this project
but the mixing is revealed to be more difficult than with the previous masterbatches and no
more work was carried out at this stage.

3
AKNOWLEDGMENTS
I would like to thank all the permanent employees and interns working in the Insulation
and Polymer technology group at the ABB Corporate Research Center, Baden-Dättwil,
Switzerland, for the help and advice given during these 6 months and the excellent working
ambiance.
I also want to thank supervisor Lennart Wallström at the LTU for giving me the opportunity to make my master thesis. My thanks go also to Dr Sian F. Fennessey not only for supervising and making this project possible but also for all the knowledge I learnt during this internship.
4
TABLE OF CONTENTS
1. INTRODUCTION .............................................................................................................. 6
2. STATE OF THE ART .......................................................................................................... 7
2.1. EPOXY RESIN ......................................................................................................................... 7 2.1.1. Epoxy Resin ........................................................................................................................................ 7
2.1.2. Hardener ............................................................................................................................................ 7
2.1.3. Accelerator ........................................................................................................................................ 7
2.2. INSULATORS ......................................................................................................................... 8 2.2.1. Materials and shape .......................................................................................................................... 8
2.2.2. Manufacturing ................................................................................................................................... 8
2.3. FILLERS AND PARTICLES ........................................................................................................... 9 2.3.1. Ceramic particles affect the mechanical and thermal properties ..................................................... 9
2.3.2. Ceramic particles affect the dielectric properties ........................................................................... 10
2.4. INTERLAMINAR SHEAR ........................................................................................................... 10 2.4.1. Short beam method using 3 points bending ................................................................................... 11
2.4.2. ±45° Tensile Test .............................................................................................................................. 13
2.4.3. The V-Notched Beam Method or Iosipescu method ....................................................................... 14
2.4.4. Double notched shear test (DNS) .................................................................................................... 15
2.4.5. V-Notched Rail Shear test ................................................................................................................ 16
2.4.6. Conclusion ....................................................................................................................................... 16
2.5. ELECTRICAL BREAKDOWN ...................................................................................................... 17
2.6. DYNAMIC MECHANICAL ANALYSIS (DMA) ............................................................................... 18
3. MATERIALS.................................................................................................................... 19
3.1. CY225/HY925: REFERENCE ................................................................................................. 19
3.2. PARTICLES .......................................................................................................................... 20 3.2.1. Particle 1 (P1 - 700nm) .................................................................................................................... 20
3.2.2. Particle 2 (P2 - 70nm) ...................................................................................................................... 21
3.2.3. Particle 3 (P3 – 100nm) ................................................................................................................... 21
3.2.4. Particle 4 (P4 – 45nm) ..................................................................................................................... 21
3.2.5. Particle 5 (P5 – 15/30nm) ................................................................................................................ 22
3.3. GLASS FABRIC ..................................................................................................................... 22 3.3.1. Glass fabric ...................................................................................................................................... 22
3.3.2. Cleaned glass fabrics........................................................................................................................ 23
3.4. ROOM TEMPERATURE CURING EPOXY RESIN (RT EPOXY) .............................................................. 24
4. EXPERIMENTAL: PROCESSING AND CHARACTERIZATION ................................................ 25
4.1. PROCESSING ....................................................................................................................... 25 4.1.1. Casting of plates .............................................................................................................................. 25
4.1.2. Impregnation of laminates .............................................................................................................. 25
4.1.3. Wet lay............................................................................................................................................. 26
4.1.4. Electrical strength samples .............................................................................................................. 27
4.2. CHARACTERIZATION ............................................................................................................. 27 4.2.1. Viscosity ........................................................................................................................................... 27

5
4.2.2. Reaction enthalpy and glass transition temperature, Tg ................................................................ 27
4.2.3. Degradation temperature, Td and the residue weight ................................................................... 28
4.2.4. Thermal conductivity λ .................................................................................................................... 28
4.2.5. Microscopy ...................................................................................................................................... 28
4.2.6. Storage and loss modulus ................................................................................................................ 28
4.2.7. Thermal expansion coefficient α (CTE) ............................................................................................ 28
4.2.8. Relative permittivity and dissipation loss factor ............................................................................. 29
4.2.9. Fiber volume percent ...................................................................................................................... 29
4.2.10. Density ........................................................................................................................................ 29
4.2.11. Flexural and interlaminar shear strength ................................................................................... 30
4.2.12. Partial Discharges (PD) ................................................................................................................ 31
4.2.13. Electrical breakdown strength .................................................................................................... 31
5. RESULTS AND DISCUSSIONS ........................................................................................... 33
5.1. REFERENCE CY225/ 80 PHR HY925 ................................................................................... 33
5.2. LAMINATES: E-GLASS FIBERS .................................................................................................. 34
5.3. PARTICLE P1 (700NM) ........................................................................................................ 38
5.4. PARTICLE P2 (70NM) ........................................................................................................... 40
5.5. PARTICLE P3 (100NM) ......................................................................................................... 48
5.6. PARTICLE P4 (45NM) ........................................................................................................... 51
5.7. PARTICLE P5 ( 15-30NM) ..................................................................................................... 53
5.8. ELECTRICAL BREAKDOWN TEST ................................................................................................ 54
6. CONCLUSION ................................................................................................................. 59
7. FUTURE DIRECTIONS/RESEARCHES ................................................................................ 60
8. REFERENCES .................................................................................................................. 61
9. APPENDIX ..................................................................................................................... 64
9.1. APPENDIX : ELECTRODES DESIGN............................................................................................. 64
9.2. APPENDIX : THERMAL EXPANSION ........................................................................................... 66

6
1. INTRODUCTION
This study focuses on the optimization of thermal conductivity for improving the heat dissipation in insulating material and the reduction of residual stresses during the processing of fiber reinforced composites. The effect of submicron and nano ceramic particles on the mechanical, dielectric and thermal properties, and on the processability of the epoxy resin system with and without fiber as reinforcement has been investigated. In this report, the ceramic particles investigated are the Particle 1 (P1 – 700nm) supplied in powder; Particle P3 (P3 – 100nm), Particle P2 (P2 – 70nm), Particle P4 (P4 – 45nm) and Particle P5 (P5 – 15/30nm) all supplied in masterbatches. Another important goal is to examine the affect of nano composites material on the interface and delamination on E-glass reinforced epoxy. The last goal is to develop a new breakdown strength measurement method in order to characterize fiber reinforced nanocomposites plates in a SF6 gas chamber.
Figure 1 : Hollow composite insulators
7
2. STATE OF THE ART
2.1. Epoxy resin
What is an epoxy Resin
Epoxy resin comes from a thermoset reaction between a resin and a hardener (amine or acid anhydride). The first plastic produced from epoxy family was synthesized from bisphenol A and Epichlorohydrin in the late 1930’s by Dr Pierre Castan in Switzerland and Dr S.O. Greenlee in the United States. The main aspect of these materials is the terminal epoxide groups (2).
2.1.1. Epoxy Resin
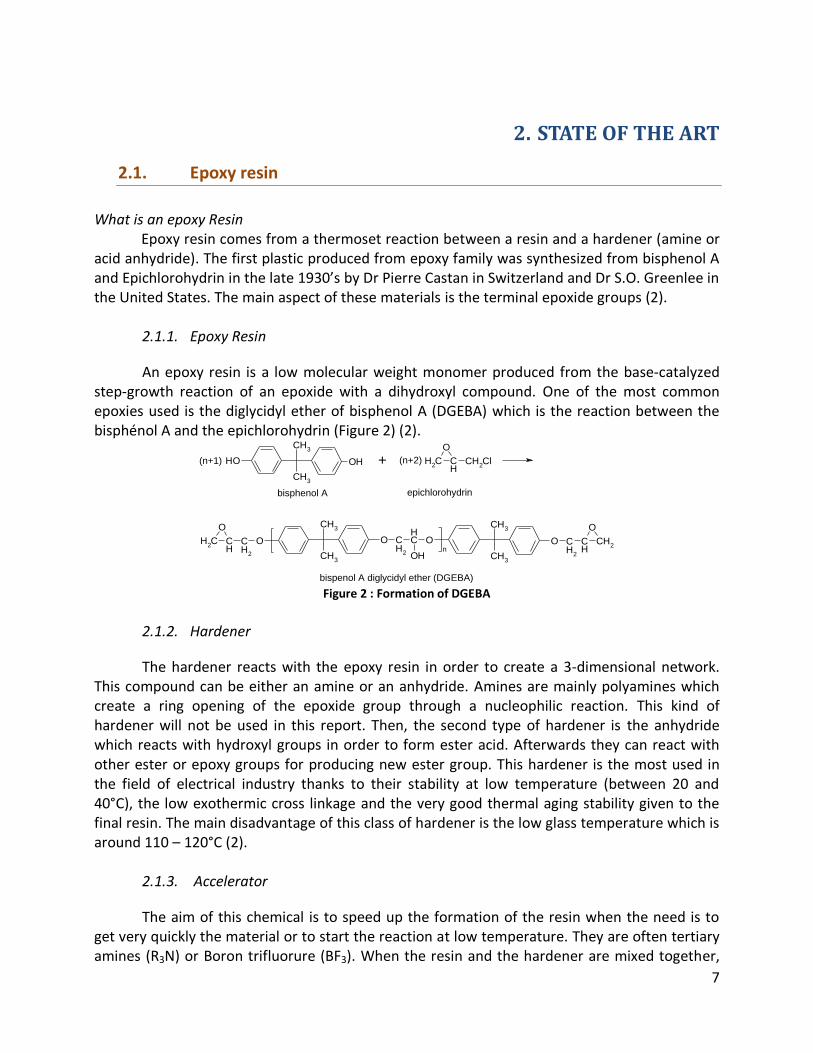
An epoxy resin is a low molecular weight monomer produced from the base-catalyzed step-growth reaction of an epoxide with a dihydroxyl compound. One of the most common epoxies used is the diglycidyl ether of bisphenol A (DGEBA) which is the reaction between the bisphénol A and the epichlorohydrin (Figure 2) (2).
CH3
CH3
O O CH
2
CH2
CH
O
CH
CH3
CH3
OCH
2
CH2
CH
O
O CH
2 OHn
CH3
CH3
OHOH CH2
CH
O
CH2Cl(n+1) + (n+2)
bisphenol A epichlorohydrin
bispenol A diglycidyl ether (DGEBA) Figure 2 : Formation of DGEBA
2.1.2. Hardener
The hardener reacts with the epoxy resin in order to create a 3-dimensional network. This compound can be either an amine or an anhydride. Amines are mainly polyamines which create a ring opening of the epoxide group through a nucleophilic reaction. This kind of hardener will not be used in this report. Then, the second type of hardener is the anhydride which reacts with hydroxyl groups in order to form ester acid. Afterwards they can react with other ester or epoxy groups for producing new ester group. This hardener is the most used in the field of electrical industry thanks to their stability at low temperature (between 20 and 40°C), the low exothermic cross linkage and the very good thermal aging stability given to the final resin. The main disadvantage of this class of hardener is the low glass temperature which is around 110 – 120°C (2).
2.1.3. Accelerator
The aim of this chemical is to speed up the formation of the resin when the need is to get very quickly the material or to start the reaction at low temperature. They are often tertiary amines (R3N) or Boron trifluorure (BF3). When the resin and the hardener are mixed together,

8
the amine group from the hardener reacts with the epoxy group from the resin in order to form a covalent bond. Some other components can be added in the formulation like flexibilizators (2).
2.2. Insulators
An insulator is a electrical component designed to maintain or support an electrical
conductor. Insulators are mainly found on power lines and power plants where the concentration of current is the highest. In power lines carrying the electricity, they isolate the electric current between the pylon and the conductive wires.
2.2.1. Materials and shape
For many years in the past, the insulators have been produced in glass and then in ceramic material. Nowadays, those materials are slowly being replaced by composite polymer material.
Those are typically composed of a central rod made of glass fiber reinforced polymer and the outer shed is made of silicon rubber (Figure 3). The insulators for outdoor use are designed to maximize the length of leakage path from one end to the other. In order to achieve this, the insulator is molded into a series of concentric disk shape (Figure 3).
In the case of gas-insulated live tank circuit breaker, the insulator should wishtand decomposed SF6 gas. The glass fibers on the inner surface of the insulator are protected from the effect of SF6 decomposition products by an epoxy liner reinforced with polyester fibers.
Figure 3 : Hollow core composite Insulator - ABB Composite Insulators
commercial booklet (3)
2.2.2. Manufacturing
The FRP (Fibers reinforced plastic) tubes are produced using a winding machine. The glass fibers which have been pre-impregnated with resin are wound onto the mandrel and placed in an oven for curing (Figure 4a). The housing made from silicone is extruded, cured, bonded to the FRP tube (Figure 4b).

9
Figure 4 : a: Winding machine for the production of FRP tubes - b: extrusion of the silicon housing onto the tube
2.3. Fillers and particles
Conventional fillers in polymers are used mainly in order to reduce the final cost and to modify one or many of the properties of the material for particular applications. Indeed, often the use of such fillers will affect electrical properties such as dielectric strength and loss in a negative way. The enhancement of the mechanical properties is one of the most wanted achievement when fillers are added to the polymer matrix. The fillers are supplied in a broad number of shapes such as flakes, fibers, spherical particles. The shape of the fillers can also affect the final properties of the material. For example this property is also linked to the surface area of each particle. Some problems limit the use of fillers in the polymer industry. The viscosity of the uncured resin can be increased significantly which lead to a limitation of the content of fillers depending on the processing. The dispersion of the particles is one of the most important parameters which can affect significantly the final properties of the material. Moreover, when the fillers are added to a glass fabric reinforced polymer, the impregnation of the particle through the glass mats is also a critical parameter which can lead to a bad homogeneity and consequently lower properties for the final material. When a glass mat is used as reinforcement, the particles are sometimes filtered during impregnation.
2.3.1. Ceramic particles affect the mechanical and thermal properties
Ceramic particles are the best candidate for increasing thermal and mechanical properties especially with polymer matrix. Adding only a small amount of particles can increase the mechanical properties of an epoxy resin. Interlaminar shear strength is a matrix dominant property. When glass fabrics are used as reinforcement in an epoxy resin, the adhesion between the glass fibers and the polymer matrix is an important factor. This behavior is defined as the interlaminar shear strength. Wishman (4) reported that in glass mats reinforced epoxy resin with only 0,5wt% of silica nanoparticles (7nm), the best value for interlaminar shear was found for low fraction of glass fiber (37 vol%) and was up to 36MPa. This study revealed that as the fiber volume increase, the interlaminar shear decreases. This state is very important for our project. Moreover, Haque (5) by adding only 1% by weight of nanosilicate increase the interlaminar shear strength of a glass/epoxy clay nanocomposites of 44%. It has been reported that the use of fillers can affect in a good way the flexural strength of an epoxy resin. With the addition of only silica in the polymer matrix, the flexural strength is increased. Kornmann (6)
a.
b.

10
investigated the effect of silica nanoparticles (10wt %) on the flexural strength and modulus of a glass woven reinforced epoxy (54vol %) and these properties was improved of 27% and 6% respectively compared to the same material without nanoparticles. Many studies reported the same enhancement of mechanical properties when silica nanoparticles were added to an epoxy resin (7).
Mahrholz (7) made an epoxy resin reinforced with various content of silica particles and reported a reduction of the thermal expansion (about 30%) and an increase of the thermal conductivity (15%). The boron nitride particles (BN) exhibit a very important improvement of the thermal conductivity in epoxy resin (8). This improvement was greater than for many particles as nano alumina, diamond, nano beta-SiC, and nano amorphous Si3N4 usually used as reinforcement in epoxy resin (9). One of the explanation of this improvement with hexagonal micro boron nitride particles was due to their three dimensional structure compared to platelets (10). The morphology of fillers in epoxy resin plays an important role in the case of heat conduction. Liang (11) investigated the hexagonal Boron nitride with flakes and spherical shapes reinforced epoxy resin (DGEBA). Spherical BN particle increase the thermal conductivity twice more than the platelets.
2.3.2. Ceramic particles affect the dielectric properties
The dielectric properties are divided into several values which are the relative permittivity and the dielectric dissipation factor (tan δ). For a dielectric reinforced with particles or fibers, the increase of dielectric constants can be caused by interfacial polarization which formed electric charge at the interfaces (12). Krivda (13) measured a permittivity of 6 and a tan δ of 8.10-3 for 40vol% glass fiber reinforced epoxy. Many researchers reported that as the concentration of ceramic nanoparticles in epoxy resin increases the dielectrics properties decreases (14). This fact is critical in the case of material like insulators whom the first function is to be insulating. The challenge when particles are added to the neat resin is to increase the mechanical and thermal properties without decreasing the dielectric properties. Nowadays this state is not totally true because, it is possible to add particle and improve the dielectric properties considering the work of Zhao (15) which reported that when alumina nanoparticles are incorporated in neat epoxy, the dielectric constant was improved. The same situation has been described by Zhang (16) with BN platelet. Fothergill performed dielectric spectroscopy on epoxy nanocomposites containing various types of nano and micro fillers of TiO2, Al2O3 and ZnO. He described a real improvement of the relative permittivity of ZnO from micro to nano size. Compared to the neat resin, permittivity was lower for nanofilled epoxy and higher for microfilled epoxy. (17)
The reinforcement of epoxy resin with E-glass fabrics leads to an enhancement of the mechanical properties and thermal conductivity (1) but also to reduction of the permittivity. The thermal conductivity of E-glass is 13W.m/K (18)
2.4. Interlaminar shear
The interlaminar shear is an important property for composite composed of overlaid
layers. An interlaminar failure of laminates is the separation of two layers of a composite by
11
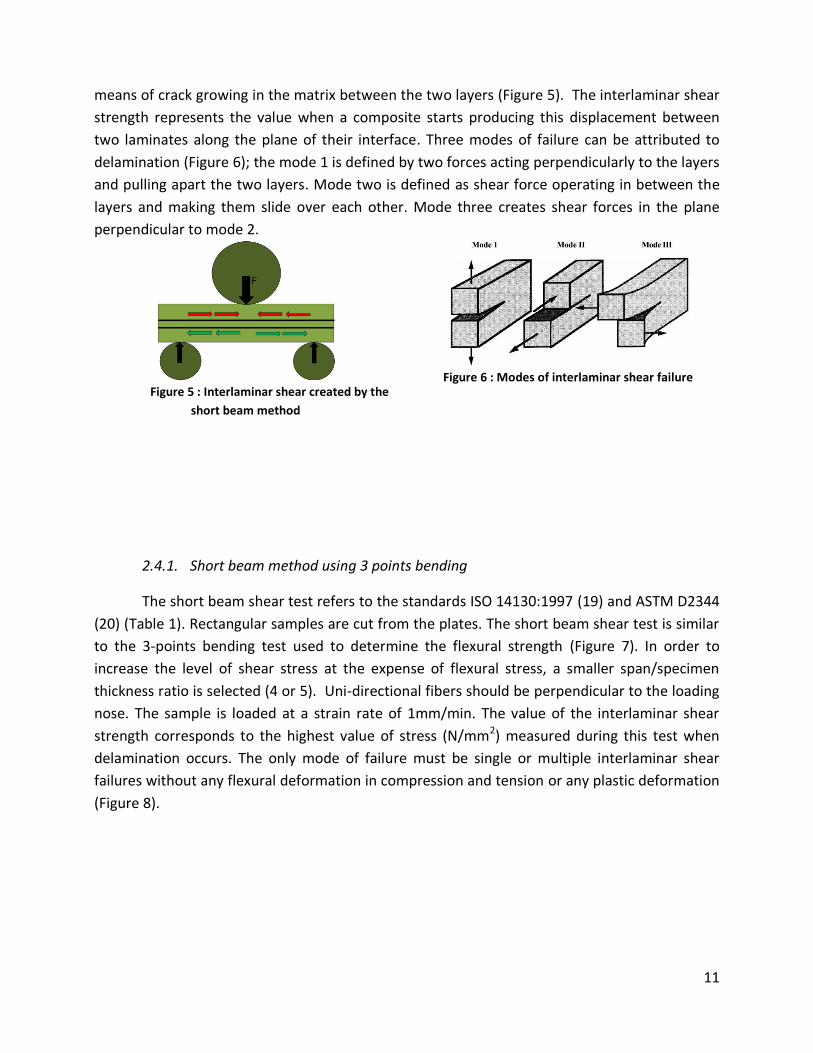
means of crack growing in the matrix between the two layers (Figure 5). The interlaminar shear
strength represents the value when a composite starts producing this displacement between
two laminates along the plane of their interface. Three modes of failure can be attributed to
delamination (Figure 6); the mode 1 is defined by two forces acting perpendicularly to the layers
and pulling apart the two layers. Mode two is defined as shear force operating in between the
layers and making them slide over each other. Mode three creates shear forces in the plane
perpendicular to mode 2.
Figure 5 : Interlaminar shear created by the
short beam method
Figure 6 : Modes of interlaminar shear failure
2.4.1. Short beam method using 3 points bending
The short beam shear test refers to the standards ISO 14130:1997 (19) and ASTM D2344
(20) (Table 1). Rectangular samples are cut from the plates. The short beam shear test is similar
to the 3-points bending test used to determine the flexural strength (Figure 7). In order to
increase the level of shear stress at the expense of flexural stress, a smaller span/specimen
thickness ratio is selected (4 or 5). Uni-directional fibers should be perpendicular to the loading
nose. The sample is loaded at a strain rate of 1mm/min. The value of the interlaminar shear
strength corresponds to the highest value of stress (N/mm2) measured during this test when
delamination occurs. The only mode of failure must be single or multiple interlaminar shear
failures without any flexural deformation in compression and tension or any plastic deformation
(Figure 8).

12
Methods presented:
Properties measured Load Standard
Short beam method
using 3-point bending
Apparent shear Compression ISO 14130:1997 (19)
ASTM D2344 (20)
±45° Tensile Test In-plane shear Tension ISO 14129
ASTM D3518
The V-Notched Beam
Method or Iosipescu
method
In-plane and
interlaminar shear
Compression ASTM D5379
Double notched
shear test (DNS)
the in-plane shear Compression ASTM D3846
V-Notched Rail Shear
test
In-plane and
interlaminar shear
Tension ASTM D 7078-05
Table 1: Setups for measuring interlaminar shear failure
Figure 7 : 3points bending - Loading configuration (19)
Figure 8 : Modes of failure (19)

13
The main asset of the short beam method is that the test setup is simple and does not
require a specially designed test fixture to grip and load the specimen. Nevertheless, the test
only provides an "apparent" shear strength using an assumed isotropic material stress
distribution that also excludes the effect of other stresses due to the flexural loading and
contact points. If one of the modes which are shown previously (Figure 8) occurs during the test,
the failure could not be considered as an interlaminar shear failure and consequently the stress
recorded will not correspond to the interlaminar shear strength. The setup has to be very
accurately set without any play and the loading nose should load at exact distance between the
two supports. The resulting data are depending on the sample geometry. This method has been
very popular for a long time for characterizing the interlaminar shear failure resistance of fiber-
reinforced composites. In the early 80”s, researchers started to wonder if this method was still
suitable for new composite materials. Using, finite element scheme, they found that the stress
distribution was not the one which was expected. Indeed, the load was mainly situated in the
upper section of the beam near the nose. This configuration yields a stress concentration which
can never be fully dissipated. (21)
In 1994, Ming Xie and Donald F, Adams showed with an analytical and an experimental
study that the interlaminar shear strength depends on the thickness of the sample in the case of
3 and 4 point bending. Indeed, with low thickness, it was possible to reach greater shear stress.
Moreover, the highest value of apparent shear stress was equidistant from the two supports
and situated at middle thickness. (22) By the way, Ashbee in his book (23) advises to use the 3-
points bending test only for thin composites of the same fiber volume fraction and only if the
mode of failure is the good one. (Figure 8)
2.4.2. ±45° Tensile Test
Another method widely used in the field of composite materials is the Tensile Test of a
±45° Laminate. This method has two standards called ISO 14129 (24) and more recently ASTM
D3518 (25). This test provides an indirect measure of the inplane shear stress-strain response in
the fiber coordinate. A strain gage is placed in the coupon. This method is suitable only with
fabric at ±45° to the specimen axis. (Figure 9) This method is popular because this is a simple
tensile test which does need any special setup. The main constraint with this method is that the
results are dependent on the number of layers or shearing interfaces in the sample. For
example it is recommended keeping the number of shearing interfaces (surfaces) constant
when the ply thickness varies. (26)

14
Figure 9 : Sample for ±45° Tensile Test - evaluation od shear stress response of unidirectional composites (27)
2.4.3. The V-Notched Beam Method or Iosipescu method
The V-Notched Beam Method or also called Iosipescu method was created in the middle
of the 80s for measuring the interlaminar shear. This method has been standardized by the
ASTM D5379 (28) in 1993. In this test, the sample is a rectangular flat strip with two V-notches
(Figure 11) at the middle upper and lower surfaces. This sample is loaded in a special fixture
(Figure 10). The notches influence the shear strain along the loading direction and make the
distribution more uniform than without notches. This method is used for measuring in-plane
and interlaminar shear properties. What makes this method so popular nowadays is because
this method gives more real interlaminar shear failure results than with the short beam method.
A special feature is needed and notches should be cut in the sample.
In 2000, Pettersson (29) evaluated experimentally with Digital Speckle Strain Mapping
and Fractographic Analysis that the shear stress depends on the orientation of the fibers and is
not homogenous and symmetric in the middle of the sample. Moreover, Hawong (30) in 2003
showed that the notch angle should be accurately made and an angle of 110° gives a better
homogeneity compared to 90° for the shear stress especially in the center of the sample.

15
Figure 10 : V-notched beam test fixture schematic
Figure 11 : V-Notched beam test coupon schematic
2.4.4. Double notched shear test (DNS)
The aim of this method is to measure the in-plane shear properties. The samples are
rectangular bars with flat-bottomed notches staggered on the two opposite sides (Figure 12).
When a tensile or a compressive force is applied a shear plane is created between the two
notches. The severe stress concentration is created between the two notches makes the stress
field inhomogeneous and consequently the results for the shear stress doubtful.
Figure 12 : Sample preparation for the double notched shear test (ASTM D3846)

16
Figure 13: Specimen and loading jig for In-plane shear test
Figure 14 : Inclined double notched shear test (IDNS).
In 1998, Neumaster and Palsson (31) improved this method using the same standard and
the same samples but with an inclined setup (Figure 14). The method is called inclined double
notched shear test (IDNS). The improvement in this method is that the appropriate combination
of loads can minimize the stress concentrations between the notches while it produces a
homogeneous state of true inter-laminar shear stress over the test region.
2.4.5. V-Notched Rail Shear test
Finally, the method mixing all the advantages of the previous methods is the V-Notched
Rail Shear test which has been standardized by ASTM (32) in 2005. The V-Notched Rail Shear
test has a relatively short history, but its use has grown rapidly. The test setup incorporates
fixtures from the existing Iosipescu and the two rail shear tests. (33)
2.4.6. Conclusion
Interlaminar shear strength is a matrix dominant property and such improvement in
interlaminar shear strength of fiber reinforced composites is mostly due to an improvement of
the epoxy properties. This enhancement can be mainly achieved due to an increase of the
interfacial area and due to good bonds between the particles and the matrix.
A lot of methods exist for measuring the interlaminar shear strength. Nevertheless,
the short beam method is still widely used because this method is easy to perform and the
setup is a normal 3-point bending for flexural strength where the span length has been
reduced in order to induce interlaminar shear failure. Moreover the sample is a normal

17
rectangular sample. In some recent scientific papers, researchers characterized the
interlaminar shear strength with the short beam method like Manfredi (34) studying in
2008, the addition of montmorionite in a glass fabrics/epoxy composite. In that case, shear
strength was about 50MPa. Wishman (35) was successfully measuring the interlaminar
shear failure of epoxy/fumed silica (7nm) with 37 and 50vol% of glass fabric using the same
setup and the same standard.
2.5. Electrical breakdown
An electrical breakdown is a severe loss of the insulating properties of an electrical insulator.
Electrical breakdown happens at a high voltage when the material changes its behavior from
insulating material to conductive material. This can lead to a spark going around or through the
insulator. This breakdown is very dangerous because it means that the insulator will lose its
main function and let the electrical discharge passing through the material.
Nowadays, the new performance materials allow industrials to reduce the dimension of the
insulating equipment while the heat density and the electrical current increase. The different
types of breakdown are the electrical breakdown, the thermal breakdown and the
electromechanical breakdown. The electrical breakdown occurs because the electric current
starts to be unstable in the dielectric material or the electrical field reaches inadmissible
proportion. The thermal breakdown is coming from the heating of the material by joule effect
when an electric field is applied which can also produce relaxation phenomena. The increase of
temperature can lead to the destruction of the dielectric. Finally, the electromechanical
breakdown is coming because the material is subjected from electrical and mechanical stresses.
For example, the attraction between the two electrodes can reduce the thickness of the sample
by pressing it. It will follow a reduction of the dielectric strength.
The partial discharges are produced from local enhancements of the electrical field due to
particles, local gaseous cavities, impurities in the material. Generally, three types of partial
discharges can be encountered; internal discharges like those in electrical treeing, surface
discharges and corona discharges. When the voltage reaches the value of the electrical
breakdown of the gas (Pashen minimum), non-desirable reactions can appear like destruction of
molecules, creation of radicals, local heating… Those phenomena will lead to the creation of
prior path for the electrical current. The evolution of the electrical current in the material can be
branched like a tree because of all those reactions. Knowing those facts, the material must be as
perfect as possible, it means, free of gas-bubbles, cavities and impurities in order to obtain the
best dielectrical properties. Surface discharges occur at the surface between two different
medium with a different permittivity. Corona discharges are mainly coming from sharp metallic
point in an electric field mostly in the high-voltage electrode. Partial discharges are a good
indicator of the potential insulation failure of a material. It is possible to measure and localize
18
those partial discharges without damaging the material if the electric field is short in time and
not too high.
At ABB corporate research center, for testing the electrical breakdown of a reinforced epoxy
resin, two aluminum electrodes are embedded into the resin with a gap between the two
electrodes. This mold is suitable only for measuring the breakdown strength of resin without
glass fabrics. This setup is then tested inside a hermetic chamber filled with SF6 gas. Another
setup has been developed for testing a plate of glass mats reinforced epoxy. The plate is put
between two electrodes dipped into silicon oil in order to insure a good insulation of the
exterior medium and avoid flashovers. The problem with this method is that the silicon oil has
to be changed after every test which makes this test polluting. One of the aims of this project is
to develop a setup able to test a plate of glass fabric reinforced epoxy resin in a SF6 chamber.
Imai (36) studied the impact of silica nanoparticles over the electrical breakdown strength in
epoxy resin. This value was about 26% greater than the neat epoxy (at 50Hz with a rising speed
of 0,6kV).
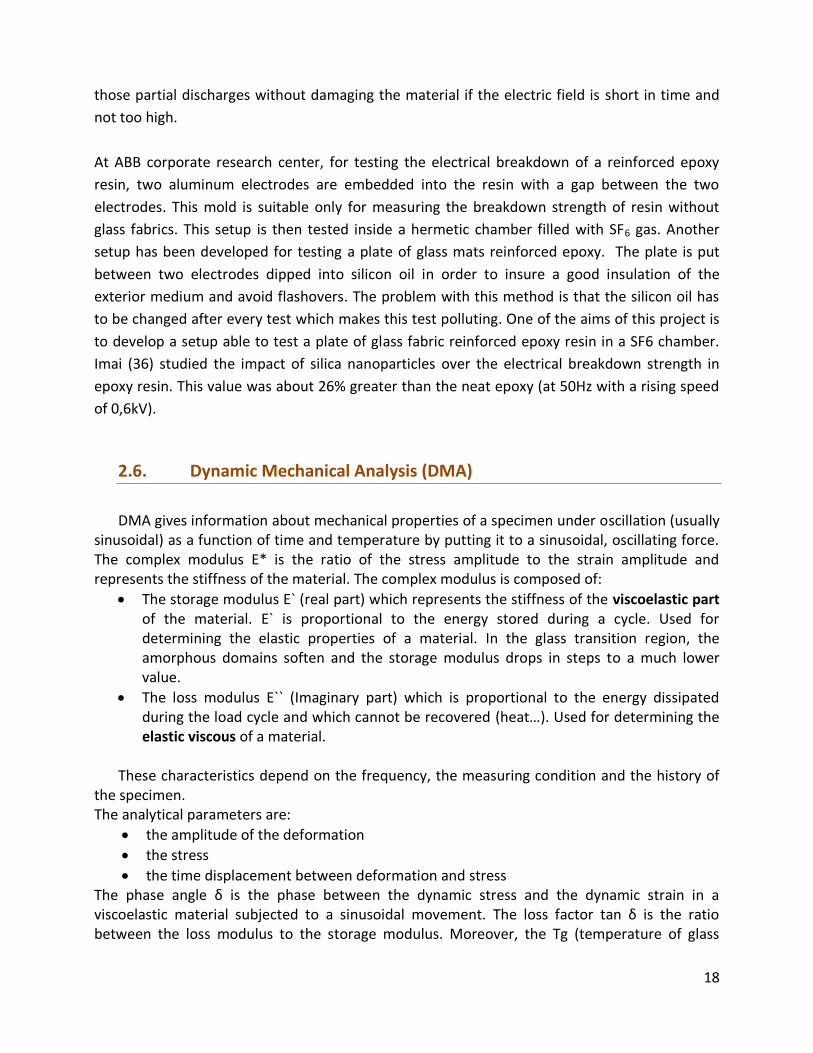
2.6. Dynamic Mechanical Analysis (DMA)
DMA gives information about mechanical properties of a specimen under oscillation (usually sinusoidal) as a function of time and temperature by putting it to a sinusoidal, oscillating force. The complex modulus E* is the ratio of the stress amplitude to the strain amplitude and represents the stiffness of the material. The complex modulus is composed of:
The storage modulus E` (real part) which represents the stiffness of the viscoelastic part of the material. E` is proportional to the energy stored during a cycle. Used for determining the elastic properties of a material. In the glass transition region, the amorphous domains soften and the storage modulus drops in steps to a much lower value.
The loss modulus E`` (Imaginary part) which is proportional to the energy dissipated during the load cycle and which cannot be recovered (heat…). Used for determining the elastic viscous of a material.
These characteristics depend on the frequency, the measuring condition and the history of
the specimen. The analytical parameters are:
the amplitude of the deformation
the stress
the time displacement between deformation and stress The phase angle δ is the phase between the dynamic stress and the dynamic strain in a viscoelastic material subjected to a sinusoidal movement. The loss factor tan δ is the ratio between the loss modulus to the storage modulus. Moreover, the Tg (temperature of glass
19
transition) of a material can be easily determined and is quite reproducible. This value represents the temperature when the loss modulus is at the maximum (Spectrum 1)
DMA is an equipment which can provide a rapid and convenient testing system for the determination of thermal mechanical properties of polymer or laminates as a function of the temperature, the time, the frequency using only a small amount of material. This fact is different for the mechanical properties which can vary depending on a lot of parameters. Some of them are the type loading and support clamps (3-point bending, single and dual cantilever), the machine (instrument design, machine compliance), the specimen alignment and the contact stresses. Knowing this fact, elastic moduli calculated with DMA, are often used only for screening material properties for quality control, research and development. Deng (37) compared the value of moduli from nanosilica reinforced epoxy obtained with DMA with different kind of loadings and supports and with a normal mechanical testing machine. His study showed that those methods were given similar results for the storage modulus but with a vertical shifting especially for the 3-points bending.
Spectrum 1 : Graph representing, the storage modulus (blue curve), the loss modulus (red curve) and the tan
delta (black curve) – nanocomposite reinforced epoxy
3. MATERIALS
3.1. CY225/HY925: Reference
In this project, the epoxy resin used as a reference is the ARALDIT CY225 based on
bisphenol-A with epichlorohydrin (DGEBA) and the hardener is ARALDIT HY925, an anhydride
based on a preaccelerated methyltetrahydrophthalic anhydre (MTHPA) both supplied by
Tg
Storage modulus
Loss modulus
Tan delta
20
Huntsman, Switzerland. With this couple, the blend is degassed and preheated at 65°C for
impregnation, and cured for 8 hours at 140°C. The main assets of this epoxy resin are a high
glass transition temperature which gives high mechanical and electrical properties at elevated
temperature, a good thermal shock resistance and excellent toughness. The main applications
of this epoxy resin are not only indoor electrical insulators for medium and high voltage, such as
switch and apparatus component but also the encapsulation of metals parts and for all the
application with a long term stresses up to service temperature of 85°C (38).
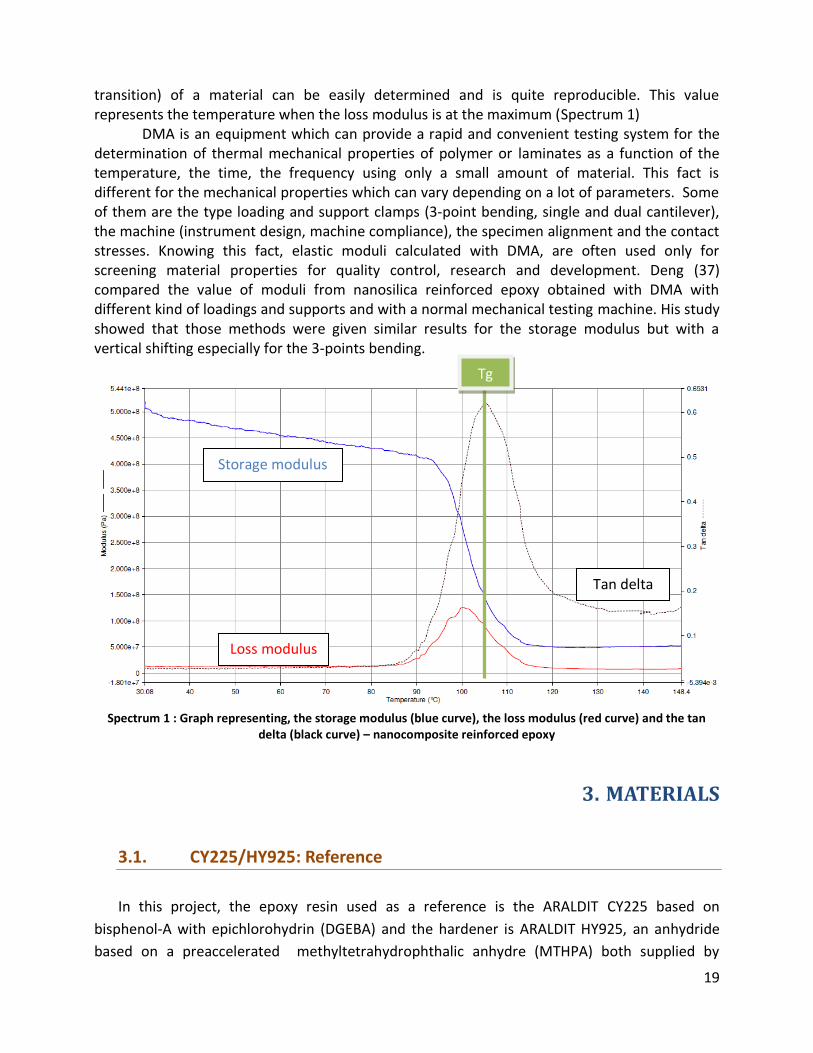
Component Trade name
Supplier Chemical name
Parts per hundred
resin (phr)
EEW (Epoxy
equivalent weight) (g/mol)
Resin Araldite®
CY 225 Huntsman, Switzerland
bisphenol-A with epichlorohydrin (DGEBA)
100 192
Hardener HY 925 Huntsman, Switzerland
Preaccelerated methyltetrahydrophthalic
anhydre (MTHPA) (M:166g/mol)
80
Table 2 : System used as a reference and for masterbatch dilution
3.2. Particles
Ceramic particles are evaluated for the improvement of thermal conductivity of glass
reinforced epoxy.
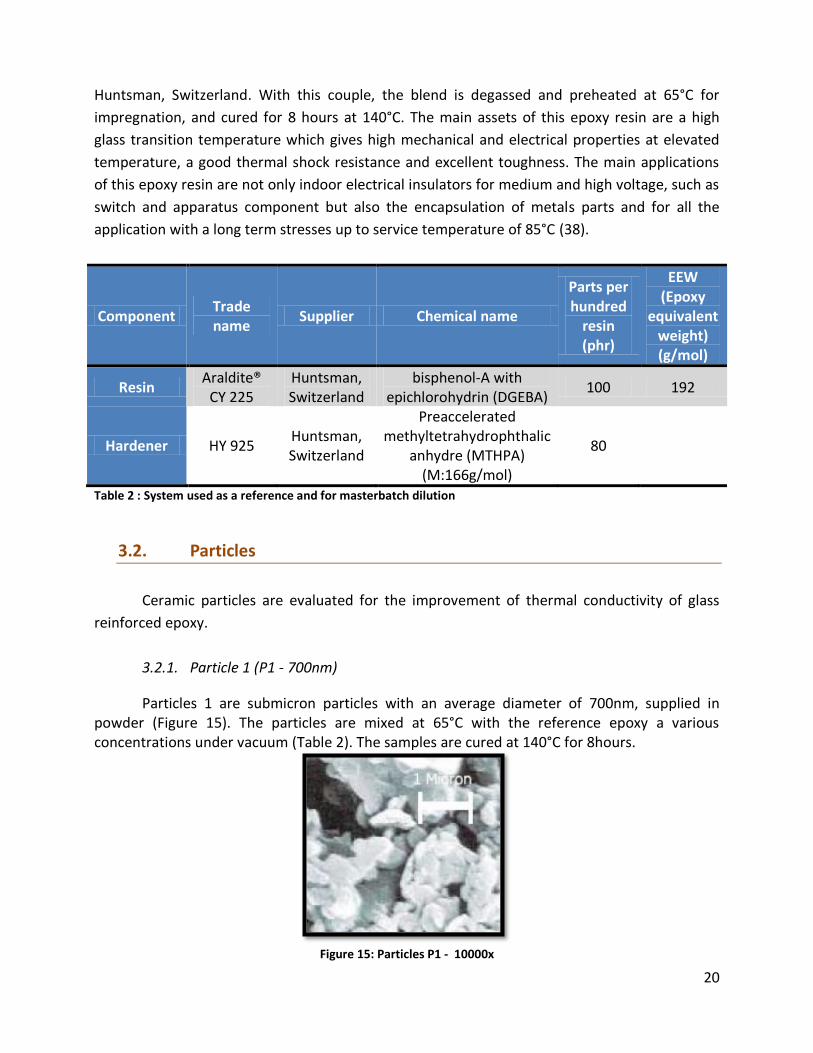
3.2.1. Particle 1 (P1 - 700nm)
Particles 1 are submicron particles with an average diameter of 700nm, supplied in powder (Figure 15). The particles are mixed at 65°C with the reference epoxy a various concentrations under vacuum (Table 2). The samples are cured at 140°C for 8hours.
Figure 15: Particles P1 - 10000x

21
3.2.2. Particle 2 (P2 - 70nm)
Particles 2 have an average diameter of 70nm are supplied in a masterbatch with 40wt% of particles is dispersed in EPON 828 (Table 3). The masterbatch is diluted with the reference epoxy (Table 2); it is mixed at 65° at various concentrations under vacuum. The samples are cured at 140°C for 8hours.
Component Trade
name Supplier Chemical name
Parts per
hundred
resin
(phr)
EEW
(Epoxy
equivalent
weight)
(g/mol)
Resin
(Masterbatch)
EPON®
828
Shell
Chemicals
bisphenol-A with
epichlorohydrin (DGEBA) 100 185 – 192
Hardener HY 925 Huntsman,
Switzerland
preaccelerated
methyltetrahydrophthalic
anhydre (MTHPA)
81,6
Table 3 : System for masterbatches Nanosperse, LLC, USA containing 40wt% of P2 particles (70nm) or P5
3.2.3. Particle 3 (P3 – 100nm)
P3 particles with an average diameter of 100nm in modified bisphenol A is supplied in a masterbatch. The 49,8wt% masterbatch is cured with 81,3 phr HY925 (Table 4). The resin is mixed at 65°C under vacuum and cured at 140°C for 8hours.
Component Trade name
Supplier Chemical name
Parts per hundred
resin (phr)
EEW (Epoxy
equivalent weight) (g/mol)
Resin (Masterbatch)
(trade secret)
bisphenol-A based
modified epoxy resin 100 189
Hardener HY 925 Huntsman, Switzerland
preaccelerated methyltetrahydrophthalic
anhydre (MTHPA) 81,3
Table 4 : System for masterbatch containing 40wt% of P3 particles (100nm)
3.2.4. Particle 4 (P4 – 45nm)
P4 particles with an average diameter of 45nm are supplied in a masterbatch with 22,5wt% of particles dispersed in ARALDIT F (Huntsman, Switzerland), cured for 6 hours at 80°C and 10 hours at 130°C. The blend is preheated at 60°C. (Table 5)

22
Component Trade name
Supplier Chemical name
Parts per hundred
resin (phr)
EEW (Epoxy equivalent weight) (g/mol)
Resin ARALDIT® F Huntsman, Switzerland
bisphenol-A with epichlorohydrin (DGEBA)
100 187 – 192
Hardener HY 905 Huntsman, Switzerland
1,2-Cyclohexanedicarboxylic
Anhydride (M: 154,17g/mol)
100
Accelerator DY 062 Huntsman, Switzerland
Tertiary amine 0,8
Table 5 : System with masterbatch containing 22,5wt% of P4 particles (45nm)
3.2.5. Particle 5 (P5 – 15/30nm)
P5 particles with an average diameter of 15 to 30nm (Figure 16) are supplied in a masterbatch with 40wt% of particles dispersed in EPON 828 (Table 3). The masterbatch is diluted with the reference epoxy; it is mixed at 65° at various concentrations under vacuum. The samples are cured at 140°C for 8hours.
Figure 16: Particles P5 (15 - 30 nm)
3.3. Glass fabric
3.3.1. Glass fabric
For reinforcement, two types of glass fabrics supplied in rolls by Swisscomposites,
Switzerland have been selected in this project (Table 6).
23
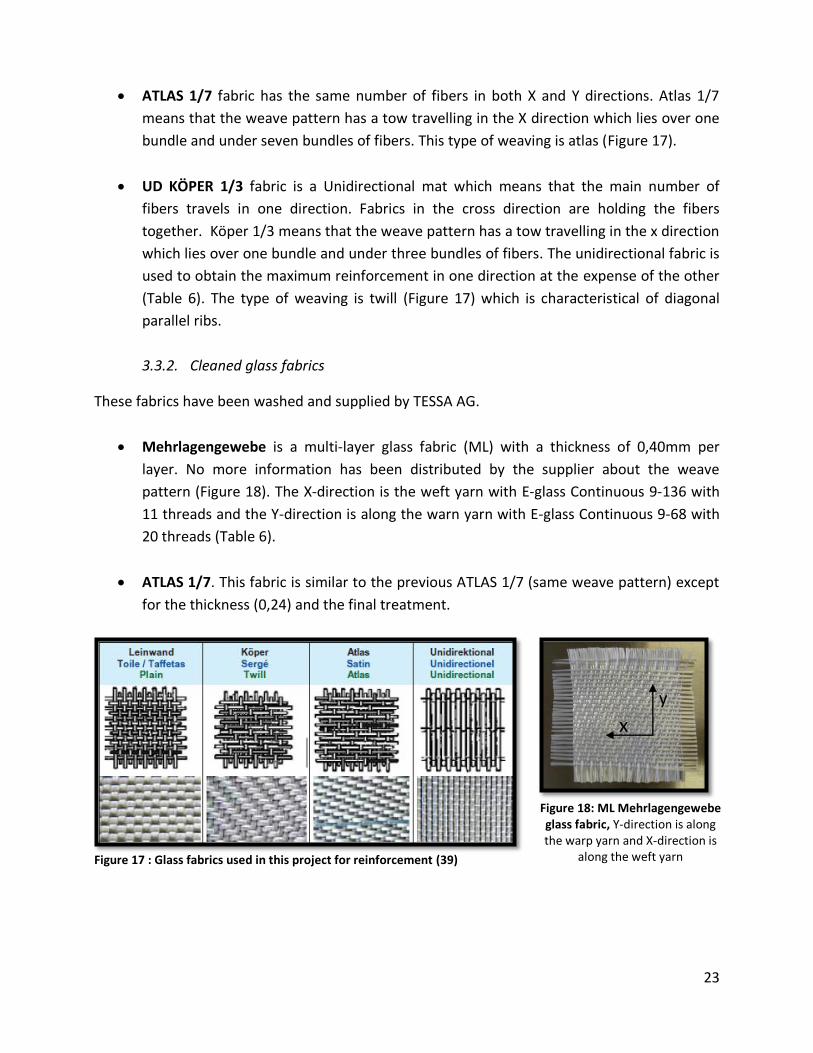
ATLAS 1/7 fabric has the same number of fibers in both X and Y directions. Atlas 1/7
means that the weave pattern has a tow travelling in the X direction which lies over one
bundle and under seven bundles of fibers. This type of weaving is atlas (Figure 17).
UD KÖPER 1/3 fabric is a Unidirectional mat which means that the main number of
fibers travels in one direction. Fabrics in the cross direction are holding the fibers
together. Köper 1/3 means that the weave pattern has a tow travelling in the x direction
which lies over one bundle and under three bundles of fibers. The unidirectional fabric is
used to obtain the maximum reinforcement in one direction at the expense of the other
(Table 6). The type of weaving is twill (Figure 17) which is characteristical of diagonal
parallel ribs.
3.3.2. Cleaned glass fabrics
These fabrics have been washed and supplied by TESSA AG.
Mehrlagengewebe is a multi-layer glass fabric (ML) with a thickness of 0,40mm per
layer. No more information has been distributed by the supplier about the weave
pattern (Figure 18). The X-direction is the weft yarn with E-glass Continuous 9-136 with
11 threads and the Y-direction is along the warn yarn with E-glass Continuous 9-68 with
20 threads (Table 6).
ATLAS 1/7. This fabric is similar to the previous ATLAS 1/7 (same weave pattern) except
for the thickness (0,24) and the final treatment.
Figure 17 : Glass fabrics used in this project for reinforcement (39)
Figure 18: ML Mehrlagengewebe glass fabric, Y-direction is along the warp yarn and X-direction is
along the weft yarn
x
y

24
Weave Pattern Warp Yarn / Weft Yarn
Tread count Warp/weft
(thread/cm)
Thickness (mm)
Weight (g/m²)
Supplier
ATLAS 1/7 EC 9-34X2/EC 9-34X2
22/21 0,40 300 Suter Swiss composite
UD-KÖPER 1/3 EC 9-136/ EC 7-22
19/12 0,28 286 Suter Swiss composite
ATLAS 1/7 (cleaned)
EC 9-68/EC 9-68
22,9/21,1 0.24 300 Tessa AG
Mehrlagengewebe ML (cleaned)
EC 9-68/ EC 9-136
20/11,75 0.38 300 Tessa AG
Table 6 : Glass fabrics used as reinforcement
Example: Atlas 1/7 – EC 9-34X2/EC 9-34X2 E = E-Glass C = Fiber of infinite filaments (Continuous) 9 = Diameter of the filaments (µm) 34 = tex (number of filaments) The warp is the lengthwise threads attached to the loom before weaving. Then the weft is woven back and forth through the warp to make the fabric.
3.4. Room temperature curing epoxy resin (RT epoxy)
RT epoxy (Table 7) is used for filling bored holes in the electrical breakdown test sample.
The curing is approximately 24h at room temperature and the gel time is 60min at 25°C. The
main properties of this RT epoxy are a good heat resistance, a resistance to chemical
degradation, a low viscosity and a curing at room temperature. The main industrial applications
are the encapsulation or potting of low voltage components.
Component Trade name
Supplier Chemical name
Parts per hundred
resin (phr)
EEW (Epoxy
equivalent weight) (g/mol)
Resin Araldite
DBF Huntsman, Switzerland
Epoxy resin modified by the addition of a
plasticizer 100 235
hardener HY 956 EN Huntsman, Switzerland
Polyamine 20
Table 7 : Room temperature curing epoxy resin (based on Araldite DBF)
.

25
4. EXPERIMENTAL: PROCESSING AND CHARACTERIZATION
4.1. Processing
4.1.1. Casting of plates
Casting is used to produce plates of neat or filled epoxy; a mold of polished plates
covered with release agent (QZ 013, Huntsman, Switzerland) is assembled and preheated at
65°C. The resin system is prepared and mixed under vacuum (7 mbars); the mixture is poured
into the mold. The resin is degassed at 65°C once more in the mold and cured according to the
prescribed schedule.
4.1.2. Impregnation of laminates
RTM (Resin transfer molding) and VARTM (Vacuum assisted resin transfer molding) are
processes used to produce impregnated fabric composite. Pressure is used to force resin into
the mold by RTM while the mold is filled with vacuum in VARTM.
The RTM/VARTM setup is composed of a vacuum trap, a pressure tank, plastic tubing, a vacuum
pump and a source of pressurized air (Figure 19). The flow rate is measured with a scale (flow
rate between 50 and 120g/min) and controlled with clamps. The mold is cleaned, polished and
coated with release agent (QZ 013, Huntsman, Switzerland) and the precut E-glass fabrics are
placed inside (Figure 20); rubber seals are used. The completed mold and pressure tank are
preheated at 65°C. The resin is prepared as described previously.
In RTM, the resin is injected with pressurized air approximately 0.5 bars depending on the blend
with a flow rate of 50g/min. This process is used with a mold of dimensions 20 x 21cm. The mold
is filled, vacuum is applied slowly to 1 mbars in approximately 5 min and held for at least 5 min)
to remove the air bubbles. An overpressure of 5 bars is applied and held for 3-4 min to improve
the impregnation of the resins through the fabrics. The inlet and outlet tubes are clamped and
the mold is put in an oven for curing.
In VARTM, the resin is injected by applying vacuum slowly. A valve is connected between the
pressure vessel and the mold to regulate the flow of resin. This process is used with a mold of
dimensions 40 x 43cm. Vacuum is applied only to the mold in order to remove air from the mold
and the fabrics to 1 mbars in 10-15 min and it is held for 5-10 min. Then, the valve is opened
and resin is allowed to flow from the pressure vessel to the mold at a rate of 40 – 150g/min. The
mold is filled, the valve is closed and vacuum is still applied in order to remove the remaining air
bubbles for 5 to 15min. An overpressure of 3 to 5 bars is applied and held for 3-4 min to
improve the impregnation of the resins through the fabrics. The inlet and outlet tubes are
clamped and the mold is put in an oven for curing.

26
Figure 19 : Mold for preparing laminates of glass fabrics reinforced epoxy resin (on the left: top of
the mold with the glass fabrics, on the right: bottom of the mold)
Figure 20 : Setup for impregnation of a laminate 30x44cm a:Air
pressurized tube, b:Pressure tank containing the blend, c: valves, d: mold, e: vacuum trap, f: inlet for vacuum
4.1.3. Wet lay
Resin is applied over glass fabrics of 21x20cm dimension layer by layer by hand (Figure
21a). The resin is prepared as described previously. The resin is spread over the fabric with a
spatula. Air bubbles are removed with the spatula. Once the fabrics are impregnated, the plate
is put into a press with a pressure at 20 Bars and an initial temperature of 70°C for 15 min and
then cured at 140°C for 8 hours (Figure 21b). The thickness of the plate is controlled with
spacers. Plates of 60vol% of fibers are prepared by this method.
Figure 21 : a: impregnation of the fabrics with a spatula, b: hydraulic press for making wet lay plates
a
.
b
c1
c2
d e f
a.
b.

27
4.1.4. Electrical strength samples
A two half mold is used to prepare samples of laminates for breakdown strength
measurements in SF6 gas. The mold is covered with released agent and a 120x120x4mm cast or laminate test plate is placed between the two halves (Figure 22). After assembly, the mold and the plate are preheated at 65°C and resin is injected by VARTM. The sample is ground, voids are filled with epoxy and the surfaces are painted with silver (Figure 23).
Figure 22 : Mold for injection of sample for electrical breakdown
tests
Figure 23 : Sample for electrical
breakdown test with the protective walls and painted with silver
4.2. Characterization
4.2.1. Viscosity
Viscosity measurements are made with a C-VOR rehometer from Bohlin instruments. The viscosity is measured with two parallel plates (40 mm diameter) with a gap distance of 500 µm and a constant shear rate of 10 s-1. over a temperature range of 30 to 90°C with a heating rate of 3°C/min.
4.2.2. Reaction enthalpy and glass transition temperature, Tg
The reaction enthalpy of uncured samples is measured with a Perkin Elmer DSC 7. 8 to 10 mg are placed in an aluminum pan and heated from 30°C to 275°C with a heating rate of 10°C/min; the enthalpy is determined. The Tg of cured samples is measured with Perkin Elmer DSC 1. 15 to 35 mg are placed in an aluminum pan and heated twice from 30 to 200°C with a heating rate of 10°C/min; the Tg is determined from the second heat scan. A baseline is subtracted from all measurements.

28
4.2.3. Degradation temperature, Td and the residue weight
Td and the residue content are measured with a Q500 TGA (Thermal Gravimetric Analysis) from TA instruments. The samples are heated from 30°C to 800°C with a heating rate of 10°C/min. The Td is taken at a weight loss of 1wt% and 5wt%. The weight of particles in a sample is calculated from the residue weight at 800°C.
4.2.4. Thermal conductivity λ
Circular samples of diameter 50,8mm and a thickness of 4mm are measured with an Anter Unitherm Model 2022 according to ASTM E1530 test method. The thermal conductivity is measured at 40°C, 60°C, 80°C and 100°C.
4.2.5. Microscopy
Samples are observed by optical microscopy (OM) with a Karl Zeiss microscope and by scanning electron microscopy (SEM) with a VEGA XMU from Tescan USA Inc. Samples are embedded into an epoxy resin, ground, polished and coated by sputtering with either 5nm of gold or carbon for SEM.
4.2.6. Storage and loss modulus
The storage modulus, loss modulus and tangent are measured using a Perkin Elmer TMA7/DMA7e. The moduli and tangent are measured for matrix materials only. The sample dimensions are 19mm x 10mm x 1mm. The measurements are performed with a heating rate of 5°C/min, with a forced oscillation frequency of 1Hz and a static and dynamic force of 110mN and 100mN, respectively. Figure 24 shows the 3-points bending setup where the sample is kept free at the 3 points.
Figure 24 : Storage and loss modulus measurements, for 3-points bending
4.2.7. Thermal expansion coefficient α (CTE)
The thermal expansion coefficient is measured using a Perkin Elmer TMA7/DMA7e. In TMA mode, matrix and laminate samples with dimensions of the 6mm x 6mm x 4mm are
29
measured with a heating rate of 2°C/min from -10 to 160°C, a static force of 100mN and dynamic force of 110mN. The coefficient of thermal expansion is measured during the second heating cycle.
4.2.8. Relative permittivity and dissipation loss factor
The relative permittivity εr and the dielectric tangent factor tangent δ are measured from 1 to 106 Hz at 40°C, 60°C, 80°C, 100°C, 120°C and 140°C using a novocontrol according to CEI IEC 250. Samples dimensions are 38mm x 38mm with thickness 1 mm for the matrix and 4 mm for laminates. The samples are placed between two gold electrodes of 20mm diameter under a voltage of 5V. The plates are washed and held in a dessicator for 24 hours before measuring.
4.2.9. Fiber volume percent
The fiber volume percent is calculated according to the standard ASTM D2584-02, samples of 25mm x 25mm x 4mm are weighted with a micro-scale (METLER AE240). The square samples are burned in an oven up to 600°C with a heating rate of 10°C/min and held at for 4 hours. The residue is weighted and the fiber volume percent is calculated.
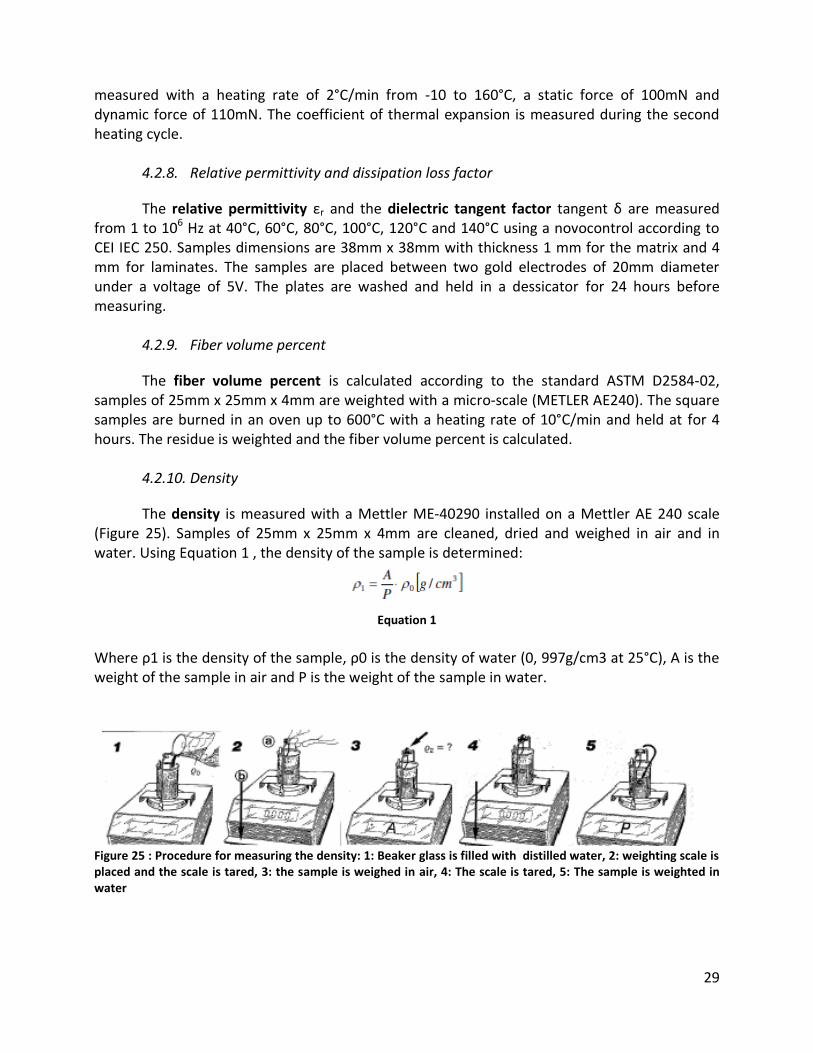
4.2.10. Density
The density is measured with a Mettler ME-40290 installed on a Mettler AE 240 scale (Figure 25). Samples of 25mm x 25mm x 4mm are cleaned, dried and weighed in air and in water. Using Equation 1 , the density of the sample is determined:
Equation 1
Where ρ1 is the density of the sample, ρ0 is the density of water (0, 997g/cm3 at 25°C), A is the weight of the sample in air and P is the weight of the sample in water.
Figure 25 : Procedure for measuring the density: 1: Beaker glass is filled with distilled water, 2: weighting scale is placed and the scale is tared, 3: the sample is weighed in air, 4: The scale is tared, 5: The sample is weighted in water

30
4.2.11. Flexural and interlaminar shear strength
Flexural properties and interlaminar shear strength are measured with a Zwick Roell 100 and a 3-points bending setup (Figure 26) according to the standard ISO 14125, and ISO 14130 and ASTM D2344, respectively. Flexural samples of the matrix have dimensions of 80x10x4mm and are measured with a strain rate of 1,7mm/min. Flexural samples of the laminates have dimensions of 80x15x4mm and are measured with a strain rate of 1,7mm/min (Table 8). Flexural measurements are performed with a load cell of 5kN maximum and calculated using the equation 2. Interlaminar shear strength is measured by two standards; the parameters are described in Table 9 and Figure 26. Shear measurements are performed with a load cell of 100kN at a strain rate of 1mm/min and calculated using the equation 3. All measurements are performed at room temperature.
Test Standard Dimensions (Length x Width x thickness)
Span (mm)
Loading members Radius (r1 and r2)
Speed (mm/min)
Flexural Properties
ISO 14125 80 x 10 x 4 (Matrix)
64 5mm 1,7
80 x 15 x 4 (Reinforced with 30vol% E-Glass)
64 5mm 1,7
Table 8 : Parameters used for flexural properties measurements
Test Standard Dimensions (Length x Width x thickness)
Span (mm)
Loading members Radius (r1 and r2)
Speed (mm/min)
Interlaminar shear strenght
ISO 14130 18 x 6 x 3 15 5mm and 2mm 1
Interlaminar shear strenght
ASTM D2344 30 x 15 x 3 12 6mm and 3mm 1
Table 9 : Parameters used for interlaminar shear measurements
Figure 26 : Schema of the setup for measuring flexural strenght and interlaminar shear strenght (Source:
Standard Iso 14130) – h:thickness of the sample, R1: radius of the loading member, R2: Radius of the support members, L: Span (length between the two supports).

31
Flexural strength in MPa according to the standard ISO 14125
F is the load (N), L is the span (mm), h us the thickness of the specimen (mm) and b is the
width of the specimen (mm)
Apparent interlaminar shear strength in MPa According to the standard ISO 14130 and
ASTM D2344 F is the maximum load observed (N), h us the thickness of the specimen (mm)
and b is the width of the specimen (mm)
4.2.12. Partial Discharges (PD)
The partial discharge measurements were carried out using a PD instruments from Lemke Diagnostic, Germany. The standard used for these tests is IEC 60270 (40). The sample should be free of partial discharges at 20kV. Germany. Before every measurement of electrical breakdown strength, the sample is placed between two electrodes and the number of partial discharges is measured in pC (Pico-coulomb) at a certain voltage (in kV) to know if a sample is suitable or not for further electrical measurements (Figure 27).
Figure 27 : Setup for Partial discharges measurements (PD)
4.2.13. Electrical breakdown strength
The electrical strength is measured in a sealed chamber filled with 5 bars of SF6 according to IEC 60243-1 (Figure 28 ). In a preliminary setup a plate with dimensions 120mm x 120mm x 1mm is placed between two spherical electrodes with a diameter of 38mm (Figure 29a). In a second setup (Figure 29a), a plate with a thickness of 4mm prepared as described in a previous section is used (section page 25, Figure 23). The voltage is increased stepwise by 1V every 60 seconds with both test setups. The breakdown strength is determined from the peak to peak distance divided by square root of 2. The electrical breakdown strength represents the ultimate value of the current when the breakdown occurs.

32
Figure 28 : Chamber for electrical breakdown testing
Figure 29 : a: Preliminary setup for electrical breakdown with spherical electrodes - b: Sample with the second
setup in the GIS (Gas insulated Switchgear)
b.
a.

33
5. RESULTS AND DISCUSSIONS
5.1. REFERENCE CY225/ 80 phr HY925
CY 225 with 80 phr HY 925 is used as a reference. The resin is employed for dispersion of
particles and dilution of prepared masterbatches. This epoxy is flexible and ductile which allows
for easy handling for casting and molding. The use of a reference allows for the determination
of the impact of particles on the thermal, mechanical and dielectric properties of the resin.
Processing, thermal conductivity, electrical and flexural properties are tabulated (Table 10).
Table 10: CY225/ 80phr HY 925 reference resin system: processing, thermal, mechanical and
dielectrical properties (1)
DMA measurements are performed to obtain information about the storage modulus, the
loss modulus and the glass transition temperature; Tg. Samples with thickness of 1mm are
tested by 3 points bending measurement. DMA measurements with 3-points bending were
successfully carried out with all the materials. The appropriate tests parameters were
determined from experiment to be a static force of 110mN, a dynamic force of 100mN, a
frequency of 1Hz and a heat rate of 5°C/min. Differing results were obtained for the reference
epoxy (CY225/80phr HY925).
A spectrum is obtained using the 3points bending set-up (Spectrum 2). The storage and loss modulus, and Tg measured with 3 points bending setup for reference material is given in (Table 11) In 3points bending mode (Spectrum 2), the storage modulus at 40°C is 907MPa and the maximum of loss modulus is 227MPa at 92°C. The Tg (tan δ) is found at 99°C which is lower than the Tg measured with dual cantilever and DSC (1).
3-points bending
Storage modulus Loss modulus
Maximum loss modulus
Tg (tan δ peak)
Temperature 40°C 80°C 140°C 40°C 92°C 99°C
MPa 907 704 21 44 227
Table 11: Dynamical mechanical properties measured with dual cantilever and 3-points bending test setups of reference CY225/ 80phr HY925 (sample thickness of 1mm)
Reference ∆H
[J/g]
Td °C
99%
95%
∆H
[J/g]
Treac.
[°C]
Tg
[°C]
η
[Pa*s]
(@65°C)
λ
[W/m*K]
(40-100°C
εr
(40°C
,50H
z)
Tanδ
(40°C,
50Hz)
Ef
[N/
m2]
σf,max
[N/m²] α
10-6
/°C
CY225/
80phr
HY925
300,9 312,6
360,5
300,
9
169,
5
124,
5 0,094 0,19 3,47
2,92E-
03 3035 114,3 62,09

34
Spectrum 2 : Dynamical mechanical properties for 3points bending of a plate with a thickness of 1mm of the neat
resin - F:100mN
5.2. Laminates: E-glass fibers
Glass fibers are used to reinforce epoxy; previously, four different E-glass fabrics (9 μm
fibre diameter) were evaluated, including: Leinwand (plain weave), Köper (twill weave), Atlas
(atlas weave) and unidirectional (unidirectional weave). The flexural properties in the warp
direction and the thermal conductivity of the laminates were measured and a fiber volume of
30vol% was chosen for all the laminates. Also, it was previously observed that an impregnation
with 50vol% fiber led to filtration of resin. The atlas weave pattern (Isotropic - same number of
fabric in both directions) is selected for further experiments based on previous mechanical
results. (1).
Two types of clean glass fabrics are evaluated: an atlas 1/7 weave pattern with a
thickness 0.24mm and a multilayer (ML) weave pattern with a thickness of 0,38mm. ML fabric is
evaluated for impregnation to determine if the lack of sizing would affect the laminate. Clean
fabrics are used in all further laminate preparation: it has been shown previously that the
impurities on the fiber surface or in the weave provide a path for electrical breakdown to occur
(41). The fabrics are observed with an optical microscope ( Figure 30 and Figure 31). The clean
glass fabric shows less contamination than the unwashed material although the clean fabric has
some impurities on the surface. A difference between the fabrics is observed during the cutting;
the two clean fabrics unravel and electrostatically charge easily. Fabric rolls were stored in a
clean environment and wrapped carefully to avoid contamination in storage. The fabric is cut on
a clean table with clean tools to avoid the impurities.

35
Figure 30 :Optical micrograph of the surface
of an unwashed E-glass fabric with UD Köper
1/3 weave pattern (OM - x500)
Figure 31 : Optical micrograph of the surface
of an unwashed E-glass fabric with Atlas 1/7
weave pattern (OM - x500)
Thermal expansion is a very important parameter in the case of molding pieces and insulator. The thermal expansion coefficient describes how the size a piece changes with a change the temperature. The addition of ceramic particles and glass fabrics affect this coefficient. For making the electric breakdown samples, two solutions are possible, the walls and the plates are made from the same material or the plate is made from the material which has to be tested and the wall is made from the epoxy reference without fillers. The last case will be the more economical because it will save expensive material. In order to avoid cracks after injection, the expansion coefficients of the two materials must be quite similar. The thermal expansion in theory of E-glass is 4,9.10-6/°C (42). The thermal expansion of epoxy resin with 30vol% non-washed and clean Atlas 1/7 glass fabric is respectively 66,09 10-6/°C and 44,34 10-6/°C which is an augmentation of 6,31% and a reduction of 28,6% compared to the matrix reference (Table 12).
Reference CY225/ 80 phr HY925 Thermal Expansion coefficient
10-6/°C
Matrix 62,09
Laminate with 30vol% unwash Atlas 1/7 66,01
Laminate with 30vol% clean Atlas 1/7 44,34
Table 12: Thermal expansion coefficient of the reference epoxy resins
The dielectric dissipation of E-glass fibers is a little bit higher than the typical epoxy (43).
The dielectric permittivity of the laminates with the reference epoxy and 30vol% clean glass
fabric is measured at 50Hz, εr is 4,43 for ML cleaned fabric and 4,28 for clean Atlas 1/7 glass
fabric at 40°C (Table 13). The dielectric dissipation factor is 3,06E-3 for ML clean fabrics and at
40°C and 2,36E-3 for Atlas 1/7 clean fabric; Tan δ is measured at 50Hz. ML clean glass fabrics

36
exhibit an increase of the dielectric permittivity of approximately 3,5% and of 29,7% the
dielectric dissipation factor of compared to atlas 1/7.
The relative permittivity of a material describes the relationship between AC signal’s
transmission speed and the dielectric’s material capacitance relative to the vacuum. The
dissipation factor or loss tangent is the ratio of the energy dissipated such as heat to the energy
stored into the material. A good dielectric means that the all the signal pass through the
dielectric without being absorbed in the material. A material with a large dissipation factor
subjected to high power signals could develop an important amount of heat and even goes up in
flames.
The addition of 30vol% clean glass fabric increases the permittivity of 27,7% for ML and
of 23,3% for atlas 1/7 and the dielectric dissipation factor of 4,8% for ML but decrease the Tan
δ of 19% for atlas 1/7 at 40°C. The augmentation of permittivity comes from the addition of
30vol% glass fibers and from the new interfaces matrix/fibers in the material. The laminates
with clean ATLAS glass fabric shows an enhancement of the dissipation loss factor because the
use of clean fabric, where oil and dust have been removed, makes the interface better between
the fibers and the matrix.
30Vol% clean glass fabric
Permittivity
εr
(40°C - 50Hz)
Dielectric dissipation
factor
tan δ
(40C - 50Hz)
ML 4,43 3,06E-3
Atlas 1/7 4,28 2,36E-3
Table 13: Dielectric properties of laminates made with the reference epoxy resin (CY225/ 80phr HY925)
The flexural properties were measured for the epoxy reference with 30vol% of clean
glass fabric (ML Y-direction and Atlas 1/7). For the ML and the Atlas 1/7 glass fabrics, the
flexural strength is 451 and 450 MPa respectively and the flexural modulus is 12 and 12,57GPa.
The density was also similar with 1,60 for the epoxy with ML fabric and 1,59 for the epoxy with
atlas fabric. The flexural properties are similar for the two different kind of fabric. These results
are coherent because the atlas fabric and the ML (Y-direction) are using the same material in
that direction (EC9-68) and almost the same thread (Page 24, Figure 18 and Table 6).
30Vol% clean glass fabric Flexural strength (MPa) Flexural modulus (GPa) Density (g/cm3)
ML (Y-Direction) 451 ± 20 12 ± 0,3 1,6
Atlas 1/7 450 ± 40 12,6 ± 0,6 1,6
Table 14 : Flexural properties and density of laminates made with the reference epoxy resin (CY225/ 80phr HY925)

37
Interlaminar shear measurements are made by short beam testing according to ISO
14130 and ASTM D2344. Tests are performed with 3mm thick plates with 30vol% of UD glass
fabric. Plastic deformation was observed first which does not correspond to an interlaminar
shear failure. It has been shown in the literature that increasing the volume percent of fiber in
the laminates decreases the interlaminar shear strength and makes the failure more apparent
(21). A plate with a thickness of 3mm is prepared with 60vol% of UD glass fabric by wet lay
method. In the literature, ISO14130 and ASTM 2344 have been used to measure interlaminar
shear of nanofilled laminates; an increase in the interlaminar shear strength has been observed
with the addition of DGEBA resin.
The samples sized from the standard ISO 14130 exhibit delamination; although the
delamination does not reach the outer edges of the samples as described in the standard.
Samples prepared by ASTM D2344 show apparent delamination to the sample edges (Figure
32). The reference resin is transparent, thus delamination is easily observed. 60vol% UD
laminates exhibits a maximum strength of 588MPa ±12 as measured by ISO 14130 and 595MPa
± 15 by ASTM D2344. Similar values from both standards allow us to conclude, that the ASTM
D2344 sample from both standards have experienced delamination (Table 15).
UD Köper 1/3 Flexural strength (MPa) Shear strength (GPa)
30 Vol% - ISO 14130 548 ± 30 55,6 ± 3,0
60 Vol% - ISO 14130 588 ± 12 63,5 ± 1,2
60 Vol% - ASTM D2344 595 ± 15 64,6 ± 0,4
Table 15: Mechanical properties of the epoxy resin (Reference) with UD Köper glass fabric
Figure 32 : Samples with 60vol% UD glass fibers after testing with the short beam method - a:
ASTM2344 - b: ISO14130
10mm
a b

38
5.3. Particle P1 (700nm)
Particle 1 is an ultrafine powder with an average diameter of 700nm and a surface area of
approximately 20m²/g. Following the data sheet from the supplier, P1 particle is a good thermal
conductor and electrical insulator and exhibits a low dielectric constant/loss. In the previous
report (1), 10wt% of P1 particles mixed in the reference epoxy was found to be the highest
concentration appropriate for injection molding. This concentration will be kept for the rest of
the project.
1mm thick casted plates of 10wt% P1 particles in the reference epoxy are characterized
with 3-points bending mode by DMA. The resulting data from the spectra (Spectrum 3) are
summarized in the Table 16. In dual cantilever mode, the storage modulus at 40°C is 575MPa
and the maximum of loss modulus is 150MPa at 110°C. The Tg (tan δ) is found at 113°C which is
lower than the Tg measured with DSC (1). The storage moduli from dual cantilever and 3-points
bending increase of 20% and 16% at 40°C and 10% and 57% at 140°C respectively compared to
the reference resin. Below Tg, The particles are like physical crosslinks in the epoxy molecular
chains in the composite. Above tg, the soft rubbery nature of the matrix makes the stiffness
decrease dramatically contrary to the stiffness of P1 particles which stays constant. In the case
of a polymer matrix filled with particles will make the nanocomposite stiffer above Tg.
Spectrum 3 : Dynamical mechanical properties for 3points bending of a plate with a thickness of 1mm of the
matrix with 10wt% PARTICLE 1 (700nm) F:100mN
3-points bending
Storage modulus Loss modulus
Maximum loss modulus
Tg (tan δ peak)
Temperature 40°C 80°C 140°C 40°C 95°C 105°C
MPa 1056 940 33 50 266
Table 16 : Dynamical mechanical properties for 3points bending of a plate with a thickness of 1mm of the matrix with 10wt% of P1 particles - F:100mN

39
The dielectric permittivity of the laminates with 10wt% of P1 is measured at 50Hz, εr is
4,54 for ML cleaned fabric and 4,5 for clean Atlas 1/7 glass fabric at 40°C. The dielectric
dissipation factor is 3.23E-3 for ML clean fabrics and at 40°C and 2.82E-3 for Atlas 1/7 clean
fabric; Tan δ is measured at 50Hz. The matrix with 10wt% of PARTICLE 1 and the laminate with
30vol% of unwashed Atlas glass fabric have an expansion coefficient below Tg of 57,43.10-6/°C
and 58,26 respectively which represents an augmentation of 1,45% (Figure 33).
Figure 33 : Dielectric properties - 10wt% of P1 Particles - 30 Vol % ATLAS Clean Glass Fabrics @50Hz
The thermal expansion coefficient for the matrix with 10wt% of P1 particles is 57,43.10-
6/°C which represents a reduction of 7,5% compared to the epoxy reference. The difference of thermal expansion coefficient between the matrix with P1 particles and the laminate with unwashed atlas glass fabric (58,26.10-6/°C) is small (2%) compared to the laminate with 30vol% of atlas clean glass fabric whom the coefficient in greater of 7,3% with a value of 66,56.10-6/°C. (Table 17)
Flexural properties of laminates with P1 particles were measured with 30vol % of ML and ATLAS clean glass fabric. Flexural strength of laminates with ML (X and Y directions) and ATLAS are respectively 397MPa, 425MPa and 345MPa. Flexural modulus of laminates with ML (X and Y directions) and ATLAS are respectively 11,2GPa, 13,1GPa and 9,5GPa [Table 18].
The difference between the results of the two glass fabric is probably due the impregnation which was barely better with the ML fabric than with the atlas clean fabric. For measuring flexural properties, the samples should not show difference between both sides (top and bottom). For P1 particles, the cross section reveals a layer of matrix with P1 particles only (Figure 34). Regarding the difference between the 2 sides of the samples (Figure 34), a bunch of sample with 30vol% clean glass laminate were tested one side (Resin at the bottom) and the rest in the other side. As we can expect, the best results were found with the sample
0,E+00
2,E-02
4,E-02
6,E-02
8,E-02
1,E-01
1,E-01
0
1
2
3
4
5
6
7
40 60 80 100 120 140
tan
δ
Perm
itti
vit
y
Temperature (°C)
Dielectric properties - 10wt% P1 particles- 30 Vol % ATLAS Clean Glass Fabrics @50Hz
Permittivity εr
Dielectric dissipation factor tan δ

40
with the epoxy resin placed at the top because the maximum stresses are situated at the bottom of the sample. If the resin if situated at the bottom during the measurement, the resin will crack first and the material will exhibit a lower value of flexural strength.
P1 particles (700nm) Thermal Expansion
coefficient
10-6/°C
Density (g/cm3)
Matrix 57,43
Laminate with 30 Vol% Unwash ATLAS 1/7 fabric 58,26 1,65
Laminate with 30 Vol% clean ATLAS 1/7 fabric 66,56 1,63
Table 17 : Thermal expansion coefficient of epoxy resin with 10wt % of PARTICLE 1 (700nm)
Laminates with 10wt% P1 particles Flexural strength
(N/m2) MPa
Flexural modulus (Ef) GPa
Atlas 1/7 Clean glass fabric 362 ± 35 9.26 ± 0.53
ML Clean glass fabrics (Y-direction) 425 ± 29 13.12 ± 0.58
ML Clean glass fabrics (X direction) 397 ± 13 11.21 ± 0.51
Table 18 : Mechanical properties of laminates filled with 10wt% of PARTICLE 1
Figure 34 : Pictures of the test sample for flexural properties of laminate with 10wt% PARTICLE 1 and 30vol %
clean Atlas 1/7 glass fabric a: Side, b:top
5.4. Particle P2 (70nm)
Particles P2 (P2) exhibit dielectric breakdown strength of 35kV/mm, high volume
resistivity and thermal conductivity of 35W/m.K (data from the supplier). P2 has application to
1800°C in inert atmosphere, 1400°C in vacuum and 1000°C in oxidizing atmosphere. P2 particles
are often used as a lubricant instead of graphite.
A TGA measurement is made to confirm the masterbatch particle concentration. For the
future calculation, the concentration of Particle 2 in the masterbatch is 41wt%.
a. b.

41
The viscosity of the masterbatch of 41wt% P2 (70nm) in EPON 828 is measured without
and with dilution using the reference resin system (Figure 35 and Table 20). The maximum
viscosity which is acceptable for impregnation is 1.5Pa.s at 65°C. As it was expected, the
viscosity increases as the concentration of particles increases. For a concentration up to 20wt%
the viscosity decreases as the temperature increases. For concentrations of 23 and 27wt% the
viscosity decreases until 50 to 55°C and then increases again. The highest concentration
appropriate for our setup is 20wt% (45.2phr) of P2 (70nm).
Figure 35 : Viscosity of epoxy resin with P2 particles (70nm) in function of the temperature and concentration
Viscosity at [Pa*s]: 65°C
P2 10wt% 20phr 0.24
P2 18wt% 39.7phr 0.65
P2 20wt% 45.2phr 0.91
P2 23wt% 54phr 1,5
P2 27wt% 67phr 2,3
Table 20 : Viscosity of the system with P2 (70nm) particles at 65°C
The Tg of the matrix material decreases as the amount of P2 particles increases,
especially for concentration greater than 18wt% while the temperature of reaction remains
constant at 170°C as measured by DSC. The exothermal enthalpy of reaction (ΔH) decreases as
the concentration of P2 increases (Table 21). The decrease of Tg compared to the neat epoxy is
due to the diminution of the crosslink density of the polymer when the P2 particles is added.
The exothermic character of the curing reaction decreases significantly as the filler content
increase (Table 21). The diminution of the exothermic reaction can lead to a lower shrinkage
stress and internal mechanical stress of the matrix during processing and improved the used
00,5
11,5
22,5
33,5
44,5
5
30 40 50 60 70 80 90
Vis
co
sit
y (
Pa*s
)
Temperature (°C)
Viscosity of epoxy resin with BN particles(70nm)
10wt% 18wt% 20wt% 23wt% 27wt%
data
Wt% of
residue at
800°C
From the supplier 41.6
From ABB 40.8
Table 19 : TGA measurements of the masterbatch with Particles 2 (70nm)
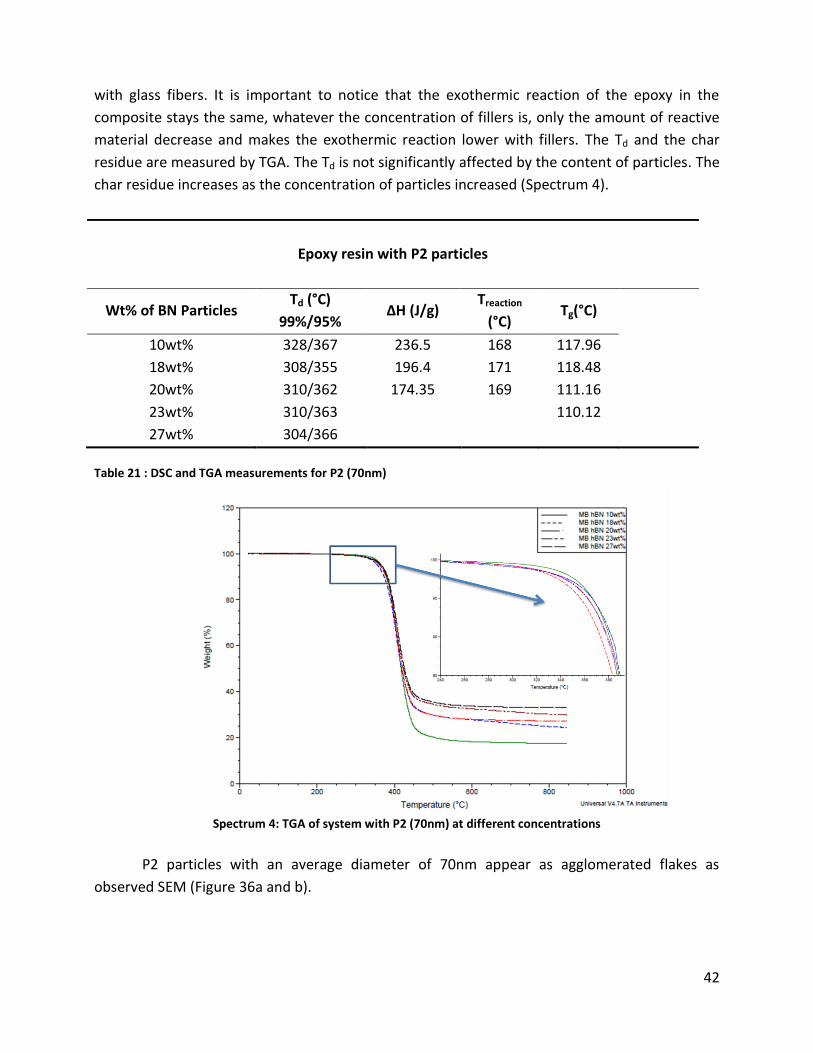
42
with glass fibers. It is important to notice that the exothermic reaction of the epoxy in the
composite stays the same, whatever the concentration of fillers is, only the amount of reactive
material decrease and makes the exothermic reaction lower with fillers. The Td and the char
residue are measured by TGA. The Td is not significantly affected by the content of particles. The
char residue increases as the concentration of particles increased (Spectrum 4).
Epoxy resin with P2 particles
Wt% of BN Particles Td (°C)
99%/95% ΔH (J/g)
Treaction
(°C) Tg(°C)
10wt% 328/367 236.5 168 117.96
18wt% 308/355 196.4 171 118.48
20wt% 310/362 174.35 169 111.16
23wt% 310/363 110.12
27wt% 304/366
Table 21 : DSC and TGA measurements for P2 (70nm)
Spectrum 4: TGA of system with P2 (70nm) at different concentrations
P2 particles with an average diameter of 70nm appear as agglomerated flakes as
observed SEM (Figure 36a and b).
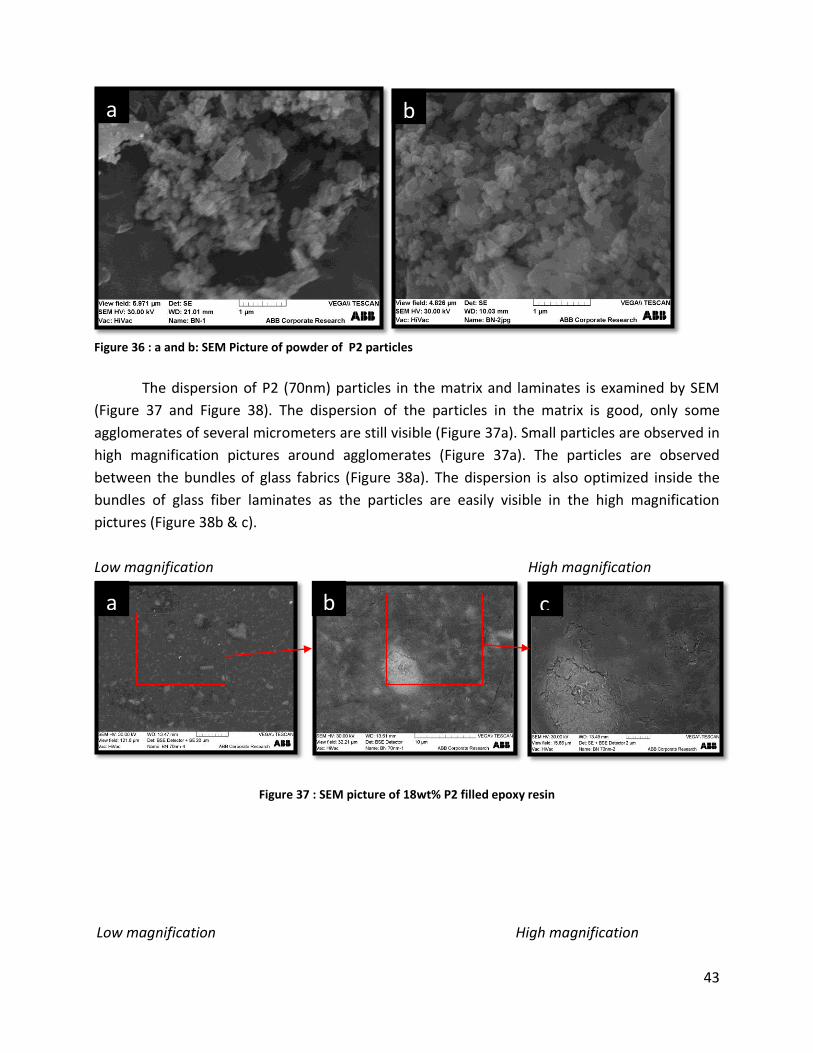
43
Figure 36 : a and b: SEM Picture of powder of P2 particles
The dispersion of P2 (70nm) particles in the matrix and laminates is examined by SEM
(Figure 37 and Figure 38). The dispersion of the particles in the matrix is good, only some
agglomerates of several micrometers are still visible (Figure 37a). Small particles are observed in
high magnification pictures around agglomerates (Figure 37a). The particles are observed
between the bundles of glass fabrics (Figure 38a). The dispersion is also optimized inside the
bundles of glass fiber laminates as the particles are easily visible in the high magnification
pictures (Figure 38b & c).
Low magnification High magnification
Figure 37 : SEM picture of 18wt% P2 filled epoxy resin
Low magnification High magnification
a.
b.
a.
b.
c

44
Figure 38 : SEM picture 18wt% P2 reinforced epoxy resin with 30 vol% cleaned ATLAS 1/7 glass fabric
1mm thick plates are characterized with 3-points bending mode by DMA. The resulting
data from the spectra (Spectrum 5) are summarized in the Table 22. The Tg (tan δ) is found at
105°C which is lower than the Tg measured with DSC (111°C - Table 21). In 3-points bending
mode, the storage modulus at 40°C is 1182MPa and the maximum of loss modulus is 287MPa at
95°C. The Tg (tan δ) is found at 100°C which is lower than the Tg measured with DSC (111°C -
Table 21). The storage modulus from 3-points bending increase of 31% at 40°C and 124% at
140°C respectively compared to the reference resin. The impact of the P2 particles over the
stiffness of the material is important especially above the Tg when the polymer matrix becomes
softer.
3-points bending Storage modulus Loss
modulus Maximum loss
modulus Tg (tan δ)
Temperature 40°C 80°C 140°C 40°C 91°C 100°C
MPa 1182 957 47 287
Table 22 : Dynamical mechanical properties for 3points-bending of a plate with a thickness of 1mm of the matrix with 20wt% of P2 particles
Spectrum 5 : 3-points bending - DMA of 20wt% P2 at a heat rate of 5°C/min and a dynamic force of 100mN and a heating rate of 5°C/min
a.
b.
c.
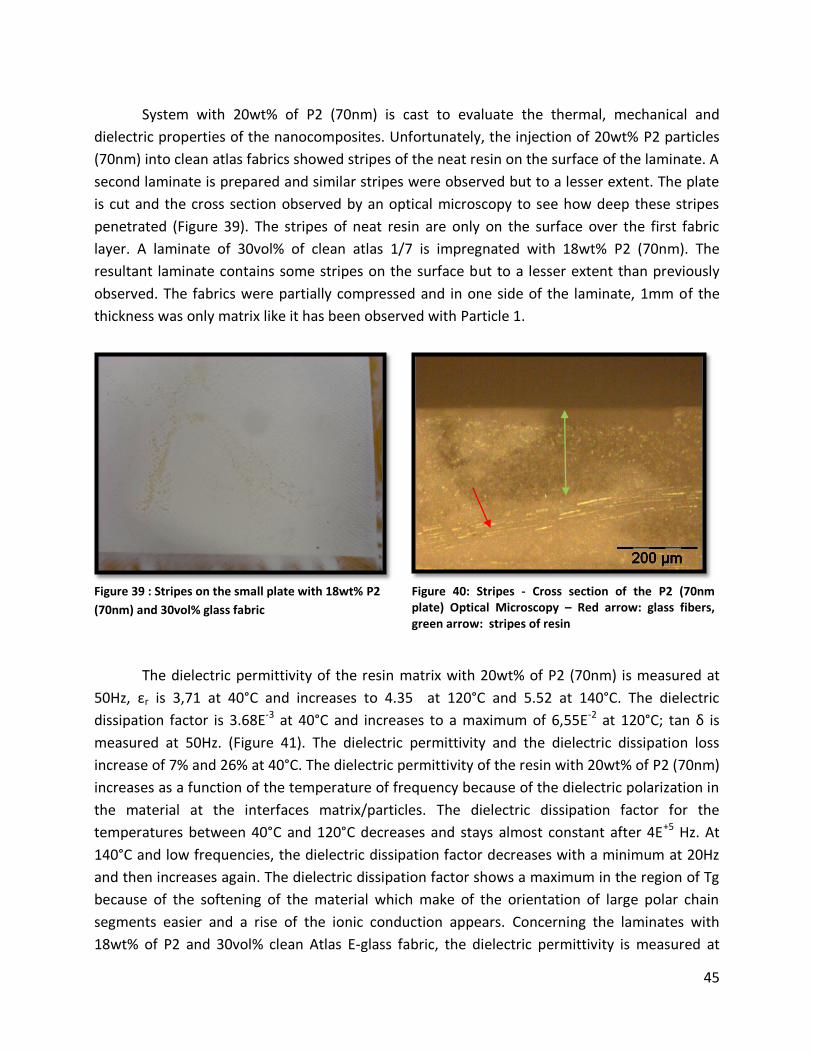
45
System with 20wt% of P2 (70nm) is cast to evaluate the thermal, mechanical and
dielectric properties of the nanocomposites. Unfortunately, the injection of 20wt% P2 particles
(70nm) into clean atlas fabrics showed stripes of the neat resin on the surface of the laminate. A
second laminate is prepared and similar stripes were observed but to a lesser extent. The plate
is cut and the cross section observed by an optical microscopy to see how deep these stripes
penetrated (Figure 39). The stripes of neat resin are only on the surface over the first fabric
layer. A laminate of 30vol% of clean atlas 1/7 is impregnated with 18wt% P2 (70nm). The
resultant laminate contains some stripes on the surface but to a lesser extent than previously
observed. The fabrics were partially compressed and in one side of the laminate, 1mm of the
thickness was only matrix like it has been observed with Particle 1.
Figure 39 : Stripes on the small plate with 18wt% P2
(70nm) and 30vol% glass fabric
Figure 40: Stripes - Cross section of the P2 (70nm plate) Optical Microscopy – Red arrow: glass fibers, green arrow: stripes of resin
The dielectric permittivity of the resin matrix with 20wt% of P2 (70nm) is measured at
50Hz, εr is 3,71 at 40°C and increases to 4.35 at 120°C and 5.52 at 140°C. The dielectric
dissipation factor is 3.68E-3 at 40°C and increases to a maximum of 6,55E-2 at 120°C; tan δ is
measured at 50Hz. (Figure 41). The dielectric permittivity and the dielectric dissipation loss
increase of 7% and 26% at 40°C. The dielectric permittivity of the resin with 20wt% of P2 (70nm)
increases as a function of the temperature of frequency because of the dielectric polarization in
the material at the interfaces matrix/particles. The dielectric dissipation factor for the
temperatures between 40°C and 120°C decreases and stays almost constant after 4E+5 Hz. At
140°C and low frequencies, the dielectric dissipation factor decreases with a minimum at 20Hz
and then increases again. The dielectric dissipation factor shows a maximum in the region of Tg
because of the softening of the material which make of the orientation of large polar chain
segments easier and a rise of the ionic conduction appears. Concerning the laminates with
18wt% of P2 and 30vol% clean Atlas E-glass fabric, the dielectric permittivity is measured at

46
50Hz, εr is 4,69 at 40°C and increases to 5,32 at 120°C and 5.52 at 140°C (Figure 42). The
dielectric dissipation factor is 1,27E-3 at 40°C and increases to a maximum of 5,39E-2 at 120°C;
tan δ is measured at 50Hz. The dielectric permittivity increases of 23% and the dielectric
dissipation loss decreases of 57% at 40°C. The permittivity is higher for the glass reinforced resin
than for the matrix while the dielectric dissipation loss decreases a lot.
Figure 41 : Permittivity and dielectric dissipation factor for the matrix with 20wt% P2 (70nm) particles in function of the temperature at 50Hz
Figure 42 : Permittivity and dielectric dissipation factor for the matrix with 20wt% P2 (70nm) particles in function of the temperature at 50Hz
The thermal expansion above Tg of the matrix with 20wt% of P2 and the laminate with
18wt% of P2 and 30vol% of clean glass atlas 1/7 fabric is respectively 52,85 10-6/°C and 67,24 10-
6/°C which is a reduction of respectively 15,4% and an increase of 8,29% . The addition of P2
0
0,01
0,02
0,03
0,04
0,05
0,06
0,07
0
1
2
3
4
5
6
40 60 80 100 120 140
tan
δ
Perm
itti
vit
y
Temperature (°C)
Dielectric properties at 50Hz - MB 20wt% P2 (70nm)
Permittivity εr
Dielectric dissipation factor tan δ
0
0,01
0,02
0,03
0,04
0,05
0,06
4,6
4,7
4,8
4,9
5
5,1
5,2
5,3
5,4
5,5
40 60 80 100 120 140
tan
δ
Perm
itti
vit
y
Temperature (°C)
Dielectric properties - 18wt% P2 70nm - 30 Vol % ATLAS Clean Glass Fabrics
Permittivity εr
Dielectric dissipation factor tan δ

47
particles decreases the thermal expansion coefficient because the P2 particles exhibit a lower
value of this coefficient (1.10-6/°C at 25 to 1000°C (44)) than the neat polymer matrix (66,01.10-
6/°C - Table 12). This reduction can also lead to a reduction of the resin shrinkage and thermal
stress. For the laminate with clean glass fabric, the coefficient of thermal extension increases.
The flexural strength of a sample with 20wt% (45.2phr) of P2 particles is measured to be
approximately 99MPa and which is a decrease of 13.4% compared to the reference. The flexural
modulus is 4.43 GPa which corresponds to a gain of 46% compared to the neat resin. The epoxy
with P2 has a more brittle behavior than the reference.
Regarding the difference between the 2 sides of the samples (Figure 34), a bench of samples of
18wt% of P2 particles with 30vol% clean glass laminate were tested one side (Resin at the
bottom) and the rest in the other side. As we can expect, the best results were found with the
sample with the epoxy resin placed at the top. Indeed, in that case the maximum stresses are
situated at the bottom of the sample. The flexural strength was 378MPa and the flexural
modulus was 11.125GPa. If the sample is turned over and then tested, the maximum stresses
undergo by the plate during the test are situated on the epoxy layer. The epoxy layer will break
first, and then the rest of the plate which will falsify the results.
Sample
P2 particles (70nm)
Permittivity
εr
(40°C - 50Hz)
Dielectric
dissipation
factor
tan δ
(40C - 50Hz)
Thermal
Expansion
10-6/°C
(above tg)
CTE
Flexural
strength
(N/m2)
MPa
Flexural
modulus
(Ef)
GPa
Matrix 18wt% 3.68 3.71E-03
Matrix 20wt% 52,85 99 ± 15 4.43 ± 0,04
Laminates 18wt% -
30vol% ATLAS 1/7 clean
glass fabric
4,69 1.27E-03 67,24 378 ± 6 11.125 ± 0,051
Table 23: Dielectric and flexural properties of epoxy resins with P2 (70nm) particles
Conclusion Particle P2
The maximum viscosity admitted for VARTM is for 20wt% P2 particles (70nm) which is
higher than Particle 1 whom the highest concentration was for 10wt%. SEM pictures showed in
a previous report that the 10wt% P1 particles were found between and inside the bundles of
fabric (1). For the laminates with 20wt% of P2 (70nm), the SEM pictures shows some
agglomerates but also a good dispersion between the bundles, more SEM pictures and EDX
analysis are necessary to study the dispersion inside the bundles of glass fibers. Concerning the
storage modulus of the matrices measured by 3-points bending, matrix with 20wt% of P2 70nm
shows an extent of 12% compared to the matrix with 10% Particle 1. P2 particles (70nm) exhibit
a greater strength and flexural modulus of 4,4% and 20% than the Particle 1 (700nm) for

48
laminates with 30vol% clean atlas glass fabric. The dielectric permittivity of the laminates with
clean atlas glass fabric with 10wt% of P1 and with 20wt% of P2 is measured at 50Hz, εr is 4,5 for
Particle 1 and εr is 4,69 for P2 70nm at 40°C. The dielectric dissipation factor for laminates with
30vol% clean Atlas fabric at 40°C is 3.23E-3 for Particle 1 and 1,27E-3 for P2; Tan δ is measured at
50Hz. In one hand, the permittivity is higher for the glass reinforced resin than for the matrix
but on other hand the dielectric dissipation loss decreases a lot and is even lower than the
reference resin.
5.5. Particle P3 (100nm)
A masterbatch of 35,3wt% of P3 particle (100nm) in a modified bisphenol A is used for
impregnation due to its low viscosity of 0,385 Pa.s at 65°C (1). 1mm thick plates of epoxy with
35,3wt% were characterized with 3-points bending mode by DMA. The glass transition
temperature is measured from the phase angle and is determined between 102°C; Tg is lower
that measured with DSC (122, 5°C (1)). The resulting data from the spectra Spectrum 6) are
summarized in the Table 24. By 3-points bending mode, the storage modulus, measured as a
function of temperature, shows a significant increase, it is 1170MPa at 96°C respectively. The
storage moduli from 3-points bending increases by 29% at 40°C and by 105% at 140°C
respectively, compared to the reference resin. The impact of the P3 particles over the stiffness
of the material is significant especially beyond the Tg.
Spectrum 6: Dynamical mechanical properties for 3-points bending of a plate with a thickness of 1mm of the
matrix with 35,3wt% P3 (100nm)
3-points bending Storage modulus Loss
modulus Maximum loss
modulus Tg (tan δ)
Temperature 40°C 80°C 140°C 40°C 96°C 102°C
MPa 1170 1050 43 33 245
Table 24 : Dynamical mechanical properties for 3-points bending of a plate with a thickness of 1mm of the matrix with 35,3wt% P3 (100nm).

49
The dispersion of P3 (100nm) particles in the plate and the laminates with clean atlas
glass fabric is examined by SEM. The particles are well-dispersed in the matrix and the
laminates. It is difficult to distinguish the nanoparticles between the glass fibers at this
magnitude but the surface looks similar to the Figure 43a where the particles are dispersed in
the matrix.
Low magnification High magnification
Figure 43 : SEM pictures - Matrix with 35wt% P3 (100nm)
Figure 44 : SEM pictures - Laminates with 35wt% P3 (100nm) and 30 vol% cleaned ATLAS 1/7 glass fabric
The dielectric properties are measured for a 30vol% E-glass laminate with 35,3wt% P3
particles; the relative permittivity and the dielectric dissipation factor of laminates at 50Hz with
30vol% clean glass fabric are 4,79 and 3,71E-3 at 40°C (Figure 45). Regardless the frequency,
higher is the temperature; more elevated is the relative permittivity. Compared to the other
samples tested, laminates with P3 particles exhibits the highest value for dielectric constants
which can be related to the important concentration of particles in the matrix, which creates
more interfaces matrix/particle and an augmentation of the boundary layer polarization.
a.
b.
c
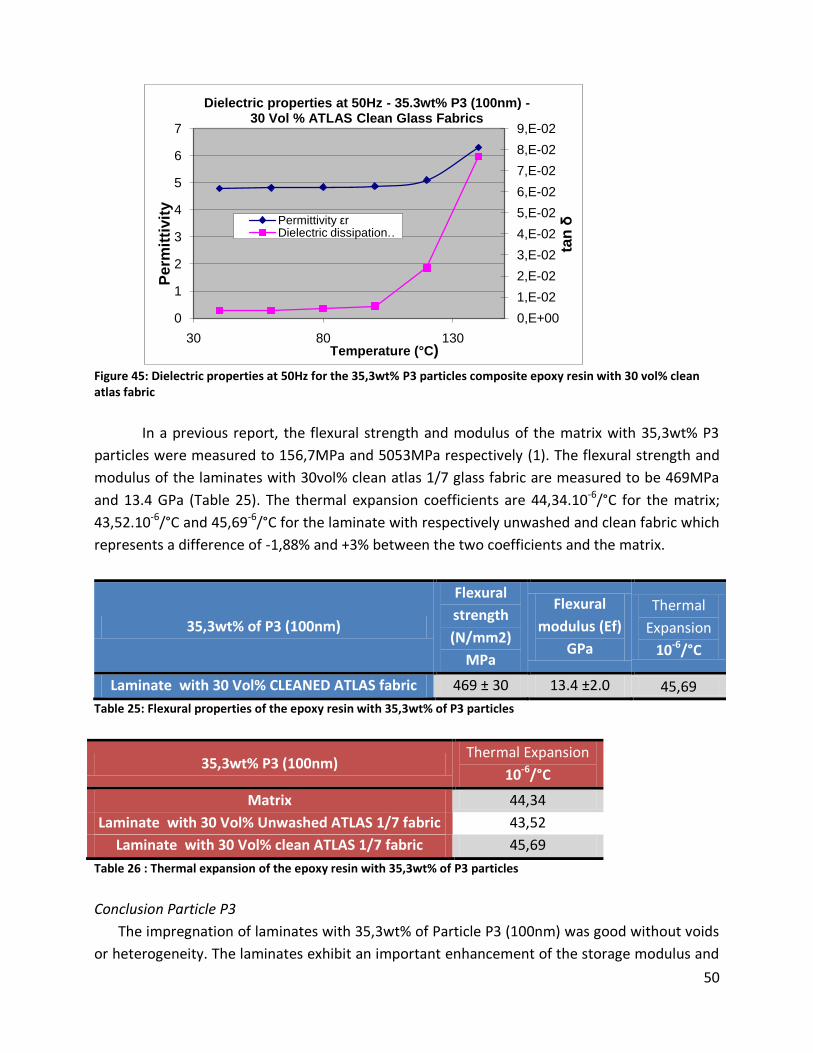
50
Figure 45: Dielectric properties at 50Hz for the 35,3wt% P3 particles composite epoxy resin with 30 vol% clean atlas fabric
In a previous report, the flexural strength and modulus of the matrix with 35,3wt% P3
particles were measured to 156,7MPa and 5053MPa respectively (1). The flexural strength and
modulus of the laminates with 30vol% clean atlas 1/7 glass fabric are measured to be 469MPa
and 13.4 GPa (Table 25). The thermal expansion coefficients are 44,34.10-6/°C for the matrix;
43,52.10-6/°C and 45,69-6/°C for the laminate with respectively unwashed and clean fabric which
represents a difference of -1,88% and +3% between the two coefficients and the matrix.
35,3wt% of P3 (100nm)
Flexural
strength
(N/mm2)
MPa
Flexural
modulus (Ef)
GPa
Thermal
Expansion
10-6/°C
Laminate with 30 Vol% CLEANED ATLAS fabric 469 ± 30 13.4 ±2.0 45,69
Table 25: Flexural properties of the epoxy resin with 35,3wt% of P3 particles
35,3wt% P3 (100nm) Thermal Expansion
10-6/°C
Matrix 44,34
Laminate with 30 Vol% Unwashed ATLAS 1/7 fabric 43,52
Laminate with 30 Vol% clean ATLAS 1/7 fabric 45,69
Table 26 : Thermal expansion of the epoxy resin with 35,3wt% of P3 particles
Conclusion Particle P3
The impregnation of laminates with 35,3wt% of Particle P3 (100nm) was good without voids
or heterogeneity. The laminates exhibit an important enhancement of the storage modulus and
0,E+00
1,E-02
2,E-02
3,E-02
4,E-02
5,E-02
6,E-02
7,E-02
8,E-02
9,E-02
0
1
2
3
4
5
6
7
30 80 130
tan
δ
Pe
rmit
tivit
y
Temperature (°C)
Dielectric properties at 50Hz - 35.3wt% P3 (100nm) -30 Vol % ATLAS Clean Glass Fabrics
Permittivity εrDielectric dissipation …

51
of the flexural modulus compared to the neat resin. The dielectric properties are higher than
the reference but stay acceptable considering the concentration of particles.
5.6. Particle P4 (45nm)
Particle P4 (45 nm) is examined due to its thermal conductivity of 26 W/mK (data from
the supplier); the surface area is between 32 and 40m²/g and the density of Particle 4 is
3,6g/cm3 at 20°C. A 22.5wt% masterbatch in Araldit F is evaluated; the TGA of the masterbatch
is measured to 800°C and the content of particles is determined to be 22,5wt% in agreement
with the supplier. The masterbatch is mixed with the hardener and the accelerators described
previously (Section page 26); the final concentration of particles is 12.8wt% in the system (Table
27). The viscosity of this blend is measured to be 0.255 Pa*s at 65°C (Figure 46) and is lower
than the limit defined for the RTM setup (1). A curing cycle of 80°C for 6hours and 130°C for
10hours is used; the cured matrix has a Tg of 108°C as measured by DSC. Impregnation of the
laminates is enhanced by the low viscosity of the resin system; the laminates surface appears
homogenous without stripes.
Table 27 : TGA of the matrix with 12,8wt% of P4
particles
Material
Initial
%wt of
particle
Td @
99%(°C)
Td @
95%(°C)
weight
remaining
(%) after
800°C
MB
12.8wt%
P4
12.8 317.59 360 19.39
Figure 46 : Viscosity of the system with 12,8wt% of P4 particles
(45nm)
The dispersion of P4 (45nm) particles in the matrix is examined by SEM (Figure 47). The
dispersion in the matrix is good and no agglomerates are visible.
0
1
2
3
4
5
30 50 70 90
Vis
co
sit
y (
Pa
*s)
Temperature (°C)
Viscosity of epoxy with 12,8wt% P4 particles(45nm)

52
Figure 47 : SEM picture of the matrix with 12,8wt% P4
1mm thick plates of the matrix with 12,8wt% are characterized with 3-points bending
modes by DMA. The storage modulus measured by 3-points bending mode at 40°C is 927MPa
and the maximum loss modulus is 230MPa at 104°C (Figure 48 and Table 28). The Tg (tan δ) is
found at 110°C which is higher than the Tg measured by DSC (Table 29).
Figure 48 : 3-point bending - DMA of 12,8wt% P4 (45nm) at a heat rate of 5°C/min and a dynamic force of 100mN and a heating rate of 5°C/min
3-points bending Storage modulus Loss
modulus Maximum loss
modulus Tg (tan δ)
Temperature 40°C 80°C 140°C 40°C 104°C 107°C
MPa 927 790 27 37 230
Table 28 : Dynamical mechanical properties for 3points-bending of a plate with a thickness of 1mm of the matrix with 12,8wt% of P4.
The permittivity of the matrix and the laminates with 30vol% clean Atlas 1/7 E-glass
fabric at 40°C is 3,7 and 4,41 respectively at 50Hz (Table 29) which represents an increase of
19,2% for the laminates. The dielectric dissipation factor of the matrix and laminate at 40°C is

53
4,19E-3 and 3,44E-3 at 50Hz respectively which represents a reduction of 17,9%. This reduction is
encountered with all the materials tested previously.
The thermal expansion of the laminates is 62,24 10-6 /°C. The flexural strength of the
matrix and laminates is 143 MPa ± 6 and 329MPa ± 46 respectively. The flexural modulus of the
matrix and the laminates are 4.05 GPa ± 0,3 and 11,8GPa ± 0,5 respectively (Table 29).
Conclusion P4
Laminates with 12,8wt of P4 particles (45nm) filled epoxy was easily impregnated due to a
low viscosity (0,255 Pa.s at 65°C) and exhibited no voids, filtering or cracks after impregnation
by VARTM. No reference laminates was made with Araldit F. The electrical properties are still in
a good range for the laminate and the matrix.
5.7. Particle P5 ( 15-30nm)
Particle P5 (P5) particles with an average diameter of 15-30nm have a thermal conductivity of approximately 30 W/mK g (data from the supplier). The P5 particles are amorphous and spherical with a true density of 3,4g/cm3and a surface area between 103 – 123m²/g.
A masterbatch of 40wt% of amorphous P5 dispersed in EPON® 828 is received; the
highest concentration of particles dispersed in the cured system is 27wt% of particle with
hardener (a dilution is incurred with the addition of hardener (HY925)). The received
masterbatch is a powder which makes for difficulty in dispersion/mixing. Due to the density
difference between the particle and the resin system, sedimentation of the particles is observed
in samples of the cured system (Figure 49).
Material
(MB P4
12,8wt%)
Viscosity
at 65°C
[Pa*s]:
Tg(°C)
DSC
Permittivity
εr @40°C -
50Hz
Dielectric
dissipation
factor tan δ
@40°C –
50Hz
Flexural
strength
(N/mm2)
MPa
Flexural
modulus
(Ef) GPa
Thermal expansion (10-6 /°C)
Matrix 0.255 108.4 3.7 0.00419 143 ± 5.7 4.05 ±0.3
laminates
With 30vol%
Atlas 1/7
cleaned glass
fabric
- - 4,41 0.00344 329 ± 46 11.8 ±0.5 62,24
Table 29 : Processing, electrical and flexural properties of the matrix and laminates with 12,8wt% of P4 particles (45nm)

54
After an evaluation of different dispersion processes including high shear mixers and
ultrasonic, it is determined that a maximum of 0,8wt% particles can be dispersed in the resin
system without sedimentation during curing. The masterbatch is determined to be unfit for the
impregnation of laminates by RTM or VARTM, although the wet-lay may be used to further
evaluate this particle in a reinforced laminate.
Figure 49 : Plate of 5wt% of P5 particles (15 - 30nm)
5.8. Electrical breakdown test
Electrical breakdown strength measurements of cast and laminate plates are examined
by two techniques. Initial attempts used spherical electrodes with thin cast plate of epoxy;
electrodes with a radius of 40mm are used to avoid field enhancement. According to the
standard IEC 60243-1, the radius of the electrodes must be greater than 20mm. The cast
sample plate is placed between the 2 spherical electrodes into a Gas insulated Switchgear (GIS)
filled with SF6 gas for testing. Both 4mm and 1mm thick sample plate are examined, a 4mm
thick plate exhibited corona and electrical discharges so the experiment was stopped before
electrical breakdown. Corona and discharges phenomena create disturbances on the scope,
make the measurement impossible and can lead to a flashover. The breakdown strength of a
1mm plate of the neat reference is observed (Figure 50) once over the course of two
experiments, unfortunately corona and electrical discharges were still observed and the results
are considered unreliable. The corona and electrical discharges appeared at 22,63kV/mm and
the electrical breakdown was at 27,58kV/mm. The breakdown path went straight through the
plate, almost without cracks, only a small hole is visible at the middle of the plate, where the
spherical electrodes were touching the plate (Figure 51).

55
Figure 50 : First setup with neat resin
plate - Corona and electrical discharges
Figure 51 : Electrical breakdown of 1mm plate of neat resin
Based on the results of the tests using spherical electrodes, it is determined that the
electrodes required further insulation in addition to gas. The second setup is composed two
cylindrical electrodes and plates of 4mm only (with and without glass fabrics) where protective
walls have been molded as described previously (Section Electrical breakdown samples, page 27
Figure 23). Surround walls are built in with epoxy around the electrodes to avoid flashovers.
Cast or impregnate plates, prepared as described previously (Section Electrical breakdown
samples, page 27, Figure 22) are placed between the two halves of the mold and the reference
resin is injected to create walls. After curing the bottom and top of the sample are grinded for
having flat surfaces to keep the maximum surface contact between the walls and the
electrodes. Room curing epoxy resin is applied in order to bore the holes and the bubbles
presented inside the wall. Finally, the sample is painted with silver paint inside of the wall (Table
7). Before electrical breakdown testing, the sample has to successfully pass partial discharges
(PD) measurement.
Five samples with a plate made of the reference resin; the reference resin with 30vol%
clean Atlas 1/7 glass fabric and the 35,3wt% of the P3 Particle were selected and built
following this procedure. Some samples more precisely with P3 particles and glass fabrics
exhibit some important cracks after the curing and the cooling. Those samples are not proper
for further tests because the cracks are weak points and will make the breakdown happening
sooner (Figure 52).
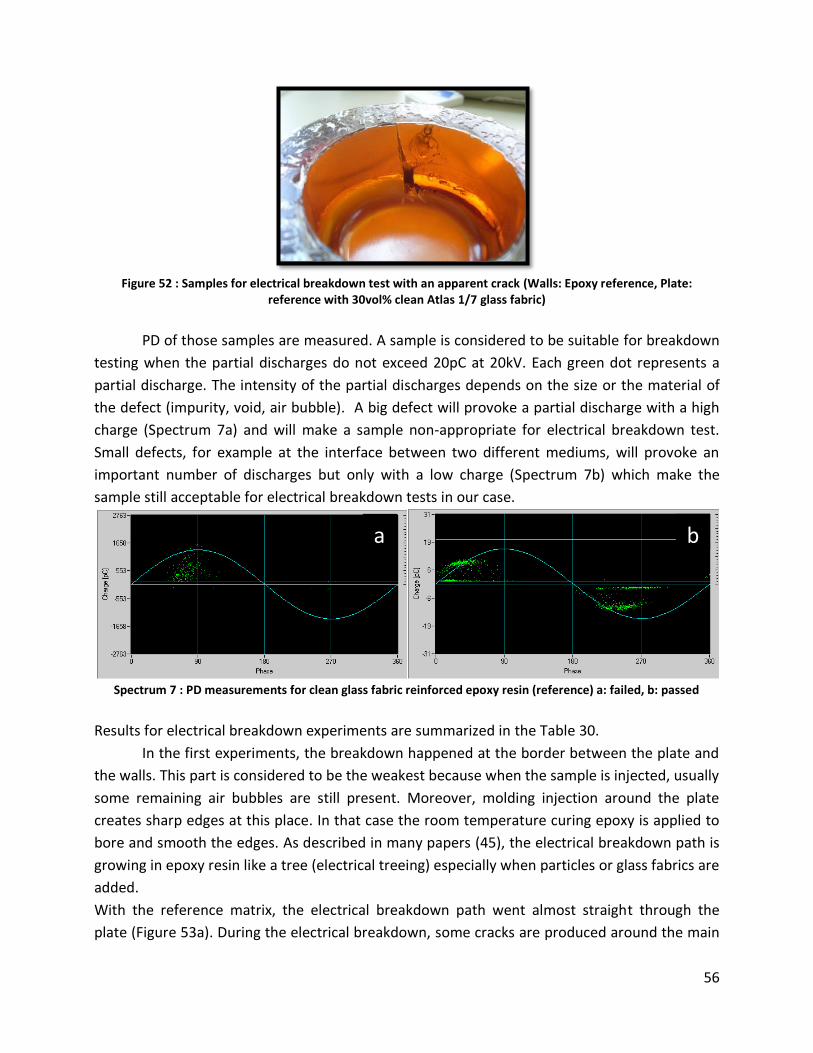
56
Figure 52 : Samples for electrical breakdown test with an apparent crack (Walls: Epoxy reference, Plate:
reference with 30vol% clean Atlas 1/7 glass fabric)
PD of those samples are measured. A sample is considered to be suitable for breakdown
testing when the partial discharges do not exceed 20pC at 20kV. Each green dot represents a
partial discharge. The intensity of the partial discharges depends on the size or the material of
the defect (impurity, void, air bubble). A big defect will provoke a partial discharge with a high
charge (Spectrum 7a) and will make a sample non-appropriate for electrical breakdown test.
Small defects, for example at the interface between two different mediums, will provoke an
important number of discharges but only with a low charge (Spectrum 7b) which make the
sample still acceptable for electrical breakdown tests in our case.
Spectrum 7 : PD measurements for clean glass fabric reinforced epoxy resin (reference) a: failed, b: passed
Results for electrical breakdown experiments are summarized in the Table 30.
In the first experiments, the breakdown happened at the border between the plate and
the walls. This part is considered to be the weakest because when the sample is injected, usually
some remaining air bubbles are still present. Moreover, molding injection around the plate
creates sharp edges at this place. In that case the room temperature curing epoxy is applied to
bore and smooth the edges. As described in many papers (45), the electrical breakdown path is
growing in epoxy resin like a tree (electrical treeing) especially when particles or glass fabrics are
added.
With the reference matrix, the electrical breakdown path went almost straight through the
plate (Figure 53a). During the electrical breakdown, some cracks are produced around the main
a.
b.
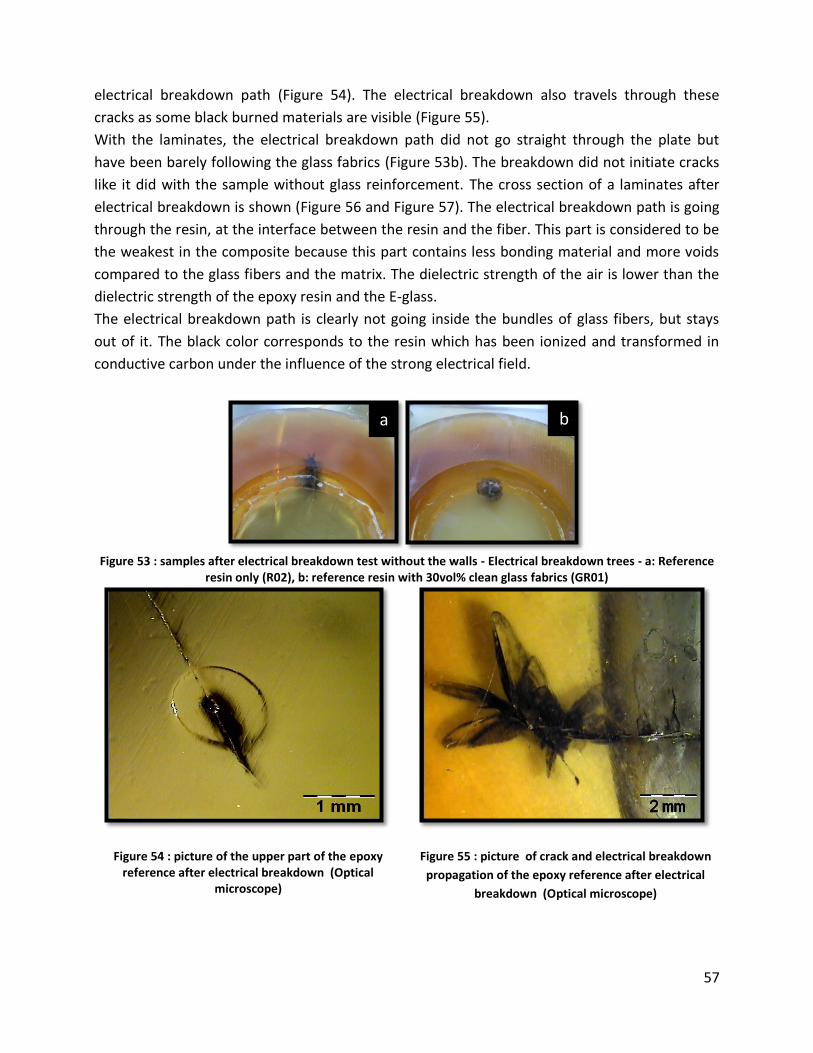
57
electrical breakdown path (Figure 54). The electrical breakdown also travels through these
cracks as some black burned materials are visible (Figure 55).
With the laminates, the electrical breakdown path did not go straight through the plate but
have been barely following the glass fabrics (Figure 53b). The breakdown did not initiate cracks
like it did with the sample without glass reinforcement. The cross section of a laminates after
electrical breakdown is shown (Figure 56 and Figure 57). The electrical breakdown path is going
through the resin, at the interface between the resin and the fiber. This part is considered to be
the weakest in the composite because this part contains less bonding material and more voids
compared to the glass fibers and the matrix. The dielectric strength of the air is lower than the
dielectric strength of the epoxy resin and the E-glass.
The electrical breakdown path is clearly not going inside the bundles of glass fibers, but stays
out of it. The black color corresponds to the resin which has been ionized and transformed in
conductive carbon under the influence of the strong electrical field.
Figure 53 : samples after electrical breakdown test without the walls - Electrical breakdown trees - a: Reference
resin only (R02), b: reference resin with 30vol% clean glass fabrics (GR01)
Figure 54 : picture of the upper part of the epoxy reference after electrical breakdown (Optical
microscope)
Figure 55 : picture of crack and electrical breakdown
propagation of the epoxy reference after electrical
breakdown (Optical microscope)
a
. b
.

58
PD measurement <20pC at 20kV
Electrical breakdown
Strength
Samples pC at kV Passed/Failed V/mm (kV)
R01 800pC at 15.6kV 0
R02 800pC at 13kV 16,75
R03 300pC at 11kV 0
R04 <20pC at 20kV 0
R05 <30pC at 17.5kV 0
GR01 8pC at 17kV 19,53
GR02 30pC at 17.5kV 0
GR03 >500pC at 15kV 0
GR04 >100pC at 10kV 0
GR05 <20pC at 20kV 0
P3-01 <50pC at 15kV 0
P3-02 <20pC at 20kV 0
P3-03 <20pC at 20kV 0
P3-04 <50pC at 20kV 0
P3-05 <70pC at 20kV 0
Table 30: Data of electrical breakdown strength and PD measurements, R stands for the plates with reference epoxy resin matrix only, GR stands for laminates of reference epoxy resin with 30vol% clean glass fabric and P3 stands for the plates with 35,3wt% P3 matrix
Note: green colored samples are ready for breakdown testing, yellow could be improved with
the silver-painting, red samples could be tested but maybe with early breakdown.
No further work was carried out at this stage; the samples are ready for electrical
breakdown measurement.
Figure 56 : Cross section of a laminate with the epoxy reference after electrical breakdown (Optical microscope)
Figure 57 : Cross section of a laminate with the epoxy reference after electrical breakdown (Optical microscope - overview)

59
6. CONCLUSION This project was focused on studying the effects of particles on improving mechanical and
thermal properties of clean glass fibers reinforced epoxy composites for electrical insulators. Epoxy layered submicro and nanosized particles composites based on diglycidyl-ether of bisphenol A and anhydride-curing agents have been synthesized. The particles examined in this report are Particle 1 (P1 – 700nm) supplied in powder; Particle 3(P3 – 100nm), Particle 2(P2 – 70nm), Particle 4 (P4 – 45nm) and Particle 5 (P5 – 15/30nm) supplied in masterbatches.
The first aim of this project was to characterize the thermal expansion and the dynamical mechanical properties of the epoxy reference which was 0,9GPa for the storage modulus at 40°C in 3-points bending. Laminates with 30vol% clean E-glass fabric and clean ML fabric were produced and the thermal expansion, dielectric properties mechanical properties were measured. Interlaminar shear strength of laminates of the epoxy reference with 30 and 60vol% uni-directional glass fabric was measured to be 55,6GPa and 63,5GPa respectively by the short beam method and ISO14130.
Complete studies of epoxy filled with P2 particles (70nm) and P4 Particles (45nm) were carried out and the matrix properties such as processing properties, microscopy, DMA, thermal expansion, dielectric properties and mechanical properties were measured. The particles were well-dispersed in the matrix and through the glass fibers. P2 particles in laminates exhibits a real improvement for the mechanical properties compared to the P1 particles, ten times bigger in diameter.
Laminates of epoxy filled with ceramic particles were studied. The dynamical mechanical analysis of all the particles was performed. Epoxies filled with 35,3wt% of P3 particles and with 20wt% P2 (70nm) show the best value with 1,17GPa and 1,18GPa respectively. Microcopy pictures of laminates were taken by SEM and optical microscope of P2, P3 and P4; the particles were well dispersed in the matrix and between the glass fibers. The thermal expansion coefficients decrease in function of the concentration of ceramic particles in the matrix, with 30vol% normal atlas 1/7 fabric, the thermal expansion tends to be between the value of the matrix with and without particles and with 30vol% clean atlas 1/7 fabric, the thermal expansion is measured to be less predictable. Dielectric properties were measured at 50Hz, the relative permittivity was always higher than the reference epoxy for the filled resins and more especially for laminates at 40°C. The laminates with 30vol% atlas 1/7 clean glass fabrics exhibit better results than the normal glass fabric. For the dielectric dissipation factor, the best results were measured for the laminates with 30vol% clean glass fabric, greater than the matrix only, the laminates with 30vol% of ML clean fabric and atlas 1/7 normal fabric. The flexural strength was measured, and the best results were found for the laminates with 30vol% atlas clean glass fabrics with 35,3wt% P3 particles and with reference epoxy. Concerning the flexural strength of the matrices, the most interesting were found to be 143MPa for the 12,6wt% P4 particles (45nm) but still a bit lower than the 35,3wt% of P3 particles (100nm) measured in a previous report (1).
Epoxy resin filled with P5 was not successfully yielded because the mixing of the masterbatch containing the particles was not efficient and exhibits agglomerates. No other study was carried out at this stage.
Because of some technical problems, it was not possible to measure the thermal conductivity of the matrices and laminates.

60
Electrical breakdown setup was built to test flat laminate of 4mm in a SF6 gas chamber. Three types of samples were tested, samples with only matrix of the reference epoxy, samples with P3 particles filled epoxy plate and laminate of reference epoxy with 30vol% of clean atlas glass fabric. The preparation of the sample revealed to be very important because voids and air bubbles can make the electrical breakdown appears too soon and lower the electrical breakdown strength. The electric breakdown path follows the interfaces matrix/fibers.
7. Future directions/researches As soon as the machine is fixed, the thermal conductivity of all the matrices and laminates should be measured. The dispersion of the particles in the matrix and the laminates should be study deeper with SEM/EDX especially between the fibers in the bundle. Short beam tests should be carried out in epoxy composite filled with particles to observe the affect of the particle on this value interlaminar shear strength. Electrical breakdown could be performed with the other materials. Other way to mix efficiently masterbatch with P5 particles should be explored such as high shear mixing and wet lay.

61
8. REFERENCES 1. Peter Zweifel, Sian F. Fenessey. Advanced fiber reinforced composite – effect of micron and submicron fillers on the thermal conductivity and mechanical properties. ABB Corporate research center (CHCRD - Baden-Dätwill - Switzerland) : ABB Technical report, 2010. Internal report 80334. 2. May, Clayton A. Epoxy resins: chemistry and technology. s.l. : M. Dekker, 1988. 3. insulators, ABB composite. www.abb.com/composites. [Online] 4. Wichmann, M.H.G. et al. ”Glass fiber reinforced composites with enhanced mechanical and electrical properties benefit and limitations of nanoparticle modified matrix. s.l. : Eng Frac Mech 73 (2006) 2346, 2006. 5. Haque.A, Shamsuzzoha.M, Hussain.F, Dean.D. S2-Glass/epoxy polymer nanocomposites: Manufacturing, structures, thermal and mechancial properties. s.l. : Journal of composite materials, Vol 37, No. 20/2003, 2003. 6. Kornmann, X. et al. Epoxy layered silicate nanocomposites as matrix in glass fibre reinforced composites. s.l. : Comp. Sci. Tech. 65 (2005), 2259, 2005. 7. Mahrholz, T. et al. Quantitation of the reinforcement effect of silica nanoparticles in epoxy resins used in liquid composite moulding processes. s.l. : Comp. Part A. 40 (2009), 235, 2009. 8. K. C. Yung, H. Liem. Enhanced thermal conductivity of boron nitride epoxy-matrix composite through multi-modal particle size mixing. Hong Kong : Journal of Applied Polymer Science, Volume 106 Issue 6, Pages 3587 - 3591, 2007. 9. Han, Z. et al. Thermal properties of composites filled with different fillers. s.l. : IEEE International Symposium on Electrical Insulation (2008), 497., 2008. 10. Thermal properties of composites filled with different fillers. Han, Z., Wood JM, Herman H, Zhang C, Stevens GC. 497 - 501, s.l. : IEEE International Symposium on Electrical Insulation, 2008, Vol. 2008. 11. Epoxy/h-BN composites for thermally conductive underfill material. Liang, Xiu, Wong. pages 437 - 440, Atlanta (USA) : electronic components and technology conference 59th, 2009. 12. Xingyi Huang, Pingkai Jiang, Chonung Kim, Qingquan Ke, Genlin Wang. Preparation, microstructure and properties of polyethylene aluminum. s.l. : Composites Science and Technology 68 (2008) 2134–2140, 2008. 13. Dielectric spectroscopy and partial discharge characterisation of fiber-reinforced epoxy materials. Page, A. Krivda and S.A. ABB Corporate research center Baden-Datwill - Switzerland : XIIIth international symposium of high voltage engeenering, Netherlands 2003, 2003. ISBN 90-77017-79-8. 14. Kochetov, R. et al. Preparation and dielectric properties of epoxy-BN and epoxy-AlN Nanocomposites. s.l. : IEEE Electrical Insulation Conference (2009), 397, 2009. 15. Zhao, H. et al. Effect of water absorption on the mechanical and dielectric properties of nano-alumina filled epoxy nanocomposites. s.l. : Comp. Part A. 39 (2008), 602., 2008. 16. Zhang, C. et al. Dielectric properties of born nitride filled epoxy composites. s.l. : IEEE: Annual Conference on Electrical Insulation and Dielectric Phenomena (2006), 19, 2006. 17. Dielectric Properties of Epoxy Nanocomposites containing TiO2, Al2O3 and ZnO fillers. J. C. Fothergill, J. K. Nelson, M. Fu. UK : IEEE, 2004.

62
18. Clyne, D. Hall and T.W. An introduction to composite materials. 19. 14130:1997, Standard ISO. Fibre-reinforced plastic composites - Determination of apparent interlaminar shear strength by short beam method. 1997. 20. D2344, ASTM. Standard test method for short-beam strength of polymer matrix composite materials and their laminates. 21. On short beam shear tests for composite materials. al, Whitney et. 1985. 22. Study of three- and four-point shear testing of unidirectional composite materials. Admas, Ming Xie and Donald F. 1994. 23. Ashbee, Ken. Fundamental principles of fiber reinforced composites. 1989. 24. 14129:1997, ISO. Fibre-reinforced plastic composites -- Determination of the in-plane shear stress/shear strain response, including the in-plane shear modulus and strength, by the plus or minus 45 degree tension test method. s.l. : Standard ISO, 1997. 25. 94(2007), ASTM D3518 / D3518M -. Standard Test Method for In-Plane Shear Response of Polymer Matrix Composite Materials by Tensile Test of a ±45° Laminate. 2007. 26. Administration, US departement of transportation - Federal Aviation. Test methods for composites a status report - Volume 3 shear test methods. 1993. 27. 1997, Von Leif A.Carlsson R. Byron Pipes. Experimental characterization of advanced composite materials Second edition . s.l. : Technomic Publishing. 28. ASTM. D5379 / D5379M (Standard Test Method for Shear Properties of Composite Materials by the V-Notched Beam Method.). 1993. 29. Melin, L. G., Neumeister, J. M., Pettersson, K. B., Johansson, H., & Asp, L. E. Evaluation of four composite shear test methods by digital speckle strain mapping and fractographic analysis. . s.l. : Journal of Composites Technology and Research, 22(3), 161, 2000. 30. J.S.Hawong, D.C. Shin, U.C. Baek. Validation of pure shear test device using finite element method and experimental methods, . South Korea : School of Mechanical Engineering, 2003. 31. Neumeister, J M, Palsson, A C. Inclined double notch shear test for improved interlaminar shear strength measurements. s.l. : ASTM Journal of Composites Technology & Research (USA). Vol. 20, no. 2, pp. 100-107. Apr. 2008, 2008. 32. 7078-05, ASTM International D. Shear Properties of Composite Materials by V-Notched Rail Shear Method. 2005. 33. Adams, Dr Donald. Shear test methods iosipescu vs v-notched rail. High-Performance composites. [Online] 01 2010. http://www.compositesworld.com/articles/shear-test-methods-iosipescu-vs-v-notched-rail. 34. L.B. Manfredi, H. De Santis, A. Vázquez. Influence of the addition of montmorillonite to the matrix of unidirectional glass fibre/epoxy composites on their mechanical and water absorption properties. Mar del Plata, Argentina : Composites: Part A 39 (2008) 1726–1731, 2008. 35. Malte H.G. Wichmann, Jan Sumfleth, Florian H. Gojny, Marino Quaresimin, Bodo Fiedler, Karl Schulte. Glass-fibre-reinforced composites with enhanced mechanical and electrical properties – Benefits and limitations of a nanoparticle modified matrix. Hamburg, Germany : Engineering Fracture Mechanics 73 (2006) 2346–2359, 2006. 36. Imai, T. et al. Improving epoxy-based insulating materials with nano-fillers toward practical application. s.l. : IEEE Electrical Insulation Conference (2008), 201., 2008. 37. Deng S, Hou.M, Ye.L. Temperature-dependent elastic moduli of epoxies measured by DMA and their cotrrelations to mechanical testing data. s.l. : Science direct, Polymer testing 26 (2007), 803 - 813, 2007.
63
38. Vantico, Huntsman -. TDS Araldit casting resin system CY225/HY925/SiO2. s.l. : Huntsman , 2000. 39. group, suter swiss-composite. katalog. www.swiss-composite.ch. [Online] 2010. [Cited: 02 14, 2010.] 40. 60270, IEC. High voltage test technique - Partial discharge measurements. s.l. : International standard, 2000. IEC60270/2000(e). 41. Reto Weder, Leo Ritzer. Vergleichende Untersuchungen an gereinigtem und ungereinigtem Hybridgewebe Polyester-Aramid (Kevlar) der Firma Tissa in Oberkulm. Baden-Dätwill (CH) : ABB CH-RD V1 , 2008. ABB CH-RD V1 2008-848. 42. Ashbee, Ken. Fundamentale principles of fiber reinforced composites. 1988. 43. Biron, Michel. Thermosets and composites. s.l. : Elvissier, 2004. 45. Electrical tree propagation along barrier-interfaces in epoxy resin. R. Vogelsang, R. Brütsch, T. Farr, K. Fröhlich. Switzerland : Conference on Electrical Insulation and Dielectric Phenomena, CEIDP 2002, Cancun, Mexico, 2002. 46. Manfredi, L.B. et al. Influence of the addition of montorillonite to the matrix of unidirectional glass fibre/epoxy composites on their mechanical and water absorption properties. s.l. : Comp. Part A. 39 (2008), 1726, 2008. 48. Gottfried W. Ehrenstein, Gabriela Riedel, Pia Trawiel. Thermal Analysis of plastics - Theory and practice. s.l. : Hanser. ISBN 1-56990-362-X. 50. Enhanced thermal conductivity of boron nitride epoxy-matrix composite through multi-modal particle size mixing.

64
9. APPENDIX
9.1. Appendix : Electrodes design
A numerical analysis using a software was performed to validate the dimensions and shape
of the electrodes and samples. Halves of the sample and setup are represented and used for calculation due to the symmetry. The electric field is represented using equilines (Figure 58, Figure 61 and Figure 64) and calculated along the edge of the electrodes (Figure 59, Figure 62 and Figure 65) and along the wall of the sample (Figure 60, Figure 63 and Figure 66). Three analyses were performed; analysis with a diameter of the lower edge of the electrode of 5mm and 10mm and a non-protruding plate; and an analysis with a diameter of the lower edge of 5mm and a protruding plate around the sample. The equilines show the homogeneity of the electrical field on the plate between the electrodes and then, the equilines follow barely the shape of the upper part of the electrodes. In order to avoid flashover, the electric field must be highest at the triple point (point situated at the outer edge of the contact surface between the wall of the sample and the electrode). In the three studies, this fact is respected which means that the samples are suitable for electrical breakdown measurements. With a protruding plate, the electric field exhibit a field enhancement (peaks) at the sharpened edge of the plate but this value is still lower than the triple points of the setup.

65
Electric field – 5% equilines Along the edge of the electrode Field/meter – E=1kV
Along the edge of the electrode Field/meter – E=1kV
Figure 58 : electric field calculation for fiber reinforced material - electrodes with a radius of 5mm
Figure 59 : Spectrum of the electric field along the walls - E=1kV - Radius=5mm
Figure 60 : Spectrum of the electric field along the edges of the electrode - E=1kV - Radius=5mm
Figure 61 : electric field calculation for fiber reinforced material - electrodes with a radius of 10mm
Figure 62 : Spectrum of the electric field along the walls - E=1kV - Radius=10mm
Figure 63 : Spectrum of the electric field along the edges of the electrode - E=1kV - Radius=10mm
Figure 64 : electric field calculation for fiber reinforced material -
Figure 65 : Spectrum of the electric field along the walls - E=1kV - Radius=5mm -
Figure 66 : Spectrum of the electric field along the edges of the electrode - E=1kV -
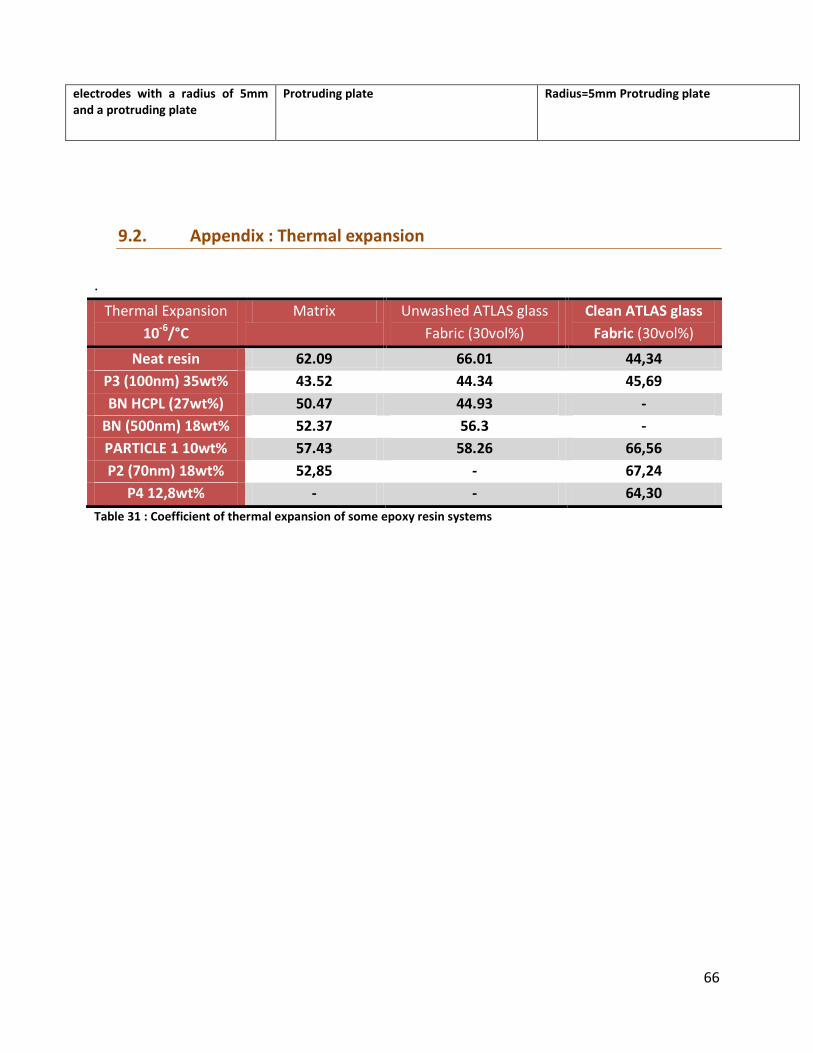
66
electrodes with a radius of 5mm and a protruding plate
Protruding plate Radius=5mm Protruding plate
9.2. Appendix : Thermal expansion
.
Thermal Expansion
10-6/°C
Matrix Unwashed ATLAS glass
Fabric (30vol%)
Clean ATLAS glass
Fabric (30vol%)
Neat resin 62.09 66.01 44,34
P3 (100nm) 35wt% 43.52 44.34 45,69
BN HCPL (27wt%) 50.47 44.93 -
BN (500nm) 18wt% 52.37 56.3 -
PARTICLE 1 10wt% 57.43 58.26 66,56
P2 (70nm) 18wt% 52,85 - 67,24
P4 12,8wt% - - 64,30
Table 31 : Coefficient of thermal expansion of some epoxy resin systems