reit accounting it’s an art not a science. carl t. berquist b deputy director of arthur andersen...
TRANSCRIPT

REIT Accounting It’s an Art REIT Accounting It’s an Art
Not a ScienceNot a Science

Carl T. BerquistCarl T. Berquist
Deputy Director of Arthur Andersen Deputy Director of Arthur Andersen (AA) Real Estate and Hospitality (AA) Real Estate and Hospitality Services Group (REHSG) WorldwideServices Group (REHSG) Worldwide
Head of AA Southeastern U.S. REHSG Head of AA Southeastern U.S. REHSG and Metropolitan Wash., D. C. REHSG and Metropolitan Wash., D. C. REHSG PracticePractice
National Association of Real Estate National Association of Real Estate Investment Trusts (NAREIT) - Associate Investment Trusts (NAREIT) - Associate Board MemberBoard Member

Carl T. BerquistCarl T. Berquist
ExperienceExperience• Initial and Secondary Public OfferingsInitial and Secondary Public Offerings• Assisting in various private real estate Assisting in various private real estate
capital raisescapital raises• Financial modeling, projections, Financial modeling, projections,
strategic planningstrategic planning

OverviewOverview
REITsREITs Market Performance IndicatorsMarket Performance Indicators
• FFOFFO• AFFOAFFO• FADFAD• EBITDAEBITDA• Debt to Market CapDebt to Market Cap
Performance AnalysisPerformance Analysis Application of Accounting PoliciesApplication of Accounting Policies

Real Estate Investment Real Estate Investment Trust (REIT)Trust (REIT)
Assets are primarily composed of Assets are primarily composed of real estate held for the long termreal estate held for the long term
Income mainly derived from real Income mainly derived from real estateestate
Pays out at least 95 percent of Pays out at least 95 percent of taxable income to shareholderstaxable income to shareholders
One level of taxationOne level of taxation Mutual fund for real estateMutual fund for real estate

Income TestsIncome Tests
Asset TestsAsset Tests
Widely HeldWidely Held
95% Distribution95% DistributionRequirementRequirement
REIT RulesREIT Rules
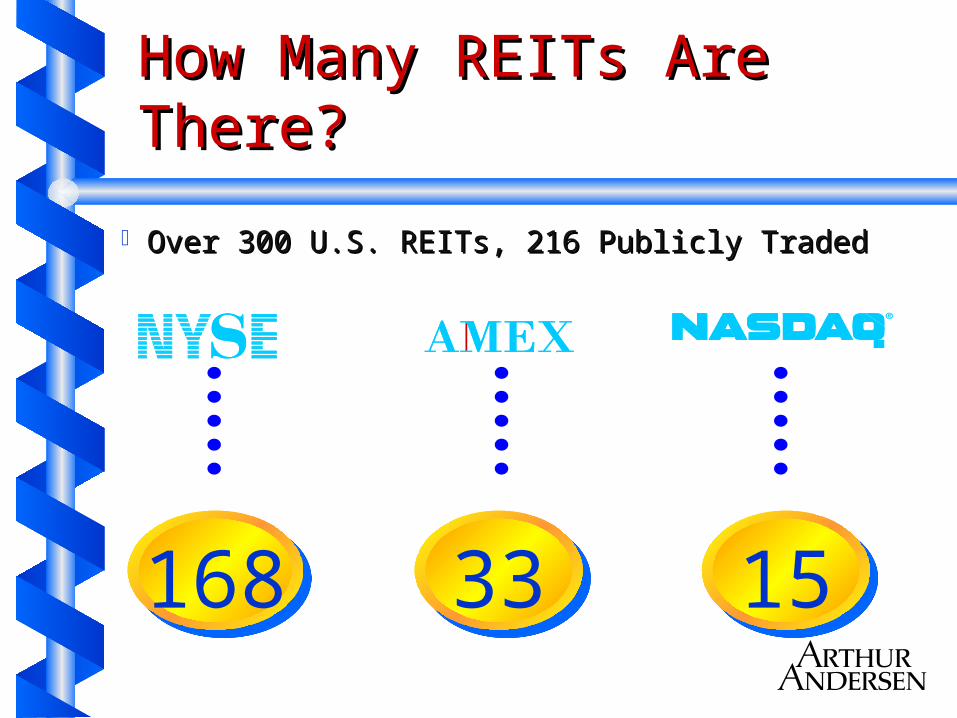
Over 300 U.S. REITs, 216 Publicly TradedOver 300 U.S. REITs, 216 Publicly Traded
168 33 15
How Many REITs Are How Many REITs Are There?There?

Annual Total REIT Security Annual Total REIT Security OfferingsOfferings
$ Billions$ Billions
010
20
30
4050
60
70
1990 1991 1992 1993 1994 1995 1996 1997 1998

Year-end Market Year-end Market CapitalizationCapitalization
$ Billions$ Billions
020406080
100120140160180
1990 1991 1992 1993 1994 1995 1996 1997 1998

REIT Advantages and REIT Advantages and DisadvantagesDisadvantages
AdvantagesAdvantages
No corporate income taxes No corporate income taxes paidpaid
Liquidity and access to capitalLiquidity and access to capital Public market pricingPublic market pricing Expert managementExpert management Strong institutional investor Strong institutional investor
interestinterest Growth opportunitiesGrowth opportunities Lower debt levelsLower debt levels Corporate governanceCorporate governance Independent analyst reviewIndependent analyst review Attractive returnsAttractive returns
DisadvantagesDisadvantages
Paying out 95%+ of net income Paying out 95%+ of net income reduces internal capital for growthreduces internal capital for growth
Pay-out requirements force Pay-out requirements force dependence on healthy capital dependence on healthy capital marketsmarkets
Operating businesses must be Operating businesses must be owned and operated outside of the owned and operated outside of the REITREIT
Being placed into “REIT Box” limits Being placed into “REIT Box” limits potential investor universepotential investor universe
Market expectations limit leverageMarket expectations limit leverage GAAP accounting issuesGAAP accounting issues

Revenues XXXXOperating Expenses (XXX)EBITDA XXXInterest Expense (XX)Funds From Operations XXXDepreciation & Other (XXX)Net Income XXXDebt Principal Amortization (XX)Normalized Cap Exp (XX)Tenant Improvements (XX)Depreciation & Other XXXFunds Available for Distribution XX
Dissecting the REIT Dissecting the REIT Income StatementIncome Statement
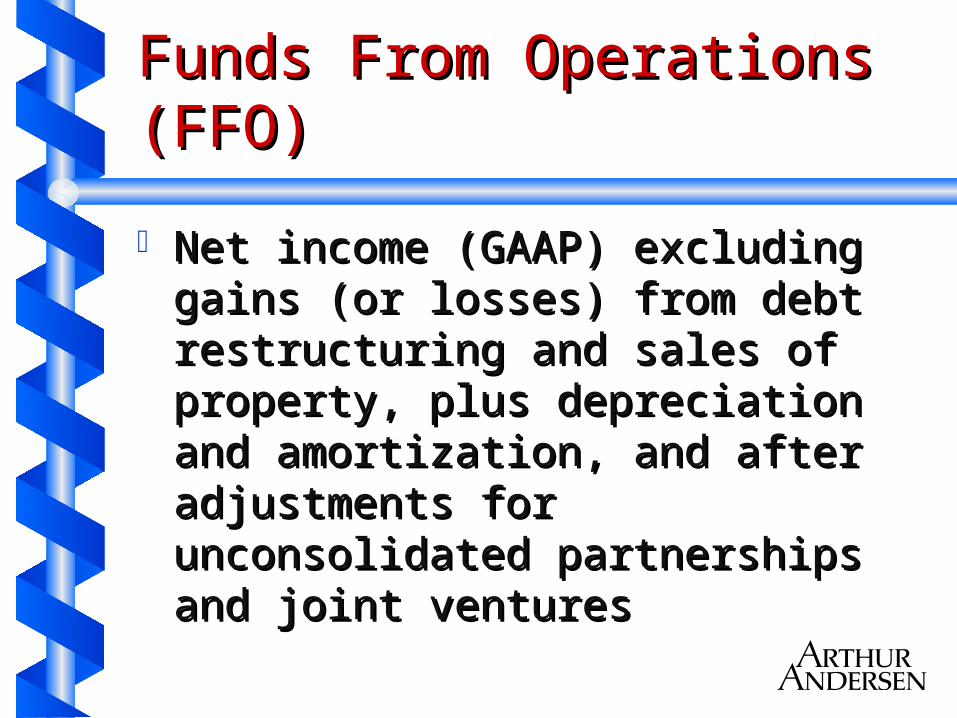
Funds From Operations Funds From Operations (FFO)(FFO)
Net income (GAAP) excluding gains Net income (GAAP) excluding gains (or losses) from debt restructuring (or losses) from debt restructuring and sales of property, plus and sales of property, plus depreciation and amortization, and depreciation and amortization, and after adjustments for after adjustments for unconsolidated partnerships and unconsolidated partnerships and joint venturesjoint ventures
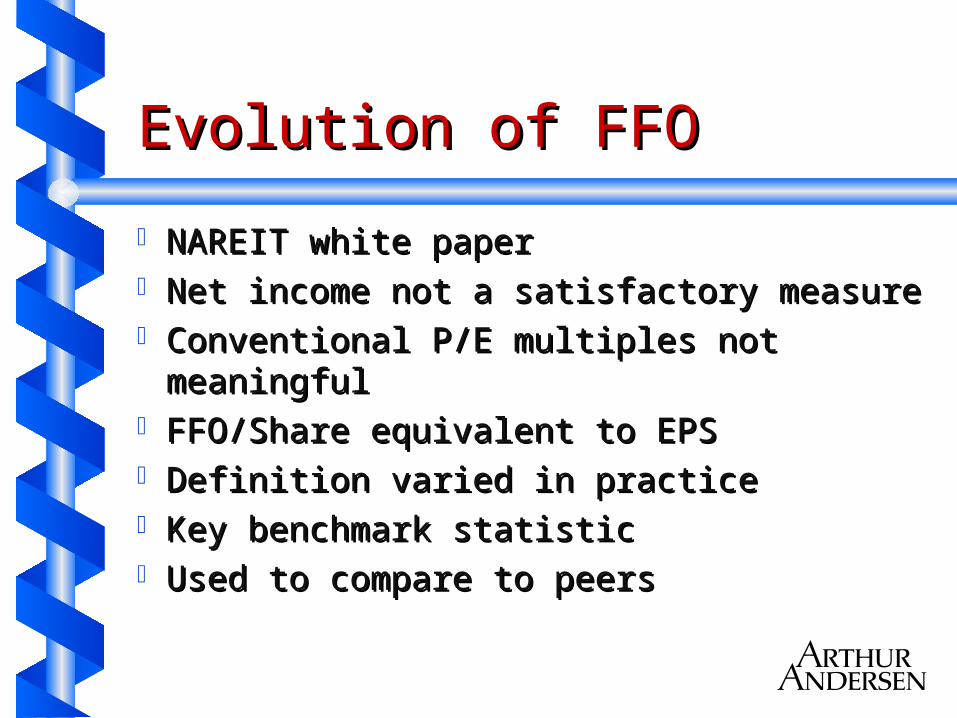
Evolution of FFOEvolution of FFO
NAREIT white paper NAREIT white paper Net income not a satisfactory measureNet income not a satisfactory measure Conventional P/E multiples not Conventional P/E multiples not
meaningfulmeaningful FFO/Share equivalent to EPSFFO/Share equivalent to EPS Definition varied in practiceDefinition varied in practice Key benchmark statisticKey benchmark statistic Used to compare to peersUsed to compare to peers

Key FFO Measurement Key FFO Measurement BenchmarksBenchmarks
Growth RatesGrowth Rates Payout Ratios (Dividends/FFO)Payout Ratios (Dividends/FFO) FFO MultiplesFFO Multiples

Growth RatesGrowth Rates
Done on a Per Share BasisDone on a Per Share Basis Compared to PeersCompared to Peers Quality of EarningsQuality of Earnings
• Core vs. Accounting GimmicksCore vs. Accounting Gimmicks• Accretive AcquisitionsAccretive Acquisitions
Payout RatiosPayout Ratios
Safety of DividendSafety of Dividend Retained CaptialRetained Captial

FFO MultiplesFFO Multiples
Similar to PE RatioSimilar to PE Ratio Drives Share PriceDrives Share Price
• Share Price/FF0 per Share = MultipleShare Price/FF0 per Share = Multiple The Industry Average is 10 - 12 TimesThe Industry Average is 10 - 12 Times Several Subjective VariablesSeveral Subjective Variables
• ManagementManagement• Business StrategyBusiness Strategy• LeverageLeverage• Quality of EarningsQuality of Earnings• Dividend GrowthDividend Growth• Payout RatioPayout Ratio

Maximum price a REIT can Maximum price a REIT can pay for $10 million in FFO pay for $10 million in FFO and not be dilutiveand not be dilutive
Company A B C D E
FFO Multiple 10.7 x 10.2 x 9.6 x 9.1 x 6.9 x
Breakeven PurchasePrice $107 mill $102 mill $96.0 mill $91.0 mill $69.0 mill
Cap Rate 9.3% 9.8% 10.4% 11.0% 14.5%

Adjusted Funds From Adjusted Funds From Operations (AFFO)Operations (AFFO)
FFO adjusted for straight-lining of FFO adjusted for straight-lining of rents, as well as a reserve for rents, as well as a reserve for recurring capital expenditures recurring capital expenditures (including tenant improvements)(including tenant improvements)
Similar to FADSimilar to FAD

Funds Available for Funds Available for Distribution (FAD)Distribution (FAD)
Another Type of Payout RatioAnother Type of Payout Ratio• Dividend / FADDividend / FAD
Highlights Safety of DividendHighlights Safety of Dividend Shows Ability to Grow DividendShows Ability to Grow Dividend
• The Lower the %, the Greater the The Lower the %, the Greater the Ability to GrowAbility to Grow
• More than 100% Shows the Dividend More than 100% Shows the Dividend Cannot be SustainedCannot be Sustained

Earnings Before Interest, Taxes, Earnings Before Interest, Taxes, Depreciation and Amortization Depreciation and Amortization (EBITDA)(EBITDA)
EBITDA/Interest CoverageEBITDA/Interest Coverage Ignores capital structureIgnores capital structure The higher the ratio the greater The higher the ratio the greater
the ability to growthe ability to grow Can always purchase EBITDACan always purchase EBITDA

Debt to Market Debt to Market CapitalizationCapitalization
Total Debt / (Debt + Equity Total Debt / (Debt + Equity Capitalization)Capitalization)
The Lower the Ratio, the Greater The Lower the Ratio, the Greater the Ability to Growthe Ability to Grow• Acquisitions can be leveragedAcquisitions can be leveraged• Expansions can be financedExpansions can be financed• Reduced Refinancing RiskReduced Refinancing Risk

Stock PriceStock Price
Quality EarningsQuality Earnings Growing FFOGrowing FFO Strong ManagementStrong Management Well Defined Growth Strategy Well Defined Growth Strategy Low Debt to Market CapLow Debt to Market Cap Ability to ExecuteAbility to Execute

Accounting “Gimmicks”Accounting “Gimmicks”
Capitalization vs. expense Capitalization vs. expense Straight-lining of rental revenueStraight-lining of rental revenue Tenant improvement costs vs. rental ratesTenant improvement costs vs. rental rates Off balance sheet financingOff balance sheet financing Off balance sheet venturesOff balance sheet ventures One time transactionsOne time transactions FFO adjustmentsFFO adjustments
• deferred finance feesdeferred finance fees• percentage rentpercentage rent• preferred returnspreferred returns• unusual itemsunusual items

ClarksonClarkson
Acquisition reservesAcquisition reserves Leverage (Mark-to-Market)Leverage (Mark-to-Market) FAD pay out ratioFAD pay out ratio

ClarksonClarkson
““The company continued its The company continued its innovative policy of renovating innovative policy of renovating apartments to fit specific tenant apartments to fit specific tenant needs and notes that this is a needs and notes that this is a growing source of revenue for the growing source of revenue for the future.”future.”
StatesStates
Tenant improvementsTenant improvements Income from joint venturesIncome from joint ventures Internal development costsInternal development costs Straight-lining of rentsStraight-lining of rents
AmericanAmerican
ReservesReserves Other adjustmentOther adjustment

Original PER SHAREFFO FAD Payout EBITDA
Company 1998 1997 % Inc. 1998 1997 1998 1997 % Inc. Debt-To-Mkt-Cap
Clarkson 0.79 0.60 32% 102 96 1.56 1.09 43% 60%
States 0.48 0.42 14% 91 90 0.80 0.62 29% 48%
American 0.38 0.32 19% 91 96 0.45 0.40 13% 19%
Performance IndicatorsPerformance Indicators
Adjusted PER SHAREFFO FAD Payout EBITDA
Company 1998 1997 % Inc. 1998 1997 1998 1997 % Inc. Debt-To-Mkt-Cap
Clarkson 0.69 0.60 15% 120 96 1.56 1.09 43% 60%
States 0.44 0.42 5% 98 90 0.80 0.62 29% 48%
American 0.34 0.32 6% 116 96 0.45 0.40 13% 19%

AmericanAmerican
As Reported As Adjusted
1998 1998
Funds From Operations 15,386 15,386
Deduct "Other" Adj. (1,456)
Adjusted FFO 13,930
Mortgage Principal Pay-downs (1,023) (1,023)
Normalized FF&E Replacement (822) (1,919)
Normalized Capital Expenditures (546) (546)
Funds Available for Distribution 12,995 10,442
FFO Per Share 0.38 0.34
FAD Payout 91 116

StatesStates
As Reported As Adjusted
1998 1998
Funds From Operations 6,155 6,155
Tenant Improvements Adj. (100)
Internal Leasing Costs (380)
Adjusted FFO 5,675
Mortgage Principal Pay-downs (407) (407)
Capital Expenditures and TI (106) (31)
Funds Available for Distribution 5,642 5,237
FFO Per Share 0.48 0.44
FAD Payout 91 98

ClarksonClarkson
As Reported As Adjusted
1998 1998
Funds From Operations 23,080 23,080
Mark-to-Market (2,100)
Acquisition Reserves Adj. (805)
Adjusted FFO 20,175
Mortgage Principal Pay-downs (2,457) (2,457)
Capital Expenditures and Ten. Imp. (2,802) (2,802)
Funds Available for Distribution 17,821 14,916
FFO Per Share 0.79 0.69
FAD Payout 102 120

REIT Accounting Its an ArtREIT Accounting Its an ArtNot a ScienceNot a Science
SummarySummary• There is no easy answerThere is no easy answer• Understand the numbersUnderstand the numbers• Research is criticalResearch is critical