relap5 model description and validation for the br2 loss
TRANSCRIPT

ANL/GTRI/TM-14/10
RELAP5 Model Description and Validation for the
BR2 Loss-of-Flow Experiments
Nuclear Engineering Division

About Argonne National Laboratory
Argonne is a U.S. Department of Energy laboratory managed by UChicago Argonne, LLC
under contract DE-AC02-06CH11357. The Laboratory’s main facility is outside Chicago,
at 9700 South Cass Avenue, Argonne, Illinois 60439. For information about Argonne
and its pioneering science and technology programs, see www.anl.gov.
DOCUMENT AVAILABILITY
Online Access: U.S. Department of Energy (DOE) reports produced after 1991 and a
growing number of pre-1991 documents are available free via DOE’s SciTech Connect
(http://www.osti.gov/scitech/)
Reports not in digital format may be purchased by the public from the
National Technical Information Service (NTIS):
U.S. Department of Commerce
National Technical Information Service
5301 Shawnee Rd
Alexandria, VA 22312
www.ntis.gov
Phone: (800) 553-NTIS (6847) or (703) 605-6000
Fax: (703) 605-6900
Email: [email protected]
Reports not in digital format are available to DOE and DOE contractors from the
Office of Scientific and Technical Information (OSTI):
U.S. Department of Energy
Office of Scientific and Technical Information
P.O. Box 62
Oak Ridge, TN 37831-0062
www.osti.gov
Phone: (865) 576-8401
Fax: (865) 576-5728
Email: [email protected]
Disclaimer
This report was prepared as an account of work sponsored by an agency of the United States Government. Neither the United States
Government nor any agency thereof, nor UChicago Argonne, LLC, nor any of their employees or officers, makes any warranty, express
or implied, or assumes any legal liability or responsibility for the accuracy, completeness, or usefulness of any information, apparatus,
product, or process disclosed, or represents that its use would not infringe privately owned rights. Reference herein to any specific
commercial product, process, or service by trade name, trademark, manufacturer, or otherwise, does not necessarily constitute or imply
its endorsement, recommendation, or favoring by the United States Government or any agency thereof. The views and opinions of
document authors expressed herein do not necessarily state or reflect those of the United States Government or any agency thereof,
Argonne National Laboratory, or UChicago Argonne, LLC.
This work is sponsored by the
U.S. Department of Energy, National Nuclear Safety Administration NNSA,
Office of Material Management and Minimization (M3) Reactor Conversion Program
ANL/GTRI/TM-14/10
prepared by
J.R. Licht1 and B. Dionne1 1Nuclear Engineering Division, Argonne National Laboratory
and
G. Van den Branden2, E. Sikik2 and E. Koonen2 2BR2 Reactor Department, SCK•CEN
July, 2015
RELAP5 Model Description and Validation for the BR2
Loss-of-Flow Experiments
ANL/GTRI/TM-14/10 2
Table of Contents
1 Introduction .......................................................................................................................................... 4
1.1 Scope ............................................................................................................................................. 5
2 RELAP5 Model Description ................................................................................................................... 5
2.1 General Considerations ................................................................................................................. 5
2.1.1 RELAP5 version ............................................................................................................................ 5
2.1.2 Solution method ......................................................................................................................... 6
2.1.3 Model layout ............................................................................................................................... 6
2.1.4 Coolant volumes ......................................................................................................................... 6
2.1.5 Heat structures ........................................................................................................................... 7
2.1.6 Material properties ..................................................................................................................... 7
2.2 Reactor vessel and internals ......................................................................................................... 8
2.3 Reactor vessel shroud ................................................................................................................... 9
2.4 Reactor channels ......................................................................................................................... 10
2.5 BR2 primary system (inside the pool) ......................................................................................... 13
2.6 BR2 primary system (outside the pool) ...................................................................................... 16
2.6.1 Primary piping ........................................................................................................................... 16
2.6.2 Heat exchanger ......................................................................................................................... 16
2.6.3 Primary Pump ........................................................................................................................... 16
2.6.4 Pressurizer ................................................................................................................................. 17
3 Model Calibration ............................................................................................................................... 17
3.1 Reactor Vessel ............................................................................................................................. 17
3.1.1 Calibration inside the core ........................................................................................................ 19
3.1.2 Calibration outside the core ..................................................................................................... 23
3.1.3 Calibration summary ................................................................................................................. 24
3.2 Primary system............................................................................................................................ 26
3.2.1 Pump coast down...................................................................................................................... 26
4 Loss-of-Flow and Loss-of-Pressure Simulations .................................................................................. 27
4.1 Test A .......................................................................................................................................... 28
4.2 Test C ........................................................................................................................................... 34
4.3 Test F ........................................................................................................................................... 36

ANL/GTRI/TM-14/10 3
5 Summary ............................................................................................................................................. 40
References .................................................................................................................................................. 41
Appendices ................................................................................................................................................ A-1
A Heat Structures ................................................................................................................................. A-1
A.1 Reactor vessel ........................................................................................................................... A-1
A.2 Reactor vessel cooling shroud .................................................................................................. A-4
A.3 Reactor vessel internal structures ............................................................................................ A-4
A.4 Reactor channels ....................................................................................................................... A-7
A.5 Reactor channel internals ......................................................................................................... A-9
A.6 RELAP5 channel heat structures (1963 core) .......................................................................... A-15
A.6.1 Average fuel channel ............................................................................................................ A-15
A.6.2 High heat flux fuel channel ................................................................................................... A-17
A.6.3 Plugged channel .................................................................................................................... A-19
B Hydraulic Volumes and Junctions ...................................................................................................... B-1
B.1 Bypass channel ........................................................................................................................... B-1
B.2 High heat flux fuel channel (1963 core) ..................................................................................... B-9
B.3 Average fuel channel (1963 core) ............................................................................................ B-12
B.4 Plugged channel (1963 core) ................................................................................................... B-13
B.5 Vessel Shroud ........................................................................................................................... B-16
C Power Specifications for 1963 Tests .................................................................................................. C-1
D Estimation of Peak Cladding Temperature Due to Flow Reversal .................................................... D-1

ANL/GTRI/TM-14/10 4
1 Introduction The US Government Highly Enriched Uranium (HEU) minimization effort is currently led by the National
Nuclear Security Administration (NNSA) through the Global Reduction Threat Initiative (GTRI). The
program includes developing of advanced Low Enriched Uranium (LEU) fuels along with supporting
design and safety analyses and has resulted in the successful conversion from HEU to LEU of a number
of research reactors around the world. As part of this initiative, the conversion of the SCK•CEN Belgian
Reactor 2 (BR2) was intensified in 2007.
BR2 is a research reactor used for radioisotope production and materials testing (Figure 1). It’s a tank-in-
pool type reactor cooled by light water and moderated by beryllium and light water. The reactor has a
single primary loop containing a set of primary pumps and heat exchangers to control the coolant inlet
temperature (~37oC) and flow rate (variable). A pressurizer maintains the vessel inlet pressure at
1.38 MPa. In case of an accident, there are two isolation valves that can isolate the reactor core. A
bypass valve can open to assist natural circulation flow through the core. A pool connection valve is
available to connect the primary loop to the pool. The reactor core is located inside an aluminum
pressure vessel that contains 79 channels in a hyperboloid configuration. Outside the core region the
channels are stainless steel tubes; however, in the core region the channels are comprised of hexagonal
beryllium with a central circular bore. The core configuration is highly variable as each channel can
contain a fuel assembly, a control or regulating rod, an experimental device, or a beryllium or aluminum
plug. Normally the coolant flow is downward and enters the channels through perforations in the
channel walls located above the core region. The coolant exits the end of the channel at the lower
support grid. Coolant can also bypass the core through gaps and cooling holes in the beryllium matrix as
well as the gap between the outer edge of beryllium matrix and the pressure vessel.
Figure 1 Conceptual drawing of BR2.

ANL/GTRI/TM-14/10 5
1.1 Scope In support of converting the BR2 research reactor from HEU to LEU fuel, the code RELAP5/Mod 3.3 [1]
was used to simulate several Loss-of-Flow Accident (LOFA) with or without loss-of-pressure scenarios.
Because the configuration of the core is variable, a representative core configuration has been defined
for the fuel conversion analyses (Figure 2) [2]. However, in order to assure credibility of the predicted
results, simulations have been performed for the 1963 core configuration for comparison with a number
of LOFA experiments that were performed in the BR2 reactor. Additionally, experimental data was also
available for steady-state flow and pressure distributions in both the BR2 facility (1962) and a hydraulic
mock-up facility for various core configurations. This data was used to generate the generic minor loss
coefficients applied to the RELAP5 model to obtain the proper channel flow rates and reactor pressure
distributions suitable for any given core configuration.
This paper presents a description of the RELAP5 model, the calibration method used to obtain the minor
loss coefficients from the available hydraulic data and the LOFA simulation results compared to the 1963
experimental tests for HEU fuel.
Figure 2 The 1963 and representative core configurations.
2 RELAP5 Model Description
2.1 General Considerations A detailed description of the structures, volumes and their connections used in the current RELAP5
model is quite lengthy so only summary of this information is provided in Section 2. A detailed
description of the RELAP5 heat structures and their thermal connections is given in Appendix A.
Appendix B contains a detailed description of the RELAP5 coolant volumes and their junctions.
2.1.1 RELAP5 version
The model described in this document was developed for RELAP5/Mod 3.3 [1]. Throughout the
remainder of this document, RELAP5/Mod 3.3 will be referred to as RELAP5.

ANL/GTRI/TM-14/10 6
2.1.2 Solution method
The options selected for running the RELAP5 simulations summed to control option 7, which means the
following options have been implemented:
The hydrodynamics advancement setting was selected; it uses a mass error analysis to control
the time step between the minimum and maximum time step (set to 1.1e-12 s and 0.1 s,
respectively).
The heat conduction/transfer time step was set to be the same as the hydrodynamic time step.
The heat conduction/transfer and hydrodynamics were coupled implicitly for the transient
simulation. Note that the explicit method was used to achieve steady-state conditions before
switching to the implicit method.
2.1.3 Model layout
The RELAP5 model can be thought of as being separated into three parts; the reactor vessel, the primary
coolant system within the pool and the primary coolant system outside the pool. The model of the
primary coolant system within the pool has been modernized by the BR2 team and is described in [3].
The model of the primary coolant system outside the pool has only received a limited number of
changes and simplifications relative to previous ANL and BR2 versions of the BR2 model. These changes
have been described in this document. The reactor vessel model has been modernized by the
conversion team at Argonne National Laboratory (ANL) and is described in detail in this document.
2.1.4 Coolant volumes
Coolant volumes within the reactor vessel model were largely based on the data extracted from
previous RELAP5 models and confirmed by comparison with legacy notes provided by BR2. Where
applicable, updated values have been used based on the data provided in more recent BR2 design
description documents (e.g. [4]). Default parameters for coolant volumes and junctions within the
reactor vessel are given here:
The volume control flags tlpvbfe for pipe and
snglvol components were by default set to
0000000:
t=0: no thermal front tracking
l=0: no mixture level tracking
p=0: water packing scheme used
v=0: vertical stratification model used
b=0: pipe interphase friction model
used
f=0: wall friction along x-axis calculated
e=0: non-equilibrium model used
The junction control flags efvcahs for pipe and
sngljun component were by default set to
0001000:
e=0: modified PV term not used
f=0: CCFL model not applied
v=0: option not available
c=1: choking model not applied
a=0: smooth area change
h=0: non-homogeneous model applied
s=0: momentum flux both to and from
volume
For pipes, the hydraulic diameter and area for the internal junctions of all volumes were by default set
to 0 (internally calculated).

ANL/GTRI/TM-14/10 7
To be consistent with previous models, the wall roughness for the internal surface of the reactor
channels was specified as 1.6e-6 and the wall roughness for the remainder of the reactor vessel was
specified as 3.2e-6. These values are not expected to significantly affect RELAP5 simulation results.
Exceptions to the above default parameters are discussed in the applicable sections below.
2.1.5 Heat structures
Heat structures were included for most of the components within the reactor pool. Heat structures
throughout the reactor vessel model were discretized into 3 radial regions (4 nodes). Heat structures
containing fuel where discretized into 9 radial regions (10 nodes), 3 for each of the cladding faces and 3
for the fuel. The following default parameters were set for the heat structure components without heat
generation:
the 9 word format was selected
convection boundary = 101 (default convection correlations)
heat transfer hydraulic diameter = 0 (i.e. same as volume hydraulic diameter)
the forward and reverse heated length = >100 (i.e. neglect entrance effects)
forward and reverse loss coefficients = 0 (not required for current geometry)
local boiling factor = 1.0 (no heat generation)
The following additional parameters were set for the heat structure components with heat generation:
the 12 word format was selected
natural circulation length1 = 0.762 m
2.1.6 Material properties
ses presented in this document.
Table 1 provides a summary of the material properties for use in the RELAP5 model [5]. The fresh HEU
fuel (UAlx-Al) and long irradiated beryllium properties were used in the analyses presented in this
document.
Table 1 Material Properties used in the RELAP5 model [5].
RELAP5 #
Material Applies to: Density Specific Heat
Heat Capacity Thermal Conductivity
[kg/m3] [J/kg-K] [J/m
3-K] [W/m-K]
1* AG3NE cladding 2670 880 2.3496e6 130
2* Al 6061-T6 structure 2700 896 2.4192e6 167
3* UAlx-Al Fresh fuel 3580 646 2.3124e6 80
4 UAlx-Al B=25% 3580 646 2.3124e6 69
5 U-7Mo-Al Fresh fuel 9870 275 2.7143e6 66
6 U-7Mo-Al B=25% 9870 275 2.7143e6 41
7* Be Unirradiated 1836 1925 3.5343e6 149
8 Be Long irradiation 1836 1925 3.5343e6 50
1 Heat generation has only been specified in heat structures for the same length as the active fuel region (0.762 m).
No heat generation has been specified above or below fuel region.

ANL/GTRI/TM-14/10 8
9* SS 304L Vessel etc. 8000 500 4.0000e6 16
*Used in the current RELAP5 model
2.2 Reactor vessel and internals A conceptual drawing of the reactor vessel and its internal components, as modeled in RELAP5, is shown
in Figure 3. The details of the components were obtained from Ref. [4] as well as notes describing
previous RELAP5 models.
The main bodies of the vessel (structures 101 through 105) were modeled as aluminum cylinders where
the inner diameters were based on the internal volumes and heights and the outer diameters were
specified to conserve the structure volumes2. The covers at the top and bottom of the vessel (structure
100 and 106, respectively) were specified as stainless steel with a spherical geometry.
The internal vessel components included the flow diffuser (120), channel supports (140 and 201), the
flow guide (202) and the support grid (203 and 220).
2 The wall thickness of the pressure vessel structures specified in the RELAP5 model will be slightly different than
the actual values.

ANL/GTRI/TM-14/10 9
Figure 3 Heat structure numbers in the RELAP5 model of the BR2 reactor vessel and internal
structures.
2.3 Reactor vessel shroud The geometrical data for the pressure vessel outer wall and shroud inner wall were extracted from the
figures in Ref. [4] and are plotted here in Figure 4 (the shroud outer wall has not been included in the
RELAP5 model). The cooling shroud was described as a single coolant pipe (RELAP5 #166) discretized
into 31 axial volumes (annular cylinders). The discretization was in part to take advantage of the
reactors convenient geometrical shapes for creating the model (Figure 4: blue numbers and blue vertical
dashes). For example, the total coolant volume for RELAP5 volume 166-1 was determined from volume
equations for a cylinder and/or conical frustum utilizing dimensions of the vessel and shroud at that
location. The total surface area was determined in a similar manner and the two values were used to
obtain a hydraulic diameter (hydraulic diameter =volume
surface area). Although not evident in the figure, there is a
flow constriction between the shroud and reactor vessel at junction 4 and 27. The abrupt area change
model was applied at these locations.
The heat structure connections are also shown (Figure 4: red numbers and colored background). For
example, the shroud coolant volumes 166-1 and 166-2 are thermally connected to pressure vessel heat
structure number 105. The axial discretization in the core region (i.e. volumes 5-26) was based on the
fuel element discretization to simplify thermal connections at that elevation within the model.
A time dependent volume has been placed at each end of the cooling shroud. The outlet pressure was
specified as 1.94e5 Pa and the inlet temperature and flow rate were specified as 33oC and 111 kg/s.

ANL/GTRI/TM-14/10 10
Figure 4 Shroud dimensions and discretization.
2.4 Reactor channels In order to appropriately model the BR2 channels and maintain a simplified RELAP5 model, the 79
channels (80 including the bypass flow) have been consolidated into four representative flow channels
(Figure 5); including the bypass flow (volumes 10-20), a single flow channel containing the highest heat
flux fuel assembly (volumes 30-40), the remaining fuelled flow channels (volumes 50-60) and all
remaining non-fuelled flow channels (volume 70-80). The volume containing the highest heat flux fuel
assembly (volume 36) was further discretized (volumes 360, 365, 366, and 367) to better represent
individual sub-channels associated with the fuel plates (Figure 6). The geometry was based on the
Sylcor VIn fuel assembly used in the 1963 BR2 experiments (Table A-15). Previous work has shown that
3 explicit sub-channels are sufficient to predict the peak cladding temperature in a LOFA simulation [6].
The sub-channels represent only a 10 degree arc of the sector to properly model the azimuthal power
peak-to-average ratio. Computational fluid dynamic (CFD) simulations [7] have demonstrated the
validity of this approximation for both normal operation and natural circulation since both azimuthal
coolant mixing and azimuthal heat conduction in the fuel plate are relatively small.
ANL/GTRI/TM-14/10 11
Figure 5 Coolant volume numbers in the RELAP5 model of the BR2 Reactor Vessel.
ANL/GTRI/TM-14/10 12
Figure 6 Discretization of the high heat flux Silcor VIn fuel assembly.
The four flow channels have been discretized into six axial sections: one volume for the section of
channel located in the upper plenum (Volumes 10, 30, 50 and 70); one volume for the perforated
section of channel above the upper channel support (Volumes 12, 32, 52 and 72); one volume for the
section of channel above the core but below the upper channel support (Volumes 14, 34, 54 and 74).
Within the core region the coolant volumes were described using pipe components and were discretized
using the same axial nodalisation as the fuel heat structure as illustrated in Figure 6. That is, 20
segments were used to describe the fuelled region with an additional sub-volume at the top and bottom
end to describe the non-fuelled part of the fuel assembly (total of 22 segments). Previous work [6] has
shown that this level discretization is sufficient for a mesh independent solution of peak cladding
temperatures. Below the core region the channels were split into two regions; one volume between the
core and the lower support guide (Volumes 18, 38, 58 and 78) and another for the remainder of the
channel (Volumes 20, 40, 60 and 80).
Cross flow occurs between the bypass channel and the other three channels through a number of
channel perforations in three different axial regions. The hydraulic diameter of the perforations above
the channel supports was 6.35 mm and the respective flow areas depends on the number of reactor
channels associated with each of the RELAP5 channels. The hydraulic diameter of the perforation in the
segment just above the core was 4.76 mm in the fuelled section. The hydraulic diameter for the plugged
channel perforations in the 1963 experiments was 5.56 mm but is dependent on the core configuration
since the value is determined from a consolidation of different channel types with different number of
perforations and diameters.
Form loss coefficients and the abrupt area change model were included at various locations of the
model and are described in detail in Appendix B.
As described earlier, the channels form a hyperboloid configuration where only the center channel is
vertical and the off axis angle increases to ~10 degrees at the outermost channels. For simplicity, each
of the channels has been modeled as vertical. This was done for two reasons. First, if the angles were
included, updating the model for different core configurations requires updating almost all of the

ANL/GTRI/TM-14/10 13
RELAP5 parameters that make up the channel volumes and heat structures. Modeling the channels
vertically significantly limits the parameters that must be updated and reduces the likelihood for error in
transcribing parameters. Second, the small offset from vertical does not influence the heat transfer or
flow regime models used within RELAP5. The only impact is the small discrepancy between actual and
projected lengths of components within each axial region, which is not expected to significantly affect
simulation results.
The heat structures describing the channels outside the core region were modeled as stainless steel
cylinders with their respective inner and outer diameter. The geometry for the hexagonal part of the
channels within the core was based on the bore diameter of the channel. The outer diameter was based
on a tube thickness that resulted in the same volume of channel material. The components inside the
channels were modeled as two cylinders with the outer diameter chosen to conserve beryllium and
aluminum volumes, respectively. The fuelled channels contained a single plate structure to represent
the fuel element. As shown in Figure 6, the high heat flux channel contained four plate structures to
capture the local power peaking.
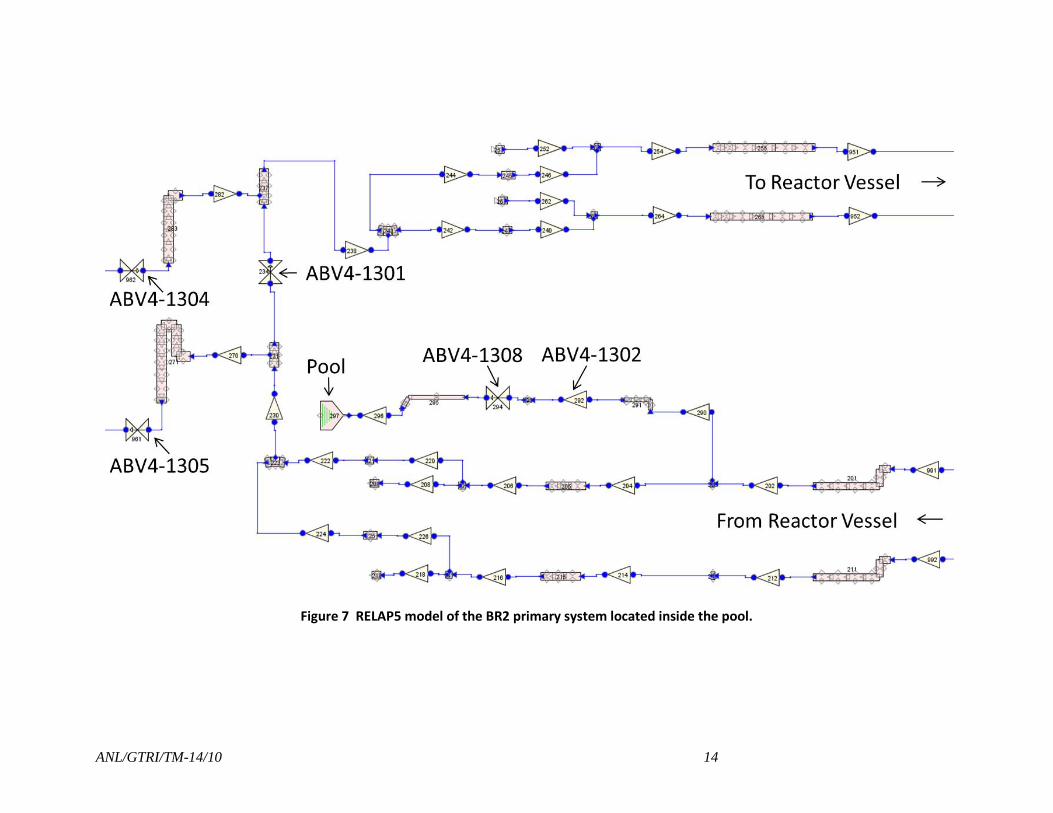
2.5 BR2 primary system (inside the pool) The RELAP5 model describing the section of primary piping located between the isolation valves and
reactor vessel (Figure 7) has been updated and documented separately by the BR2 team [3]. The only
modification used in the model described here was the replacement of junction 294 with a valve
describing the pool connection valve (ABV4-1308). The pool connection valve was connected to a time
dependent volume (100) that represents the pool (infinite energy sink). Heat structures in contact with
the pool were also thermally connected to this time dependent volume. The fluid conditions for the
pool were specified as 1.94e5 Pa and 25oC.
ANL/GTRI/TM-14/10 14
Figure 7 RELAP5 model of the BR2 primary system located inside the pool.
ANL/GTRI/TM-14/10 15
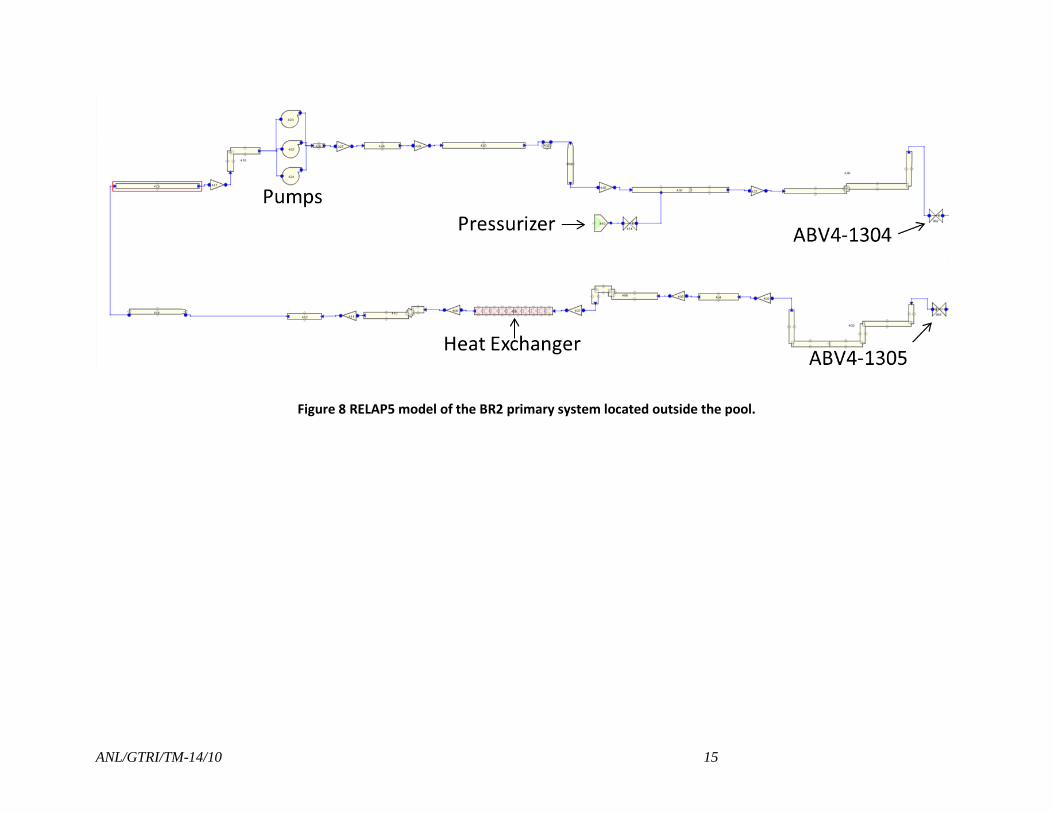
Figure 8 RELAP5 model of the BR2 primary system located outside the pool.

ANL/GTRI/TM-14/10 16
2.6 BR2 primary system (outside the pool)
2.6.1 Primary piping
The BR2 primary system is shown in Error! Reference source not found.. The piping and components
ssociated with the backup pump system has not been included in the current model since it does not
significantly contribute to the simulations. The remainder of the piping has remained unchanged from
previous RELAP5 models. Also, as in previous models, heat structures have not been defined for
components outside the reactor pool (except for the heat exchanger).
2.6.2 Heat exchanger
The primary heat exchanger system utilized during the 1963 experiments consisted of three parallel
banks each containing three heat exchangers. The rated values for a bank of heat exchangers were
provided in Chapter 9.8 of the BLG 59 report [8] and are summarized here in Table 2. The values
represent a significant change from the heat exchanger model provided in previous RELAP5 models3.
Table 2 Heat exchanger rated values, per bank [8].
Flow rate [m3/min] and [kg/s] 35 / 581
Tube length [m] 11.75
Surface Area [m2] 1053
Velocity [m/s] 2
Pressure drop [Pa] 98066.5
Calculated values based on above info
Number of tubes 2191
Average tube diameter [m] 0.01302
Flow area [m2] 0.2917
A minor loss coefficient value of 5.7 was added to the inlet and outlet heat exchanger junctions to match
the rated pressure drop.
The secondary side of the heat exchanger was modeled with a constant heat transfer coefficient
(1e9 W/m2-K) and bulk temperature (306.22 K) boundary condition. These values produce inlet coolant
temperature in the range of 36oC-38oC for simulations of tests A, C and F.
2.6.3 Primary Pump
The BR2 primary system contains three main pumps operating in parallel. Their specifications were
provided in chapter 9.2.1.1 of BLG 59 [8] and are summarized here in Table 3.
Table 3 Parameters for the BR2 main pumps.
Parameter Rated Value [8] RELAP5 Value
Speed 1430 [RPM] 149.75 [rad/s]
Flow 35 [m3/m] 0.5833 [m3/s]
Head 76.2 [m] 76.2 [m]
Torque 2754 [lbf-ft] 3734.6 [N-m]
Moment of Inertia 230 [kg-m2] 230 [kg-m2]
3 It is possible that the heat exchanger model used in previous RELAP5 models was based on the heat exchanger
system implemented in 1971, although this has yet to be confirmed.
ANL/GTRI/TM-14/10 17
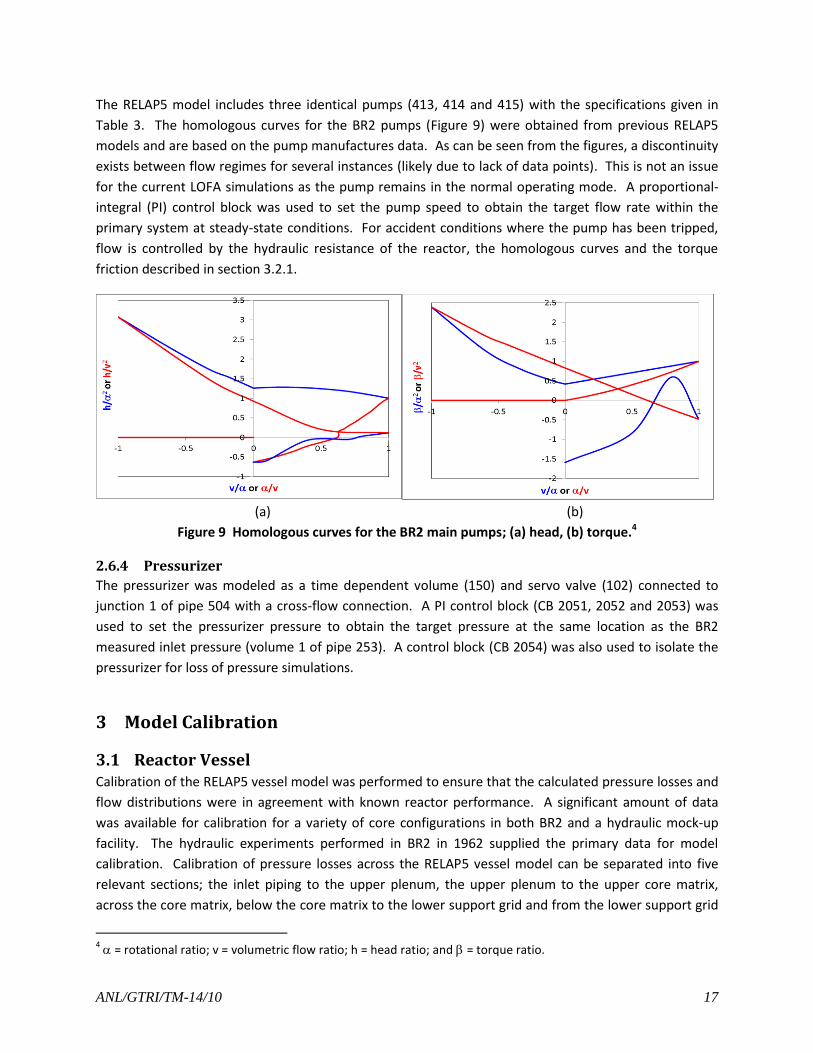
The RELAP5 model includes three identical pumps (413, 414 and 415) with the specifications given in
Table 3. The homologous curves for the BR2 pumps (Figure 9) were obtained from previous RELAP5
models and are based on the pump manufactures data. As can be seen from the figures, a discontinuity
exists between flow regimes for several instances (likely due to lack of data points). This is not an issue
for the current LOFA simulations as the pump remains in the normal operating mode. A proportional-
integral (PI) control block was used to set the pump speed to obtain the target flow rate within the
primary system at steady-state conditions. For accident conditions where the pump has been tripped,
flow is controlled by the hydraulic resistance of the reactor, the homologous curves and the torque
friction described in section 3.2.1.
(a) (b)
Figure 9 Homologous curves for the BR2 main pumps; (a) head, (b) torque.4
2.6.4 Pressurizer
The pressurizer was modeled as a time dependent volume (150) and servo valve (102) connected to
junction 1 of pipe 504 with a cross-flow connection. A PI control block (CB 2051, 2052 and 2053) was
used to set the pressurizer pressure to obtain the target pressure at the same location as the BR2
measured inlet pressure (volume 1 of pipe 253). A control block (CB 2054) was also used to isolate the
pressurizer for loss of pressure simulations.
3 Model Calibration
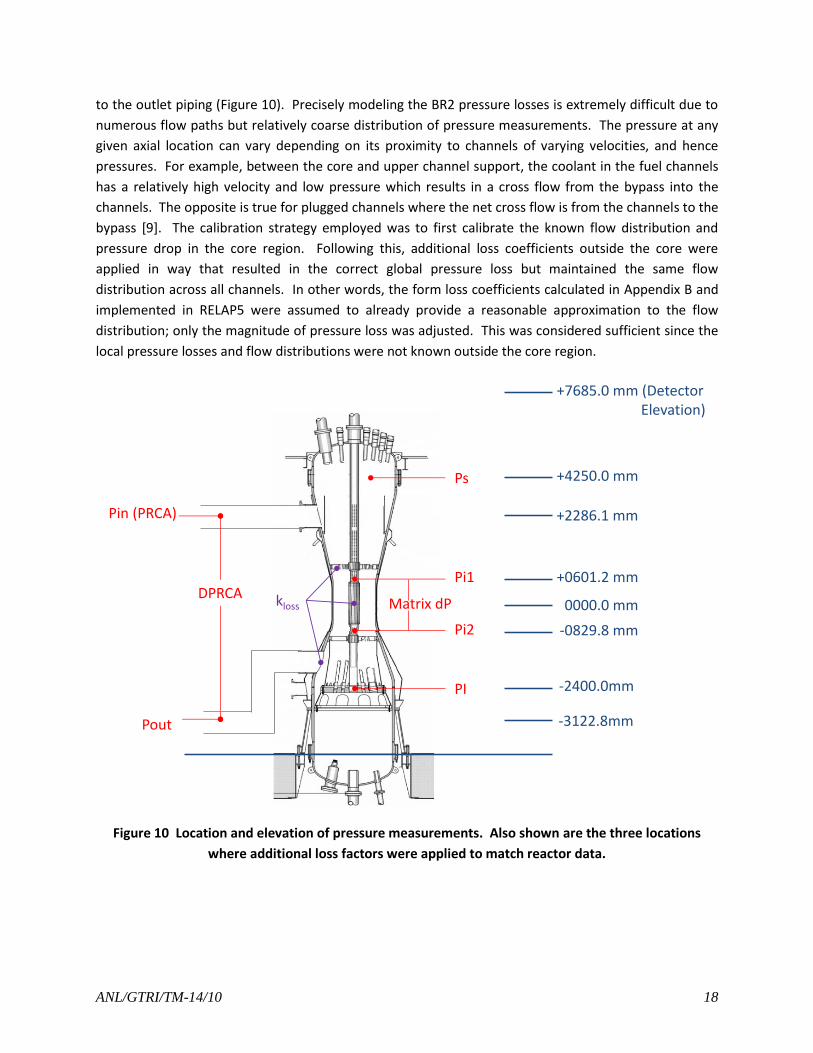
3.1 Reactor Vessel Calibration of the RELAP5 vessel model was performed to ensure that the calculated pressure losses and
flow distributions were in agreement with known reactor performance. A significant amount of data
was available for calibration for a variety of core configurations in both BR2 and a hydraulic mock-up
facility. The hydraulic experiments performed in BR2 in 1962 supplied the primary data for model
calibration. Calibration of pressure losses across the RELAP5 vessel model can be separated into five
relevant sections; the inlet piping to the upper plenum, the upper plenum to the upper core matrix,
across the core matrix, below the core matrix to the lower support grid and from the lower support grid
4 = rotational ratio; v = volumetric flow ratio; h = head ratio; and = torque ratio.
ANL/GTRI/TM-14/10 18
to the outlet piping (Figure 10). Precisely modeling the BR2 pressure losses is extremely difficult due to
numerous flow paths but relatively coarse distribution of pressure measurements. The pressure at any
given axial location can vary depending on its proximity to channels of varying velocities, and hence
pressures. For example, between the core and upper channel support, the coolant in the fuel channels
has a relatively high velocity and low pressure which results in a cross flow from the bypass into the
channels. The opposite is true for plugged channels where the net cross flow is from the channels to the
bypass [9]. The calibration strategy employed was to first calibrate the known flow distribution and
pressure drop in the core region. Following this, additional loss coefficients outside the core were
applied in way that resulted in the correct global pressure loss but maintained the same flow
distribution across all channels. In other words, the form loss coefficients calculated in Appendix B and
implemented in RELAP5 were assumed to already provide a reasonable approximation to the flow
distribution; only the magnitude of pressure loss was adjusted. This was considered sufficient since the
local pressure losses and flow distributions were not known outside the core region.
Figure 10 Location and elevation of pressure measurements. Also shown are the three locations
where additional loss factors were applied to match reactor data.
DPRCA
Ps
Pi1
Pi2
PI
Pin (PRCA)
Pout
Matrix dP
+2286.1 mm
+4250.0 mm
+7685.0 mm (DetectorElevation)
-2400.0mm
+0601.2 mm
-3122.8mm
0000.0 mm
-0829.8 mm
kloss

ANL/GTRI/TM-14/10 19
3.1.1 Calibration inside the core
Tests performed in a hydraulic mockup facility contained data for the flow distribution between the
bypass, fuel, control rod and plugged channels for eight different core configurations at an average flow
rate of 2200 l/min within a fuel element5 [10]. Reference [10] provided a detailed description of the
coolant as it flows through various paths within the BR2 vessel and used detailed calculations to explain
the direction of flow and predict the axial pressure distributions. This information was used in the
development of an experimental program for measuring pressure distributions within BR2 (designated
as the 1962 experiments). This reference also provided these experimental results for different total
flow rates and core loadings of 3, 6, 14, 17, and 24 fuel elements (the remainder of the core included
beryllium plugs). Highlights from these and other experimental results were summarized in
Reference [9] and Table 4 for a pressure drop of 2.1 kg/cm2 across the core.
Table 4 Summary of flow rates for a given channel type.
Channel Type Channel Contents Flow Rate
Standard channel (84 mm) with beryllium plug 256 l/min 4.3 kg/s
with fuel element type VIn 2140 l/min 35.6 kg/s
with control rod 442 l/min 7.3 kg/s
H Channel (200 mm) with beryllium plug 1352 l/min 22.5 kg/s
Reflector Channel (50 mm) with beryllium plug 135 l/min 2.2 kg/s
Of note is that Ref. [9] and [10] do not provide a reference flow rate for the bypass channel. It was
reported in [10], that for nominal conditions, the flow rate in BR2 was measurably larger than the
hydraulic facility (1261 kg/s compared to 1166 kg/s). The reasons for this were attributed to dimensional
tolerance, surface roughness and differences in the diameter, distance and number of holes in the upper
extension tubes [10]. Based on the reported information it seems that this discrepancy in total flow has
been attributed to the bypass flow. For the hydraulic facility, the bypass flow was reported as 227.2
kg/s for all core configurations. The bypass flow for the BR2 1962 tests of different core configurations
was estimated to be 361.6 ± 26.7 kg/s based on the difference between total measured flow and the
sum of what was expected for each channel type at nominal flow conditions.
Calibration of the core in the RELAP5 vessel model was accomplished by adding forward loss coefficients
in channels 16, 360, 365, 366, 367, 56 and 76 so that the flow distributions and pressure drop matched
those of nominal conditions. The reverse loss coefficients were assumed to be identical.
The following steps were followed in this calibration process: first, the RELAP5 model was run with the
minor loss coefficients set to zero to establish the pressure losses within the core region, the pressure
losses into and out of the core region, and the channel flow rates. The channel mass flow rates and
their respective pressure losses were then used as input to a separate core hydraulic model based on
steady state equations (designated as the EES model). This EES model contains pressure loss equations
to describe friction losses within the core channels and two additional loss coefficients. Of these later
two, the first is used to match the EES model results to the RELAP5 results without minor loss
5 Private communication with BR2 engineers indicates there was a discrepancy in the reported bypass flow (14000
l/min versus 13360 l/min). The correct value is 13360 l/min.

ANL/GTRI/TM-14/10 20
coefficients and the second is used to determine the loss coefficients needed to match both models to
the BR2 1962 data. The loss coefficient needed to match the EES model to the RELAP5 results was small
in value and mainly accounts for differences between friction factor models. For example, RELAP5 uses
the Colebrook relation [11] for determining the friction factor while the EES model uses its built-in
Churchill relation [12]. With the channel inlet and outlet pressures and flow distribution results from
the RELAP5 model input into the EES model, the first of the two additional loss coefficients was
determined; putting the two models in exact agreement regarding pressure losses and mass flow rates
for each channel. Next, the target mass flow rates and pressure drop data were input into the EES
model and the equations were solved to determine the second of the required loss coefficients. These
loss coefficients were evenly distributed across the 21 internal junctions for each of the core volumes
(i.e. within volumes 16, 360-367, 56, 76). The RELAP5 model was then run again to verify the correct
pressure drop and mass flow distribution were correct.
In reality, the pressure losses for each channel type are not actually identical nor are they known a
priori. In determining the loss coefficients needed to reproduce the experimentally measured flow
rates, an average pressure drop across the core was used as a reference in preliminary calculations. By
itself, the predetermined loss coefficients were only accurate enough to achieve +/- 4% agreement
between the RELAP5 flow rates and the experimentally measured values. To improve upon this, the
ratio of the individual channel pressure drop and average channel pressure drop from the first RELAP5
simulations were imposed on the respective channels in the second EES calculation to achieve an
approximation to the expected differences in pressure drop. In this case, the target pressure drop of
2.1 kg/cm2 was imposed on the high heat flux channel while the other channels were slightly above or
below this value (as predicted by RELAP5). This approach resulted in improving the flow rate accuracy
to better than +/- 1% for all channels.
Core calibration results for the 3, 14 and 24 element core configurations of the 1962 experiments are
given in Table 5. The correct flow rates for each channel were obtained. It is also important to point out
that the loss coefficient for a given channel is independent of the core configuration, except for volume
16. This is in agreement with test results that show that for nominal conditions the flow rate of each
channel is independent of the core configuration. The loss coefficient of volume 16 varies significantly
since, as stated earlier, this channel contains all of the flow uncertainty.

ANL/GTRI/TM-14/10 21
Table 5 Loss coefficients determined for a 3, 14 and 24 element core. The average values are also
given.
1962 BR2 test with 3 fuel elements
RELAP5 #
Estimated k_loss
Target flow
Calculated flow
% Difference
[-] [kg/s] [kg/s] [%]
16 2.256 380.4 381.7 +0.34
360 0.4829 35.09 35.23 +0.39
365 0.7081 0.1681 0.1689 +0.48
366 0.7200 0.1915 0.1924 +0.47
367 1.2720 0.2531 0.2549 +0.71
36 35.7 35.8 +0.42
56 0.5202 71.3 71.7 +0.56
76 3.8200 395.4 393.6 -0.46
1962 BR2 test with 14 fuel elements
RELAP5 #
Estimated k_loss
Target flow
Calculated flow
% Difference
[-] [kg/s] [kg/s] [%]
16 4.001 324.4 325.8 +0.43
360 0.4794 35.09 35.14 +0.14
365 0.7048 0.1681 0.1684 +0.18
366 0.7168 0.1915 0.1919 +0.21
367 1.2690 0.2531 0.2542 +0.43
36 35.7 35.8 +0.15
56 0.5075 463.7 464.8 +0.24
76 3.72 348.5 345.6 -0.83
1962 BR2 test with 24 fuel elements
RELAP5 #
Estimated k_loss
Target flow
Calculated flow
% Difference
[-] [kg/s] [kg/s] [%]
16 2.614 395.5 395.8 +0.08
360 0.4733 35.09 35.16 +0.20
365 0.6979 0.1681 0.1686 +0.30
366 0.7099 0.1915 0.1920 +0.26
367 1.2630 0.2531 0.2544 +0.51
36 35.7 35.8 +0.21
56 0.4973 820.3 822.6 +0.28
76 4.200 305.8 303.2 -0.85
Average and deviation
RELAP5 #
k_loss
Input to achieve measured pressure drop
and assumed flow distribution
16 2.9570 ± 0.753
360 0.4785 ± 0.004
365 0.7036 ± 0.004
366 0.7156 ± 0.004
367 1.2680 ± 0.004
56 0.5083 ± 0.009
76 3.9130 ± 0.206

ANL/GTRI/TM-14/10 22
It is also important to note that the loss coefficient in volume 76 (plugged channel) does not vary
significantly for the 1962 core configurations since the hydraulic diameter and velocity remain
essentially constant since all the channels contain identical plugs. Figure 11 illustrates the loss
coefficient trend for the BR2 and hydraulic facility flow experiments, the 1963 BR2 core and the
hypothetical representative core. However, in the RELAP5 model of the representative core, the minor
loss coefficients for the plugged channel (volume 76) can change with core configuration since it is an
approximation to a number of different channel types (e.g. plug, experimental apparatus, control rod,
etc.) which, depending on the number of each type, can alter the hydraulic diameter and cross sectional
flow area. Here it was useful to also analyze several core configurations from the hydraulic facility since
it helps bridge the gap between the 1962 data and the representative core.
While Figure 11 shows the trend of required minor loss coefficient (k) as a function of hydraulic
diameter, it was assumed to be governed by the following Darcy-Weisbach equation6:
𝒌 =
𝑪𝟏
(�̇�
𝟏𝟎𝟎𝟎 ∙ 𝑨)𝟐−
𝑪𝟐
𝑫𝒉; 𝑪𝟏 = 𝟒𝟖𝟕. 𝟒 𝒂𝒏𝒅 𝑪𝟐 = 𝟐𝟏. 𝟗𝟑
(1)
where the coefficients C1 and C2 have been optimized with the 1962 core configuration data and the
hydraulic facility data. For the representative core, the required minor loss coefficient for volume 76
was calculated to be 17.5 (�̇�=305kg/s, A=0.06241m2 and 𝐷ℎ=0.072m). Table 6 summarizes the minor
loss coefficients of volume 76 for various core configurations.
Figure 11 Loss coefficients for volume 76 as a function of various core configurations.
6 A = cross sectional flow area. Dh = hydraulic diameter. �̇� = mass flow rate.

ANL/GTRI/TM-14/10 23
Table 6 Minor loss coefficient and parameters for volume 76 with various core configurations.
Core Configuration
Mass Flow Rate
Flow Area
Hydraulic Diameter
Minor Loss Coefficient
Calibration Equation 1
kg/s m2 m - -
1962, 24 fuel assemblies 305.8 0.04368 3.55 4.20 3.77
1962, 14 fuel assemblies 348.5 0.05011 3.56 3.72 3.92
1962, 3 fuel assemblies 395.4 0.05719 3.56 3.82 4.04
Hydraulic facility (Configuration 8) 433.7 0.07767 4.95 11.15 11.20
Hydraulic facility (Configuration 1-5) 377.2 0.06931 5.25 12.26 12.28
Hydraulic facility (Configuration 7) 290.2 0.05644 6.1 14.89 14.84
1963, 15 fuel assemblies 376.4 0.06394 4.48 9.17
Representative, 31 fuel assemblies 305 0.06241 7.2 17.36
3.1.2 Calibration outside the core
The form loss coefficients included in the RELAP5 model prior to beginning the calibration process were
assumed to provide a reasonable approximation of the flow distribution. This was evident in the fact
that the RELAP5 simulations without the loss coefficients from the previous section didn’t produce a
flow distribution pattern that was significantly different from the measured data. After including the
loss coefficient from the previous section, it was assumed the flow distribution was finalized and the
only modification still required was the magnitude of the pressure drop outside the core region to
match it to the BR2 DPRCA measurement. The DPRCA is a differential pressure measurement of the
reactor vessel, with pressure taps located on the inlet and outlet piping. Additional pressure
measurements are made in the upper plenum and near the lower plenum at the support grid. Review of
the available data indicates there is general agreement in pressure loss trends for the 1962 BR2 flow
tests, so for simplicity the 14 element core configuration was chosen as the basis for analysis. The loss
coefficients were then demonstrated to be applicable to any core configuration over the range of data
available for the 1962 BR2 hydraulic tests.
Based on the available data and notes from the BR2 team, the pressure loss from the inlet pipe to the
upper plenum and from the core outlet to the support grid was approximately ~0 kg/cm2. This is due
the fact that the flow is decelerating, converting kinetic energy to potential energy. This is in agreement
with preliminary RELAP5 simulations. No additional loss factors were required at these locations.
Between the upper plenum and the core inlet, preliminary RELAP5 simulations indicate additional losses
were required to match experimental data. A loss coefficient was placed at the junction between
volume 12 and 14, as well as for the other channels at this elevation. Similar to the procedure for
calibration of the core region, a separate steady-state set of equations were developed to solve for the
minor loss coefficient required to match the target pressure drop. Although in this case, the pressure
drop was achieved without altering the flow distribution. Table 7 summarizes the loss coefficients
required at this location.

ANL/GTRI/TM-14/10 24
Table 7 Loss coefficients included in reactor vessel model above the core region.
RELAP5 Junction Additional k loss Description
Branch #14, Junction #1 between volumes 12 and 14
2.34
Input to achieve measured pressure drop across upper guide plate
Branch #34, Junction #1 between volumes #32 and 34
0.3113
Branch #54, Junction #1 between volumes #52 and 54
0.3119
Branch #74, Junction #1 between volumes #72 and 74
5.067
With the above minor loss coefficients included, the pressure distribution from the inlet pressure
measurement to the lower support grid within the reactor vessel where in good agreement with
measurements. Comparison of simulations to the DPRCA measurement indicated that additional
pressure loss was required in the model between the lower support grid and the outlet pressure
measurement. However, no additional measurements were made between these two locations. After
reviewing the impact of including a minor loss coefficient at different locations, it was decided that there
was no ideal location. For simplicity, the minor loss coefficient (11.2) was placed at the junctions
between the reactor vessel and outlet piping (junctions 991 and 992). The large minor loss coefficient
value is justified since the pressure loss from the complex 3-dimensional flow pattern in the lower
region of the pressure vessel cannot be modeled accurately by RELAP5 (1-dimensional code).
3.1.3 Calibration summary
Figure 12 shows the results for the calibrated RELAP5 model compared to experimental data. Figure 12a
includes core pressure drop measurement data for the 1962 BR2 experiments, 1973/74 BR2
experiments and the 1963 BR2 experiment (to be simulated). The RELAP5 simulations produce good
agreement with the 1962 data for both nominal flow rates and reduced flow rates. The RELAP5
simulations for the 1963 core configuration produces the correct pressure drop but has a flow rate
slightly less than its experimental counterpart. The RELAP5 flow rate is specified based on the core
configuration and expected flow in each channel (see Table 4). The difference between this and the
measured flow rate is likely due to the uncertainty in the flow measurement of the reactor and the
uncertainty in the specified flow given in Table 4. Regardless, the target flow (10.4 m/s) is achieved in
the fuel element for the simulations.
Figure 12b is a similar graph that shows the pressure drop across the reactor vessel. The simulations for
the 1962 core configurations are reasonable but do show a trend of increasing pressure drop with
increased flow rate at nominal conditions. The minor loss coefficient accounting for the pressure loss in
the lower region of the pressure vessel produced results similar to the 1963 BR2 experimental
measurements and so it was utilized for those simulations. Preliminary simulations of the
representative core indicated that the removing the minor loss coefficient completely was required to
achieve the expected results (3.1 kg/cm2). As a result, a minor loss coefficient was not included at the
reactor vessel outlet piping for the representative core model. Further work may be required to resolve
this issue.

ANL/GTRI/TM-14/10 25
(a)
(b)
Figure 12 Comparison of RELAP5 pressure loss simulations to 1962 and 1973/74 BR2 hydraulic tests.
Data for the 1963 BR2 core configuration and estimated results for the representative core are also
shown.
ANL/GTRI/TM-14/10 26
These loss coefficients, or correction factors, needed to achieve the correct flow rates and pressure
losses are justified since the hydraulic parameters determined for the reference RELAP5 model do not
exactly represent the reactor, but are a volume averaged approximations to it. The correction factors
account for the differences between the volume averaged approximation and the reality of the reactor
components. For example, the large correction factor for the bypass channel accounts for the many
small triangular flow paths and their contraction at the core centerline caused by the convergence of the
angled channels, details that are averaged out in the approximation of the core region. The large loss
coefficient for the plugged channel, and its variability, accounts for the fact that there are a variety of
hydraulic diameters for the different sections of this channel. It is inherent in the volume averaging of
these channels that the resulting hydraulic diameter will under represent the hydraulic resistance of the
system. The calibrated loss coefficients correct these issues. The fact that there is good agreement for
the loss coefficients across many core configurations is significant because it establishes credibility for
the loss coefficients and flow distribution that will be predicted for the representative core since it can
be closely tied to the experimental data acquired in the late 1950’s and early 1960’s.
3.2 Primary system
3.2.1 Pump coast down
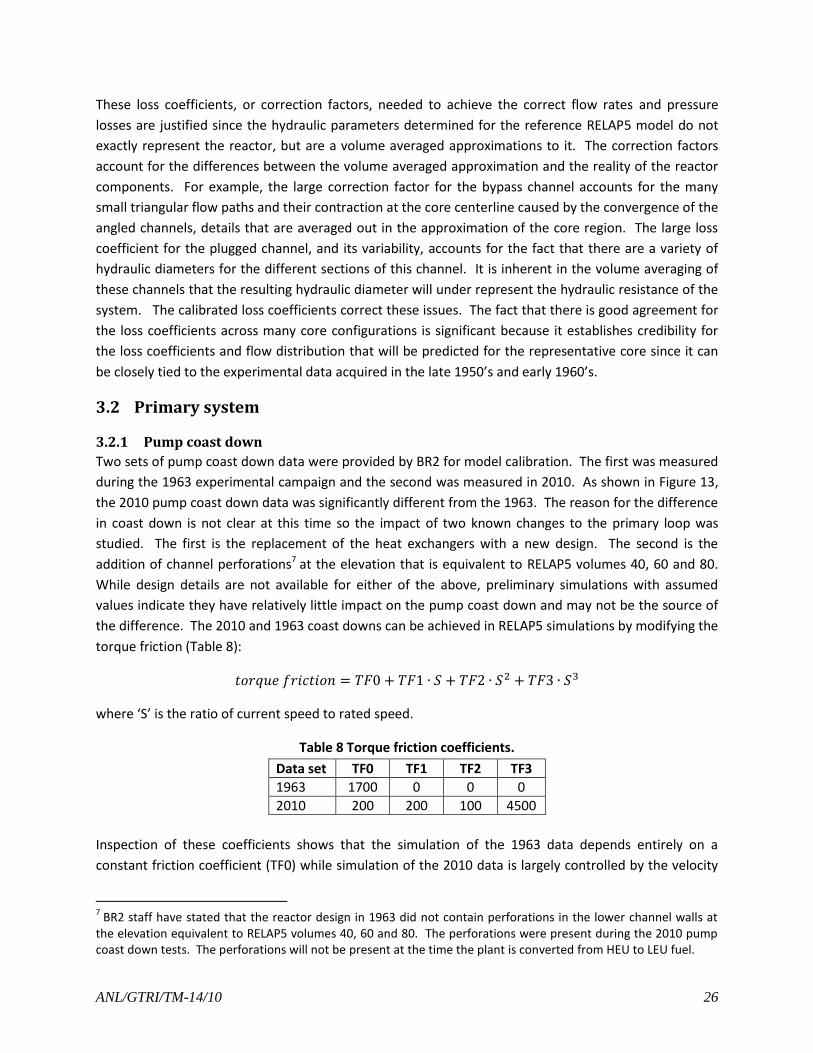
Two sets of pump coast down data were provided by BR2 for model calibration. The first was measured
during the 1963 experimental campaign and the second was measured in 2010. As shown in Figure 13,
the 2010 pump coast down data was significantly different from the 1963. The reason for the difference
in coast down is not clear at this time so the impact of two known changes to the primary loop was
studied. The first is the replacement of the heat exchangers with a new design. The second is the
addition of channel perforations7 at the elevation that is equivalent to RELAP5 volumes 40, 60 and 80.
While design details are not available for either of the above, preliminary simulations with assumed
values indicate they have relatively little impact on the pump coast down and may not be the source of
the difference. The 2010 and 1963 coast downs can be achieved in RELAP5 simulations by modifying the
torque friction (Table 8):
𝑡𝑜𝑟𝑞𝑢𝑒 𝑓𝑟𝑖𝑐𝑡𝑖𝑜𝑛 = 𝑇𝐹0 + 𝑇𝐹1 ∙ 𝑆 + 𝑇𝐹2 ∙ 𝑆2 + 𝑇𝐹3 ∙ 𝑆3
where ‘S’ is the ratio of current speed to rated speed.
Table 8 Torque friction coefficients.
Data set TF0 TF1 TF2 TF3
1963 1700 0 0 0
2010 200 200 100 4500
Inspection of these coefficients shows that the simulation of the 1963 data depends entirely on a
constant friction coefficient (TF0) while simulation of the 2010 data is largely controlled by the velocity
7 BR2 staff have stated that the reactor design in 1963 did not contain perforations in the lower channel walls at
the elevation equivalent to RELAP5 volumes 40, 60 and 80. The perforations were present during the 2010 pump coast down tests. The perforations will not be present at the time the plant is converted from HEU to LEU fuel.
ANL/GTRI/TM-14/10 27
ratio to the third power. This suggests that changes in the systems flow resistance alone aren’t
sufficient for causing the two coast down profiles.
The RELAP5 coast down profiles do not match the measured values well at low flows but it is known that
flow measurements are typically not very accurate below about 10% of nominal conditions. Thus, the
impact on peak clad temperature due the time at which flow approaches zero has been described in the
following section on simulation results.
Figure 13 Comparison of the 1963 BR2 pump coast down data to RELAP5 simulations.
4 Loss-of-Flow and Loss-of-Pressure Simulations In 1963, a number of loss-of-flow and loss-of-pressure tests were performed in BR2 to determine the
maximum allowable heat flux at which the reactor could be operated safely. The following three tests
were selected for the technical basis for RELAP5 simulation of BR2:
Test A/400/1; loss of flow at maximum heat flux of 400 W/cm2
Test C/600/3; loss of flow at maximum heat flux of 600 W/cm2
Test F/400/1; loss of flow with loss of pressure at maximum heat flux of 400 W/cm2
The tests sequences of events as well as the simulation results are presented in this section.
ANL/GTRI/TM-14/10 28
The magnitude and distribution of power for each test are based on MCNP calculations described in [13]
and summarized for the RELAP5 model in Appendix C. These power distributions have been modified
for this work since the RELAP5 modeling approach was slightly different. Previous simulations modeled
fuel plates 4, 5 and 6 in a sector whereas the model described in Section 2 was for a 10 degree azimuthal
section these plates. This was done because the local heat flux can increase up to about 30% (due to
azimuthal peaking) depending on the orientation of the fuel element in the 1963 core configuration. For
the representative core model, the peak heat flux will be modeled at this hot stripe, but for the 1963
experiments the orientation of the fuel element was not known and has been included in the
uncertainty of the simulations. The reference simulations use the average heat flux, meaning that the
results here should be consistent with previous RELAP5 simulations performed by ANL [6, 14].
Of particular interest in this work is the comparison of the RELAP5 simulation results to the measured
fuel cladding temperature from an instrumented fuel assembly (Channel F-346). Thermocouples were
located at 300 mm (TC11), 150 mm (TC12), 0 mm (TC13) and -150 mm (TC14) from the fuel centerline at
the outside cladding of plate 6. These locations closely correspond to the locations between RELAP5
heat structure nodes 2-3, 6-7, 10-11 and 14-15, respectively, and RELAP5 volume nodes 3-4, 7-8, 11-12,
and 15-16, respectively. Averages of the node values have been reported.
4.1 Test A Test A (400 W/cm2) was performed at a reactor power of 24 MW. Comparisons of the normal operating
conditions are given in Table 9. There are no significant differences between test results and RELAP5,
although the cladding temperature under normal operation is predicted to be slightly higher for
thermocouple 13.

ANL/GTRI/TM-14/10 29
Table 9 Comparisons of the normal operating conditions for Test A.
Parameter RELAP5 Volume***
RELAP5 Value Target Value**
Mass Flow (kg/s)
Bypass 16 354.9 361.6
High Heat Flux (Remainder) 360 35.8 35.09
High Heat Flux (channel 5) 365 0.17 0.17
High Heat Flux (Channel 6) 366 0.19 0.19
High Heat Flux (Channel 7) 367 0.26 0.25
High Heat Flux (Total) 36 36.37 35.70
Average Fuel element 56 472 463.70
Plugged Channels 76 376.0 376.40
Total 8 1239.7 1237.3
Pressure (kg/cm
2)
PRCA 255(1) 12.7 12.7
DPRCA 255(1)-201(6) 3.1 3.5
Pin - PS 255(1)-10 -0.01 0*
Ps - PI 10-40 2.6 3*
Ps - Pi1 10-34 0.5 0.60
12-14 0.2 0.2*
Pi1-Pi2 34-38 2.06 2.04
Pi2-PI 38-40 0.02 0*
PI-Pout 40-201(6) 0.5 0.6*
DPRCA-(Ps-PI) 0.50 0.5-0.6*
Temperature (
oC)
Tin 8 34.8 34.80
Tout 24 39.3 39.90
dT Tout-Tin 4.5 5.10
TC11 366(2-3) 41.8 40.6
TC12 366(6-7) 56.6 53.0
TC13 366(10-11) 99.9 89.5
TC14 366(14-15) 116.1 113.1
*Indicates value is an estimate and not a measurement.
**Mass flow values based on Table 4 flow distribution. Fuel element flows scaled by flow area.
***RELAP5 number format: volume number followed by segment number in parenthesis.
The transient was characterized by a loss of power to the main pumps at 5.35 s followed by a reactor
scram at 7.7 s. The bypass valve started to open at 22.0 s and was completely open at 35.6 s. All other
parameters were unchanged.
Figure 14 shows a comparison of the RELAP5 simulation results and the measured cladding temperature
for thermocouples 11 through 14. Early in the transient the results are representative of normal
operating conditions. The fact that there is general agreement between measurement and simulation
suggests that the orientation of the fuel bundle is such that the thermocouples are located in a region
where the heat flux is representative of the average power of the 6th plate. The temporary rise in
temperature starting at 5.35 s is due to the decrease in the flow-to-power ratio resulting from the fact
that the pump trip occurred before the reactor scram. This peak is only present in Test A since for Tests
C and F, the reactor was scrammed before the pumps were tripped. The reactor scram occurs at 7.7 s;

ANL/GTRI/TM-14/10 30
because the flow rate decreases relatively slow (Figure 15), the heat transfer coefficient remains high
and the cladding temperature rapidly approaches the bulk coolant inlet temperature. The flow rate
decreases in a manner that allows the channel coolant to reach inlet conditions. As evident in Figure 15,
a slowing down of the bulk coolant to zero flow rate results in a momentary period in which the coolant
resides near stationary in the fuel element receiving heat. The increase in bulk coolant temperature
eventually results in a buoyancy driven flow reversal that draws water from below the core, which in
combination with the increase in heat transfer coefficient, results in the peak, decline and leveling of the
cladding temperature. Figure 14 shows that the RELAP5 model captures these magnitudes and timings
with good agreement. It is also worth mentioning that Figure 15 shows the maximum temperature for
the first peak occurs on the outer face of plate 6 and for the second peak on the outer face of plate 5.
The magnitude is highest for both at an elevation of 36.2 cm from the bottom of the plate. The
simulation results presented here are consistent with previous results simulations performed by ANL
and described in [6]. However, there are several additional points to make regarding agreements and
differences between the model and measurements.
Figure 14 Comparison of the 1963 Test A cladding temperature measurement and RELAP5
simulations.
20.0
40.0
60.0
80.0
100.0
120.0
140.0
0.0 10.0 20.0 30.0 40.0 50.0 60.0
Tem
pera
ture
/ o
C
Time / s
Exp. TC11 RELAP TC11
Exp. TC12 RELAP TC12
Exp. TC13 RELAP TC13
Exp. TC14 RELAP TC14

ANL/GTRI/TM-14/10 31
Figure 15 Time evolution of parameters impacting peak temperature (RELAP5 simulation results at an
elevation of 36.2 cm from the bottom of the fuel plate). Plate temperatures represent the outer face
of the plate.
First, the RELAP5 model shows an additional peak in temperature following the second peak that is not
present in the experimental results. This is consistent with previous RELAP5 simulation results [6] where
the fuel element model included the entire channel sector as opposed to the 10 degree hot stripe.
Closer inspection of Figure 15 shows that the double peak is due to the timing and duration of the flow
reversal in the two adjacent channels, where channel 6 reverses at 36.9 s and channel 7 reverses at
43.9 s (for reference, coolant in the remainder of the high heat flux channel and average channels
reverses direction at 40.0 s and 40.9 s, respectively). This behavior might be expected since heat input is
the driver of flow reversal and its duration; channel 7 acquires heat mainly from one fuel plate (a small
amount of heat might be contributed from the beryllium depending on the flow conditions in channel 7
and the bypass) while channel 6 acquires heat from two fuel plates. The time it takes for flow reversal to
occur may also be impacted by the fact that the local flow conditions are different in channel 7. Coolant
near the fuel plate will tend to rise and coolant near the cooler beryllium wall will tend sink, details that
are not captured in a 1-D code. Figure 16 shows the cladding temperature and includes the uncertainty
for a ±20% in the heat transfer coefficient. For comparison the RELAP5 predicted heat transfer
coefficient is shown. It is clear that as the flow reversal occurs, the code switches to and from a natural
convection based heat transfer correlation and does so rather discontinuously. None of these factors
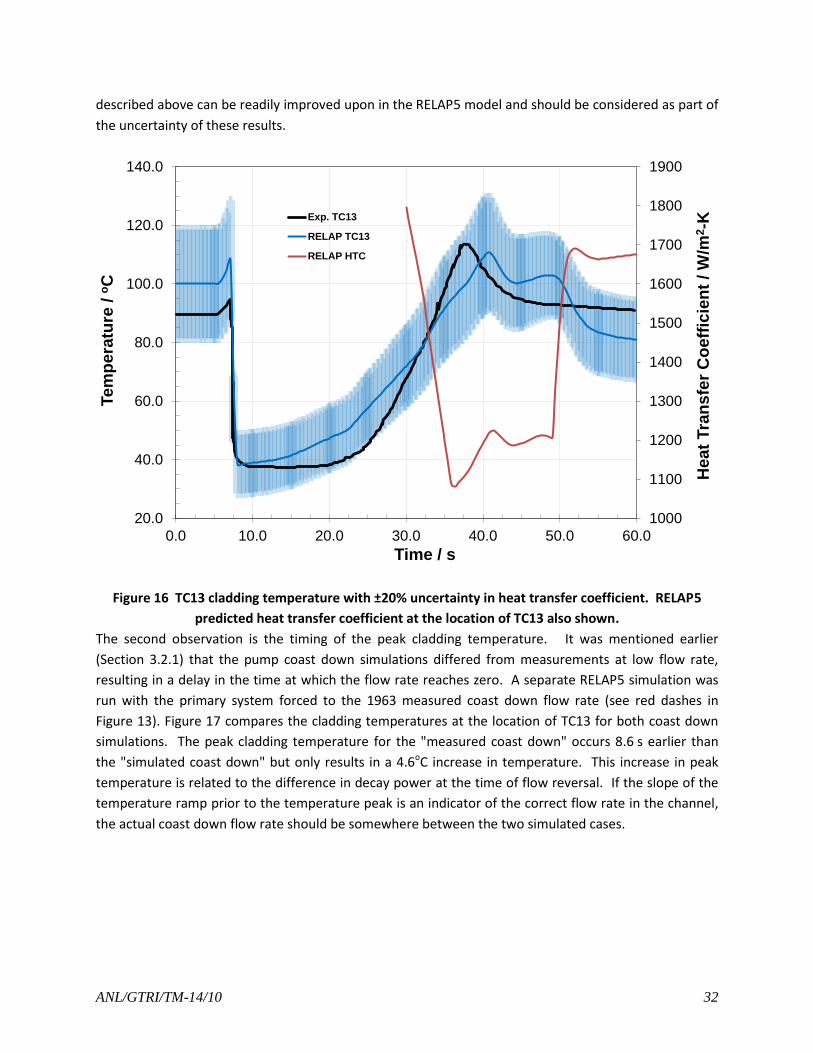
ANL/GTRI/TM-14/10 32
described above can be readily improved upon in the RELAP5 model and should be considered as part of
the uncertainty of these results.
Figure 16 TC13 cladding temperature with ±20% uncertainty in heat transfer coefficient. RELAP5
predicted heat transfer coefficient at the location of TC13 also shown.
The second observation is the timing of the peak cladding temperature. It was mentioned earlier
(Section 3.2.1) that the pump coast down simulations differed from measurements at low flow rate,
resulting in a delay in the time at which the flow rate reaches zero. A separate RELAP5 simulation was
run with the primary system forced to the 1963 measured coast down flow rate (see red dashes in
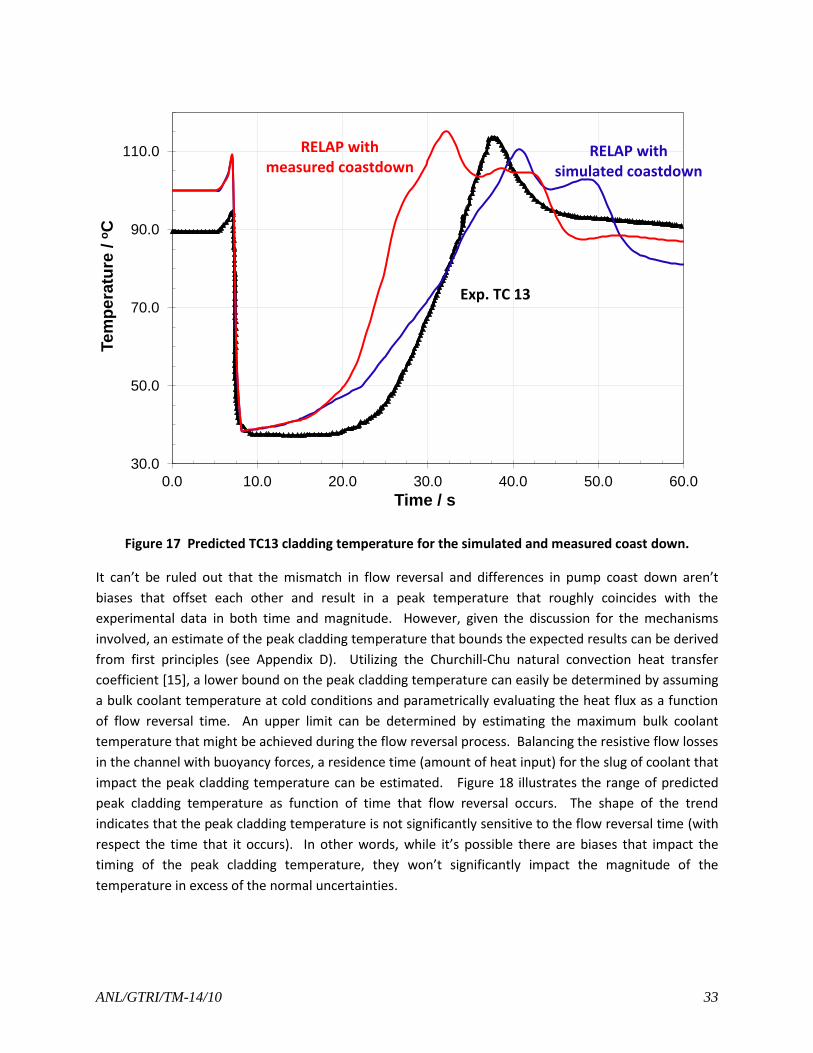
Figure 13). Figure 17 compares the cladding temperatures at the location of TC13 for both coast down
simulations. The peak cladding temperature for the "measured coast down" occurs 8.6 s earlier than
the "simulated coast down" but only results in a 4.6oC increase in temperature. This increase in peak
temperature is related to the difference in decay power at the time of flow reversal. If the slope of the
temperature ramp prior to the temperature peak is an indicator of the correct flow rate in the channel,
the actual coast down flow rate should be somewhere between the two simulated cases.
1000
1100
1200
1300
1400
1500
1600
1700
1800
1900
20.0
40.0
60.0
80.0
100.0
120.0
140.0
0.0 10.0 20.0 30.0 40.0 50.0 60.0
Heat
Tra
nsfe
r C
oeff
icie
nt
/ W
/m2-K
Tem
pera
ture
/ o
C
Time / s
Exp. TC13
RELAP TC13
RELAP HTC
ANL/GTRI/TM-14/10 33
Figure 17 Predicted TC13 cladding temperature for the simulated and measured coast down.
It can’t be ruled out that the mismatch in flow reversal and differences in pump coast down aren’t
biases that offset each other and result in a peak temperature that roughly coincides with the
experimental data in both time and magnitude. However, given the discussion for the mechanisms
involved, an estimate of the peak cladding temperature that bounds the expected results can be derived
from first principles (see Appendix D). Utilizing the Churchill-Chu natural convection heat transfer
coefficient [15], a lower bound on the peak cladding temperature can easily be determined by assuming
a bulk coolant temperature at cold conditions and parametrically evaluating the heat flux as a function
of flow reversal time. An upper limit can be determined by estimating the maximum bulk coolant
temperature that might be achieved during the flow reversal process. Balancing the resistive flow losses
in the channel with buoyancy forces, a residence time (amount of heat input) for the slug of coolant that
impact the peak cladding temperature can be estimated. Figure 18 illustrates the range of predicted
peak cladding temperature as function of time that flow reversal occurs. The shape of the trend
indicates that the peak cladding temperature is not significantly sensitive to the flow reversal time (with
respect the time that it occurs). In other words, while it’s possible there are biases that impact the
timing of the peak cladding temperature, they won’t significantly impact the magnitude of the
temperature in excess of the normal uncertainties.
30.0
50.0
70.0
90.0
110.0
0.0 10.0 20.0 30.0 40.0 50.0 60.0
Tem
pera
ture
/ o
C
Time / s
Exp. TC 13
RELAP withsimulated coastdown
RELAP withmeasured coastdown

ANL/GTRI/TM-14/10 34
Figure 18 Predicted peak cladding temperature at TC13 determined from a first principles estimation.
4.2 Test C Test C (600 W/cm2) was performed at a reactor power of 36 MW. The sequence of events was similar to
Test A. Comparisons of the normal operating conditions are given in Table 10. There are no significant
differences between test results and RELAP5, although the cladding temperature under normal
operation is predicted to be slightly higher for thermocouple 13.
The transient was characterized by a loss of power to the main pumps at 6.65s and a reactor scram at
6.55s. The bypass valve started to open at 6.52 s and was completely open at 21.7 s. All other
parameters were unchanged.
Figure 19 shows a comparison of the RELAP5 simulation results and the measured cladding temperature
for thermocouples 11 through 14. There are no significant differences between the trends shown here
and those seen in Test A except for the magnitude (larger) and timing (earlier) of the peak cladding
temperature. Also, the pump trip occurs 0.1 s after the reactor scram so there is no initial peak in
temperature. Regardless, there is generally good agreement between the measured and simulated
results.
The simulation results presented here are also consistent with previous results simulations performed
by ANL and described in [14].
20.0
40.0
60.0
80.0
100.0
120.0
140.0
0.0 10.0 20.0 30.0 40.0 50.0 60.0
Tem
pera
ture
/ o
C
Time / s
First Principles Estimate
RELAP withmeasured coastdown RELAP with
simulated coastdown
Exp. TC 13

ANL/GTRI/TM-14/10 35
Table 10 Comparisons of the normal operating conditions for Test C.
Parameter RELAP5 Volume***
RELAP5 Value
Target Value**
Mass Flow (kg/s)
Bypass 16 354.8 361.6
High Heat Flux (Remainder) 360 35.8 35.09
High Heat Flux (channel 5) 365 0.17 0.17
High Heat Flux (Channel 6) 366 0.20 0.19
High Heat Flux (Channel 7) 367 0.26 0.25
High Heat Flux (Total) 36 36.42 35.70
Average Fuel element 56 473 463.70
Plugged Channels 76 376.0 376.40
Total 8 1240.0 1237.3
Pressure (kg/cm2)
PRCA 255(1) 12.7 12.7
DPRCA 255(1)-201(6) 3.1 3.5
Pin - PS 255(1)-10 -0.01 0*
Ps - PI 10-40 2.6 3*
Ps - Pi1 10-34 0.5 0.60
12-14 0.2 0.2*
Pi1-Pi2 34-38 2.06 2.15
Pi2-PI 38-40 0.02 0*
PI-Pout 40-201(6) 0.5 0.6*
DPRCA-(Ps-PI) 0.5 0.5-0.6*
Temperature (oC)
Tin 8 34.9 35.2
Tout 24 41.4 41.8
dT Tout-Tin 6.5 6.6
TC11 366(2-3) 46.1 48.4
TC12 366(6-7) 70.1 75.2
TC13 366(10-11) 129.8 119.0
TC14 366(14-15) 146.7 151.8
*Indicates value is an estimate and not a measurement.
**Mass flow values based on Table 4 flow distribution. Fuel element flows scaled by flow area.
***RELAP5 number format: volume number followed by segment number in parenthesis.

ANL/GTRI/TM-14/10 36
Figure 19 Comparison of the 1963 Test C cladding temperature measurement and RELAP5
simulations.
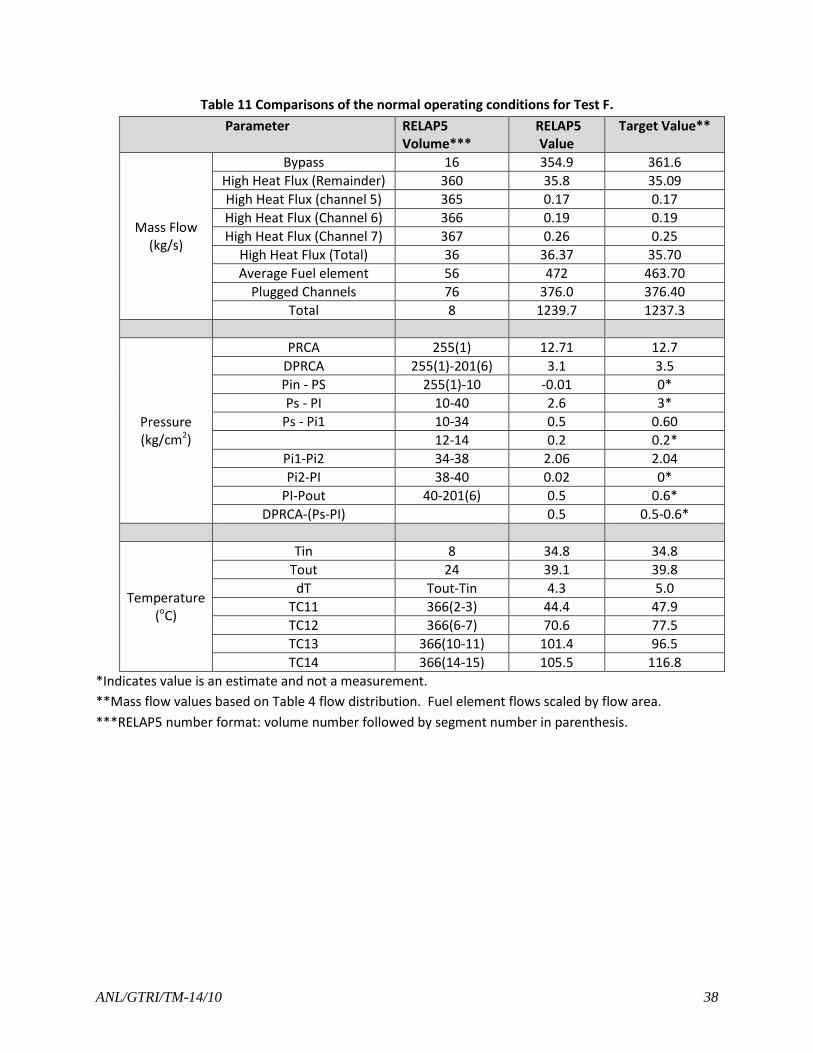
4.3 Test F Test F (400 W/cm2) was performed at a reactor power of 24 MW. The sequence of events was similar to
test A except that it included a coincidental loss of pressure. Comparisons of the normal operating
conditions are given in Table 11. There are no significant differences between test results and RELAP5
simulations.
The transient was characterized by a loss of power to the main pumps at 10.2 s followed by a reactor
scram at 11.1 s (similar to Test C, the first temperature peak will not exist since the scram occurs before
the pump trip). The loss of pressure was initiated at 11.1 s by opening the relief valve. It completed
opening at 17.45 s. The upstream pump isolation valve began closing at 18.6 s and was completed at
47.7 s. The downstream pump isolation valve began closing at 18.45 s and was complete at 45.15 s. The
bypass valve started to open at 26.45 s and was completely open at 42.35 s. All other parameters were
unchanged.
Figure 20 shows a comparison of the RELAP5 simulation results and the measured cladding temperature
for thermocouples 11 through 14. The results are quite similar Test A despite the fuel centerline
pressure leveling off to 170 kPa after 25 s (Test A pressure was 1.36 MPa). At this pressure the
saturation temperature is ~115oC, a value similar to the peak cladding temperature. Investigation of the
20.0
40.0
60.0
80.0
100.0
120.0
140.0
160.0
180.0
0.0 10.0 20.0 30.0 40.0 50.0 60.0
Tem
pera
ture
/ o
C
Time / s
Exp. TC11 RELAP TC11
Exp. TC12 RELAP TC12
Exp. TC13 RELAP TC13
Exp. TC14 RELAP TC14
ANL/GTRI/TM-14/10 37
heat transfer coefficient at the outside of plate 6 indicates that nucleate boiling occurs for a very limited
time (42.4 s - 44.4 s) between elevations 0 cm and -21 cm (Figure 21). Nucleate boiling is also found at
the other fuel plates of the high heat flux channels for a similar elevation and duration.
At the location of TC11, the cladding temperature remains near the peak value much longer than in the
other thermocouples, and for some time after the peak, it is nearly equal to that in TC14, although the
power at TC14 is about eight times higher. This, as well as the time trace of TC11, indicate that most
likely this thermocouple failed near the time of the peak.
This test was performed at the same power as Test A. At steady state the temperatures of
thermocouples TC11, TC13, and TC14 for tests F and A are much closer to each other than those
measured by TC12. Also, although the power at the location of TC12 is much lower than that at TC13
and TC14, after the peak, where a quasi-steady state is reached, the temperature given by TC12 is higher
than that of TC13 and TC14. Most likely TC12 had also failed at the time of test F.
The simulation results presented here are also consistent with previous results simulations performed
previously by ANL [14].
ANL/GTRI/TM-14/10 38
Table 11 Comparisons of the normal operating conditions for Test F.
Parameter RELAP5 Volume***
RELAP5 Value
Target Value**
Mass Flow (kg/s)
Bypass 16 354.9 361.6
High Heat Flux (Remainder) 360 35.8 35.09
High Heat Flux (channel 5) 365 0.17 0.17
High Heat Flux (Channel 6) 366 0.19 0.19
High Heat Flux (Channel 7) 367 0.26 0.25
High Heat Flux (Total) 36 36.37 35.70
Average Fuel element 56 472 463.70
Plugged Channels 76 376.0 376.40
Total 8 1239.7 1237.3
Pressure (kg/cm2)
PRCA 255(1) 12.71 12.7
DPRCA 255(1)-201(6) 3.1 3.5
Pin - PS 255(1)-10 -0.01 0*
Ps - PI 10-40 2.6 3*
Ps - Pi1 10-34 0.5 0.60
12-14 0.2 0.2*
Pi1-Pi2 34-38 2.06 2.04
Pi2-PI 38-40 0.02 0*
PI-Pout 40-201(6) 0.5 0.6*
DPRCA-(Ps-PI) 0.5 0.5-0.6*
Temperature (oC)
Tin 8 34.8 34.8
Tout 24 39.1 39.8
dT Tout-Tin 4.3 5.0
TC11 366(2-3) 44.4 47.9
TC12 366(6-7) 70.6 77.5
TC13 366(10-11) 101.4 96.5
TC14 366(14-15) 105.5 116.8
*Indicates value is an estimate and not a measurement.
**Mass flow values based on Table 4 flow distribution. Fuel element flows scaled by flow area.
***RELAP5 number format: volume number followed by segment number in parenthesis.

ANL/GTRI/TM-14/10 39
Figure 20 Comparison of the 1963 Test F cladding temperature measurements and RELAP5
simulations.
Figure 21 Heat transfer coefficient as a function of time and elevation to illustrate region of nucleate
boiling (outside of plate 6).
25.0
50.0
75.0
100.0
125.0
0.0 10.0 20.0 30.0 40.0 50.0 60.0
Te
mp
era
ture
/ o
C
Time / s
Exp. TC11 RELAP TC11
Exp. TC12 RELAP TC12
Exp. TC13 RELAP TC13
Exp. TC14 RELAP TC14
36.228.6
21.013.3
5.7-1.9
-9.5-17.1
-24.8-32.4
0
1000
2000
3000
4000
30 33 35 38 41 44 46 49
Hea
t Tra
nsfe
r Coe
ffic
ient
/ W
/m2 K
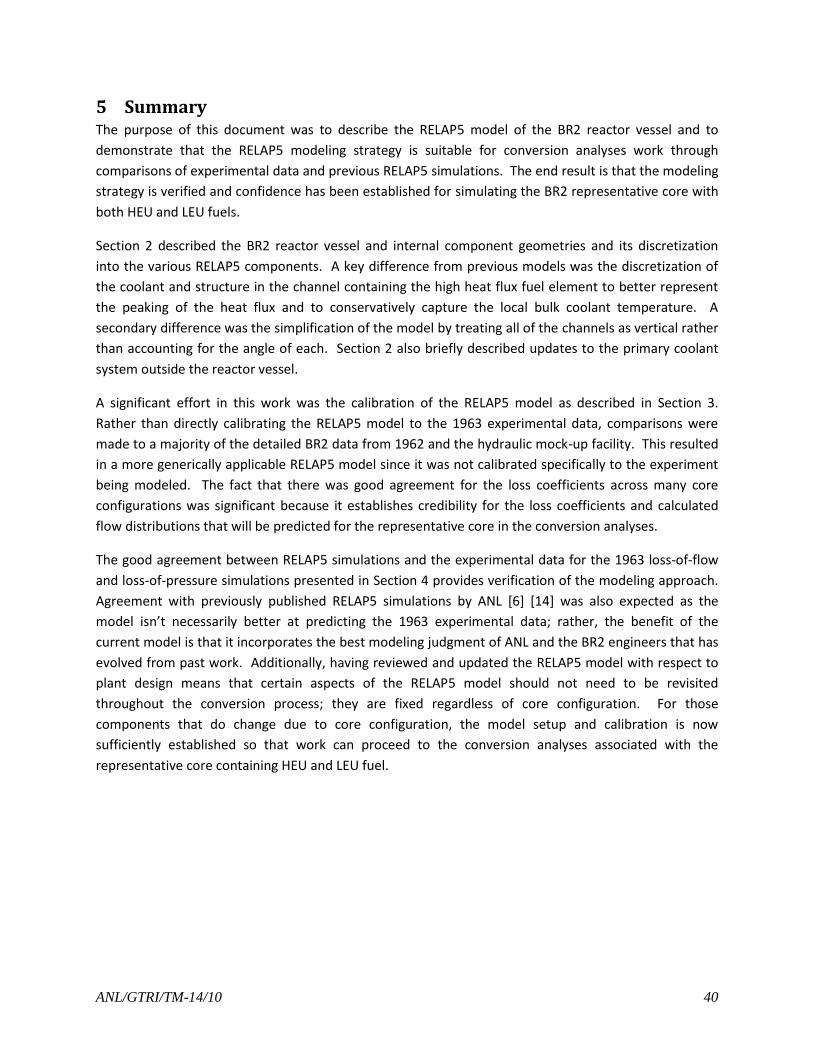
ANL/GTRI/TM-14/10 40
5 Summary The purpose of this document was to describe the RELAP5 model of the BR2 reactor vessel and to
demonstrate that the RELAP5 modeling strategy is suitable for conversion analyses work through
comparisons of experimental data and previous RELAP5 simulations. The end result is that the modeling
strategy is verified and confidence has been established for simulating the BR2 representative core with
both HEU and LEU fuels.
Section 2 described the BR2 reactor vessel and internal component geometries and its discretization
into the various RELAP5 components. A key difference from previous models was the discretization of
the coolant and structure in the channel containing the high heat flux fuel element to better represent
the peaking of the heat flux and to conservatively capture the local bulk coolant temperature. A
secondary difference was the simplification of the model by treating all of the channels as vertical rather
than accounting for the angle of each. Section 2 also briefly described updates to the primary coolant
system outside the reactor vessel.
A significant effort in this work was the calibration of the RELAP5 model as described in Section 3.
Rather than directly calibrating the RELAP5 model to the 1963 experimental data, comparisons were
made to a majority of the detailed BR2 data from 1962 and the hydraulic mock-up facility. This resulted
in a more generically applicable RELAP5 model since it was not calibrated specifically to the experiment
being modeled. The fact that there was good agreement for the loss coefficients across many core
configurations was significant because it establishes credibility for the loss coefficients and calculated
flow distributions that will be predicted for the representative core in the conversion analyses.
The good agreement between RELAP5 simulations and the experimental data for the 1963 loss-of-flow
and loss-of-pressure simulations presented in Section 4 provides verification of the modeling approach.
Agreement with previously published RELAP5 simulations by ANL [6] [14] was also expected as the
model isn’t necessarily better at predicting the 1963 experimental data; rather, the benefit of the
current model is that it incorporates the best modeling judgment of ANL and the BR2 engineers that has
evolved from past work. Additionally, having reviewed and updated the RELAP5 model with respect to
plant design means that certain aspects of the RELAP5 model should not need to be revisited
throughout the conversion process; they are fixed regardless of core configuration. For those
components that do change due to core configuration, the model setup and calibration is now
sufficiently established so that work can proceed to the conversion analyses associated with the
representative core containing HEU and LEU fuel.

ANL/GTRI/TM-14/10 41
References [1] Information Systems Laboratories Inc., 2003. RELAP5/Mod3.3 patch 03 Code Manual.
[2] G. Van den Branden, “Conversion Studies: BR2 Reference Data Representative Core”,
BR2/RCE/GVdB/2013/186/Conversion_studies_Representative_core-ed 1, 21-10-2013.
[3] E. Sikik and G Van Den Branden, “Conversion Studies BR2 Reference Data Part 2 Primary Loop”,
BR2/RCE/GVdB/2013/188/RELAP_primary_in_pool-ed 1 Draft, November 2013.
[4] G. Van den Branden, “Conversion Studies: BR2 Reference Data Part 1: Vessel, Reactor core, Load
elements”, BR2/RCE/GVdB/2011/90/Reference_data_part-ed 1, 29-09-2011.
[5] B. Dionne, Y.S. Kim, and G.L. Hofman, “Thermal properties for the thermal-hydraulics analyses of
the BR2 maximum nominal heat flux”, ANL/RERTR/TM-11-20 Rev 0, May 23, 2011.
[6] C.P. Tzanos and B. Dionne, “Analysis of the BR2 Loss-of-Flow Test A,” Nucl. Technol., 176. 93
(2011).
[7] B. Dionne and J.G. Stevens, “Applicability of a hot channel factor-based hot stripe approach to
model the azimuthal power peaking in a BR2 fuel assembly”, 33rd International Meeting on
Reduced Enrichment for Research and Test Reactors, October 23-27, 2011
[8] Belgian Engineering Test Reactor BR2. Safety and Design, Final report”, 1996. A revision of the
report “Belgian Engineering Test Reactor BR2. Safety and Design, preliminary report” May 1st,
1961.
[9] A. Beeckmans, “Distribution du debit de refrigerant dans la cuve du réacteur BR2,” C.E.N.-
EURATOM technical note 72.0616, August 10th, 1976.
[10] Operation Group of BR.2 Reactor and Related Installations, C.E.N.-EURATOM technical note
NT.71/2435/07/FaM., October 15th, 1962.
[11] C. F. Colebrook. “Turbulent Flow in Pipes with Particular Reference to the Transition Region
Between Smooth and Rough Pipe Laws.” Journal of Institution Civil Engineers. 11. 1939. pp. 133-
156.
[12] Churchill, S.W. 1977, 'Friction Factor Spans All Fluid Flow Regimes,' Chem. Eng. (Rugby, U.K.)
84(24), pp.91-91).
[13] B. Dionne and C.P. Tzanos, “Estimation of Steady-State and Transient Power Distributions for the
RELAP Analyses of the 1963 Loss-of-Flow and Loss-of-Pressure Tests at BR2” ANL/RERTR/TM-11-
19, (2011).
[14] C.P. Tzanos and B. Dionne, “Analysis of the BR2 Loss-of-Flow Tests C and F,” Nucl. Technol., 179.
382 (2012).

ANL/GTRI/TM-14/10 42
[15] James R. Welty; Charles E. Wicks; Robert E. Wilson; Gregory L. Rorrer (2007). Fundamentals of
Momentum, Heat and Mass transfer (5th edition). John Wiley and Sons. ISBN 978-0470128688.
[16] I.E. Idel’chik, Handbook of hydraulic resistance, 1966.
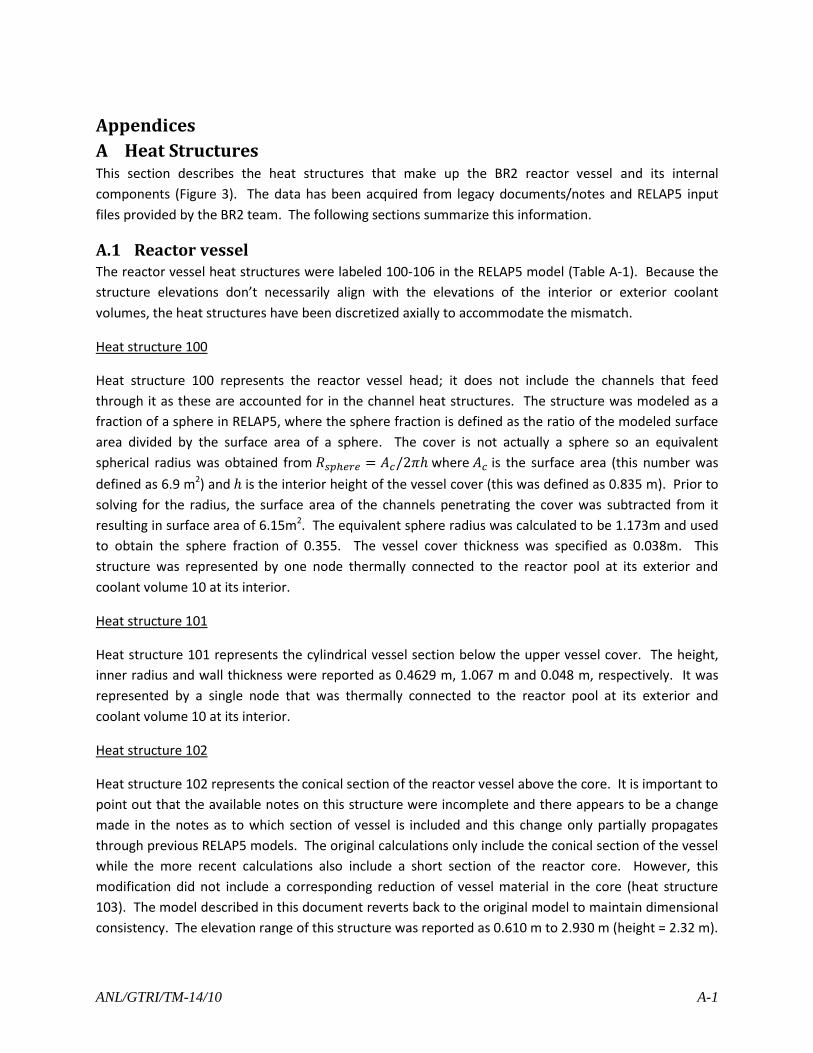
ANL/GTRI/TM-14/10 A-1
Appendices
A Heat Structures This section describes the heat structures that make up the BR2 reactor vessel and its internal
components (Figure 3). The data has been acquired from legacy documents/notes and RELAP5 input
files provided by the BR2 team. The following sections summarize this information.
A.1 Reactor vessel The reactor vessel heat structures were labeled 100-106 in the RELAP5 model (Table A-1). Because the
structure elevations don’t necessarily align with the elevations of the interior or exterior coolant
volumes, the heat structures have been discretized axially to accommodate the mismatch.
Heat structure 100
Heat structure 100 represents the reactor vessel head; it does not include the channels that feed
through it as these are accounted for in the channel heat structures. The structure was modeled as a
fraction of a sphere in RELAP5, where the sphere fraction is defined as the ratio of the modeled surface
area divided by the surface area of a sphere. The cover is not actually a sphere so an equivalent
spherical radius was obtained from 𝑅𝑠𝑝ℎ𝑒𝑟𝑒 = 𝐴𝑐/2𝜋ℎ where 𝐴𝑐 is the surface area (this number was
defined as 6.9 m2) and ℎ is the interior height of the vessel cover (this was defined as 0.835 m). Prior to
solving for the radius, the surface area of the channels penetrating the cover was subtracted from it
resulting in surface area of 6.15m2. The equivalent sphere radius was calculated to be 1.173m and used
to obtain the sphere fraction of 0.355. The vessel cover thickness was specified as 0.038m. This
structure was represented by one node thermally connected to the reactor pool at its exterior and
coolant volume 10 at its interior.
Heat structure 101
Heat structure 101 represents the cylindrical vessel section below the upper vessel cover. The height,
inner radius and wall thickness were reported as 0.4629 m, 1.067 m and 0.048 m, respectively. It was
represented by a single node that was thermally connected to the reactor pool at its exterior and
coolant volume 10 at its interior.
Heat structure 102
Heat structure 102 represents the conical section of the reactor vessel above the core. It is important to
point out that the available notes on this structure were incomplete and there appears to be a change
made in the notes as to which section of vessel is included and this change only partially propagates
through previous RELAP5 models. The original calculations only include the conical section of the vessel
while the more recent calculations also include a short section of the reactor core. However, this
modification did not include a corresponding reduction of vessel material in the core (heat structure
103). The model described in this document reverts back to the original model to maintain dimensional
consistency. The elevation range of this structure was reported as 0.610 m to 2.930 m (height = 2.32 m).

ANL/GTRI/TM-14/10 A-2
This elevation change and the difference in inner radius at its top and bottom (R = 1.067 m and r = 0.554
m, respectively) were used to obtain the surface area (A) and equivalent radius (Req):
𝐴 =𝜋
4√(𝑅 − 𝑟)2 + ℎ2(𝑅 + 𝑟) = 2𝜋𝑅𝑒𝑞ℎ
This results in returning the value of Req from 0.786 m to 0.829 m. The structure was discretized into 5
segments to correspond with the internal and external thermal connections. Also of note, there
appears to be a transcription error in the dimensional length of node 2 in previous RELAP5 models since
the section of notes summarizing the calculations of the heat structure did not match. The length of
node 2 in this current model was changed from 0.784 m to 0.8532 m to match the original calculations.
Structure 102 is thermally connected to volume 10, 8, 12 and 14 at its interior and the reactor pool
(volume 100) and the cooling shroud (volume 166) at its exterior. The thickness of this structure was
reported as 0.048 m.
Heat structure 103
The cylindrical reactor vessel section within the core region was represented in RELAP5 by heat
structure 103. The elevation was reported to be -0.5892 m to +0.6100 m for a height of 1.1992 m. The
inner radius and wall thickness were reported as 0.554 m and 0.0214 m, respectively. The structure is
connected to coolant volumes 14, 16 and 18 at its interior and the shroud coolant (volume 166) at its
exterior.
Heat structure 104
Heat structure 104 represents the conical region of the vessel below the core. The elevation of the
structure was reported as -2.101 m to –0.5892 m for a height of 1.512 m. The dimensions for this
structure were calculated in the same way as structure 102 and the resulting radius was found to be
0.856 m. The wall thickness was reported as 0.0635 m. The structure connects to volume 24 and part of
volume 18 at its interior and the cooling shroud (volume 166) at its exterior. Its axial discretization was
based on the fuel and coolant volumes in the core.
Heat structure 105
Structure 105 is the cylindrical section of vessel below the core. Its elevation was reported as -4.1168 m
to -2.101 m for a height of 2.0158 m. Its internal radius and thickness were 1.067 m and 0.0635 m,
respectively. It was connected to volume 24 and 22 at its interior and was partly connected to the
cooling shroud at its exterior. The remaining exterior was considered adiabatic.
Heat structure 106
Heat structure 106 is the lower vessel cover and was represented as fraction of a sphere. It is similar to
heat structure 100 except that there were no channel penetrations subtracted from the surface area.
This results in slightly larger left boundary or radius (1.314 m) and smaller sphere fraction (0.32). The
structure is in contact with volume 22 at its interior and was considered adiabatic at its outside.

ANL/GTRI/TM-14/10 A-3
Table A-1: RELAP5 heat structure description of the reactor vessel components.
Reactor Vessel
Geometry Left Boundary data Right Boundary data
HS Name Type
Left Boundary
Radial division Thickness
Right Boundary Material
Word Boundary
Connection Cell Geom. Value
Word Boundary
Connection Cell Geom. Value
100 Spherical 1.1730 4 0.038 1.2110 9 9 10 1 0.3550 9 100 1 0.3550
101 Cylinder 1.0670 4 0.048 1.1150 2 9 10 1 0.4629 9 100 1 0.4629
102 Cylinder 0.8290 4 0.048 0.8770 2 9
10 1 0.1108
9
100 1 0.1108
8 1 0.8532 100 1 0.8532
8 1 0.0820 166 27 0.0820
12 1 0.8732 166 26 0.8732
14 1 0.4010 166 25 0.4010
103 Cylinder 0.5540 4 0.0214 0.5754 2 9
14 1 0.1528
9
166 25 0.1528
16 1 0.0762 166 24 0.0762
16 2 0.0381 166 23 0.0381
…
16 21 0.0381 166 4 0.0381
16 22 0.0762 166 3 0.0762
18 1 0.1320 166 2 0.1320
104 Cylinder 0.8560 5 0.0127 0.9195 2 9 18 1 0.3118
9 166 2 0.3118
24 1 1.2000 166 1 1.2000
105 Cylinder 1.0670 5 0.0127 1.1305 2 9
24 1 0.5322
9
166 1 0.5322
24 1 0.2243 Symmetry - 0.2243
22 1 1.2593 Symmetry - 1.2593
106 Spherical 1.3140 4 0.0095 1.3520 9 9 22 1 0.3200 9 Symmetry - 0.3200
ANL/GTRI/TM-14/10 A-4
A.2 Reactor vessel cooling shroud The reactor vessel is cooled in the core region by a separate coolant system that supplies cooling water
from the pool. Coolant flows upward along the exterior of the reactor vessel (volume 166) and is
discharged back into the pool.
At the time of this document the information for creating this structure was not available.
A.3 Reactor vessel internal structures The reactor vessel internal heat structures were labeled 120-220 in the RELAP5 model (Table A-2). They
have all been represented as single cell structures.
Heat structure 120
Heat structure 120 represents the flow diffuser (cylinder), deflecting plates and support structures
associated with diverting flow from volume 8 up into volume 10. The specified volume for each of
these structures was 0.0536 m3, 0.0072 m3 and 0.018 m3, respectively. From this, and the specified
height and inner diameter of the flow diffuser (0.859 m and 1.550 m), an equivalent structure thickness
was calculated to conserve the total mass of the structure. This structure is connected to coolant
volume 12 at its interior and coolant volume 8 at exterior.
Heat structure 140
Heat structure 140 is the channel support above the reactor core and was represented by a cylindrical
geometry at an elevation of 1.011 m. It was based on design drawing 47123. The total volume was
calculated to be 0.0078 m3 and the inner diameter was specified as 1.165 m. The outer diameter and
thickness were calculated to be 1.202m and 0.018m, respectively. The structure was connected to
volume 14 at its inside and assumed adiabatic at its outside; both assumed a length of 0.114 m.
Heat structure 201
Similar to heat structure 140, heat structure 201 is a cylinder representing the channel support below
the reactor core. It was based on design plan D2253 # 47124, 47108 and 47114. Other than the height
of the structure being reported as 0.13 m, there were no further details [in BR2 legacy notes] for
describing the geometry of this structure. Because the structure was described as having an upper
elevation of -0.901 m, it was thermally connected to coolant volume 20. The outer boundary was
considered adiabatic.
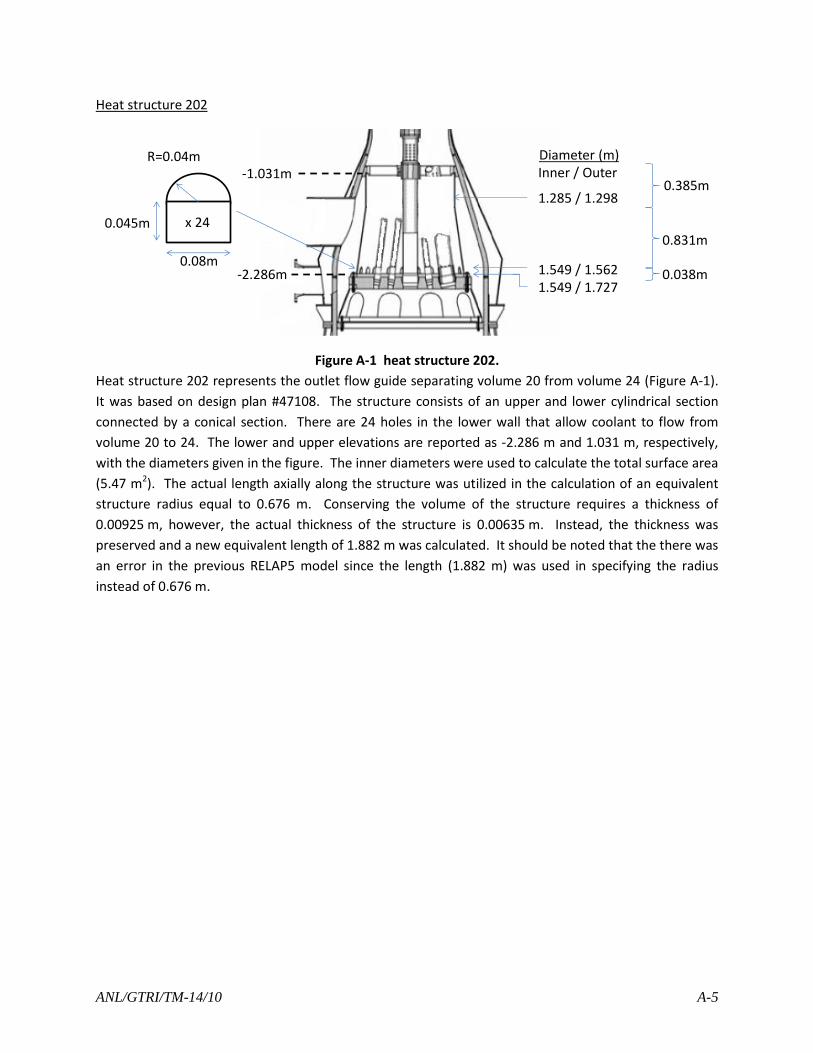
ANL/GTRI/TM-14/10 A-5
Heat structure 202
Figure A-1 heat structure 202.
Heat structure 202 represents the outlet flow guide separating volume 20 from volume 24 (Figure A-1).
It was based on design plan #47108. The structure consists of an upper and lower cylindrical section
connected by a conical section. There are 24 holes in the lower wall that allow coolant to flow from
volume 20 to 24. The lower and upper elevations are reported as -2.286 m and 1.031 m, respectively,
with the diameters given in the figure. The inner diameters were used to calculate the total surface area
(5.47 m2). The actual length axially along the structure was utilized in the calculation of an equivalent
structure radius equal to 0.676 m. Conserving the volume of the structure requires a thickness of
0.00925 m, however, the actual thickness of the structure is 0.00635 m. Instead, the thickness was
preserved and a new equivalent length of 1.882 m was calculated. It should be noted that the there was
an error in the previous RELAP5 model since the length (1.882 m) was used in specifying the radius
instead of 0.676 m.
0.038m-2.286m
-1.031m
0.831m
0.385m
Diameter (m)Inner / Outer
1.285 / 1.298
1.549 / 1.5621.549 / 1.727
0.08m
R=0.04m
0.045m x 24

ANL/GTRI/TM-14/10 A-6
Heat structure 203
Heat structure 203 represents the channel support structure below heat structure 202 and was based
on design drawing D2253 # 47113. The lower and upper elevation was reported as -2.4384 m
and -2.286 m, respectively. The structure was modeled as a rectangular plate that is thermally
connected to volumes 20 and 22. The plate contains through holes recessed 0.1016 m to position and
support the support tubes (channels). Subtracting the hole volumes (0.115m3) from the plate volume
(0.378m3) and dividing this by the plate thickness (0.152m) results in a surface area of 1.73m2.
Heat structure 220
Figure A-2 heat structure 220.
Heat structure 220 represents the support plate component between volumes 22 and 24 and was
modeled as a cylinder. Two references were listed for this component: D2253 plan #47112 and D2252
plan #47108 section EE. The structure consists of conical section with 10 holes as well as a ring and ring
support. The total volume was 0.0920 m3 (V1+V2-V3+V4 = 0.028+0.0498-0.0145+0.03). The diameter
and thickness of the structure were specified as 1.908 m and 0.0127m, respectively. Conserving the
volume of the structure, the hydraulic diameter and thickness were used to calculate a cylinder height of
1.196 m.
0.090m-2.9348m
-2.4384m
0.051m
0.355m
Diameter (m)Inner / Outer
1.753/ 2.064
1.778 / 2.0891.765 / 2.0892.096 / 2.134
0.345m
R=0.1815m
0.180m x 10
-2.8448m
V1
V2
V3
V4

ANL/GTRI/TM-14/10 A-7
Table A-2: RELAP5 description of reactor vessel internal structures. Reactor vessel internal structures
Geometry Left Boundary data Right Boundary data
HS Name
Type Left
Boundary Radial
division Unit Thick
Right Boundary
Material Word Boundary
Connection Cell
Geom. Value
Word Boundary
Connection Cell
Geom. Value
120 Cylinder 0.7750 3 0.0570 0.8320 2 9 12 1 0.8590 9 8 1 0.8590
140 Cylinder 0.5830 3 0.1850 0.6015 9 9 14 1 0.1140 9 Symmetry - 0.1140
201 Cylinder 0.5830 3 0.0445 0.6275 9 9 20 1 0.1300 9 Symmetry - 0.1300
202 Cylinder 0.6760 3 0.0064 0.6824 9 9 20 1 1.8820 9 24 1 1.8820
203 Rectangle 0.0000 3 0.1520 0.1520 9 9 20 1 1.7300 9 22 1 1.7300
220 Cylinder 0.9540 3 0.0127 0.9667 9 9 22 1 1.1960 9 24 1 1.1960
A.4 Reactor channels Three types of reactor channels (50 mm, 84 mm and 200 mm) are used in the BR2 reactor. The
parameters given in the following tables were used in the calculation of the channel heat structures.
Because of the hyperboloid configuration, channel elevations in BR2 are slightly different for each of the
79 channels. In the RELAP5 model, the upper and lower elevations for each channel have been slightly
adjusted since the model assumes all channels to be vertical. The detailed data describing the geometry
of the channels has been volume averaged into 6 sections corresponding to the coolant volume regions.
Table A-3: 50 mm channel dimensions Data Volume Averaged
Lower elevation
Upper elevation
Inner Diameter
Outer Diameter
Hole #
Hole Diam.
Length Inner
Diameter Outer
Diameter Structure Volume
Material #
[mm] [mm] [mm] [mm] [mm] [mm] [mm] [mm] [m3]
2819.2 4421.9 63.4 66.7 0 0 1602.7
61.5 67.4
5.30e-4
9
2620.9 2819.2 63.4 66.7 0 0
1808.2 7.40e-4
1142.0 2620.9 63.4 66.7 480 6.35
1092.0 1142.0 58.8 62.0 0 0
1048.4 1092.0 54.1 63.5 0 0
1011.0 1048.4 54.1 90.8 0 0
998.4 1011.0 54.1 90.8 0 0
553.8 1.05e-3
898.6 998.4 52.1 90.8 0 0
876.7 898.6 50.1 90.8 0 0
698.7 876.7 50.1 56.8 30 6.35
518.0 698.7 50.1 56.8 30 6.35
457.2 518.0 50.1 90.8 0 0
-457.2 457.2 50.1 100.9 0 0 914.4 50.1 100.9 5.51e-3 7 or 8
-518.0 -457.2 50.1 90.8 0 0
443.8
47.4 58.9
5.78e-4
9
-698.7 -518.0 50.1 56.8 30 6.35
-876.8 -698.7 50.1 56.8 30 6.35
-901.0 -876.8 50.1 90.8 0 0
-1041.5 -901.0 50.1 90.8 0 0
1537.5 1.33e-3 -2325.2 -1041.5 47.2 54.0 0 0
-2438.5 -2325.2 34.9 34.9 0 0

ANL/GTRI/TM-14/10 A-8
Table A-4: 84 mm channel dimensions Raw Data Volume Averaged
Lower elevation
Upper elevation
Inner Diameter
Outer Diameter
Hole #
Hole Diam.
Length Inner
Diameter Outer
Diameter Structure Volume
Material #
[mm] [mm] [mm] [mm] [mm] [mm] [mm] [mm] [m3]
4290.9 4421.9 92.1 95.3 0 0 1597.3
90.8 95.1
7.49e-4
9
2819.1 4290.9 92.1 95.3 0 0
2668.1 2819.1 92.1 95.3 0 0
1808.1 9.57e-4 1165.3 2668.1 92.1 95.3 480 6.35
1058.4 1165.3 88.9 95.3 0 0
1011.0 1058.4 84.2 100.3 0 0
860.0 1011.0 84.2 100.3 0 0
553.8 7.71e-4
765.5 860.0 84.2 90.5 24 4.76
698.5 765.5 84.2 90.5 12 4.76
672.7 698.5 84.2 90.5 6 4.76
621.1 672.7 84.2 90.5 12 4.76
576.4 621.1 84.2 90.5 6 4.76
508.5 576.4 84.2 90.5 0 0
457.2 508.5 84.2 100.3 0 0
-457.2 457.2 84.2 100.9 0 0 914.4 84.2 100.9 2.22e-3 7 or 8
-508.5 -457.2 84.2 100.3 0 0
443.8
80.5 92.0
5.43e-4
9
-576.4 -508.5 84.2 90.5 0 0
-621.1 -576.4 84.2 90.5 12 6.35
-672.7 -621.1 84.2 90.5 12 6.35
-698.5 -672.4 84.2 90.5 12 6.35
-765.0 -698.5 84.2 90.5 12 6.35
-855.4 -765.0 84.2 90.5 12 6.35
-901.0 -855.4 80.1 100.3 0 0
-1053.9 -901.0 80.1 100.3 0 0
1537.5 2.53e-3 -2348.9 -1053.9 80.1 92.1 0 0
-2438.4 -2348.9 69.9 69.9 0 0
Table A-5: 200 mm channel dimensions Raw Data Volume Averaged
Lower elevation
Upper elevation
Inner Diameter
Outer Diameter
Hole #
Hole Diam.
Length Inner
Diameter Outer
Diameter Structure Volume
Material #
[mm] [mm] [mm] [mm] [mm] [mm] [mm] [mm] [m3]
2819.2 4421.9 215.9 228.6 0 0 1772.1
214.4 232.2
7.11e-3
9
2565.3 2819.2 215.9 228.6 0 0
1808.2 9.16e-3
2320.8 2565.3 215.9 228.6 234 6.35
1981.2 2320.8 215.9 228.6 342 6.35
1886.9 1981.2 215.9 228.6 0 0
1075.5 1886.9 215.9 228.6 792 6.35
1056.6 1075.5 215.9 228.6 0 0
1011.0 1056.6 215.9 303.2 0 0
981.2 1011.0 215.9 303.2 0 0
553.8 8.80e-3
943.4 981.2 209.5 303.2 0 0
861.7 943.4 203.6 303.2 0 0
732.8 861.7 203.6 215.9 132 6.35
534.6 732.8 203.6 215.9 198 6.35
457.2 534.6 203.6 266.9 0 0
-457.2 457.2 203.6 266.9 0 0 914.4 203.6 266.9 2.14e-2 7 or 8
-534.6 -457.2 203.6 266.9 0 0
443.8
203.6 227.5
4.24e-3
9
-650.9 -534.6 203.6 215.9 0 0
-713.8 -650.9 203.6 215.9 132 6.35
-872.6 -713.8 203.6 215.9 198 6.35
-901.0 -872.6 203.6 303.2 0 0
1537.4 1.18e-2 -1056.6 -901.0 203.6 303.2 0 0
-2438.5 -1056.6 203.6 215.9 0 0

ANL/GTRI/TM-14/10 A-9
A.5 Reactor channel internals This section describes the geometry of the reactor channel internals used in the calculations to obtain
the RELAP5 heat structures described in the following section. The core region (-457.2 to 457.2) is based
on the information provided in reference [4].
Plug in 50 mm channel
This plug was assumed to be constructed of the same material within each elevation.
Table A-6: Plug in 50 mm channel Lower
elevation Upper
elevation Diameter
Structure Volume
[mm] [mm] [mm] [m3]
2819.2 4421.9 25.4 8.12e-4
2620.9 2819.2 25.4
9.16e-4
1142.0 2620.9 25.4
1092.0 1142.0 25.4
1048.4 1092.0 25.4
1011.0 1048.4 25.4
998.4 1011.0 25.4
5.60e-4
898.6 998.4 25.4
876.7 898.6 25.4
698.7 876.7 25.4
518.0 698.7 46.0
457.2 518.0 46.0
-457.2 457.2 46.0 1.52e-3
-518.0 -457.2 46.0 4.02e-4
-698.7 -518.0 46.0
Plug in 84 mm channel
This plug was assumed to be constructed of the same material within each elevation.
Table A-7: Beryllium plug in 84 mm channel Pin and plug Support tube and plug
Lower elevation
Upper elevation
Diameter Structure Volume
Inner Diameter
Outer Diameter
# of Holes
Hole Diameter
Structure Volume
[mm] [mm] [mm] [m3] [mm] [mm] [mm] [m3]
2819.1 4421.9 25.4 8.12e-4 34.9 44.5 9.52e-4
2668.1 2819.1 25.4
9.16e-4
34.9 44.5
1.07e-3 1175.0 2668.1 25.4 34.9 44.5 10 6.35
1058.4 1175.0 25.4 34.9 44.5
1011.0 1058.4 25.4 34.9 44.5
860.0 1011.0 25.4
3.09e-4
34.9 44.5
1.04e-3
653.6 860.0 25.4 34.9 44.5
604.8 653.6 29.8 34.9 80.6
516.6 604.8 29.8 33.5 80.6
457.2 516.6 29.8 33.5 80.6
-457.2 457.2 29.8 6.36e-4 33.5 80.6 3.87e-3
-516.6 -457.2 29.8 1.29e-4
33.5 80.6 7.84e-4
-642.6 -516.6 29.8 33.5 80.6
Plug in 200 mm channel

ANL/GTRI/TM-14/10 A-10
Within the matrix, the 200 mm plug contains a large beryllium plug that contains within it 3 of the plugs
used in the 84 mm channel. Outside of the matrix region this channel contains additional guide tubes
and structure.
Table A-8: 200 mm flow channel with plugs. There are three 84 mm plug channels modeled as
described above. 3 outer plugs and support structure Guide tubes and large Be piece
Lower elevation
Upper elevation
Inner Diameter Outer Diameter Inner
Diameter Outer
Diameter # of
Holes Hole
Diameter Structure Volume
Material #
[mm] [mm] [mm] [mm] [mm] [mm] [mm] [m3]
2819.2 4421.9
15.9/34.9 25.4/44.5
85.6 88.9 468 6.35 7.44e-3
2
2565.3 2819.2 85.6 88.9 66 6.35
8.42e-3
2320.8 2565.3 85.6 88.9 66 6.35
1981.2 2320.8 85.6 88.9
1886.9 1981.2 85.6 88.9
1075.5 1886.9 85.6 88.9
1056.6 1075.5 85.6 88.9
1011.0 1056.6 85.6 88.9
981.2 1011.0 85.6 88.9
9.44e-3
943.4 981.2 85.6 88.9
861.7 943.4 85.6 88.9
732.8 861.7 85.6 88.9
534.6 732.8 0/33.5 29.8/80.6
150.4 203.6
457.2 534.6 150.4 203.6
-457.2 457.2
0/33.3 29.8/80.6
150.4 203.6 2.7e-2 7 or 8
-534.6 -457.2 150.4 203.6
6.66e-3 2 -650.9 -534.6 150.4 203.6
-713.8 -650.9 150.4 203.6
Control rod in 84 mm channel
It was assumed that half the matrix height was control rod and the other half follower.
Table A-9: Control rod in 84 mm channel Pin and follower Support tube and control rod
Lower elevation
Upper elevation
Diameter Structure Volume
Material #
Inner Diameter
Outer Diameter
# of Holes
Hole Diameter
Structure Volume
Material #
[mm] [mm] [mm] [m3] [mm] [mm] [mm] [m3]
2819.1 4421.9 25.4 8.12e-4
2
34.9 44.5 9.52e-4
2
2668.1 2819.1 25.4
9.16e-4
34.9 44.5
1.07e-3 1175.0 2668.1 25.4 34.9 44.5 10 6.35
1058.4 1175.0 25.4 34.9 44.5
1011.0 1058.4 25.4 34.9 44.5
860.0 1011.0 25.4
3.09e-4
34.9 44.5
1.04e-3
653.6 860.0 25.4 34.9 44.5
604.8 653.6 29.8 34.9 80.6
516.6 604.8 29.8 33.5 80.6
457.2 516.6 29.8 33.5 80.6
0 457.2 0 0 48 75.9 1.47e-3
-457.2 0 52.0 9.71e-4 7 or 8 58 75.9 8.61e-3
-516.6 -457.2 29.8 1.29e-4 2
33.5 80.6 7.84e-4
-642.6 -516.6 29.8 33.5 80.6
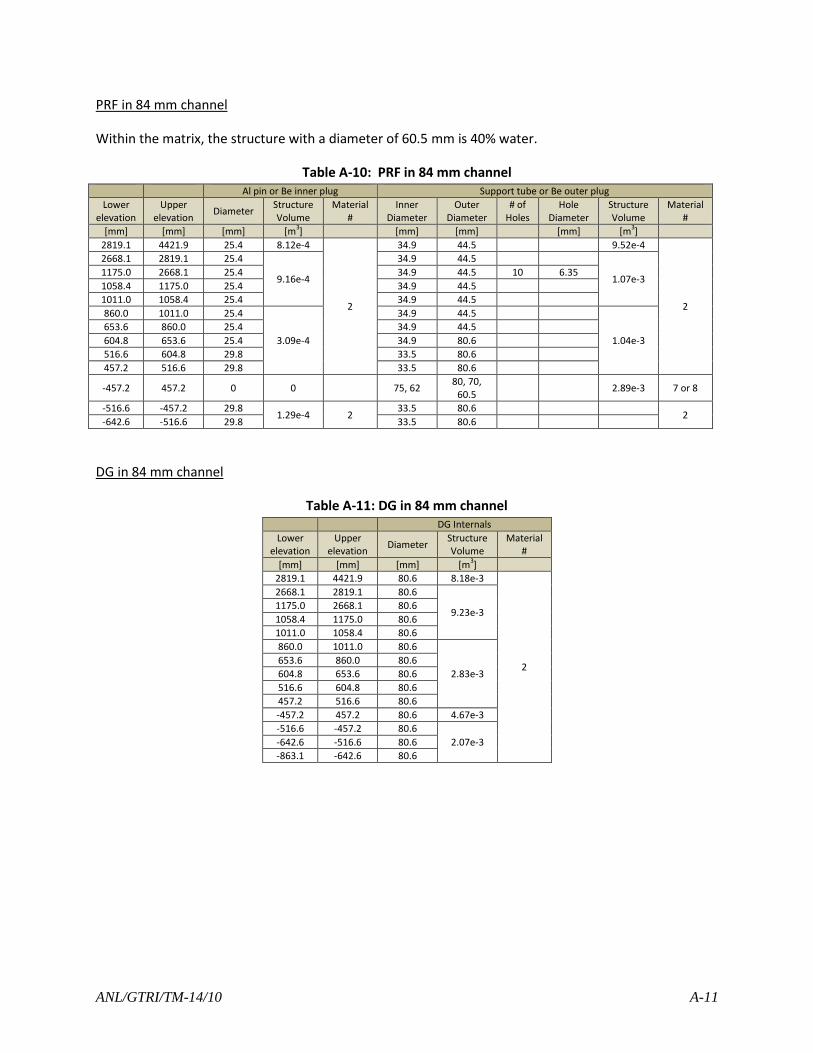
ANL/GTRI/TM-14/10 A-11
PRF in 84 mm channel
Within the matrix, the structure with a diameter of 60.5 mm is 40% water.
Table A-10: PRF in 84 mm channel Al pin or Be inner plug Support tube or Be outer plug
Lower elevation
Upper elevation
Diameter Structure Volume
Material #
Inner Diameter
Outer Diameter
# of Holes
Hole Diameter
Structure Volume
Material #
[mm] [mm] [mm] [m3] [mm] [mm] [mm] [m3]
2819.1 4421.9 25.4 8.12e-4
2
34.9 44.5 9.52e-4
2
2668.1 2819.1 25.4
9.16e-4
34.9 44.5
1.07e-3 1175.0 2668.1 25.4 34.9 44.5 10 6.35
1058.4 1175.0 25.4 34.9 44.5
1011.0 1058.4 25.4 34.9 44.5
860.0 1011.0 25.4
3.09e-4
34.9 44.5
1.04e-3
653.6 860.0 25.4 34.9 44.5
604.8 653.6 25.4 34.9 80.6
516.6 604.8 29.8 33.5 80.6
457.2 516.6 29.8 33.5 80.6
-457.2 457.2 0 0
75, 62 80, 70,
60.5 2.89e-3 7 or 8
-516.6 -457.2 29.8 1.29e-4 2
33.5 80.6 2
-642.6 -516.6 29.8 33.5 80.6
DG in 84 mm channel
Table A-11: DG in 84 mm channel DG Internals
Lower elevation
Upper elevation
Diameter Structure Volume
Material #
[mm] [mm] [mm] [m3]
2819.1 4421.9 80.6 8.18e-3
2
2668.1 2819.1 80.6
9.23e-3 1175.0 2668.1 80.6
1058.4 1175.0 80.6
1011.0 1058.4 80.6
860.0 1011.0 80.6
2.83e-3
653.6 860.0 80.6
604.8 653.6 80.6
516.6 604.8 80.6
457.2 516.6 80.6
-457.2 457.2 80.6 4.67e-3
-516.6 -457.2 80.6
2.07e-3 -642.6 -516.6 80.6
-863.1 -642.6 80.6

ANL/GTRI/TM-14/10 A-12
SIDONIE in 200 mm channel
Table A-12: 200 mm flow channel with SIDONIE Silicon crystal Support structure
Lower elevation
Upper elevation
Diameter Structure Volume
Material #
Inner Diameter
Outer Diameter Structure Volume
Material #
[mm] [mm] [mm] [m3] [mm] [mm] [m3]
2819.2 4421.9
127.0
2.03e-2
7 or 8 134.9/150.0/175.0 140.9/165.0/197.5
1.90e-2
2
2565.3 2819.2
2.29e-2 2.10e-2
2320.8 2565.3
1981.2 2320.8
1886.9 1981.2
1075.5 1886.9
1056.6 1075.5
1011.0 1056.6
981.2 1011.0
7.02e-3 6.42e-3
943.4 981.2
861.7 943.4
732.8 861.7
534.6 732.8
457.2 534.6
-457.2 457.2 1.16e-2 1.06e-2
-534.6 -457.2
5.62e-3 5.15e-3
-650.9 -534.6
-713.8 -650.9
-872.6 -713.8
-901.0 -872.6
-1056.6 -901.0 1.95e-2 1.78e-2
-2438.5 -1056.6
Sylcor fuel element assembly in 84 mm channel
Table A-13: Fuel assembly in 84 mm channel Pin Support tube
Lower elevation
Upper elevation
Diameter Structure Volume
Material #
Inner Diameter
Outer Diameter
# of Holes
Hole Diameter
Structure Volume
Material #
[mm] [mm] [mm] [m3] [mm] [mm] [mm] [m3]
4290.9 4421.9 17.5 3.86e-4
2
22.3 38.6 1.25e-3
2
2819.1 4290.9 17.5 22.3 38.6 4 6.35
2668.1 2819.1 17.5
4.35e-4
22.3 38.6
1.41e-3 1165.3 2668.1 17.5 22.3 38.6 6 6.35
1058.4 1165.3 17.5 22.3 38.6
1011.0 1058.4 17.5 22.3 38.6
860.0 1011.0 17.5
1.33e-4
22.3 38.6
3.85e-4
765.5 860.0 17.5 22.3 37.2
698.5 765.5 17.5 22.3 37.2
672.7 698.5 17.5 28.5 38.0
621.1 672.7 17.5 24.0 38.0
576.4 621.1 17.5 20.9 38.0
508.5 576.4 17.5 20.9 39.9
457.2 508.5 17.5 20.9 26.1
-457.2 457.2 26 4.63e-4 7 or 8 0 0 0
-508.5 -457.2 17.5
3.94e-5 2
20.9 26.1
2.01e-4 2
-576.4 -508.5 17.5 20.9 39.9
-621.1 -576.4 17.5 20.9 38.0
-672.7 -621.1 24.0 38.0
-698.5 -672.4 28.5 38.0
-765.0 -698.5 22.3 37.2

ANL/GTRI/TM-14/10 A-13
Sylcor fuel element assembly and 6 irradiation baskets in 200 mm channel
The fuel element assembly information is not included in this table, it is the same as described above.
Table A-14: 200 mm flow channel with fuel assembly and 6 irradiation baskets Irradiation baskets and support Guide tubes and large Be piece
Lower elevation
Upper elevation
Inner Diameter
Outer Diameter
Volume Inner
Diameter Outer
Diameter # of
Holes Hole
Diameter Structure Volume
Material #
[mm] [mm] [mm] [mm] [m3] [mm] [mm] [mm] [m3]
2819.2 4421.9 15.9 25.4 2.97e-3 85.6 88.9 468 6.35 4.32e-3
2
2565.3 2819.2 15.9 25.4
3.35e-3
85.6 88.9 66 6.35
4.90e-3
2320.8 2565.3 15.9 25.4 85.6 88.9 66 6.35
1981.2 2320.8 15.9 25.4 85.6 88.9
1886.9 1981.2 15.9 25.4 85.6 88.9
1075.5 1886.9 15.9 25.4 85.6 88.9
1056.6 1075.5 15.9 25.4 85.6 88.9
1011.0 1056.6 15.9 25.4 85.6 88.9
981.2 1011.0 15.9 25.4
1.33e-3
85.6 88.9
7.99e-3
943.4 981.2 15.9 25.4 85.6 88.9
861.7 943.4 15.9 25.4 85.6 88.9
732.8 861.7 15.9 25.4 85.6 88.9
534.6 732.8 0 25 81.6 200.2
457.2 534.6 0 25 81.6 200.2
-457.2 457.2 0 25 2.69e-3 81.6 200.2 2.40e-2 7 or 8
-534.6 -457.2 0 25 5.71e-4
81.6 200.2
6.74e-3 2 -650.9 -534.6 0 25 81.6 200.2
-713.8 -650.9 81.6 200.2

ANL/GTRI/TM-14/10 A-14
1963 Sylcor fuel element
Table A-15: Sylcor fuel element used in the 1963 experiments. 1 Sector of fuel assembly
Fuel Assembly
Inner Radius
Clad Thickness
Meat Thickness
Outer Radius
Plate Arc Length
Heated Arc
Length
Average Heated Surface Area*
Fuel Volume
Plate Structure Volume
[m] [m] [m] [m] [m] [m] [m2] [m3] [m3]
Plate 1 0.01598 0.00038 0.00051 0.01725 0.02921 0.02456 1.87e-2 9.51e-6 3.08e-5
Plate 2 0.02024 0.00038 0.00051 0.02151 0.03813 0.03314 2.53e-2 1.28e-5 3.85e-5
Plate 3 0.02451 0.00038 0.00051 0.02578 0.04708 0.04155 3.17e-2 1.61e-5 4.62e-5
Plate 4 0.02878 0.00038 0.00051 0.03005 0.05602 0.05009 3.82e-2 1.94e-5 5.39e-5
Plate 5 0.03305 0.00038 0.00051 0.03432 0.06496 0.05862 4.47e-2 2.27e-5 6.16e-5
Plate 6 0.03731 0.00038 0.00051 0.03858 0.07388 0.06720 5.12e-2 2.60e-5 6.93e-5
Total per sector 0.4193 1.07e-4 3.00e-4
Above total x3 1.2579 3.20e-4 9.01e-4
Total volume spacers 1.43e-3 m3
Total Aluminum Volume 9.01e-4 m3 + 1.43e-3 m3 = 2.33e-3 m3
1 sector of fuel assembly 1 full fuel assembly
Inner Radius
Outer Radius
Flow Area Wetted Perimeter
Hydraulic Diameter
Flow Area Wetted Perimeter
Hydraulic Diameter
[m] [m] [m2] [m] [m] [m2] [m] [m]
Channel 0 0.00872 0.01047 1.05e-4 1.21e-1 3.49e-3
34.75e-4 24.01e-1 5.79e-3
Channel 1 0.01302 0.01598 0.74e-4 0.55e-1 5.36e-3
Channel 2 0.01725 0.02024 1.01e-4 0.73e-1 5.54e-3
Channel 3 0.02151 0.02451 1.28e-4 0.91e-1 5.65e-3
Channel 4 0.02578 0.02878 1.55e-4 1.08e-1 5.71e-3
Channel 5 0.03005 0.03305 1.81e-4 1.26e-1 5.73e-3
Channel 6 0.03432 0.03731 2.08e-4 1.44e-1 5.78e-3
Channel 7 0.03858 0.04210 2.78e-4 1.63e-1 6.81e-3
10 degree arc of fuel assembly
Fuel Assembly
Inner Radius
Clad Thickness
Meat Thickness
Outer Radius
Plate Arc Length
Heated Arc
Length
Average Heated Surface Area*
Fuel Volume
Plate Structure Volume
[m] [m] [m] [m] [m] [m] [m2] [m3] [m3]
Plate 4 0.02878 0.00038 0.00051 0.03005 5.51e-3 5.51e-3 4.20e-3 2.13e-6 5.93e-5
Plate 5 0.03305 0.00038 0.00051 0.03432 6.25e-3 6.25e-3 4.77e-3 2.42e-6 6.57e-5
Plate 6 0.03731 0.00038 0.00051 0.03858 7.04e-3 7.04e-3 5.36e-3 2.72e-6 7.26e-5
Total per stripe 1.43e-2 7.28e-6 1.98e-5
10 degree arc of fuel assembly Remainder of fuel assembly
Inner Radius
Outer Radius
Flow Area Wetted Perimeter
Hydraulic Diameter
Flow Area Wetted Perimeter
Hydraulic Diameter
[m] [m] [m2] [m] [m] [m2] [m] [m]
Channel 5 0.03005 0.03305 1.65e-5 1.10e-2 5.73e-3
34.15e-4 23.64e-1 5.79e-3 Channel 6 0.03432 0.03731 1.88e-5 1.25e-2 5.78e-3
Channel 7 0.03858 0.04210 2.48e-5 1.40e-2 6.81e-3
* This value is only half of the total heated area of a fuel plate.

ANL/GTRI/TM-14/10 A-15
A.6 RELAP5 channel heat structures (1963 core) A.6.1 Average fuel channel
The 1963 BR2 core contained 13 channels consolidated into a single average fuel channel. Table A-16
shows the description for each of the structure associated with this channel. The thermal connections
were based on the actual length or surface area of the component times the 13 channels to properly
account for the heat transfer and thermal mass. Below is a brief description of each of the structures
associated with this channel.
Heat structure 500
Represents the section of channel above the core for the average fuel channel. Its radial dimensions
were based on the 84 mm channel. Because the channel extends above the reactor vessel, it’s partially
in contact with the volume describing the reactor pool. Below this, the channel was thermally
connected to the respective bypass coolant volumes. The channel was assumed to be stainless steel
304L.
Heat structure 501
Represents the channels internal components (not including the fuel) that extend from coolant volume
50 to 58. This structure was modeled as a cylinder and it was assumed that the entire component was
aluminum.
Heat structure 560
Represents the beryllium channel within the core region. It was internally connected to volume 56 and
externally to volume 16.
Heat structure 561
Represents the average fuel element. It was modeled as a plate geometry that connects to coolant
volume 56 at both its left and right boundary. The surface area is representative of the total surface
area of 13 fuel elements but its radial dimensions are that of a single plate. The plate is composed of
cladding material (AG3NE) and fresh HEU fuel. The plate dimensions include a cladding thickness of
0.38 mm and a fuel meat thickness of 0.51 mm. This structure only contains the aluminum cladding
radially separating the fuel from the coolant. The remainder of the aluminum was attributed to heat
structure 501
Heat structure 580
This structure is similar to heat structure 500 except that it represents the section of channel below the
core region.
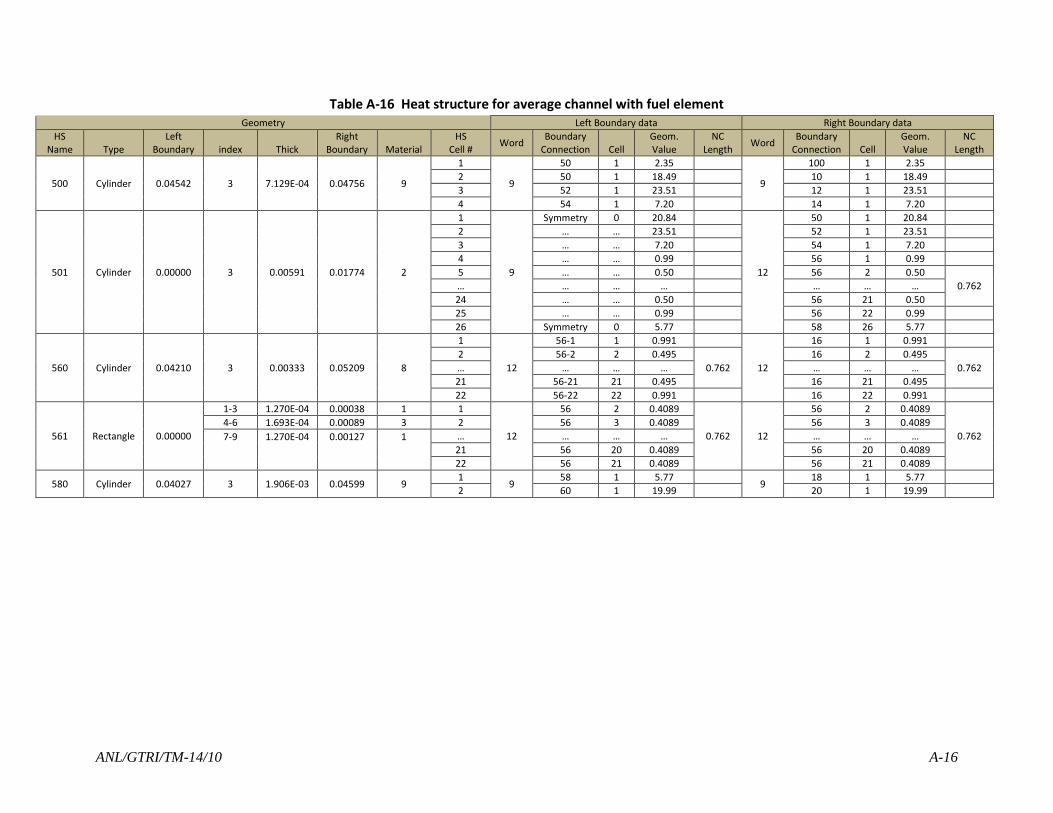
ANL/GTRI/TM-14/10 A-16
Table A-16 Heat structure for average channel with fuel element Geometry Left Boundary data Right Boundary data
HS Name Type
Left Boundary index Thick
Right Boundary Material
HS Cell #
Word Boundary
Connection Cell Geom. Value
NC Length
Word Boundary
Connection Cell Geom. Value
NC Length
500 Cylinder 0.04542 3 7.129E-04 0.04756 9
1
9
50 1 2.35
9
100 1 2.35
2 50 1 18.49 10 1 18.49
3 52 1 23.51 12 1 23.51
4 54 1 7.20 14 1 7.20
501 Cylinder 0.00000 3 0.00591 0.01774 2
1
9
Symmetry 0 20.84
12
50 1 20.84
2 … … 23.51 52 1 23.51
3 … … 7.20 54 1 7.20
4 … … 0.99 56 1 0.99
5 … … 0.50 56 2 0.50
0.762 … … … … … … …
24 … … 0.50 56 21 0.50
25 … … 0.99 56 22 0.99
26 Symmetry 0 5.77 58 26 5.77
560 Cylinder 0.04210 3 0.00333 0.05209 8
1
12
56-1 1 0.991
12
16 1 0.991
2 56-2 2 0.495
0.762
16 2 0.495
0.762 … … … … … … …
21 56-21 21 0.495 16 21 0.495
22 56-22 22 0.991 16 22 0.991
561 Rectangle 0.00000
1-3 1.270E-04 0.00038 1 1
12
56 2 0.4089
0.762 12
56 2 0.4089
0.762
4-6 1.693E-04 0.00089 3 2 56 3 0.4089 56 3 0.4089
7-9
1.270E-04
0.00127
1
… … … … … … …
21 56 20 0.4089 56 20 0.4089
22 56 21 0.4089 56 21 0.4089
580 Cylinder 0.04027 3 1.906E-03 0.04599 9 1
9 58 1 5.77
9 18 1 5.77
2 60 1 19.99 20 1 19.99
ANL/GTRI/TM-14/10 A-17
A.6.2 High heat flux fuel channel
The heat structures of the high heat flux channel are similar to the average fuel channel except for the
core region where the fuel element has been discretized into four structures (Table A-17). Three of
these are a 10 degree arc representing the axial high heat flux stripe of the outer three fuel element
plates. The fourth is the remainder of the fuel in this channel.
Heat structures 300, 301 and 380
Same as described for the average fuel channel except that the surface area and length of the thermal
connections were based on a single channel.
Heat structure 360
Represents the portion of the fuel element in the high heat flux channel that is not associated with the
hot stripes. This was modeled as a plate geometry similar to that of heat structure 561. Its surface area
was based on that of the fuel element minus the hot stripe structures.
Heat structure 364, 365 and 366
Represents the hot stripes associated with fuel element plates 4, 5 and 6. The structures were thermally
connected to neighboring coolant volumes where the left connection was considered inward and the
right connection considered outward. The left side of plate 4 was connected to the coolant volume
associated with the remainder of the channel.
Heat structure 367
Represents the 10 degree arc of the beryllium channel in the core region. Because of the small angle,
this structure was modeled as a plate geometry connected to volume 367 at its left side and to volume
16 at its right side.
Heat structure 368
Represents the remainder of the beryllium channel within the core region. The structure was modeled
as cylindrical geometry with the proper inner diameter and a slightly reduced outer diameter (relative to
structure 560) to compensate from the volume of beryllium in heat structure 367.
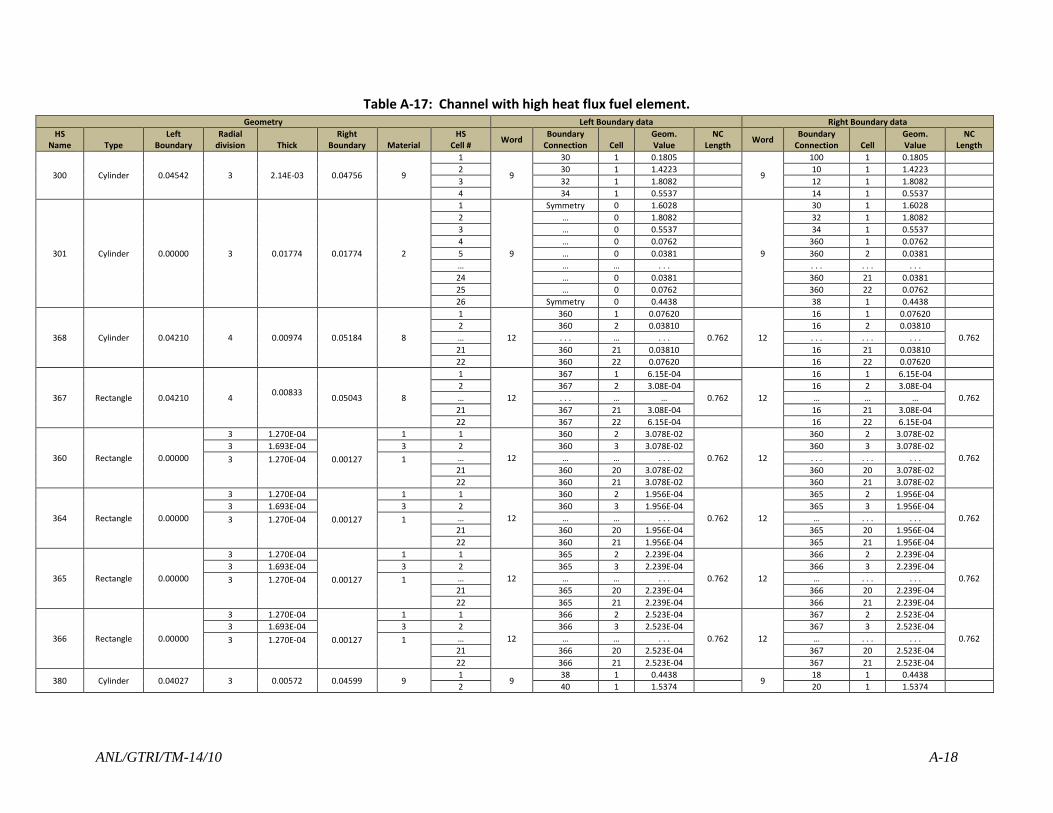
ANL/GTRI/TM-14/10 A-18
Table A-17: Channel with high heat flux fuel element. Geometry Left Boundary data Right Boundary data
HS Name Type
Left Boundary
Radial division Thick
Right Boundary Material
HS Cell #
Word Boundary
Connection Cell Geom. Value
NC Length
Word Boundary
Connection Cell Geom. Value
NC Length
300 Cylinder 0.04542 3 2.14E-03 0.04756 9
1
9
30 1 0.1805
9
100 1 0.1805
2 30 1 1.4223 10 1 1.4223
3 32 1 1.8082 12 1 1.8082
4 34 1 0.5537 14 1 0.5537
301 Cylinder 0.00000 3 0.01774 0.01774 2
1
9
Symmetry 0 1.6028
9
30 1 1.6028
2 … 0 1.8082 32 1 1.8082
3 … 0 0.5537 34 1 0.5537
4 … 0 0.0762 360 1 0.0762
5 … 0 0.0381 360 2 0.0381
… … … . . . . . . . . . . . .
24 … 0 0.0381 360 21 0.0381
25 … 0 0.0762 360 22 0.0762
26 Symmetry 0 0.4438 38 1 0.4438
368 Cylinder 0.04210 4 0.00974 0.05184 8
1
12
360 1 0.07620
12
16 1 0.07620
2 360 2 0.03810
0.762
16 2 0.03810
0.762 … . . . … . . . . . . . . . . . .
21 360 21 0.03810 16 21 0.03810
22 360 22 0.07620 16 22 0.07620
367 Rectangle 0.04210 4 0.00833
0.05043 8
1
12
367 1 6.15E-04
12
16 1 6.15E-04
2 367 2 3.08E-04
0.762
16 2 3.08E-04
0.762 … . . . … … … … …
21 367 21 3.08E-04 16 21 3.08E-04
22 367 22 6.15E-04 16 22 6.15E-04
360 Rectangle 0.00000
3 1.270E-04
0.00127
1 1
12
360 2 3.078E-02
0.762 12
360 2 3.078E-02
0.762
3 1.693E-04 3 2 360 3 3.078E-02 360 3 3.078E-02
3
1.270E-04
1
… … … . . . . . . . . . . . .
21 360 20 3.078E-02 360 20 3.078E-02
22 360 21 3.078E-02 360 21 3.078E-02
364 Rectangle 0.00000
3 1.270E-04
0.00127
1 1
12
360 2 1.956E-04
0.762 12
365 2 1.956E-04
0.762
3 1.693E-04 3 2 360 3 1.956E-04 365 3 1.956E-04
3
1.270E-04
1
… … … . . . … . . . . . .
21 360 20 1.956E-04 365 20 1.956E-04
22 360 21 1.956E-04 365 21 1.956E-04
365 Rectangle 0.00000
3 1.270E-04
0.00127
1 1
12
365 2 2.239E-04
0.762 12
366 2 2.239E-04
0.762
3 1.693E-04 3 2 365 3 2.239E-04 366 3 2.239E-04
3
1.270E-04
1
… … … . . . … . . . . . .
21 365 20 2.239E-04 366 20 2.239E-04
22 365 21 2.239E-04 366 21 2.239E-04
366 Rectangle 0.00000
3 1.270E-04
0.00127
1 1
12
366 2 2.523E-04
0.762 12
367 2 2.523E-04
0.762
3 1.693E-04 3 2 366 3 2.523E-04 367 3 2.523E-04
3
1.270E-04
1
… … … . . . … . . . . . .
21 366 20 2.523E-04 367 20 2.523E-04
22 366 21 2.523E-04 367 21 2.523E-04
380 Cylinder 0.04027 3 0.00572 0.04599 9 1
9 38 1 0.4438
9 18 1 0.4438
2 40 1 1.5374 20 1 1.5374

ANL/GTRI/TM-14/10 A-19
A.6.3 Plugged channel
The structure describing the plugged channel is similar to the average fuel channel except that the core
contains a cylinder representative of the plug material instead of fuel plates (Table A-18).
Heat structure 700, 701 and 780
Same as described for the average fuel channel except that the surface area and length of the thermal
connections were based on the consolidation of the 65 channels attributed to the plugged channel.
Heat structure 702
Represents the “plugs” within the fuelled region. This was modeled as a cylinder thermally connected to
coolant volume 76.
Heat structure 760
Represents the beryllium channel within the core region and is similar to heat structure 560.

ANL/GTRI/TM-14/10 A-20
Table A-18: heat structure describing plugged channel. Geometry Left Boundary data Right Boundary data
HS Name Type
Left Boundary index Thick
Right Boundary Material
HS Cell #
Word Boundary
Connection Cell Geom. Value
NC Length
Word Boundary
Connection Cell Geom. Value
NC Length
700 Cylinder 0.05018 3 1.076E-03 0.05340 9
1
9
70 1 11.73
9
100 1 11.73
2 70 1 92.45 10 1 92.45
3 72 1 117.53 12 1 117.53
4 74 1 35.99 14 1 35.99
701 Cylinder 0.00000 3 7.181E-03 0.02154 2
1
9
Symmetry 0 104.18
9
70 1 104.18 2 … … 117.53 72 1 117.53 3 … … 35.99 74 1 35.99 4 … … 4.953 76-1 1 4.953 5 … … 2.477 76-2 2 2.477
… … … … … … … 24 … … 2.477 76-21 21 2.477 25 … … 4.953 76-22 22 4.953 26 Symmetry 0 28.85 78 1 28.85
702 Cylinder 0.00000 3 1.430E-02 0.04291 8
1
12
Symmetry 0 4.953
12
76-1 1 4.953
2 … … 2.477
0.762
76-2 2 2.477
0.762 … … … … … … …
21 … … 2.477 76-21 21 2.477
22 Symmetry 0 4.953 76-22 22 4.953
760 Cylinder 0.04751
3 4.488E-03 0.06097 8 1
12
76-1 1 4.953
0.762
12
16-1 1 4.953
0.762
4-6 1.693E-04 0.00089 3 2 76-2 2 2.477 16-2 2 2.477
7-9
1.270E-04
0.00127
1
… … … … … … …
21 76-21 21 2.477 16-21 21 2.477
22 76-22 22 4.953 16-22 22 4.953
780 Cylinder 0.04617 3 2.123E-03 0.05254 9 1 9 78 1 28.85 9 18 1 28.85
2 80 1 99.93 20 2 99.93
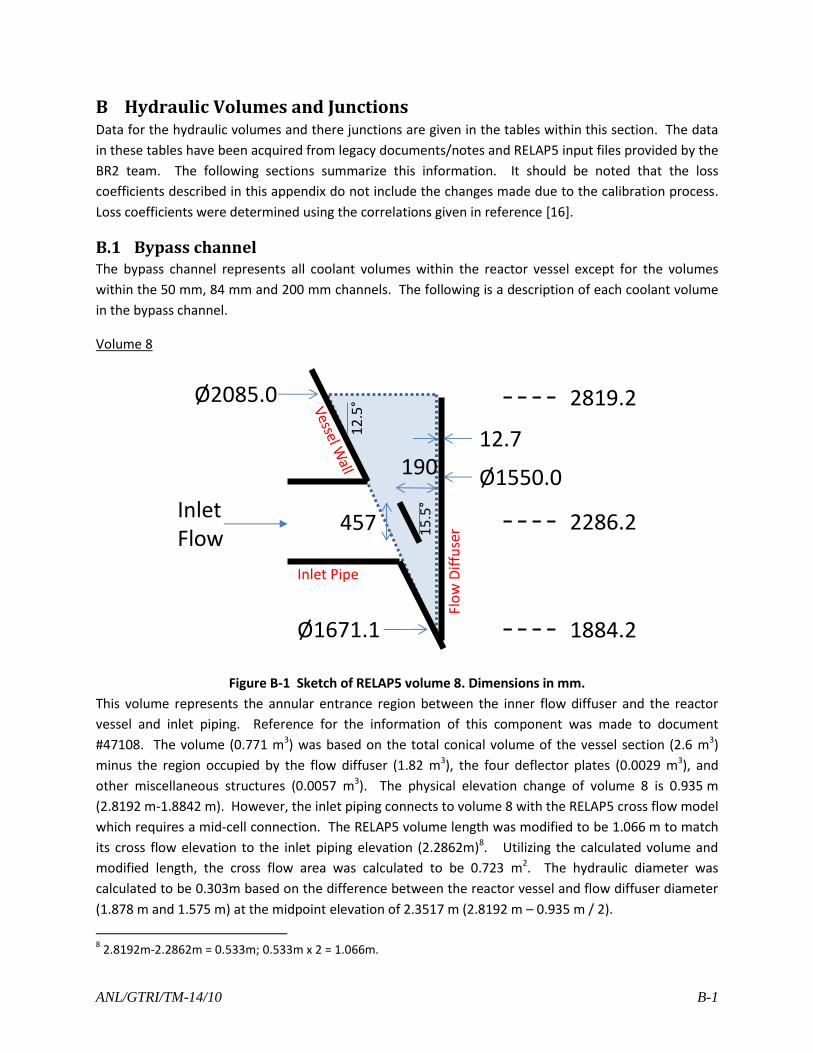
ANL/GTRI/TM-14/10 B-1
B Hydraulic Volumes and Junctions Data for the hydraulic volumes and there junctions are given in the tables within this section. The data
in these tables have been acquired from legacy documents/notes and RELAP5 input files provided by the
BR2 team. The following sections summarize this information. It should be noted that the loss
coefficients described in this appendix do not include the changes made due to the calibration process.
Loss coefficients were determined using the correlations given in reference [16].
B.1 Bypass channel The bypass channel represents all coolant volumes within the reactor vessel except for the volumes
within the 50 mm, 84 mm and 200 mm channels. The following is a description of each coolant volume
in the bypass channel.
Volume 8
Figure B-1 Sketch of RELAP5 volume 8. Dimensions in mm.
This volume represents the annular entrance region between the inner flow diffuser and the reactor
vessel and inlet piping. Reference for the information of this component was made to document
#47108. The volume (0.771 m3) was based on the total conical volume of the vessel section (2.6 m3)
minus the region occupied by the flow diffuser (1.82 m3), the four deflector plates (0.0029 m3), and
other miscellaneous structures (0.0057 m3). The physical elevation change of volume 8 is 0.935 m
(2.8192 m-1.8842 m). However, the inlet piping connects to volume 8 with the RELAP5 cross flow model
which requires a mid-cell connection. The RELAP5 volume length was modified to be 1.066 m to match
its cross flow elevation to the inlet piping elevation (2.2862m)8. Utilizing the calculated volume and
modified length, the cross flow area was calculated to be 0.723 m2. The hydraulic diameter was
calculated to be 0.303m based on the difference between the reactor vessel and flow diffuser diameter
(1.878 m and 1.575 m) at the midpoint elevation of 2.3517 m (2.8192 m – 0.935 m / 2).
8 2.8192m-2.2862m = 0.533m; 0.533m x 2 = 1.066m.
2286.2
1884.2Ø1671.1
Ø1550.0
457
190
12
.5°
15
.5°
12.7
2819.2Ø2085.0
InletFlow
Inlet Pipe
Flo
w D
iffu
ser

ANL/GTRI/TM-14/10 B-2
Junction between Volume 8 and 10
The hydraulic junction between volume 8 and 10 is integral to volume 8. The hydraulic diameter and
flow rate were based on the values calculated for volume 8 and the flow resistance was calculated with
the abrupt area change model within RELAP5. The inlet pipe was connected to this branch utilizing a
cross flow junction.
Volume 10
Figure B-2 Sketch of RELAP5 volume 10. Dimensions in mm.
This volume represents the upper region of the reactor vessel. The elevation for this volume was
specified as 2.8192 m to 4.2280 m. Its interior volume includes the upper vessel cover (2.34 m3), the
cylindrical body (1.66 m3) and upper part of the conical vessel above the reactor core (0.38 m3). The
total volume, minus the internal structures (-0.051 m3 - 0.736 m3 - 0.294 m3), was calculated to be
3.3 m3. ). The hydraulic diameter (4*2.34 m2/30.72 m = 0.3047 m) was determined from the flow area
and wetted perimeter. The cross section area was calculated by dividing the volume by the length
(2.34 m2). The wetted perimeter was calculated from the surface of the structures divided by their
lengths.
Junction between Volume 10 and 12
This junction was integral to volume 12. The hydraulic diameter and flow area were based on that
calculated for volume 10. No flow loss coefficients were included in this junction due to the relatively
small pressure drop associated with it.
4228.0
Ø2134.0
Ø2085.0
3393.0
2930.02819.2
ANL/GTRI/TM-14/10 B-3
Volume 12
Figure B-3 Sketch of RELAP5 volume 12. Dimensions in mm.
Volume 12 represents the volume inside the flow diffuser (1.764m3) and a portion of the conical vessel
above the core region (1.5 m3). The elevation was specified as 1.011 m to 2.8192 m. The total volume
excluding internal structure (1.28 m3) was calculated to be 1.98 m3. From this, the flow area was
calculated to be 1.096m2 (1.98m3/[2.819m-1.011m]). The hydraulic diameter was calculated to be
0.148m and was calculated from the cross sectional flow area and wetted perimeter. The wetted
perimeter for the vessel and the channels was calculated from their surface area divided by their length.
Junction between Volume 12 and 14
The hydraulic connection between volumes 12 and 14 was modeled as integral to volume 14. The cross
sectional area was determined by subtracting the area of the three channel sizes from the area of the
reactor vessel (0.140 m2). BR2 notes indicate this area was taken at a specific elevation where the inner
radius of the vessel was 0.58235 m. Utilizing the loss coefficient equation for thick edged orifices:
𝑘 = 0.5 (1 −𝐹0
𝐹1) + (1 −
𝐹0
𝐹2) ;
𝐹0
𝐹1=
0.140
1.095;
𝐹0
𝐹2=
0.140
0.358
the forward loss coefficient was found to be 0.82 and the reverse loss coefficient was found to be 1.07.
The hydraulic diameter of this junction was calculated from the flow area and wetted perimeter of the
vessel and three channel sizes (4*0.140m2/[3.66+2.85+20.17+4.76]=0.0178m).
Volume 14
Volume 14 is the region between the upper matrix support and the core region. Its elevation was
specified as 0.4572 m to 1.011 m. The volume was determined by subtracting the volume occupied by
the 79 channels and heat structure 140 from the volume bounded by the vessel (0.607 m3 - 0.409 m3-
0.0078m3=0.190m3). The cross sectional area was calculated from the volume divided by the length
(0.190m3/0.554m = 0.343m2) and the hydraulic diameter was calculated from the cross sectional flow
area and wetted perimeter (4*0.343m2/[3.66m+2.21m+18.8m+3.9m]=0.048).
1011.0
1884.2
2819.2Ø1550.0
Ø1406.6

ANL/GTRI/TM-14/10 B-4
Junction between volumes 14 and 16
The hydraulic junction between volumes 14 and 16 was modeled with the hydraulic diameter and flow
area calculated for volume 16 (based on representing the junction by the volume with the smallest flow
area). Utilizing the loss coefficient equation for sudden contraction:
𝑘𝑓𝑜𝑟𝑤𝑎𝑟𝑑 = 0.5 (1 −𝐹0
𝐹1) ; 𝑘𝑟𝑒𝑣𝑒𝑟𝑠𝑒 = (1 −
𝐹0
𝐹1)2
; 𝐹0
𝐹1=
0.0386
0.343
the forward and reverse loss coefficients were calculated to be 0.45 and 0.80, respectively.
Volume 16
Volume 16 represents the core bypass. The elevation for this volume was specified as -0.4572 m to
0.4572 m. Its hydraulic diameter was calculated from the difference in vessel and matrix diameter
(1.1070m-1.0999m = 0.0071m) at the core mid-plane. The cross-sectional flow area was determined
from its volume divided by its length (0.0353m3/0.9144m = 0.0386m2). Here, the volume consisted of
three components:
1. The space between the vessel and the matrix (0.0127 m3),
2. 24 cooling holes of 15.2 mm diameter within the beryllium matrix (0.0126 m3), and
3. Spacing between the channels (0.01 m3)9.
Junction between volumes 16 and 18
The hydraulic junction between volumes 16 and 18 was modeled with the hydraulic diameter and flow
area calculated for volume 16. Utilizing the loss coefficient equation for sudden expansion:
𝑘𝑓𝑜𝑟𝑤𝑎𝑟𝑑 = (1 −𝐹0
𝐹1)2
; 𝑘𝑟𝑒𝑣𝑒𝑟𝑠𝑒 = 0.5 (1 −𝐹0
𝐹1) ;
𝐹0
𝐹1=
0.0386
0.417
the forward and reverse loss coefficients were calculated to be 0.82 and 0.45, respectively.
Volume 18
Figure B-4 Sketch of RELAP5 volume 18. Dimensions in mm.
Volume 18 is the region immediately below the core. Its elevation was specified as -0.901 m
to -0.4572 m. Relative to the vessel, it is located at the intersection of the cylindrical section of vessel in
9 This was based on a nominal spacing of 0.4 mm between each of the channels.
-901.0
-457.2 Ø1107.0
Ø1319.0
ANL/GTRI/TM-14/10 B-5
the core region and the conical section beneath it. Thus, its internal volume was the sum of volume
within these regions minus the internal structures (0.127m3+0.361m3 – 0.303m3 = 0.185m3). The flow
area was found from dividing the volume by its height (0.185m3/0.4438m = 0.4169m2). The hydraulic
diameter was calculated to be 0.059 based on the flow area and wetted perimeter. The wetted
perimeter of the vessel was based on the surface area divided by the height.
Junction between volumes 18 and 20
The hydraulic connection between volume 18 and volume 20 is integral to volume 20. A flow area of
0.144 m2 was calculated by taking the difference between the vessel area and three flow channel size
areas (pi*1.166m^2/4 – 0.5m2-0.064m2-0.36m2). The hydraulic diameter was calculated to be 0.018m.
Utilizing the loss coefficient equation for thick edged orifices:
𝑘 = 0.5 (1 −𝐹0
𝐹1) + (1 −
𝐹0
𝐹2) ;
𝐹0
𝐹1=
0.144
0.417;
𝐹0
𝐹2=
0.144
0.660
the forward and reverse loss coefficients were calculated to be 0.9 and 0.82, respectively.
Volume 20
Figure B-5 Sketch of RELAP5 volume 20. Dimensions in mm.
Volume 20 is located between the outlet flow guide flow channels and its elevation was specified
as -2.4384 m to -0.901 m. The total volume was constructed from 4 regions; two upper cylindrical
sections, a conical section and a lower region where the flow channels mate with the support grid. After
subtraction of the flow channel volumes the resulting volume was found to be 1.015m3 (2.026m3 –
1.011m3). Utilizing the volume height of 1.537m, the cross section flow area was found to be 0.660m2. A
hydraulic diameter of 0.095m was based on the flow area and the total wetted perimeter of the flow
guide and flow channels.
Junction between volumes 20 and 24
-2438.0
-901.0 Ø1166.0
Ø1285.0
Ø1285.0 / Ø1549.0 Ø1549.0
-1031.0
-1416.0
-2248.0
-2286.0

ANL/GTRI/TM-14/10 B-6
The hydraulic connection between volumes 20 and 24 consists of 24 holes represented by a junction
integral to Volume 20. The total cross-sectional area of the junction was calculated to be 0.146m2. The
total wetted perimeter was calculated to be 7.10 m. The hydraulic diameter was specified as 0.095m.
The forward and reverse flow loss coefficients were calculated by using the lookup tables for a sharp
edged orifice:
Forward F0/F1 = 0.146/0.660 = 0.22, F0/F2 = 0.146/1.067 = 0.136: k = 2.22
Reverse F0/F1 = 0.146/1.067 = 0.136, F0/F2 = 0.146/0.660 = 0.22: k = 2.07
Volume 22
Figure B-6 Sketch of RELAP5 volume 22. Dimensions in mm.
The flow from the fuel channels discharges into Volume 22 located at the bottom of the reactor vessel
and has been included in the bypass flow channel since its model does not change with core
configuration. Its elevation was specified as -4.9519 m to -2.4384 m. The total volume was calculated to
be 8.0 m3 based on four distinct volumes consisting of a conical region just below the support plate, a
thin cylindrical section of relatively small diameter, the main cylindrical body and the lower vessel cover.
The cross sectional flow area was based on the volume divided by its height
(8 m3 / 2.5235 m = 3.183 m2). Calculations were not found for the hydraulic diameter but the specified
value of 2.01 m seems to be reasonable value based on the diameters of the components.
Junction between volumes 22 and 24
The hydraulic connection between volumes 22 and 24 consists of 10 holes represented by a junction
integral to Volume 24. The total cross-sectional area of the junction was specified as 1.138m2. The
hydraulic diameter was calculated as 4*Pw/Dh = 4*1.138/(0.18*2+.345+pi*0.1815) = 0.357m. The
forward and reverse flow loss coefficients were calculated by using the lookup tables for a sharp edged
orifice:
Forward F0/F1 = 1.138/3.183 = 0.358, F0/F2 = 1.138/1.067 = ~1: k = 0.33
-4117.0
-2438.0 Ø1756.0Ø2063.0Ø1756.0
Ø2134.0
-2845.0
-4952.0
-2794.01
3
4
2

ANL/GTRI/TM-14/10 B-7
Reverse F0/F1 = 1.138/1.067 = ~1, F0/F2 = 1.138/3.183 = 0.358: k = 0.41
Volume 24
Figure B-7 Sketch of RELAP5 volume 24. Dimensions in mm.
Volume 24 represents the volume of fluid between the reactor vessel and the outlet flow guide. The
elevation was specified as -2.8576 m to -0.9010 m. The geometry of this volume in RELAP5 was
modeled based on the constraints of its junctions to volume 22 and the exit piping. The cross flow
model was used to connect the outlet piping to volume 24. Since this was modeled as a branch, its
crossflow connection to the outlet piping required that the branch mid plane be equivalent to the
elevation of the outlet piping. The length of the branch (1.677 m) was chosen so that its inlet
connection was at the same elevation as the outlet elevation of volume 20. The cross sectional flow
area (1.07 m2) was determined by dividing the coolant volume (1.784 m3) by its length (1.677 m). The
coolant volume was determined by calculating the volume in the vessel (5.37 m3) and subtracting from
this the internal structures/coolant (flow guide 1.94 m3, channel support plate 0.252 m3, grille plate
1.344 m3 and support structure 0.0454 m3).
-2857.6
Ø1407.0
Ø2134.0
-1599.8
-2438.4
-1031.0
-2101.0
Flow guide
Support plate
Grille plate
Support structure

ANL/GTRI/TM-14/10 B-8
Table B-1 Description of coolant volume for the bypass channel
RELAP5 #
Type Node Actual Length
Flow Area Volume Hydraulic Diameter
Wall Roughness
Lower Elevation
Upper Elevation
[m] [m2] [m3] [m] [m] [m] [m]
8 Branch 1 1.0660 0.72327 0.7710 0.30300 3.20E-06 1.7532 2.8192
10 Snglvol 1 1.4088 2.34242 3.3000 0.30470 3.20E-06 2.8192 4.2279
12 Snglvol 1 1.8082 1.09513 1.9802 0.14800 3.20E-06 1.0109 2.8192
14 Snglvol 1 0.5537 0.34296 0.1899 0.04800 3.20E-06 0.4572 1.0109
16 Pipe
1 0.0762
0.03860 0.0353 0.00710 3.20E-06 -0.4572 0.4572
2 0.0381
… …
21 0.0381
22 0.0762
18 Snglvol 1 0.4438 0.41685 0.1850 0.05900 3.20E-06 -0.901 -0.4572
20 Snglvol 1 1.5374 0.66021 1.0150 0.09500 3.20E-06 -2.4384 -0.901
22 Snglvol 1 2.5130 3.18300 7.9989 2.01000 3.20E-06 -4.9519 -2.4384
24 Branch 1 1.6772 1.06666 1.7890 0.36400 3.20E-06 -2.4384 -0.7612
Table B-2 Description of junction for the bypass channel
RELAP5 #
Type Junction
# From Type To Type
Hydraulic Diameter
Area Abrupt
Area Change
Forward K
Reverse K
[m] [m2] [-] [-]
951 Sngljun 1 255 Outlet 8 Crossflow 0.581 0.265142 No 0 0
953 Sngljun 1 265 Outlet 8 Crossflow 0.581 0.265142 No 0 0
8 Branch 1 8 Outlet 10 Inlet 0 0 Yes 0 0
12 Branch 1 10 Inlet 12 Inlet 0 0 No 0 0
14 Branch 1 12 Outlet 14 Inlet 0.0178 0.14 No 1.04 1.04
2 14 Outlet 16 Inlet 0 0 No 0 0
18 Branch 1 16 Outlet 18 Inlet 0 0 No 0 0
20 Branch 1 18 Outlet 20 Inlet 0.018 0.144 No 0.9 0.82
2 20 Outlet 24 Inlet 0.088 0.146 No 2.22 2.07
24 Branch
1 22 Outlet 24 Inlet 0.364 1.138 No 0.33 0.41
2 24 Crossflow 201 Inlet 0.581 0.265412 No 1.28 1.66
3 24 Crossflow 211 Inlet 0.581 0.265412 No 1.28 1.66
991 Sngljun 1 24 Crossflow 201 Inlet 0.581 0.265412 No 1.28 1.66
992 Sngljun 1 24 Crossflow 211 Inlet 0.581 0.265412 No 1.28 1.66

ANL/GTRI/TM-14/10 B-9
B.2 High heat flux fuel channel (1963 core) The high heat flux channel represents the coolant within a single 84 mm channel containing a fuel
assembly with the highest heat flux. It is comprised of coolant volumes 30 through 40. Within the core
region volume 36 was split into 4 components (Figure 6) corresponding to the hot stripe heat structures
and remainder of the fuel assembly to be more conservative relative to the enthalpy change across the
fuel. The components corresponding to the hot stripe were also determined based on a 10 degree arc
length for the outer 3 sub-channels. Volumes 365, 366 and 367 represent the 5th, 6th and 7th sub
channel, respectively. Volume 360 represents the remainder of the channels within the high heat flux
fuel assembly. The following is a description of the junctions within the high heat flux channel.
Junctions of branch 32
The junction between volumes 30 and 32 was modeled based on the smaller flow area of the two
volumes and the abrupt area change modeled was used to determine pressure losses.
Cross flow between volumes 12 and 32 occurs through 480 holes with a diameter of 6.35mm. The holes
are arranged such that there are 6 per axial location at 80 different elevations with an axial distance of
0.0195m. The total cross sectional flow area was calculated to be 0.0152m2 and the hydraulic diameter
was specified as the diameter of the holes. The forward and reverse loss coefficients were determined
to be 2.76 based on the following formula for sharp edged orifices:
𝑘𝑓𝑜𝑟𝑤𝑎𝑟𝑑 = 𝑘𝑏𝑎𝑐𝑘𝑤𝑎𝑟𝑑 = (1 + 0.707√1 −𝐹0
𝐹1−
𝐹0
𝐹2)
2
; 𝐹0
𝐹1=
𝐹0
𝐹2=
0.00019
0.0058
Junctions of branch 34
The junction between volume 32 and 34 was modeled based on the smaller flow area of the two
volumes.
Cross flow between volumes 14 and 34 occurs through 60 holes with a diameter of 4.76mm. There are
6 holes per axial location and are separated axially of 0.027m. The total flow area was calculated to be
0.0011m and the hydraulic diameter was based on the diameter of the holes. The forward and reverse
flow loss coefficients were determined to be 2.85 based on the following formula for sharp edged
orifices:
𝑘𝑓𝑜𝑟𝑤𝑎𝑟𝑑 = 𝑘𝑏𝑎𝑐𝑘𝑤𝑎𝑟𝑑 = (1 + 0.707√1 −𝐹0
𝐹1−
𝐹0
𝐹2)
2
; 𝐹0
𝐹1=
𝐹0
𝐹2=
0.00011
0.0077
The junctions at the core inlet (34-360, 34-365, 34-366, 34-367) were based on the smaller flow areas
for each and the abrupt area change model was not used as these loss coefficients were determined by
the calibration process described in Section 3.

ANL/GTRI/TM-14/10 B-10
Junctions of branch 38
The junctions at the core exit (360-38, 365-38, 366-38, 367-38) were based on the smaller flow areas for
each the abrupt area change model was not used as these loss coefficients were determined by the
calibration process described in Section 2.6.4.
Cross flow between volumes 38 and 18 was modeled with 60 holes having a diameter of 0.00635m.
There are 6 holes per elevation and an axial spacing of 0.027m. The total flow area was calculated to be
0.0019m and the hydraulic diameter was based on the diameter of the holes. The forward and reverse
flow loss coefficients were determined to be 2.80 based on the sharp edged orifice formula:
𝑘𝑓𝑜𝑟𝑤𝑎𝑟𝑑 = 𝑘𝑏𝑎𝑐𝑘𝑤𝑎𝑟𝑑 = (1 + 0.707√1 −𝐹0
𝐹1−
𝐹0
𝐹2)
2
; 𝐹0
𝐹1=
𝐹0
𝐹2=
0.00019
0.0077
Junctions of branch 40
The hydraulic junction between volumes 40 and 22 was characteristic of thick edged orifice with flow
area of 0.0038m2 and hydraulic diameter of 0.07m. The reverse and forward loss coefficients were
calculated to be 1.18 and 1.56, respectively, based on the following correlation for a thick edged orifice:
𝑘 = 0.5 (1 −𝐹0
𝐹1) + (1 −
𝐹0
𝐹2)2+ 𝜏√1 −
𝐹0
𝐹1(1 −
𝐹0
𝐹2) ; 𝜏 = 0.12;
𝐹0
𝐹1=
0.0038
0.0050;
𝐹0
𝐹2=
0.0038
3.18
ANL/GTRI/TM-14/10 B-11
Table B-3 Hydraulic parameters for high heat flux fuel channel volumes
RELAP5 #
Type Node Actual Length
Flow Area Volume Hydraulic Diameter
Wall Roughness
Lower Elevation
Upper Elevation
[m] [m2] [m3] [m] [m] [mm] [m]
30 Snglvol 1 1.6028 0.00564 0.00904 0.04212 1.60E-06 2.8191 4.4219
32 Branch 1 1.8082 0.00558 0.01009 0.04180 1.60E-06 1.0109 2.8191
34 Branch 1 0.5537 0.00463 0.00256 0.03661 1.60E-06 0.4572 1.0109
360 Pipe
1 0.0762
3.415E-03
2.618E-04
0.00574 1.60E-06
-0.4572 0.4572
2 0.0381 1.309E-04
… … …
21 0.0381 1.309E-04
22 0.0762 2.618E-04
365 Pipe
1 0.0762
1.646E-05
1.254E-06
0.00598 1.60E-06
2 0.0381 6.272E-07
… … …
21 0.0381 6.272E-07
22 0.0762 1.254E-06
366 Pipe
1 0.0762
1.875E-05
1.429E-06
0.00600 1.60E-06
2 0.0381 7.144E-07
… … …
21 0.0381 7.144E-07
22 0.0762 1.429E-06
367 Pipe
1 0.0762
2.479E-05
1.889E-06
0.00704 1.60E-06
2 0.0381 9.444E-07
… … …
21 0.0381 9.444E-07
22 0.0762 1.889E-06
38 Branch 1 0.4438 0.00497 0.00221 0.04837 1.60E-06 -0.9010 -0.4572
40 Branch 1 1.5374 0.00497 0.00765 0.07961 1.60E-06 -2.4384 -0.9010
ANL/GTRI/TM-14/10 B-12
Table B-4 Junction parameters for high heat flux fuel channel volumes
RELAP5 #
Type Junction
# From Type To Type
Hydraulic Diameter
Area Abrupt
Area Change
Forward K
Reverse K
[m] [m2] [-] [-]
32 Branch 1 30 Inlet 32 Inlet 0 0 Yes 0 0
2 32 Crossflow 12 Crossflow 0.00635 0.01520 No 2.76 2.76
34 Branch
1 32 Outlet 34 Inlet 0 0 No 0 0
2 34 Crossflow 14 Crossflow 0.00476 1.068E-03 No 2.85 2.85
3 34 Outlet 360 Inlet 0 0 No 0 0
4 34 Outlet 365 Inlet 0 0 No 0 0
5 34 Outlet 366 Inlet 0 0 No 0 0
6 34 Outlet 367 Inlet 0 0 No 0 0
38 Branch
1 360 Outlet 38 Inlet 0 0 No 0 0
2 365 Outlet 38 Inlet 0 0 No 0 0
3 366 Outlet 38 Inlet 0 0 No 0 0
4 367 Outlet 38 Inlet 0 0 No 0 0
5 38 Crossflow 18 Crossflow 0.00635 1.900E-03 No 2.8 2.8
40 Branch 1 38 Outlet 40 Inlet 0 0 Yes 0 0
2 40 Outlet 22 Inlet 0 0 No 1.18 1.56
B.3 Average fuel channel (1963 core) The average fuel channel is comprised of coolant volumes 50 to 60. The junctions and volumes are
identical to the high heat flux fuel channel except that the cross sectional flow areas were based on 13
channels with fuel elements instead of 1 and the core region (volume 56) wasn’t expanded into multiple
components.
Table B-5 Hydraulic parameters for average fuel channel volumes
RELAP5 #
Type Node Actual Length
Flow Area Volume Hydraulic Diameter
Wall Roughness
Lower Elevation
Upper Elevation
[m] [m2] [m3] [m] [m] [m] [m]
50 Snglvol 1 1.6028 0.07328 0.11746 0.04212 1.60E-06 2.8191 4.4219
52 Branch 1 1.8082 0.07257 0.13122 0.04180 1.60E-06 1.0109 2.8191
54 Branch 1 0.5537 0.06021 0.03334 0.03661 1.60E-06 0.4572 1.0109
56 Pipe
1 0.0762
0.04544
0.00346
0.00583 1.60E-06 -0.4572 0.4572
2 0.0381 0.00173
… … …
21 0.0381 0.00173
22 0.0762 0.00346
58 Branch 1 0.4438 0.06464 0.02869 0.04837 1.60E-06 -0.9010 -0.4572
60 Branch 1 1.5374 0.06466 0.09940 0.07961 1.60E-06 -2.4384 -0.9010

ANL/GTRI/TM-14/10 B-13
Table B-6 Junction parameters for average fuel channel volumes
RELAP5 #
Type Junction
# From Type To Type
Hydraulic Diameter
Area Abrupt
Area Change
Forward K
Reverse K
[m] [m2] [-] [-]
52 Branch 1 52 Inlet 50 Inlet 0 0 Yes 0 0
2 12 Crossflow 52 Crossflow 0.00635 0.19762 No 2.76 2.76
54 Branch
1 52 Outlet 54 Inlet 0 0 No 0 0
2 14 Crossflow 54 Crossflow 0.00476 0.01388 No 2.85 2.85
3 54 Outlet 56 Inlet 0 0 No 0 0
58 Branch 1 56 Outlet 58 Inlet 0 0 No 0 0
2 18 Crossflow 58 Crossflow 0.00635 0.02470 No 2.8 2.8
60 Branch 1 58 Outlet 60 Inlet 0 0 Yes 0 0
2 60 Outlet 22 Inlet 0 0 No 1.18 1.56
B.4 Plugged channel (1963 core) The plugged channel is comprised of coolant volumes 70 through 80. The geometric and hydraulic
parameters for this channel was a consolidation of 10 plugged 50 mm channels, 9 control rods in 84 mm
channels and 5 plugged 200 mm channels. The strategy employed for obtaining a representative
channel was to first determine the geometric and hydraulic parameters for each channel for each of the
6 coolant volume elevations. The representative flow area for each elevation was then determined
from the sum each channel type. The hydraulic diameter was determined from the following equation:
𝐷ℎ =∑ 𝐷ℎ,𝑖𝑁𝑖
𝑖1
∑ 𝑁𝑖𝑖1
where the subscript “i” was used to indicate channel type and “N” was the number of channels for that
type. The plugged channel parameters are given in Table B-7. The following is a brief description of
each of the junctions.
Junctions of branch 72
The junction between volume 70 and 72 was modeled based on the smaller flow area of the two
volumes and the abrupt area change modeled was used to determine pressure losses.
Cross flow between volumes 12 and 72 was occurs through perforations in the three channel types:
50 mm = 480 holes, 84 mm = 480 holes and 200 mm = 1368. The holes in this section have a diameter of
6.35mm with axial spacing of 0.0195m. The total cross sectional area for the 1963 core was 1.1287m2
and the hydraulic diameter was specified as the characteristic hole diameter. The forward and reverse
loss coefficients were determined to be 2.78 based on the following formula for sharp edged orifices:
𝑘𝑓𝑜𝑟𝑤𝑎𝑟𝑑 = 𝑘𝑏𝑎𝑐𝑘𝑤𝑎𝑟𝑑 = (1 + 0.707√1 −𝐹0
𝐹1−
𝐹0
𝐹2)
2
; 𝐹0
𝐹1=
𝐹0
𝐹2=
0.00877
0.2997
Junctions of branch 74

ANL/GTRI/TM-14/10 B-14
The junction between volume 72 and 74 was modeled based on the smaller flow area of the two
volumes.
Cross flow between volumes 14 and 74 was possible through perforations in the three channel types:
50 mm = 60, 84 mm = 60 and 200 mm = 330. The 50 mm and 200 mm channels had hole diameters of
6.35mm while the 84 mm channel had hole diameters of 4.76mm. The total flow area was 0.1247m and
the hydraulic diameter (0.00556m) was based on a number average. The forward and reverse flow loss
coefficients were determined to be 2.85 based on the sharp edged orifice formula:
𝑘𝑓𝑜𝑟𝑤𝑎𝑟𝑑 = 𝑘𝑏𝑎𝑐𝑘𝑤𝑎𝑟𝑑 = (1 + 0.707√1 −𝐹0
𝐹1−
𝐹0
𝐹2)
2
; 𝐹0
𝐹1=
𝐹0
𝐹2=
0.00877
0.33872
Flow into the core region utilized the hydraulic diameter and flow area of volume 76. The abrupt area
change model was not used as these losses were determined by the calibration process described in
Section 2.6.4.
Junctions of branch 78
Flow out of the core region utilized the hydraulic diameter and flow area of volume 76. The abrupt area
change model was not used as these losses were determined by the calibration process described in
Section 2.6.4.
Cross flow between volumes 78 and 18 was similar to that 74 and 14 except the 84 mm channels had
hole diameters of 6.35mm. The hydraulic diameter was based on the diameter of the holes. The
forward and reverse flow loss coefficient remained 2.80.
Junctions of branch 80
The junction between volume 78 and 80 was modeled based on the smaller flow area of the two
volumes and the abrupt area change modeled was used to determine pressure losses.
The hydraulic junction between volumes 80 and 22 was characteristic of a thick edged orifice and
included all three channel sizes. The upstream channel diameters were 0.0472m, 0.0801m and
0.2036m, respectively. The orifice diameters were 0.0349m, 0.0699m and 0.2036m, respectively. The
downstream area was based on that specified for volume 22. The flow area and hydraulic diameter
were based on the upstream geometry. The reverse and forward loss coefficients were calculated to be
0.86 and 0.47, respectively, based on the following correlation (last term has been omitted due to
negligible effect):
𝑘 = 0.5 (1 −𝐹0
𝐹1) + (1 −
𝐹0
𝐹2)2; 𝜏 = 0.12;
𝐹0
𝐹1=
0.364
0.432;
𝐹0
𝐹2=
0.364
3.18

ANL/GTRI/TM-14/10 B-15
Table B-7 Hydraulic parameters for plugged channel volumes
RELAP5 #
Type Node Actual Length
Flow Area Volume Hydraulic Diameter
Wall Roughness
Lower Elevation
Upper Elevation
[m] [m2] [m3] [m] [m] [m] [m]
70 Snglvol 1 1.6028 0.46425 0.74412 0.03648 1.60E-06 2.8191 4.4219
72 Branch 1 1.8082 0.46231 0.83595 0.03629 1.60E-06 1.0109 2.8191
74 Branch 1 0.5537 0.24599 0.13621 0.01898 1.60E-06 0.4572 1.0109
76 Pipe
1 0.0762
0.06394
0.00487
0.00448 1.60E-06 -0.4572 0.4572
2 0.0381 0.00244
… … …
21 0.0381 0.00244
22 0.0762 0.00487
78 Branch 1 0.4438 0.27170 0.12058 0.02924 1.60E-06 -0.9010 -0.4572
80 Branch 1 1.5374 0.42856 0.65888 0.08410 1.60E-06 -2.4384 -0.9010
Table B-8 Junction parameters for plugged channel volumes
RELAP5 #
Type Junction
# From Type To Type
Hydraulic Diameter
Area Abrupt
Area Change
Forward K
Reverse K
[m] [m2] [-] [-]
72 Branch 1 72 Inlet 70 Inlet 0 0 Yes 0 0
2 12 Crossflow 72 Crossflow 0.00635 1.12869 No 2.78 2.78
74 Branch
1 72 Outlet 74 Inlet 0 0 No 0 0
2 14 Crossflow 74 Crossflow 0.00556 0.12468 No 2.80 2.80
3 74 Outlet 76 Inlet 0 0 No 0 0
78 Branch 1 76 Outlet 78 Inlet 0 0 No 0 0
2 18 Crossflow 78 Crossflow 0.00635 0.16626 No 2.8 2.8
80 Branch 1 78 Outflow 80 Inflow 0 0 Yes 0 0
2 80 Outflow 22 Inflow 0 0 No 0.86 0.47
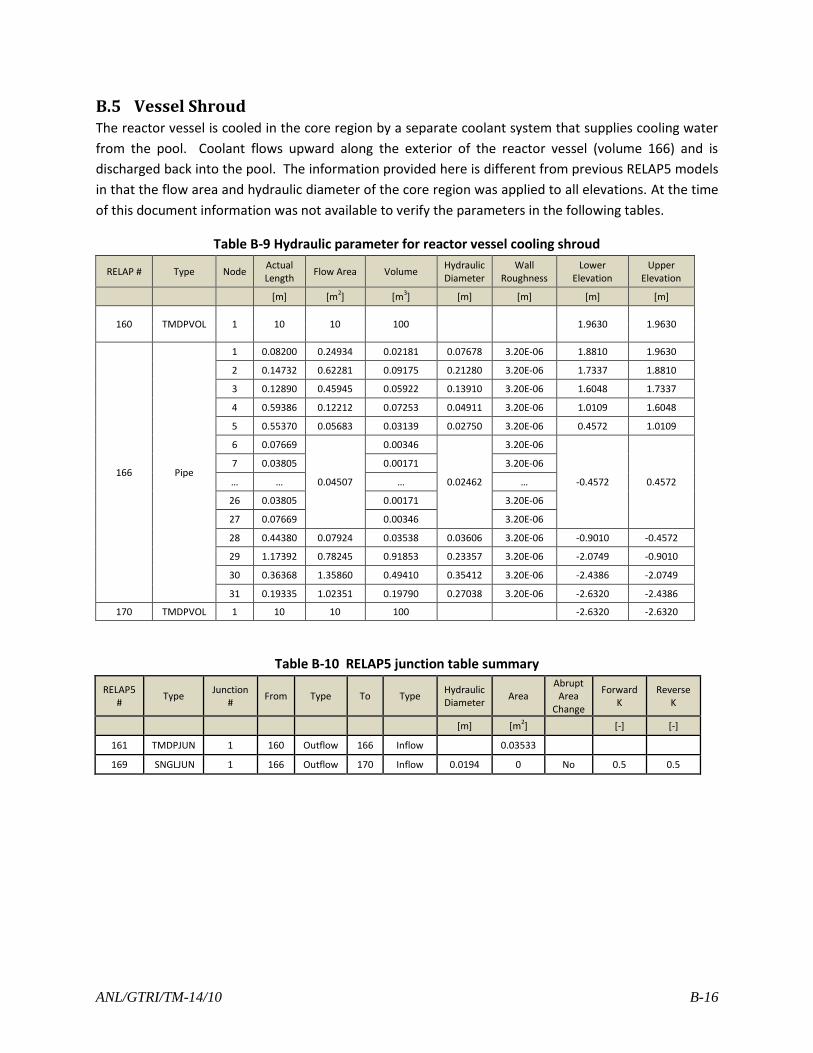
ANL/GTRI/TM-14/10 B-16
B.5 Vessel Shroud The reactor vessel is cooled in the core region by a separate coolant system that supplies cooling water
from the pool. Coolant flows upward along the exterior of the reactor vessel (volume 166) and is
discharged back into the pool. The information provided here is different from previous RELAP5 models
in that the flow area and hydraulic diameter of the core region was applied to all elevations. At the time
of this document information was not available to verify the parameters in the following tables.
Table B-9 Hydraulic parameter for reactor vessel cooling shroud
RELAP # Type Node Actual Length
Flow Area Volume Hydraulic Diameter
Wall Roughness
Lower Elevation
Upper Elevation
[m] [m2] [m3] [m] [m] [m] [m]
160 TMDPVOL 1 10 10 100
1.9630 1.9630
166 Pipe
1 0.08200 0.24934 0.02181 0.07678 3.20E-06 1.8810 1.9630
2 0.14732 0.62281 0.09175 0.21280 3.20E-06 1.7337 1.8810
3 0.12890 0.45945 0.05922 0.13910 3.20E-06 1.6048 1.7337
4 0.59386 0.12212 0.07253 0.04911 3.20E-06 1.0109 1.6048
5 0.55370 0.05683 0.03139 0.02750 3.20E-06 0.4572 1.0109
6 0.07669
0.04507
0.00346
0.02462
3.20E-06
-0.4572 0.4572
7 0.03805 0.00171 3.20E-06
… … … …
26 0.03805 0.00171 3.20E-06
27 0.07669 0.00346 3.20E-06
28 0.44380 0.07924 0.03538 0.03606 3.20E-06 -0.9010 -0.4572
29 1.17392 0.78245 0.91853 0.23357 3.20E-06 -2.0749 -0.9010
30 0.36368 1.35860 0.49410 0.35412 3.20E-06 -2.4386 -2.0749
31 0.19335 1.02351 0.19790 0.27038 3.20E-06 -2.6320 -2.4386
170 TMDPVOL 1 10 10 100
-2.6320 -2.6320
Table B-10 RELAP5 junction table summary
RELAP5 #
Type Junction
# From Type To Type
Hydraulic Diameter
Area Abrupt
Area Change
Forward K
Reverse K
[m] [m2] [-] [-]
161 TMDPJUN 1 160 Outflow 166 Inflow 0.03533
169 SNGLJUN 1 166 Outflow 170 Inflow 0.0194 0 No 0.5 0.5

ANL/GTRI/TM-14/10 C-1
C Power Specifications for 1963 Tests Table C-1 Power specifications for Test A/400/1 [12]
Test A/400/1 Remainder of High Heat Flux High heat flux Average Fuel Plugged Channel
Component Structure Beryllium Fuel Plate 4 Plate 5 Plate 6 Beryllium Structure Beryllium Fuel Structure Beryllium
RELAP5 Volume Connections (left/Right) Sym-360 360-16 360-360 360-365 365-366 366-367 367-16 Sym-56 56-16 Sym-56 Sym-76 76-16
Heat Structure 301 368 360 364 365 366 367 501 560 561 702 760
RELAP5 Table 705 725 708 760 600 700 720 735 730 710 755 750
Steady-State Power (W) 4264.5 18078.8 1866105.6 11879.6 14343.3 17610.6 516.5 31752.6 189586.2 21045440.0 391409.7 409011.8
Normalized power
distribution as a function of axial
segment (left column is the
structures segment
number, 1 is the top, 20 is the bottom)
1 0.0068063 0.0062588 0.0054521 0.0044702 0.0042589 0.0050231 0.0062588 0.0070036 0.0067830 0.0060070 0.0142095 0.0156923
2 0.0093297 0.0089889 0.0072555 0.0070645 0.0064468 0.0064546 0.0089889 0.0098625 0.0096655 0.0080931 0.0142095 0.0156923
3 0.0126375 0.0120626 0.0098383 0.0092783 0.0088697 0.0088093 0.0120626 0.0131660 0.0129006 0.0109221 0.0142095 0.0156923
4 0.0164858 0.0157260 0.0131472 0.0125177 0.0118903 0.0117059 0.0157260 0.0171255 0.0167742 0.0143990 0.0142095 0.0156923
5 0.0212244 0.0205104 0.0173040 0.0164349 0.0157413 0.0152868 0.0205104 0.0218653 0.0215198 0.0186400 0.0301483 0.0363310
6 0.0270225 0.0262310 0.0224764 0.0219305 0.0208287 0.0202402 0.0262310 0.0277344 0.0272405 0.0239416 0.0301483 0.0363310
7 0.0343312 0.0334502 0.0293879 0.0282447 0.0274374 0.0265461 0.0334502 0.0349419 0.0343896 0.0307050 0.0301483 0.0363310
8 0.0436892 0.0427672 0.0393217 0.0385477 0.0375703 0.0374804 0.0427672 0.0437916 0.0433314 0.0400827 0.0301483 0.0363310
9 0.0543809 0.0541796 0.0527719 0.0525824 0.0526340 0.0532843 0.0541796 0.0539505 0.0538418 0.0524261 0.0675274 0.0654989
10 0.0648465 0.0651306 0.0655819 0.0653532 0.0657180 0.0660386 0.0651306 0.0638753 0.0640340 0.0643153 0.0675274 0.0654989
11 0.0733110 0.0740272 0.0758496 0.0751013 0.0751960 0.0758123 0.0740272 0.0721678 0.0725113 0.0737340 0.0675274 0.0654989
12 0.0799013 0.0805722 0.0830793 0.0820725 0.0826105 0.0829150 0.0805722 0.0784066 0.0788071 0.0806118 0.0675274 0.0654989
13 0.0836446 0.0840831 0.0869877 0.0870095 0.0873110 0.0866790 0.0840831 0.0822398 0.0826460 0.0847285 0.0791970 0.0765165
14 0.0841845 0.0851842 0.0877217 0.0885166 0.0889850 0.0886134 0.0851842 0.0835365 0.0838960 0.0860695 0.0791970 0.0765165
15 0.0824701 0.0835962 0.0861794 0.0866065 0.0872055 0.0871266 0.0835962 0.0821696 0.0825961 0.0847197 0.0791970 0.0765165
16 0.0781576 0.0792715 0.0813740 0.0817242 0.0827736 0.0824379 0.0792715 0.0782750 0.0786516 0.0806819 0.0791970 0.0765165
17 0.0717434 0.0722417 0.0740556 0.0742499 0.0754432 0.0754539 0.0722417 0.0719648 0.0723676 0.0741531 0.0589178 0.0559613
18 0.0627850 0.0632294 0.0646432 0.0651055 0.0657679 0.0656812 0.0632294 0.0635645 0.0638696 0.0652627 0.0589178 0.0559613
19 0.0525594 0.0526552 0.0541532 0.0548820 0.0551890 0.0556804 0.0526552 0.0534160 0.0534914 0.0549959 0.0589178 0.0559613
20 0.0404892 0.0398342 0.0434194 0.0483078 0.0481228 0.0487309 0.0398342 0.0409428 0.0406828 0.0455107 0.0589178 0.0559613
Relative Power as a Function of
Time (left column is time
in seconds following an
accident initiated at 0 s)
0 1 1 1 1 1 1 1 1 1 1 1 1
7.5 1 1 1 1 1 1 1 1 1 1 1 1
7.51 0.3988 0.2524 0.0461 0.0466 0.0465 0.0465 0.2524 0.3342 0.2574 0.0478 0.241 0.2628
8.5 0.3938 0.2492 0.0412 0.0417 0.0416 0.0416 0.2492 0.33 0.2542 0.0429 0.238 0.2595
12.5 0.3794 0.2401 0.0342 0.0347 0.0346 0.0346 0.2401 0.318 0.2449 0.0358 0.2296 0.2503
17.5 0.3684 0.2331 0.0303 0.0307 0.0306 0.0307 0.2331 0.3087 0.2378 0.0318 0.2229 0.2431
22.5 0.3605 0.2282 0.0278 0.0282 0.0281 0.0282 0.2282 0.3021 0.2327 0.0293 0.2184 0.2381
27.5 0.3545 0.2243 0.026 0.0264 0.0263 0.0263 0.2243 0.2971 0.2288 0.0274 0.2147 0.2341
32.5 0.3495 0.2212 0.0245 0.025 0.0249 0.0249 0.2212 0.2929 0.2256 0.026 0.2117 0.2308
37.5 0.345 0.2183 0.0234 0.0238 0.0237 0.0238 0.2183 0.2891 0.2227 0.0248 0.209 0.2279
42.5 0.341 0.2158 0.0224 0.0228 0.0228 0.0228 0.2158 0.2858 0.2201 0.0238 0.2067 0.2253
47.5 0.3373 0.2135 0.0216 0.022 0.0219 0.0219 0.2135 0.2827 0.2177 0.023 0.2045 0.2229
52.5 0.334 0.2113 0.0209 0.0213 0.0212 0.0212 0.2113 0.2799 0.2156 0.0222 0.2025 0.2208
57.5 0.3309 0.2094 0.0202 0.0206 0.0205 0.0205 0.2094 0.2774 0.2136 0.0216 0.2007 0.2188
60.5 0.3309 0.2094 0.0202 0.0206 0.0205 0.0205 0.2094 0.2774 0.2136 0.0216 0.2007 0.2188
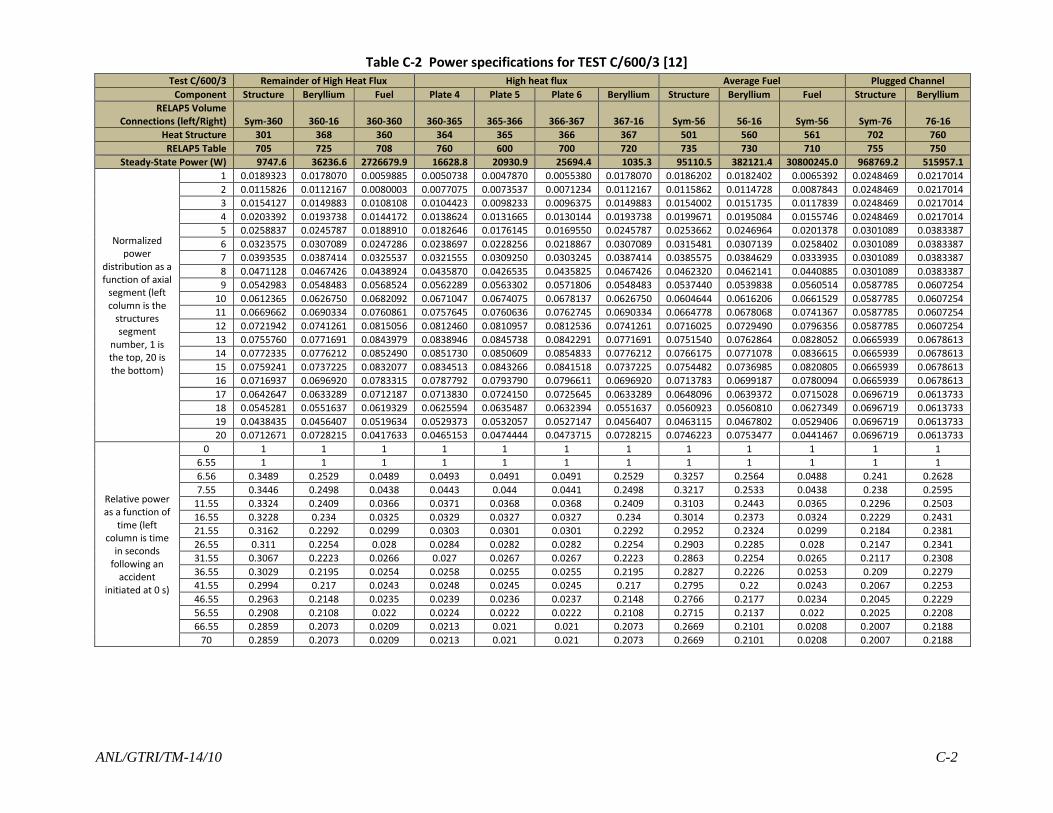
ANL/GTRI/TM-14/10 C-2
Table C-2 Power specifications for TEST C/600/3 [12] Test C/600/3 Remainder of High Heat Flux High heat flux Average Fuel Plugged Channel
Component Structure Beryllium Fuel Plate 4 Plate 5 Plate 6 Beryllium Structure Beryllium Fuel Structure Beryllium
RELAP5 Volume Connections (left/Right) Sym-360 360-16 360-360 360-365 365-366 366-367 367-16 Sym-56 56-16 Sym-56 Sym-76 76-16
Heat Structure 301 368 360 364 365 366 367 501 560 561 702 760
RELAP5 Table 705 725 708 760 600 700 720 735 730 710 755 750
Steady-State Power (W) 9747.6 36236.6 2726679.9 16628.8 20930.9 25694.4 1035.3 95110.5 382121.4 30800245.0 968769.2 515957.1
Normalized power
distribution as a function of axial
segment (left column is the
structures segment
number, 1 is the top, 20 is the bottom)
1 0.0189323 0.0178070 0.0059885 0.0050738 0.0047870 0.0055380 0.0178070 0.0186202 0.0182402 0.0065392 0.0248469 0.0217014
2 0.0115826 0.0112167 0.0080003 0.0077075 0.0073537 0.0071234 0.0112167 0.0115862 0.0114728 0.0087843 0.0248469 0.0217014
3 0.0154127 0.0149883 0.0108108 0.0104423 0.0098233 0.0096375 0.0149883 0.0154002 0.0151735 0.0117839 0.0248469 0.0217014
4 0.0203392 0.0193738 0.0144172 0.0138624 0.0131665 0.0130144 0.0193738 0.0199671 0.0195084 0.0155746 0.0248469 0.0217014
5 0.0258837 0.0245787 0.0188910 0.0182646 0.0176145 0.0169550 0.0245787 0.0253662 0.0246964 0.0201378 0.0301089 0.0383387
6 0.0323575 0.0307089 0.0247286 0.0238697 0.0228256 0.0218867 0.0307089 0.0315481 0.0307139 0.0258402 0.0301089 0.0383387
7 0.0393535 0.0387414 0.0325537 0.0321555 0.0309250 0.0303245 0.0387414 0.0385575 0.0384629 0.0333935 0.0301089 0.0383387
8 0.0471128 0.0467426 0.0438924 0.0435870 0.0426535 0.0435825 0.0467426 0.0462320 0.0462141 0.0440885 0.0301089 0.0383387
9 0.0542983 0.0548483 0.0568524 0.0562289 0.0563302 0.0571806 0.0548483 0.0537440 0.0539838 0.0560514 0.0587785 0.0607254
10 0.0612365 0.0626750 0.0682092 0.0671047 0.0674075 0.0678137 0.0626750 0.0604644 0.0616206 0.0661529 0.0587785 0.0607254
11 0.0669662 0.0690334 0.0760861 0.0757645 0.0760636 0.0762745 0.0690334 0.0664778 0.0678068 0.0741367 0.0587785 0.0607254
12 0.0721942 0.0741261 0.0815056 0.0812460 0.0810957 0.0812536 0.0741261 0.0716025 0.0729490 0.0796356 0.0587785 0.0607254
13 0.0755760 0.0771691 0.0843979 0.0838946 0.0845738 0.0842291 0.0771691 0.0751540 0.0762864 0.0828052 0.0665939 0.0678613
14 0.0772335 0.0776212 0.0852490 0.0851730 0.0850609 0.0854833 0.0776212 0.0766175 0.0771078 0.0836615 0.0665939 0.0678613
15 0.0759241 0.0737225 0.0832077 0.0834513 0.0843266 0.0841518 0.0737225 0.0754482 0.0736985 0.0820805 0.0665939 0.0678613
16 0.0716937 0.0696920 0.0783315 0.0787792 0.0793790 0.0796611 0.0696920 0.0713783 0.0699187 0.0780094 0.0665939 0.0678613
17 0.0642647 0.0633289 0.0712187 0.0713830 0.0724150 0.0725645 0.0633289 0.0648096 0.0639372 0.0715028 0.0696719 0.0613733
18 0.0545281 0.0551637 0.0619329 0.0625594 0.0635487 0.0632394 0.0551637 0.0560923 0.0560810 0.0627349 0.0696719 0.0613733
19 0.0438435 0.0456407 0.0519634 0.0529373 0.0532057 0.0527147 0.0456407 0.0463115 0.0467802 0.0529406 0.0696719 0.0613733
20 0.0712671 0.0728215 0.0417633 0.0465153 0.0474444 0.0473715 0.0728215 0.0746223 0.0753477 0.0441467 0.0696719 0.0613733
Relative power as a function of
time (left column is time
in seconds following an
accident initiated at 0 s)
0 1 1 1 1 1 1 1 1 1 1 1 1
6.55 1 1 1 1 1 1 1 1 1 1 1 1
6.56 0.3489 0.2529 0.0489 0.0493 0.0491 0.0491 0.2529 0.3257 0.2564 0.0488 0.241 0.2628
7.55 0.3446 0.2498 0.0438 0.0443 0.044 0.0441 0.2498 0.3217 0.2533 0.0438 0.238 0.2595
11.55 0.3324 0.2409 0.0366 0.0371 0.0368 0.0368 0.2409 0.3103 0.2443 0.0365 0.2296 0.2503
16.55 0.3228 0.234 0.0325 0.0329 0.0327 0.0327 0.234 0.3014 0.2373 0.0324 0.2229 0.2431
21.55 0.3162 0.2292 0.0299 0.0303 0.0301 0.0301 0.2292 0.2952 0.2324 0.0299 0.2184 0.2381
26.55 0.311 0.2254 0.028 0.0284 0.0282 0.0282 0.2254 0.2903 0.2285 0.028 0.2147 0.2341
31.55 0.3067 0.2223 0.0266 0.027 0.0267 0.0267 0.2223 0.2863 0.2254 0.0265 0.2117 0.2308
36.55 0.3029 0.2195 0.0254 0.0258 0.0255 0.0255 0.2195 0.2827 0.2226 0.0253 0.209 0.2279
41.55 0.2994 0.217 0.0243 0.0248 0.0245 0.0245 0.217 0.2795 0.22 0.0243 0.2067 0.2253
46.55 0.2963 0.2148 0.0235 0.0239 0.0236 0.0237 0.2148 0.2766 0.2177 0.0234 0.2045 0.2229
56.55 0.2908 0.2108 0.022 0.0224 0.0222 0.0222 0.2108 0.2715 0.2137 0.022 0.2025 0.2208
66.55 0.2859 0.2073 0.0209 0.0213 0.021 0.021 0.2073 0.2669 0.2101 0.0208 0.2007 0.2188
70 0.2859 0.2073 0.0209 0.0213 0.021 0.021 0.2073 0.2669 0.2101 0.0208 0.2007 0.2188
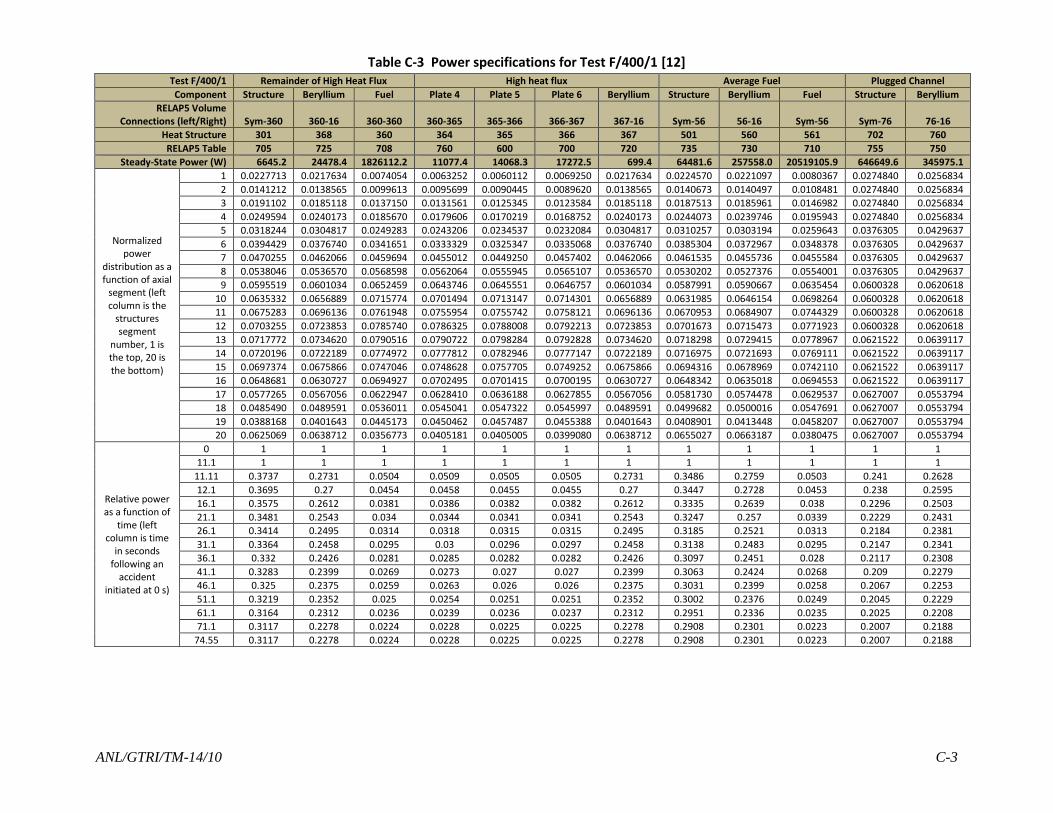
ANL/GTRI/TM-14/10 C-3
Table C-3 Power specifications for Test F/400/1 [12] Test F/400/1 Remainder of High Heat Flux High heat flux Average Fuel Plugged Channel
Component Structure Beryllium Fuel Plate 4 Plate 5 Plate 6 Beryllium Structure Beryllium Fuel Structure Beryllium
RELAP5 Volume Connections (left/Right) Sym-360 360-16 360-360 360-365 365-366 366-367 367-16 Sym-56 56-16 Sym-56 Sym-76 76-16
Heat Structure 301 368 360 364 365 366 367 501 560 561 702 760
RELAP5 Table 705 725 708 760 600 700 720 735 730 710 755 750
Steady-State Power (W) 6645.2 24478.4 1826112.2 11077.4 14068.3 17272.5 699.4 64481.6 257558.0 20519105.9 646649.6 345975.1
Normalized power
distribution as a function of axial
segment (left column is the
structures segment
number, 1 is the top, 20 is the bottom)
1 0.0227713 0.0217634 0.0074054 0.0063252 0.0060112 0.0069250 0.0217634 0.0224570 0.0221097 0.0080367 0.0274840 0.0256834
2 0.0141212 0.0138565 0.0099613 0.0095699 0.0090445 0.0089620 0.0138565 0.0140673 0.0140497 0.0108481 0.0274840 0.0256834
3 0.0191102 0.0185118 0.0137150 0.0131561 0.0125345 0.0123584 0.0185118 0.0187513 0.0185961 0.0146982 0.0274840 0.0256834
4 0.0249594 0.0240173 0.0185670 0.0179606 0.0170219 0.0168752 0.0240173 0.0244073 0.0239746 0.0195943 0.0274840 0.0256834
5 0.0318244 0.0304817 0.0249283 0.0243206 0.0234537 0.0232084 0.0304817 0.0310257 0.0303194 0.0259643 0.0376305 0.0429637
6 0.0394429 0.0376740 0.0341651 0.0333329 0.0325347 0.0335068 0.0376740 0.0385304 0.0372967 0.0348378 0.0376305 0.0429637
7 0.0470255 0.0462066 0.0459694 0.0455012 0.0449250 0.0457402 0.0462066 0.0461535 0.0455736 0.0455584 0.0376305 0.0429637
8 0.0538046 0.0536570 0.0568598 0.0562064 0.0555945 0.0565107 0.0536570 0.0530202 0.0527376 0.0554001 0.0376305 0.0429637
9 0.0595519 0.0601034 0.0652459 0.0643746 0.0645551 0.0646757 0.0601034 0.0587991 0.0590667 0.0635454 0.0600328 0.0620618
10 0.0635332 0.0656889 0.0715774 0.0701494 0.0713147 0.0714301 0.0656889 0.0631985 0.0646154 0.0698264 0.0600328 0.0620618
11 0.0675283 0.0696136 0.0761948 0.0755954 0.0755742 0.0758121 0.0696136 0.0670953 0.0684907 0.0744329 0.0600328 0.0620618
12 0.0703255 0.0723853 0.0785740 0.0786325 0.0788008 0.0792213 0.0723853 0.0701673 0.0715473 0.0771923 0.0600328 0.0620618
13 0.0717772 0.0734620 0.0790516 0.0790722 0.0798284 0.0792828 0.0734620 0.0718298 0.0729415 0.0778967 0.0621522 0.0639117
14 0.0720196 0.0722189 0.0774972 0.0777812 0.0782946 0.0777147 0.0722189 0.0716975 0.0721693 0.0769111 0.0621522 0.0639117
15 0.0697374 0.0675866 0.0747046 0.0748628 0.0757705 0.0749252 0.0675866 0.0694316 0.0678969 0.0742110 0.0621522 0.0639117
16 0.0648681 0.0630727 0.0694927 0.0702495 0.0701415 0.0700195 0.0630727 0.0648342 0.0635018 0.0694553 0.0621522 0.0639117
17 0.0577265 0.0567056 0.0622947 0.0628410 0.0636188 0.0627855 0.0567056 0.0581730 0.0574478 0.0629537 0.0627007 0.0553794
18 0.0485490 0.0489591 0.0536011 0.0545041 0.0547322 0.0545997 0.0489591 0.0499682 0.0500016 0.0547691 0.0627007 0.0553794
19 0.0388168 0.0401643 0.0445173 0.0450462 0.0457487 0.0455388 0.0401643 0.0408901 0.0413448 0.0458207 0.0627007 0.0553794
20 0.0625069 0.0638712 0.0356773 0.0405181 0.0405005 0.0399080 0.0638712 0.0655027 0.0663187 0.0380475 0.0627007 0.0553794
Relative power as a function of
time (left column is time
in seconds following an
accident initiated at 0 s)
0 1 1 1 1 1 1 1 1 1 1 1 1
11.1 1 1 1 1 1 1 1 1 1 1 1 1
11.11 0.3737 0.2731 0.0504 0.0509 0.0505 0.0505 0.2731 0.3486 0.2759 0.0503 0.241 0.2628
12.1 0.3695 0.27 0.0454 0.0458 0.0455 0.0455 0.27 0.3447 0.2728 0.0453 0.238 0.2595
16.1 0.3575 0.2612 0.0381 0.0386 0.0382 0.0382 0.2612 0.3335 0.2639 0.038 0.2296 0.2503
21.1 0.3481 0.2543 0.034 0.0344 0.0341 0.0341 0.2543 0.3247 0.257 0.0339 0.2229 0.2431
26.1 0.3414 0.2495 0.0314 0.0318 0.0315 0.0315 0.2495 0.3185 0.2521 0.0313 0.2184 0.2381
31.1 0.3364 0.2458 0.0295 0.03 0.0296 0.0297 0.2458 0.3138 0.2483 0.0295 0.2147 0.2341
36.1 0.332 0.2426 0.0281 0.0285 0.0282 0.0282 0.2426 0.3097 0.2451 0.028 0.2117 0.2308
41.1 0.3283 0.2399 0.0269 0.0273 0.027 0.027 0.2399 0.3063 0.2424 0.0268 0.209 0.2279
46.1 0.325 0.2375 0.0259 0.0263 0.026 0.026 0.2375 0.3031 0.2399 0.0258 0.2067 0.2253
51.1 0.3219 0.2352 0.025 0.0254 0.0251 0.0251 0.2352 0.3002 0.2376 0.0249 0.2045 0.2229
61.1 0.3164 0.2312 0.0236 0.0239 0.0236 0.0237 0.2312 0.2951 0.2336 0.0235 0.2025 0.2208
71.1 0.3117 0.2278 0.0224 0.0228 0.0225 0.0225 0.2278 0.2908 0.2301 0.0223 0.2007 0.2188
74.55 0.3117 0.2278 0.0224 0.0228 0.0225 0.0225 0.2278 0.2908 0.2301 0.0223 0.2007 0.2188
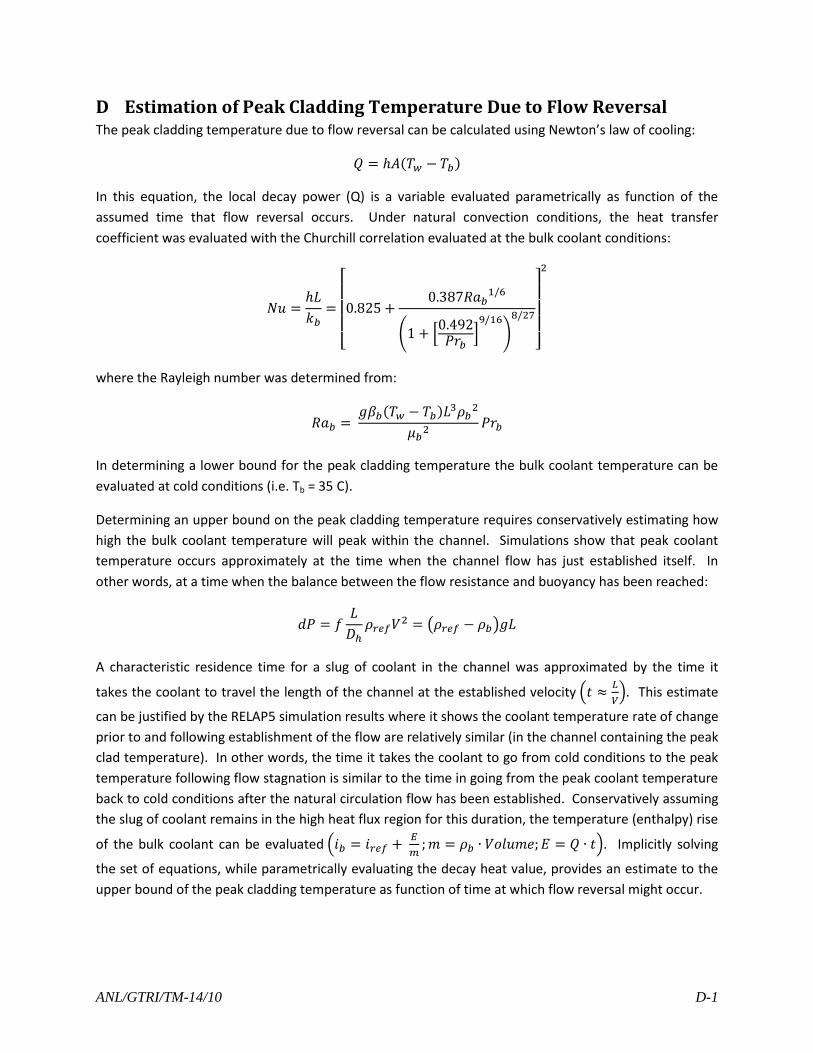
ANL/GTRI/TM-14/10 D-1
D Estimation of Peak Cladding Temperature Due to Flow Reversal The peak cladding temperature due to flow reversal can be calculated using Newton’s law of cooling:
𝑄 = ℎ𝐴(𝑇𝑤 − 𝑇𝑏)
In this equation, the local decay power (Q) is a variable evaluated parametrically as function of the
assumed time that flow reversal occurs. Under natural convection conditions, the heat transfer
coefficient was evaluated with the Churchill correlation evaluated at the bulk coolant conditions:
𝑁𝑢 =ℎ𝐿
𝑘𝑏=
[
0.825 +0.387𝑅𝑎𝑏
1/6
(1 + [0.492𝑃𝑟𝑏
]9/16
)
8/27
] 2
where the Rayleigh number was determined from:
𝑅𝑎𝑏 = 𝑔𝛽𝑏(𝑇𝑤 − 𝑇𝑏)𝐿
3𝜌𝑏2
𝜇𝑏2
𝑃𝑟𝑏
In determining a lower bound for the peak cladding temperature the bulk coolant temperature can be
evaluated at cold conditions (i.e. Tb = 35 C).
Determining an upper bound on the peak cladding temperature requires conservatively estimating how
high the bulk coolant temperature will peak within the channel. Simulations show that peak coolant
temperature occurs approximately at the time when the channel flow has just established itself. In
other words, at a time when the balance between the flow resistance and buoyancy has been reached:
𝑑𝑃 = 𝑓𝐿
𝐷ℎ𝜌𝑟𝑒𝑓𝑉
2 = (𝜌𝑟𝑒𝑓 − 𝜌𝑏)𝑔𝐿
A characteristic residence time for a slug of coolant in the channel was approximated by the time it
takes the coolant to travel the length of the channel at the established velocity (𝑡 ≈𝐿
𝑉). This estimate
can be justified by the RELAP5 simulation results where it shows the coolant temperature rate of change
prior to and following establishment of the flow are relatively similar (in the channel containing the peak
clad temperature). In other words, the time it takes the coolant to go from cold conditions to the peak
temperature following flow stagnation is similar to the time in going from the peak coolant temperature
back to cold conditions after the natural circulation flow has been established. Conservatively assuming
the slug of coolant remains in the high heat flux region for this duration, the temperature (enthalpy) rise
of the bulk coolant can be evaluated (𝑖𝑏 = 𝑖𝑟𝑒𝑓 + 𝐸
𝑚;𝑚 = 𝜌𝑏 ∙ 𝑉𝑜𝑙𝑢𝑚𝑒; 𝐸 = 𝑄 ∙ 𝑡). Implicitly solving
the set of equations, while parametrically evaluating the decay heat value, provides an estimate to the
upper bound of the peak cladding temperature as function of time at which flow reversal might occur.

(This page intentionally left blank)
Argonne National Laboratory is a U.S. Department of Energy
laboratory managed by UChicago Argonne, LLC
Nuclear Engineering Division
Argonne National Laboratory
9700 South Cass Avenue, Bldg. 208
Argonne, IL 60439-4842
www.anl.gov