relationship between agriculture and global population€¦ · world population has risen over 80%...
TRANSCRIPT

Relationship Between Agriculture and Global
Population

Bob Haggerty
Director Int’l Programs UI College of Agricultural &
Life Sciences

“First” World ◦Developed Nations
“Second” World ◦ Former Communist/Command Economies
“Third” World ◦ Less/Least Developed Countries; Developing
Poverty vs. Prosperity Food Production vs. Population Growth
Remove unwanted plants and animals from a farm area. • Plants and animals evolved into a
symbiotic relationship. Social organization.
• Structure. • Affluence. Population growth.
• More children means more workers and care of elderly.

1804
1922
1959
1974
1987
1999
2013
2028
118 years
37 years 15
year
13 year
12 year
14 year
15 year
World Population Increase Population in billions
1922 1959 1978 1987 1999 2013 2028
8 7
6
5 4
3 2
1

• Studied human population growth.
• Was a major influence on others, including Darwin.
• Prophesized that population would out grow food production.

Food production - arithmetic
Population - geometric
Malthus Pessimism

War. • Kills people, directly and indirectly (i.e.
hunger). • Armies spread disease. • Winners can thrive and prosper. Famine.
• Localized. • Farmers historically are malnourished group. Pestilence.
• 13th Century plague killed 50% of Europeans. • Trade and traders (sailors) spread disease. • HIV.

Napoleon Bonaparte (1769 – 1821)
Never interrupt your enemy when he is making a mistake.
Impossible is a word found only in the dictionary of fools.
A picture tells a thousand words.
An army marches on its stomach.

0
2
4
6
8
10
12
1950 1975 2000 2005 2075 2100 2125 2150
World Population
Year
Food production has become more dependable.
Improved transportation of food. Raising family incomes to purchase food. Improved housing and public hygiene
and reduced infectious diseases. Medical advances. Human Migration
Secondary school enrollment increases. More women are using contraception. Greater job availability due to better
economic systems and increased world trade. Infant mortality had declined significantly.
Food production has become more dependable. New lands under cultivation – Irrigation Systems Improved genetics, production practices, yields Improved preservation of food. Improved transportation of food and expanded
global market trade channels for food


0
50,000
100,000
150,000
200,000
250,000
300,000 Net Migration M
exic
o
Chi
na
Tanz
ania
Con
go
Phili
ppin
es
Paki
stan
Kaz
akhs
tan
Ban
glad
esh
Indi
a
Bur
ma
Top 10 Sending Countries
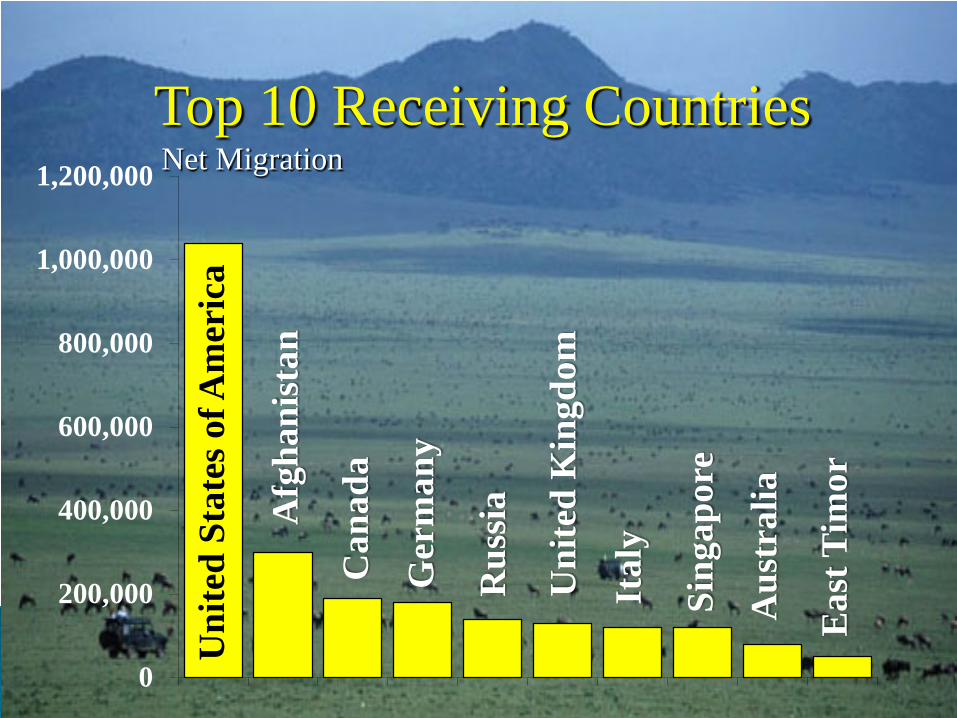
0
200,000
400,000
600,000
800,000
1,000,000
1,200,000 Net Migration
Uni
ted
Stat
es o
f Am
eric
a
Afg
hani
stan
Can
ada
Ger
man
y
Rus
sia
Uni
ted
Kin
gdom
Ital
y
Sing
apor
e
Aus
tral
ia
Eas
t Tim
or
Top 10 Receiving Countries

Country to Country. • To USA from Europe. • To USA from South America and Asia. • To Europe from North Africa and Asia. • From Soviet Union. Within countries.
• Rural to Urban. • Religion & Politics.

0
25
50
75
100
South Asia
Saharan Africa
East Asia
Western Asia
Latin Am.
North Am.
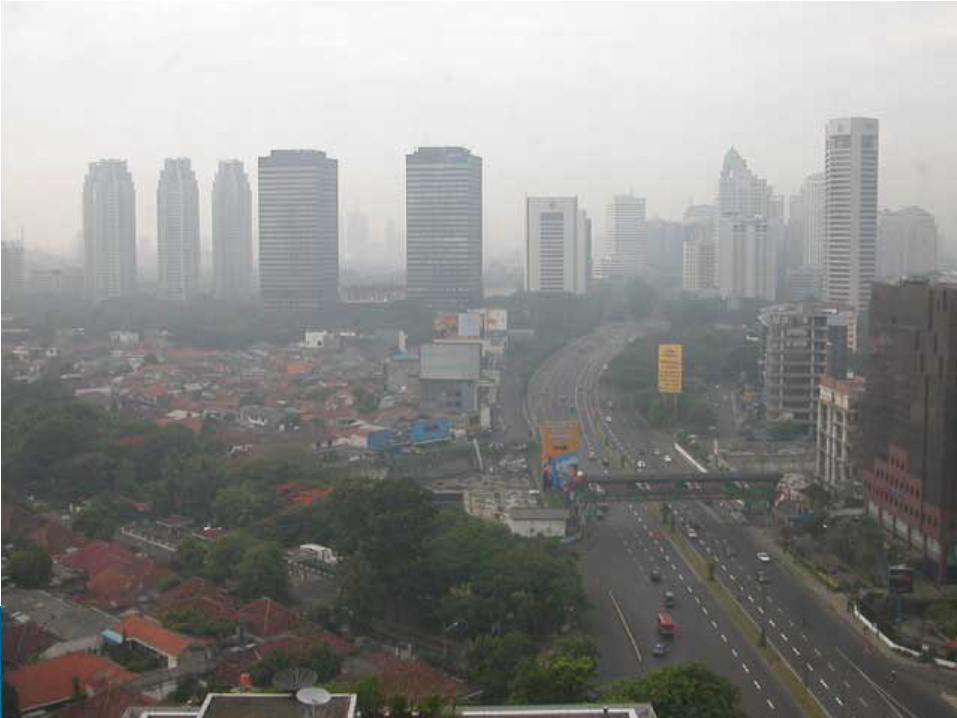
Urbanization U
rban
R
ural

0
100
200
300
400
500
600
700
800
Cereals Roots Pulses Oil Crops Vegatables Fruit
1955
20
05
1955 = 1161.3 Ha
2005 = 1378.5 Ha

0
2
4
6
8
10
12
14
Cereals Roots Pulses Oil Crops Vegatables Fruit
1955
20
05 +
42%
+80
%
+13
0%
+40
%
+36
% +12
3%

0
50
100
150
200
250
300
350
Cereals Roots Pulses Oil Crops Vegatables Fruit
1955
20
05 +
17%
+62
%
+16
%
-18%
-30%
+28
%

People fed by a single farmer

World population has risen over 80% since 1960. In 1961 1.5 m ha of crop land and in 1998
only 0.1 m ha more. Yet farmers are now feeding twice as many
people. And! People are eating more calories than
before – at least 3,000 kcal available but not accessible – maldistribution of resources.

“when all people at all times have access to sufficient, safe, nutritious food to maintain a healthy and active life” A household's physical and economic
access to sufficient, safe, and nutritious food that fulfills the dietary needs and food preferences of that household for living an active and healthy life.
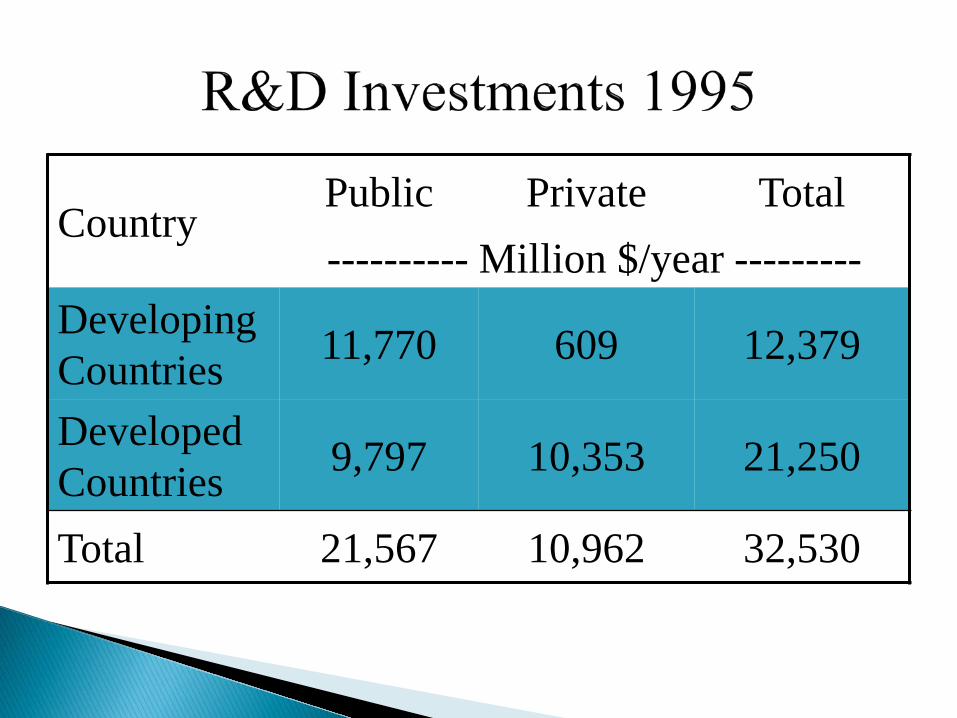
Country Public Private Total ---------- Million $/year ---------
Developing Countries 11,770 609 12,379
Developed Countries 9,797 10,353 21,250
Total 21,567 10,962 32,530
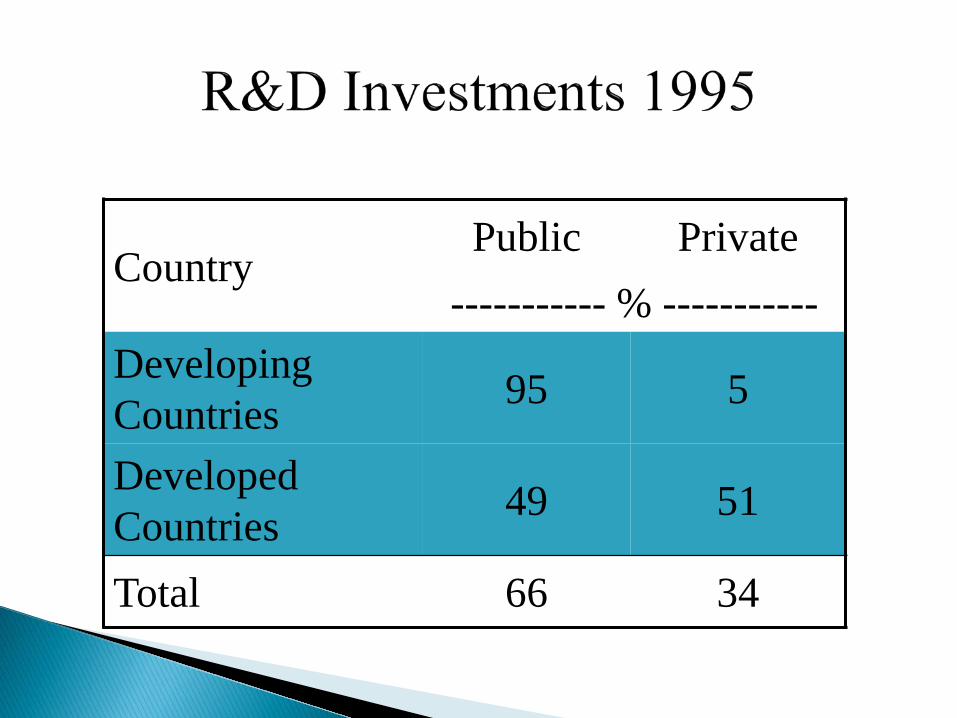
Country Public Private
----------- % ----------- Developing Countries 95 5
Developed Countries 49 51
Total 66 34

Plant Variety Protection – PVP Plant Patent – PP Whole plants. DNA sequences.
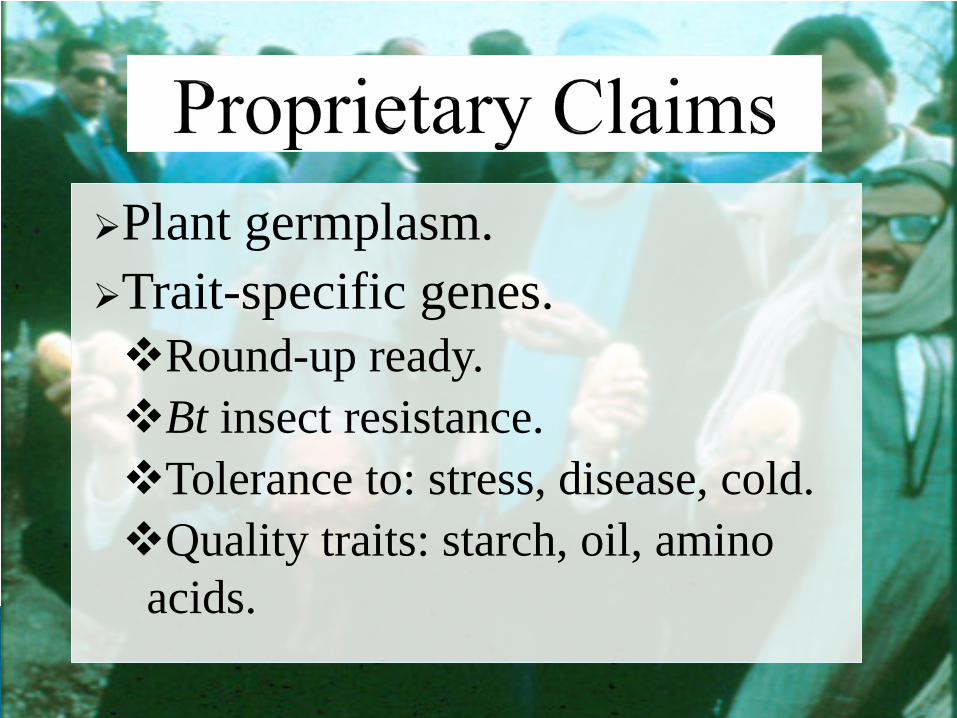
Plant germplasm. Trait-specific genes. Round-up ready. Bt insect resistance. Tolerance to: stress, disease, cold. Quality traits: starch, oil, amino acids.

Transformation technologies. Promoters to control genes. Markers to identify the presence
of a desirable trait. Gene silencing or regulating
technologies. Genomics.

Monsanto (US)
Dupont (US)
Syngenta (Swiss)
Group1 Limagrain France)
Land O'Lakes (US)
KWS Ag (Germany)
Bayer Crop Sci (Germany)
Takii (Japan)
Sakata (Japan)
DLF-Trifolium (Denmark)
$4,476,000,000
$425,000,000
$352,000,000
$401,000,000
$,430,000,000
$430,000,000
$615,000,000
$756,000,000
$1,743,000,000
$2,781,000,000
Top 10 = 57%, Top 3 = 44%. Top 3 = 39%, Monsanto = 10% world seed)

Sustained low food prices builds complacency. Concerns that increased food will
lead to population explosion. Private investment in biotechnology
will take care of future needs. Distrust in agricultural research (i.e.
mad cow disease, GMO scares, etc.)

What, Where and How

0
500
1000
1500
2000
2500
3000
3500
Arable Permanent Pasture
1,398
3,442
136

0
200
400
600M
aize
– 5
96 m
Mt
Ric
e –
593
mM
t
Whe
at –
582
mM
t
Bar
ley
– 13
6 m
Mt
Sorg
hum
– 6
0 m
Mt
Mill
et –
27
mM
t
Soyb
ean
– 16
2 m
Mt
Oil
palm
– 9
8 m
Mt
Coc
onut
– 4
0 m
Mt
Can
ola
– 40
mM
t
Dry
bea
n –
20 m
Mt
Oth
ers –
20
mM
t
Cereals Oilseeds Pulses

0
50
100
150
200
250
300
350
Roots Vegetable Fruits
Pota
to –
302
mM
t
Cas
sava
– 1
70 m
Mt
Swee
t pot
ato
- 138
mM
t
Gra
pes –
60
mM
t
Ban
ana
– 58
mM
t
Tom
ato
- 100
mM
t
Cab
bage
- 50
mM
t
Oni
on -
50 m
Mt
Ora
nges
- 66
mM
t
App
le -
60 m
Mt
0
20
40
60
80
100
120
140
160
180
200
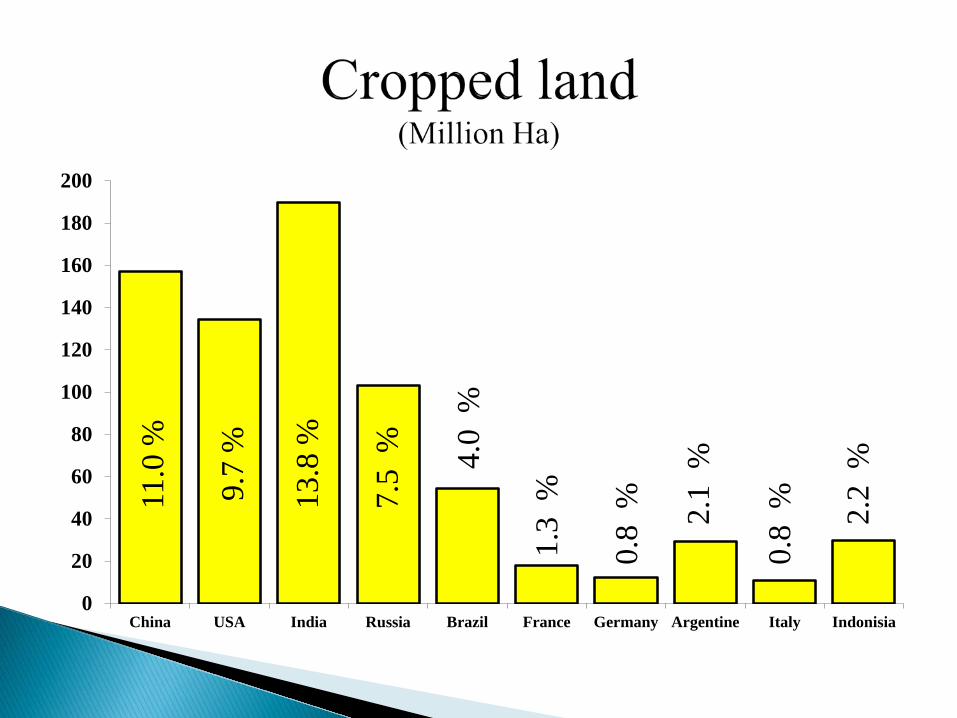
China USA India Russia Brazil France Germany Argentine Italy Indonisia
11.0
%
9.7
%
13.8
%
7.5
%
4.0
%
1.3
%
0.8
%
2.1
%
0.8
%
2.2
%

0
20
40
60
80
100
120
140
160
180
China USA India Russia Brazil France Germany Argentine Italy Indonisia
20.4
%
12.4
%
10.9
%
3.0
%
4.0
%
2.5
%
1.5
%
2.0
%
1.9
%
2.5
%

0
5
10
15
20
25
China USA India Russia Brazil France Germany Argentine Italy Indonisia
Cro
p la
nd
Prod
uctio
n

0
200
400
600
800
1000
1200
1400
1600
China USA India Russia Brazil France Germany Argentine Italy Indonisia
1082
772
478
244
615
1168
1039
562
1456
698

Industrial
Shifting
Trad. Intensive
Nomad/herd
Relies on large heavy machinery and chemicals. Uses fossil fuels and converts them to
food and other crops. Although often considered to highly
sophisticated, many operations require large amounts of (low-paid) labor.

Produces the highest crops yields/area. Uses lots of hand labor. Cycles soil nutrients through livestock
manures and returning other organic matter to the soil. China has maintained good soil fertility
for 1000’s of years of farming.

Farmers ‘hack’ small plots of farmland from forests. Continue to farm that portion of land until
nutrients are depleted. Often utilizes inter cropping, legumes and
grains. Land is later re-fertilized by natural
process.
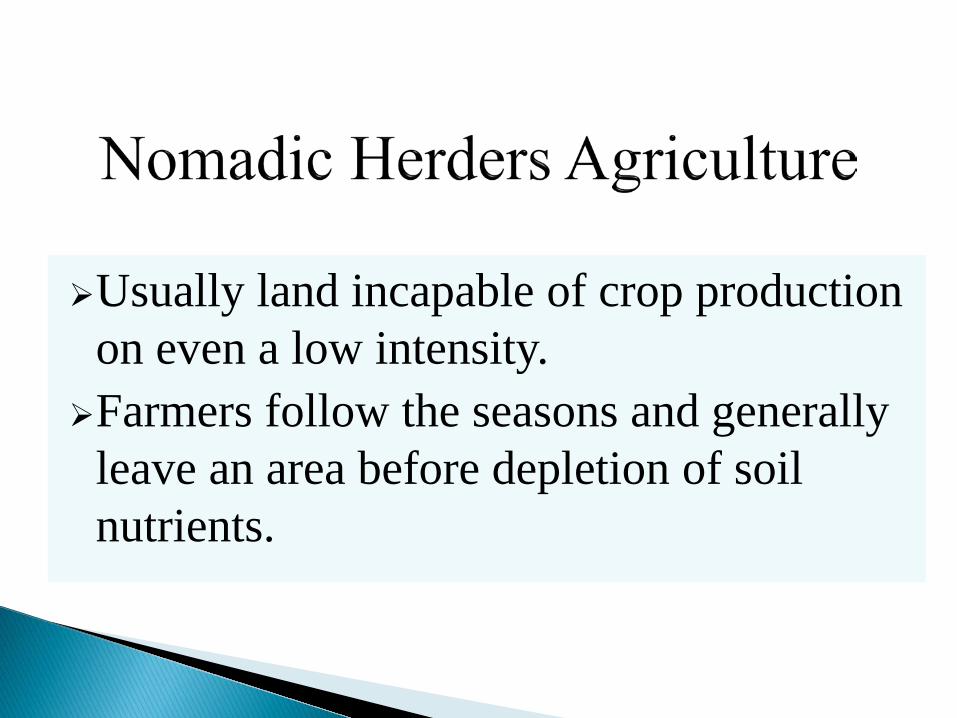
Usually land incapable of crop production on even a low intensity. Farmers follow the seasons and generally
leave an area before depletion of soil nutrients.

USA Agriculture

World Population in mid-2012 was Estimated to Be: ◦ 7.057 Billion (7 Billion reached!)
World Population in 2025 is Estimated to Become: ◦ 8.082 Billion ( < 2011’s prediction) ◦Africa could reach 1.446 Billion
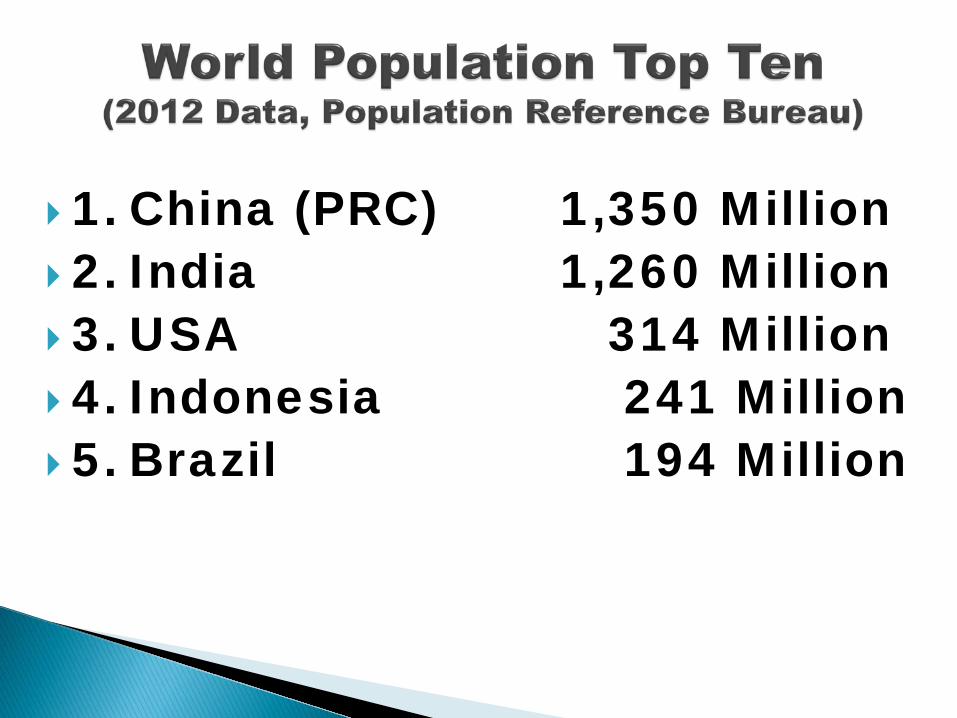
1. China (PRC) 1,350 Million 2. India 1,260 Million 3. USA 314 Million 4. Indonesia 241 Million 5. Brazil 194 Million

6. Pakistan 180 Million 7. Nigeria 170 Million 8. Bangladesh 153 Million 9. Russia 143 Million 10. Japan 128 Million