relationship between genetic anomalies of ... · relationship between genetic anomalies of...
TRANSCRIPT

Studies in Historical Anthropology, vol. 4:2004[2006], pp. 61–121
Relationship between genetic anomalies of different levels and deviations indermatoglyphic traitsDermatoglyphic sexual dimorphism in control healthy group of Israeli Jews
Eugene Kobyliansky, Michal Bejerano,Mariassa Bat-Miriam Katznelson, Ida Malkin
Research Unit – Human Population BiologyDepartment of Anatomy and Anthropology
The Lilian and Marcel Pollak Chairin Biological Anthropology
Sackler Faculty of MedicineTel Aviv University, Israel
Abstract: The present study was carried out in order to evaluate the effect of chromosomal andmonogenic or polygenic morbidity, as well as anomalies or conditions with still unknown genetic components, based on dermatoglyphic traits and indices of diversity and asymmetry. The main objectives of the present study is to find dermatoglyphic traits and ‚uctuating asymmetry indiceswhich could be “marker traits” to various diseases, and could indicate the degree of developmental instability, even if a phenotypic expression has not yet been found like in endometrial carcinoma or carcinoma of cervix, or parents with a high risk to transmit a disease to their children. The research stages have been as following: 1) To find dermatoglyphic characteristics of discrete andcontinuous traits and indices of ‚uctuating and directional asymmetry (FA & DA) and diversityin chromosomal syndromes (Down, Turner, Klinefelter), monogenic disease (Cystic Fibrosis), polygenic morbidity (Cleft Palate and Cleft Lip with or without Cleft Palate), and females suffer-ing from endometrial carcinoma or carcinoma of cervix (diseases of unclear origin, with the pos-sible presence of genetic factors), in comparison with control groups; 2) To find dermatoglyphiccharacteristics in parents with children with Down syndrome (DS), Cystic Fibrosis (C.F.), Cleft Palate and Cleft Lip with or without Cleft Palate (CP & CL[P]), compared with control group; 3) To check the assumption that in all studied diseases and chromosomal anomalies, a significantelevation exists in the level of dermatoglyphic ‚uctuating asymmetry, in patients as well as inparents; 4) To compare the dermatoglyphic levels of sexual dimorphism in all studied diseases and chromosomal anomalies, (in patients and parents), with control groups; 5) To use the dermato-glyphic data in order to identify an existing or potential aberration in females with high risk to endometrial carcinoma or carcinoma of cervix; 6) To analyze dermatoglyphic data from parents of children with DS, C.F. and CP & CL(P), in order to identify individuals with an increasing tendency to transmit such aberrations on to their descendants. Finger and palm prints of patients with syndromes diseases and of healthy (control) were collected on 2300 individuals. Classifica-

62 Eugene Kobyliansky et al.
tion and analysis of the dermatoglyphics were performed according to Cummins and Midlo (1943, 1961) and Penrose (1968), 79 dermatoglyphic variables for every patient: 28 continuous traits, 9 discrete traits, 11 indices of intraindividual diversity, 15 indices of directional asymmetry and 16 indices of ‚uctuating asymmetry. The problem of asymmetry, ‚uctuating and directional,and of intra-individual diversity of quantitative dermatoglyphic traits is here reviewed, as well as illustrated by data obtained on a sample of healthy control group of Jews from Israel. The two categories of variables, the quantitative traits and the indices of asymmetry and diversity, provided similar possibilities to discriminate between the sexes. The obtained data of sexual dimorphic dermatoglyphic traits will be used as a standard for comparison of individuals with genetic anomalies of different levels.
Introduction
Dermatoglyphics
“Dermatoglyphics” is a general name for the epidermal skin ridges and the pat-terns they form on the fingers, hands and feet. The study of dermatoglyphicshas many practical applications in the study of populations (Dankmeijer, 1938; Rife, 1953, 1954; Sachs and Bat-Miriam, 1957; Meier, 1980; Reed and Christian, 1979; Micle and Kobyliansky, 1987, 1988; Arrieta and Lostao, 1988) e.g. in ge-netic and medical research (Bat-Miriam, 1968; Shiono and Kadowaki, 1975; Schaumann and Alter, 1976; Dar et al., 1977; Jantz and Webb, 1980; Reed, 1981; Reed and Young, 1982; Vormittag et al., 1976, 1979, 1986; Markow and Wandler, 1986; Borger et al., 1986; Sanna et al., 1986; Luxenberg et al., 1988; Mukherje, 1990; Sorenson Jamison et al., 1990).
The development of dermatoglyphic patterns begins with the appearance of fetal pads in the sixth week of gestation and ends with the appearance of finished patterns on the surface of the skin in the 24th week of gestation (Mul-vihill and Smith, 1969; Babler, 1978, 1979, 1991). From this stage onwards, they are unaffected by the environment, and this explains their unique role, as anideal marker for individual identification and the study of populations, as wellas detection of defects due to intra-uterine irregularities in the early weeks of pregnancy (Cummins and Midlo, 1943, 1961; Achs et al., 1966; Penrose, 1968; Jones et al., 1973; Goodman et al., 1976; Reed et al., 1977; Meier, 1980; Galton, 1982; Livshits and Kobyliansky, 1991).
The methodology in the study of dermatoglyphics as a supplementary means of detecting clinical syndromes began in the 1930s and subsequently expanded concurrently with new developments of summarizing multi-variable data. The use of dendrograms (“grapefruit trees”) and the specification of “genetic dis-tances”, for example, made it possible to compare dermatoglyphic data with anthropometric and biochemical data (Mather, 1964; Holt, 1968; Roberts and Coope, 1975; Singh et al., 1977; Bonne-Tamir, 1980; Falconer, 1981; Kobyliansky and Livshits, 1983, 1986; Micle and Kobyliansky, 1985, 1986, 1991; Bat-Miriam Katznelson et al., 1987; Arrieta and Lostao, 1988; Sorenson Jamison et al., 1990, 1992; Bozicevic et al., 1991; Livshits and Kobyliansky, 1991; Plato et al., 1991). In 1937, two decades before Lejeune discovered the chromosomal abnormality of Down’s Syndrome, Cummins was able to correctly detect 90% of those afflicted
63Dermatoglyphic sexual dimorphism
with the syndrome by means of the dermatoglyphic abnormalities typical of the syndrome (Cummins, 1936, 1939). Several other chromosomal abnormali-ties have since been recognized as linked to genetic deformities, in addition to the typical dermatoglyphic irregularities associated with syndromes: trisomes 8, 13, 18 and 21 (Down’s Syndrome); a surplus, or deficiency, in the sex chro-mosomes: 45X (Turner), 47XXY (Kleinefelter); and duplication and deficiency ofparts of chromosomes (Shiono et al., 1975; Schaumann and Alter, 1976; Komatz et al., 1979; Jantz et al., 1981; Reed, 1981; Aue-Hauser et al., 1982; Bat-Miriam Katznelson, 1982; Ciovirnache et al., 1988; Davee et al., 1989).
Various developmental abnormalities caused by gene or chromosome de-ficiency, environmental pressure or a combination of causes, affect dermato-glyphic features may disrupt the two-sided symmetry of the affected condition.
Asymmetry and developmental homeostasis
When examining human individuals in a population, it may be said that their “structure” is symmetrical, since the genetic system contributes equally to both sides. Closer examination, however, shows that this is not necessarily so, for the phenotypical application of the genetic potential is not always equal on both sides. Van Valen (1962) defined this asymmetry as a deviation of the organism,in whole or part, from perfect two-sided symmetry.
The two most important types of asymmetry are:
1. Directional Asymmetry refers to one side of the body (limb or other structure) is larger, or smaller, than the other, usually depending on function (e.g. more fully developed muscles on the left side in left-handed individuals; (the left coronary ventricle of mammals is larger than the right one). According to Van Valen (1962), the cause of this asymmetry is an adaptive or developmental-genetic mechanism. Statistically, the population average of such asymmetry in one side of the body will always be greater than the value on the other side (Harris and Nweeia, 1980; Noss et al., 1983).
2. Fluctuating Asymmetry is defined as random deviations on both sidesof the body (limb or organs), with the average values in the popula-tion equal on both sides of the body (Lerner, 1954; Van Valen, 1962; Soule, 1982).
Fluctuating asymmetry is common in morphometric traits and its intensity is determined by the ability of the genotype to create a symmetrical phenotype, despite the intra- and extra-uterine environmental pressures exerted on the embryonal body during its development. Inasmuch as the genetic contribution to both sides of the body of bilateral individuals is identical, it follows that the level of ‚uctuating asymmetry re‚ects the relative success of developmentalhomeostasis to block developmental disturbances. This stabilizing capacity is called developmental homeostasis and has been acquired in the course of evo-lution through interrelations between the intraspecific genetic variability and

64 Eugene Kobyliansky et al.
environmental factors (Waddington, 1960). The evolutionary mechanism which preserves developmental stability is stabilizing selection (Waddington, 1942, 1957; Lerner, 1954). Individuals differ in this buffering capacity which finds itsexpression in developmental precision of internal and external structures, as well as in bilateral symmetry. The heritability level of ‚uctuating asymmetryhas been evaluated in laboratory animals (Leamy, 1984; Leary et al., 1985) and in human populations (Bailit et al., 1970; Townsend and Brown, 1978; Townsend and Brown, 1980; Livshits et al., 1988) and was found to be low. Townsend and Brown (1978) studied in humans the extent of heritability of permanent teeth size (which showed variability in the degree of ‚uctuating asymmetry) andfound that 36% of the dimensions of the teeth crowns are attributable to non-hereditary factors. In another study Townsend and Brown (1980) ascertained that 42% of the size of milk teeth is determined by the non-hereditary factors. Bailit et al. (1970) investigated the effect of environmental pressures (dietarydeficiency, climate, population density, diseases, noise) and genetic pressures(e.g. familial intermarriages boosting the homozygosity level of individuals) on dental asymmetry in humans. These investigators assumed that if such pres-sures elevate the level of phenotypic ‚uctuating asymmetry, the latter could beused as a measure of the intensity of the pressures. Studies carried out in recent years suggest that the ‚uctuating asymmetry level could serve as an external(phenotypic) expression of the level of the developmental homeostasis (Barden, 1980; Soule and Cuzin-Roudy, 1982; Atchley et al., 1984; Livshits and Kobylian-sky, 1985, 1987, 1991; Clarke and McKenzie, 1987; Ben-David [Kobyliansky] et al., 1989; Micle and Kobyliansky, 1991).
In children with Down’s syndrome or in children with cleft-lip and cleft pal-ate, a rise has been recorded in the ‚uctuating asymmetry values of the teeth(Garn et al., 1970; Sofaer, 1979; Barden, 1980; Townsend, 1983), in the dermato-glyphic properties (Woolf and Gianas, 1976, 1977) and in the dental and both dermatoglyphic measures combined (Adams and Niswander, 1967; Crawford and Sofaer, 1987). People with mental disturbance or retardation display a level of anthropometric ‚uctuating asymmetry which is significantly higher thanin a control population (Malina and Buschang, 1984). Additionally, in Rhesus macagues fetuses whose mothers were suffering from diabetes, there was a sig-nificant rise in the ‚uctuating asymmetry of morphometric traits as comparedto the fetuses in healthy simian females (Kohn and Bennett, 1986).
Rose et al. (1987) investigated dermatoglyphic asymmetry in ridge counts a-b in pairs of identical twins (monozygous) displaying behavioral discord. They found good accord between the level of ‚uctuating asymmetry in thetwin pairs and their success in psychological tests (with the more success-ful twin showing a higher level of ‚uctuating asymmetry than his brother).This and similar studies indicate that genetic, environmental and multifactorial disturbances impair the developmental homeostasis of individuals and act to enhance their level of ‚uctuating asymmetry (Doyle and Johnston, 1977; Siegelet al., 1977; DiBennardo and Bailit, 1978; Barden, 1980; Townsend and Brown, 1980; Shapiro, 1983; Townsend, 1983; Livshits et al., 1988; Leary and Allendorf, 1989; Livshits and Kobyliansky, 1991).
65Dermatoglyphic sexual dimorphism
Studies on animals and humans evince differences in the ‚uctuating asym-metry level of individuals which stem from an inverse ratio between the level of heterozygosity of the individual (dependent on the number of loci with two different alleles) and his ‚uctuating asymmetry values (Thoday, 1955, 1958;Niswander and Chung, 1965; Kat, 1982; Vrijenhoek and Lerman, 1982; Kob-yliansky and Livshits, 1983, 1986; Leary et al., 1984; Livshits and Kobyliansky, 1984, 1985, 1991; Chakraborty, 1987). All these studies are consistent with the hypothesis that individuals with a low level of heterozygosity will deviate from the population mean with respect to various bilateral traits (dermatoglyphics, dentition or other metric properties) will be endowed with low developmental homeostasis, and will show high susceptibility to diseases and developmental disturbances (Lerner, 1954; Sofaer, 1979; Shapiro, 1983; Townsend, 1983; Livshits and Kobyliansky, 1987, 1991). A graphic representation of multifactorial proper-ties (such as dermatoglyphic and dental indices) will show a normal distribu-tion (bell-shaped curve). The majority of individuals will fall within the center of the curve (being heterozygous for numerous traits from a genetic standpoint) whereas individuals with extreme measures (either above or below the mean) will distribute symmetrically at the ends of the curve. In a population existing under severe environmental pressures, the less adaptable individuals (i.e. the homozygotes at the axis of the curve) will be eliminated by stabilizing selec-tion, while the more suitable individuals, namely, the heterozygotes, will sur-vive. In support of these findings, there are observations in human populationsdisplaying a relatively low fecundity rate and consequently an augmented rate of inbreeding. In such populations there is increase in the level of ‚uctuat-ing asymmetry and a drop in the level of heterozygosity (the measurements here undertaken on the basis of inbreeding coefficient F, which expresses thedegree of distancing of the population from the heterozygosity expected in a random marriage system). Studies in animals (Kat, 1982; Baum and Lapin, 1983; Leary et al., 1984) as well as in humans with a high rate of inbreeding (Niswander and Chung, 1965; Martin et al., 1973; Spielman, 1973; Kobyliansky and Livshits, 1983; Ben-David (Kobyliansky) et al., 1989; Mukherje, 1990), point to a drop in the longevity and survival capacity of individuals as their level of ‚uctuating asymmetry rises.
Perizigian (1977) examined dental metric traits in Indian tribes and found higher ‚uctuating asymmetry in the teeth of individuals that subsisted onhunting than in those that subsisted on farming; the latter also had better liv-ing conditions and suffered less from environmental pressures than the former.The investigation assumed that these inter-tribal differences stemmed from dif-ferences in the intensity of environmental pressures exerting an in‚uence onthem but did not rule out the possible existence of genetic differences on thein‚uence of different levels of inter-tribal inbreeding.
Soule (1979) who studied 15 isolated populations of lizards on various Mexi-can islands, found an inverse correlation between the ‚uctuating asymmetryvalues of the bilateral body organs and their biochemical heterozygosity level. This finding supported the assumption that heterozygous individuals have a higher developmental stability than do homozygous individuals and that the higher the developmental stability the lower the ‚uctuating asymmetry level.
66 Eugene Kobyliansky et al.
Shapiro (1983) studied development and growth in children suffering fromDown’s syndrome and conjectured that deleterious genes and chromosomal ab-errations can cause decrease in developmental stability and what is even more important, can abrogate or diminish activity of the polygenic checking systems that act against environmental disturbances in the course of development.
Kieser et al. (1986) compared the values of ‚uctuating asymmetry in theteeth of 202 Lengua Indians, residents of Paraguay (11 indices per mandible) with those in the teeth of 125 individuals of Caucasian extraction. They detected a lower canalization capacity in their Indian subjects, which was re‚ected in a higher ‚uctuating asymmetry level than in the Caucasian subjects. Since thereare, even in populations not exposed to environmental pressures, individuals which function less than others (with enhanced ‚uctuating asymmetry), inves-tigators supposed that the more populations are exposed to more severe envi-ronmental conditions, the greater the number of individuals functioning poorly. Indeed, laboratory investigations on pregnant mice and rats support this con-clusion and show that exposure of them to cold, heat or noise caused increase in the level of ‚uctuating asymmetry in the bones and teeth of their progenyand also enhanced the prenatal mortality rate of the fetuses as compared to the control group (Siegel and Smookler, 1973; Siegel et al., 1977; Sciulli et al., 1979; Mooney et al., 1985; Leary and Allendorf, 1989).
Kobyliansky and Livshits (1986) studied correlations between anthropomet-ric traits (height, palm length, etc.) and dermatoglyphic traits and found a drop in the ‚uctuating asymmetry of finger ridge counts in individuals located inthe center of the distribution curve for morphological traits. This finding isconsistent with the hypothesis of Lerner (1954) that greater heterozygosity of individuals within a population will lead to less variability among these indi-viduals. In line with this suggestion, it would seem that the numerous in‚u-ences exerted by the gene (pleiotropy) are the outcome of a stabilizing selection force which prefers situations involving different allele pairs (heterozygosity).Further investigations (Lerner, 1954; Berger, 1976; Soule, 1979; Livshits and Ko-byliansky, 1985, 1987, 1991; Kieser et al., 1986; Bennett, 1986; Leamy, 1986; Micle and Kobyliansky, 1986, 1991; Sofaer and Crawford, 1987) confirm the conclusionthat the rate of ‚uctuating asymmetry can serve as an index of the develop-mental stability level of individuals. If this conclusion is indeed validated, then it would become possible to utilize the indices of variability and ‚uctuatingasymmetry of morphological and dermatoglyphic traits to predict ontogenetic aberrations (Livshits and Kobyliansky, 1987, 1991; Livshits et al., 1988). More-over, inasmuch as a large proportion of defects at birth is characterized by dermatoglyphic aberrations (both in the traits proper, as well as in the indices of variability and asymmetry), these could probably serve as ’marker traits’ for determining the level of developmental stability (Adams and Niswander, 1967; Dzuiba, 1972; Vormittag et al., 1976, 1979, 1986; Woolf and Gianas, 1976, 1977; Barden, 1980; Balgir, 1984; Crawford and Sofaer, 1977; Livshits and Kobyliansky, 1987, 1991; Livshits et al., 1988; Plato et al., 1991).
Do the environmental changes taking place during the last decades increase the frequency of mutation? Are we to expect such changes in the human gene

67Dermatoglyphic sexual dimorphism
pool as would diminish the developmental homeostasis of individuals and cause their ‚uctuating asymmetry to rise?
Factors affecting FA and developmental homeostasis
We know that the advent of technology and medicine tends to produce relax-ation of natural selection – a process which is liable to augment the frequency of mutant alleles associated with genetic diseases (monogenic, polygenic and multifactorial diseases). Each ionizing radiation accreting to the natural back-ground irradiation (cosmic radiation and radioactive isotopes) contributes to en-hanced mutation frequency (Vogel, 1979; Fuhrmann and Vogel, 1982). Possible effects of exposure to radiation are neoplastic diseases (leukemia, bone cancer,lung cancer, etc.), harmful mutations, chromosomal observations and abortions linked with DNA damage (Neel, 1976, 1978, 1980; Vogel, 1990). Under ordinary conditions, each person is exposed to an irradiation of about 14 rad in the course of a lifetime (Casarett, 1968; Pizzarella, 1982). Radiation doses in‚ictingharm upon human range between 250–450 rad, while the critical dose is 10,000 rad (producing death within a day). The added radiation ensuing from atomic experiments (scientific and military) or the erection of atomic power stations orfrom severe accidents. The radiation fallout level recorded in England following the Chernobyl disaster was 30-fold greater than that measured in the U.S.A. Studies on survivors of the Nagasaki and Hiroshima bombings revealed a rise in neoplastic diseases in the survivors but no appearance of mutants among their progeny. Conceivably, though, descendants could be carrying new reces-sive mutations that may express themselves in the future in homozygotic form (Greulich et al., 1953). As a consequence of all the above, the human gene pool becomes ’enriched’ with mutant alleles (Emery and Rimoin, 1990). According to Vogel (1979), a large percentage of human zygotes is destroyed or loses viability owing to mutations (the mutation rate in the germ cells of an individual rang-ing between 1/2 to 1/10). In recent years, public and scientific debates havebeen undertaken to assess the damage incurred by mutation induction owing to radiation or mutagenic substances, so as to generate programs for protection of the population (Neel, 1976, 1978, 1980; Bora et al., 1982).
In most Western countries there has been since the beginning of the present century a marked decrease in morbidity and mortality rates of the population. The considerable progress of medicine and public health has led to ameliora-tion of nutritional and hygienic conditions and decrease in the rate of infectious diseases (McKeown et al., 1975). Genetic diseases have consequently gained in importance (Roberts et al., 1970). These changes are evident from the data of studies on the causes of mortality in children in recent decades (Hall et al., 1978; McMillen, 1979). In fact, newborn mortality rate worldwide has continuously dropped over the past 30 years from 14% in the years 1950–1955 to 9% in the years 1975–1980 (Miller, 1985). As for neonate mortality rate in Israel, this has dropped from 4.6% in 1950 to a mere 1% in 1988 (0.76% in the Jewish popula-tion of Israel, according to the 1990 Annual Statistic Report). One of the factors responsible for infant mortality is stabilizing selection, which favors neonates showing average morphologic dimensions and eliminates those who deviate
68 Eugene Kobyliansky et al.
from the mean (Ulizzi et al., 1981; Rajanikumari and Rao, 1984). The advances in intensive care of newborns has significantly diminished both the in‚uenceof stabilizing selection and the intensity of selection, and consequently there has been a drop in the mortality rate of neonates of low birth weight and a rise in the number of premature babies. The latter is liable to adversely affect thegene pool (Paneth et al., 1982; Ross, 1983). In addition to all that, also ecologi-cal afflictions are on the increase in recent years (e.g. intrauterine infections,chemotherapy, radiations, maternal diseases, exposure to mutagenic and carci-nogenic materials which are the by-products of modern industrialized society) and might adversely in‚uence prenatal development and embryonal capacityto withstand environmental pressures (Heinonen et al., 1977; Hamshaw and Dudgeon, 1978; Hall et al., 1978, 1980; Brent, 1980; Webster, 1981; Stanbury et al., 1983; Schardein, 1985; Zakkarov et al., 1988). As a result of all the above, there is increase in the relative number of neonates showing low developmental homeostasis, such as might impose considerable burden (physical, emotional and financial) on their families, as well as on society (Fink et al., 1977). In orderto prevent (or at least reduce the number of) newborns with severe genetic impairment, it is important to detect such individuals as represent high risk for defective progency and offer them preventive genetic council (Antley, 1976;Zare et al., 1984; Livshits et al., 1988).
Dermatoglyphic asymmetry
It is quite clear from the literature that much attention of human asymmetry studies are focused mainly on dentition, but the study of dermatoglyphic asym-metry has attracted the interest very recently of some workers in respect of de-velopmental field (Wolanski and Charzewska, 1967; Roberts and Coope, 1975;Livshits and Kobyliansky, 1985, 1987). Roberts and Coope (1975) were the firstscientists who suggested the developmental field concept that had been devel-oped in dental genetics (Dahlberg, 1945; Butler, 1963), to apply to the genesis of dermal ridges in fingers. Livshits et al. 1987–1991, in their subsequent studiesconcluded that “FA of dermatoglyphic traits may perhaps be used as an indi-cator of actual and potential disruption of normal ontogeny, yet the available data are still too scanty to reach a clear-cut conclusion”. In recent years more attention has also been directed to comparing the magnitude of dermatoglyphic asymmetry in different populations, although the existence of bilateral asym-metry in several dermatoglyphic traits has long been established by Cummins and Midlo (1943/1961).
The analysis of variables associated with dermal ridges in the hands and feet has long been of interest. However, it is evident from the review of the literature that relatively more studies on asymmetry are available on fingercompared to palmar areas (Holt, 1954; Singh, 1968; Jantz, 1975, 1978, 1979; Kobyliansky et al., 1979; Leguebe et al., 1981; Chakraborty et al. 1982; Loesch and Martin, 1982; Martin et al., 1982; Vona and Porcella, 1983; Reddy et al., 1985, 1991; Kohn and Bennett, 1986; Kobyliansky and Micle, 1986, 1987, 1988; Livshits and Kobyliansky, 1987, 1991; Malhotra et al., 1987, 1991; Markow and Gottesman, 1989; Chowdury, 1991). There are only a few studies on palmar

69Dermatoglyphic sexual dimorphism
dermatoglyphics based on a-b ridge counts (Woolf and Gianas, 1977; Jantz and Webb, 1980, 1982; Micle and Kobyliansky, 1986, 1992; Goodson and Meier, 1986), on main lines (Kumbani, 1964), on main line index (Karmakar, 1990; Malhotra et al., 1991). In order to detect dermatoglyphic markers in individuals with high risk of contracting disease or giving birth to diseased offspring, oneneeds to assess the relative contribution of genetic and environmental factors to the creation of dermatoglyphic changes. Hence, in the present study we opted to investigate dermatoglyphic traits as well as indices of variability and asym-metry in individuals suffering from various genetic afflictions, as compared to the appropriate control groups.
Genetic defects
Genetic defects are more prevalent than one imagines. In 1–2% of newborns there are hereditary defects at birth. In 0.5% of newborns the metabolic distur-bances at birth or defects in the sex chromosomes which are not overt and can be detected only through specific laboratory tests (hybridization, chromosomalstaining, genomal libraries, restrictions maps, etc: Shohat and Ashkenazi, 1990). The common genetic defects are the following:
1. Single mutation in a gene which is transmitted in Mendelian fashion;2. Hereditary defects affected by numerous factors (multifactorial inheri-
tance); and3. Chromosomal abnormality (changes in the number and/or in the struc-
ture of the chromosome).
The present study assesses the dermatoglyphic traits of individuals afflictedwith genetic defects, concentrating on their level of ‚uctuating asymmetry andintraindividual diversity as compared with healthy control groups. The defects are classified as follows:
a. Chromosomal syndromes (absence or addition of an entire chromosome)
The frequency of chromosomal defects is very high in natural abortions (about 50%, while 90% of pregnancies with karyotypic defects terminate in abortion, of which 90% are the Turner type). At birth, the frequency of chromo-somal defects is 1/150, with half of them in the X chromosome and the other half in autosomal chromosomes. Defects in the number of chromosomes can show themselves in aneuploid cells which contain excess (trisomy) or absence (monosomy) of a chromosome, or a combination of both. Usually such a con-dition arises from non-disjunction at the phase of meiosis (with higher risk here in the older women) or non-progression of a chromosome at anaphase (anaphase lag). Another defect can be mosaicism, that is, a deficient number ofchromosomes only in part of the cells, which usually arises from a mitotic non-separation at mitosis (Krupp et al., 1986; Rudolph and Hoffman, 1987).

70 Eugene Kobyliansky et al.
Among the chromosomal syndromes investigated in the present study are:
1. Turner’s syndrome – 45 x monosomy (deficiency in the female X chro-mosome);
2. Klinefelter’s syndrome – 47, XXY (accretion of an X chromosome in the male);
3. Down’s syndrome – Trisomy 21 (accretion of a 21 autosomal chromo-some).
Numerous dermatoglyphic investigations have been undertaken on the above syndromes and these have uncovered typical aberrations which are helpful in diagnosing the syndrome (Penrose, 1967, 1968; Schaumann and Alter, 1976; Jantz et al., 1981; Reed, 1981; Aue-Hauser et al., 1982; Bat-Miriam Katznelson, 1982; Jantz and Hunt, 1986; Ciovirnache et al., 1988; Jantz and Brehme, 1988; Davee et al., 1989; Newell-Morris and Wienkler, 1989).
b. Monogenic diseases (Mendelian)
To date we know of more than 3000 monogenic hereditary diseases (about 1800 dominant and 1500 recessive). About 800 of these diseases are associated with the X chromosome (Rudolph and Hoffman, 1987). In the present study weexamine the dermatoglyphic traits of patients with cystic fibrosis (C.F.), whoseinheritance is recessive autosomal, with the afflicted presenting as homozygoteswith two damaged alleles at the same locus on the homologous chromosomes, while the carriers are the heterozygotes (with one damaged allele only). The frequency of this disease in the human population is about 1/2500 (albeit vari-able among the different races and highest in the Caucasian race), whereasfrequency of the gene is 1/50 and that of the carriers – 1/25 (Behrman and Vaughan, 1987; Rommeus et al., 1989; Shohat and Ashkenazi, 1990).
Dermatoglyphic studies have been carried out on various monogenic dis-eases but not on C.F. patients.
c. Multifactorial hereditary defects
These defects are the result of the accumulating in‚uences of several genes,in combination with environmental factor. The number of genes involved is not known. The primary environmental factors are climate, socio-economic condi-tions and intra-uterine in‚uences. The disturbances transmitted in this mannerare more common than those by any other hereditary mechanism, but their frequency varies in different populations (Chung et al., 1980). The present in-vestigation examines individuals with inherited cleft palate or cleft lip (with or without cleft palate). On individuals with this defect there have been a number of dermatoglyphic studies (Silver, 1966; Adams and Niswander, 1967; Woolf and Gianas, 1976, 1977; Sofaer, 1979; Crawford and Sofaer, 1987).

71Dermatoglyphic sexual dimorphism
d. Diseases of unknown etiology and undetermined level of heritability
Cancer is not a single disease but rather a conglomerate of dozens of dis-eases produced by hundreds or thousands of factors acting discretely or in combination. There is still uncertainty regarding the genetic transmissibility of these neoplastic diseases but evidence is increasingly accumulating to tie malignant diseases to genetic factors which find excess expression in particularfamilies. For some of these diseases we know that their occurrence in a family significantly increases the risk factor of contracting the disease, to first genera-tion relations, that is, parents, siblings of offspring. Thus, the more there arefamily members who have contracted cancer and the earlier the age at which cancer appears in their family, the greater the risk to all involved (Ben-Sasson, 1990; Malpas, 1990; Renert, 1990).
In the present study we examined women suffering from endometrical car-cinoma and carcinoma of the cervix.
* * *
As already mentioned, a portion of our data and findings is not new but ratherwell documented in the literature. Thus the dermatoglyphic properties of indi-viduals with Turner’s syndrome, Klinefelter’s syndrome or Down’s syndrome, as well as of individuals afflicted with cleft palate or lip have been investigatedand published. What is new in our investigation is the choice of dermato-glyphic variables (e.g. the addition of quantitative traits, and the isolation and computation of indices of variability and asymmetry as detailed in “Material and Methods”), and the use of different methods of multi-variate analysis (asagain detailed in “Material and Methods”). Neither have dermatoglyphic broad studies been carried out on C.F. patients or on women suffering from endo-metrical or cervical carcinoma.
The dermatoglyphic deviations observed by us in individuals with chromo-somal syndromes are more clear-cut and significant than those in individualswith monogenic or polygenic defects. This posed the question as to whether similar findings are to be expected in the diseases examined in the course ofthe present study and whether the same regularity will apply also to the results pertaining to ‚uctuating asymmetry. Furthermore, if ‚uctuating asymmetryre‚ects a developmental stability, will we encounter an increase in ‚uctuat-ing-dermatoglyphic asymmetry among individuals with various genetic distur-bances? Can we expect to find that the greater the severity of the genetic dis-turbance the greater also the level of ‚uctuating-dermatoglyphic asymmetry? Are dermatoglyphic traits suitable for assessing the level of ‚uctuating asym-metry? Will we expect to find in C.F. patients, whose developmental stability islow, a high ‚uctuating-dermatoglyphic asymmetry as compared to the control groups? Will we find changes in the dermatoglyphic traits and in the level of‚uctuating asymmetry also among the parents of patients with C.F., CL[P] orCP, and Down’s syndrome? These and additional questions we have attempted to answer in the course of the present study.

72 Eugene Kobyliansky et al.
The aims of the present study are as follows:
1. To obtain comparative data on the digital and palmar dermatoglyphics in male and female Israeli Jews (healthy control groups), as well as to obtain an estimate of male–female dermatoglyphic dimorphism.
2. To obtain a dermatoglyphic characterization of both discrete and quan-titative traits in persons showing chromosomal syndromes (Turner, Klinefelter, Down), in individuals with monogenic disease (C.F.) or ones with polygenic defect (CP and CL[P]), and in women afflictedwith endometrical or cervical carcinoma (whose hereditability is un-certain), as compared to the appropriate control groups.
3. To obtain a dermatoglyphic characterization of the parents of patients suffering from Down’s disease, from C.F. or from cleft palate or lip,as compared to control groups.
4. To use dermatoglyphic data to assess the level of asymmetry (direc-tional or ‚uctuating) and the intra-individual diversity in the afore-mentioned diseases, and this in both sexes as compared to control groups.
5. To use dermatoglyphic data to evaluate sexual dimorphism among patients and their parents in cases of Down’s syndrome, C.F., CP and CL[P], as compared to control groups.
6. To test the hypothesis that in chromosomal disturbances and in mono-genic and polygenic diseases, there is increased level of ‚uctuatingasymmetry (and impaired developmental homeostasis).
7. To explore the possibility of using dermatoglyphic data (discrete and quantitative traits, indices of variability, directional and ‚uctuatingasymmetry) to detect an existing or future disturbance in the course of ontogenic development (e.g. the incipience of endometrical or cervical carcinoma at an advanced age).
8. To explore the possibility of using dermatoglyphic data (discrete and quantitative traits, indices of variance, directional and ‚uctuatingasymmetry) of the parents of Down’s syndrome, C.F., CL[P] and CP patients to predict the likelihood of the diseases appearing also in the offspring.
This first contribution is dedicated to description of the method and mate-rial and mainly to detail analysis of sexual dimorphism in dermatoglyhics in control groups of healthy individuals. These data in the following articles will be used as standard for comparison with the above mentioned diseases and syndromes.
73Dermatoglyphic sexual dimorphism
Research methods
1. Collection of finger and palm prints
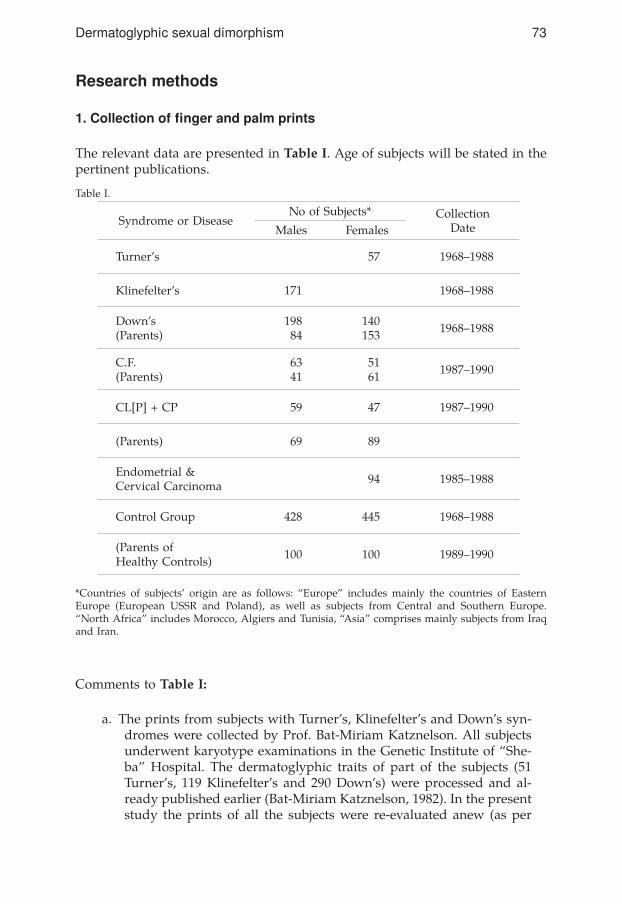
The relevant data are presented in Table I. Age of subjects will be stated in the pertinent publications.
Table I.
*Countries of subjects’ origin are as follows: “Europe” includes mainly the countries of Eastern Europe (European USSR and Poland), as well as subjects from Central and Southern Europe. “North Africa” includes Morocco, Algiers and Tunisia, “Asia” comprises mainly subjects from Iraq and Iran.
Comments to Table I:
a. The prints from subjects with Turner’s, Klinefelter’s and Down’s syn-dromes were collected by Prof. Bat-Miriam Katznelson. All subjects underwent karyotype examinations in the Genetic Institute of “She-ba” Hospital. The dermatoglyphic traits of part of the subjects (51 Turner’s, 119 Klinefelter’s and 290 Down’s) were processed and al-ready published earlier (Bat-Miriam Katznelson, 1982). In the present study the prints of all the subjects were re-evaluated anew (as per
Syndrome or DiseaseNo of Subjects* Collection
DateMales Females
Turner’s 57 1968–1988
Klinefelter’s 171 1968–1988
Down’s(Parents)
19884
140153 1968–1988
C.F.(Parents)
6341
5161 1987–1990
CL[P] + CP 59 47 1987–1990
(Parents) 69 89
Endometrial & Cervical Carcinoma 94 1985–1988
Control Group 428 445 1968–1988
(Parents ofHealthy Controls) 100 100 1989–1990

74 Eugene Kobyliansky et al.
numbers appearing in Table I) and so also those of the parents of the Down’s cases, according to the variables to be listed forthwith.
b. The prints of C.F. patients and their parents were collected in several medical centers as follows: Department of Child Development “She-ba” Hospital (Courtesy of Prof. Katznelson, Dr. Yahav, Dr. Steinberg and Mrs. Esther Prissman); Department of Pediatrics “Carmel” Hos-pital, Haifa (Courtesy of Dr. Rivka and Leveah Golan); Outpatient Clinics of Hadassah Hospital, Jerusalem (Mount Scopus) (Courtesy of Prof. Simon Godfrey and Dr. Springer). Additional prints were taken in children summer camps and in their own residences, (cour-tesy of the C.F. Society of Israel, Mrs. Rinat Ben-David and Mr. Erez Hershkovitz).
c. The prints of subjects with CL[P] and CP were collected in the De-partment of Plastic Surgery of the “Beilinson” Hospital with the kind assistance of Mrs. Arielah Nakhmani (Speech Clinic) and in the Mouth and Jaw Clinic of the “Rambam” Hospital (Courtesy of Dr. Yossi Cohen and Mrs. Maya Yanon).
d. The prints of women suffering from endometrial or cervical carci-noma were taken in the clinic of Dr. Mancher at “Sheba” Hospital, both by Dr. Bejerano, as well as by Prof. Bat-Miriam Katznelson.
e. The control group comprises a sample of 874 healthy subjects, half of them males and the other half females, all from large Jewish com-munities of European extraction (50%), as well as from Asia and North Africa (50%). All control subjects were adult (over 18 years of age) and of no familial interrelations, including parents to healthy children. Thus, we used 100 parent pairs as a control group for the parents of the afflicted children. We should point out, in closing,that the prints were collected at random from various regions of the country.
2. Procedure for taking finger and palm prints
This was done with the aid of pads manufactured by Lamedco Inc., Knoxville, Tennessee. The prints were taken on paper produced by Promedica Co., Tel Aviv. Interpretation of the prints was according to Cummins and Midlo (1943, 1961) and Penrose (1968) and included identification of patterns, ridge countsand the measurement of distances and angles in the palms of the hands.
3. Analysis of 79 dermatoglyphic variables and their characterization by sex and disease
This was done according to the protocols extent in the relevant literature (Holt, 1968; Jantz, 1975; Nie et al., 1975; Micle and Kobyliansky, 1986, 1991; Livshits and Kobyliansky, 1991). Details on the dermatoglyphic variables and their breakdown are provided forthwith.

75Dermatoglyphic sexual dimorphism
First we list the 22 quantitative traits used to compare between the sexes and the groups, these were:
Finger RC, I–r Absolute RCFinger RC, II–r PII, lhFinger RC, III–r PII, rhFinger RC, IV–r PII, both handsFinger RC, V–r a-b, RC, rhFinger RC, I–l a-b, RC, lhFinger RC, II–l A–line exit lFinger RC, III–l A–line exit rFinger RC, IV–l D–line exit lFinger RC, V–l D–line exit rTotal RC (TRC) Main line index (MLI)
RC = ridge count; r = right; l = left; h = hand;PII – Pattern Intensity Index
Additional quantitative traits that were used to compare between sexes and groups included:
1. Ridge counts of ulnar loops2. Ridge counts of radial loops3. Ridge counts of whorls4. a-b distance5. Ridge breadth6. Maximal atd angles
Traits 4, 5 and 6 change with age of the examinees. For trait 6 we have a correc-tion per sex and age (Penrose, 1954) which can be tabulated as follows:
Age (in years) 0–4 5–14 15–18
Males –5° 0° +3°
Females –9° –2° +2°
As for discrete traits used to compare between the sexes and groups, these comprised the following nine:
1. Frequencies of finger pattern types,2. Frequencies of pattern combinations on the pairs of right and left
homologous fingers,3. Frequency of pattern type combinations on the ten fingers,4. The Shannon information measure derived from the finger pattern
frequencies in each individual,5. Percent distribution of palmar patterns,6. Percentage of uncommon patterns of subdigital triradii,7. Absence of c triradius,8. Percent distribution of Sydney and Simian lines,9. Percent distribution of the highest position of axial triradius t.
76 Eugene Kobyliansky et al.
Indices of diversity and asymmetry
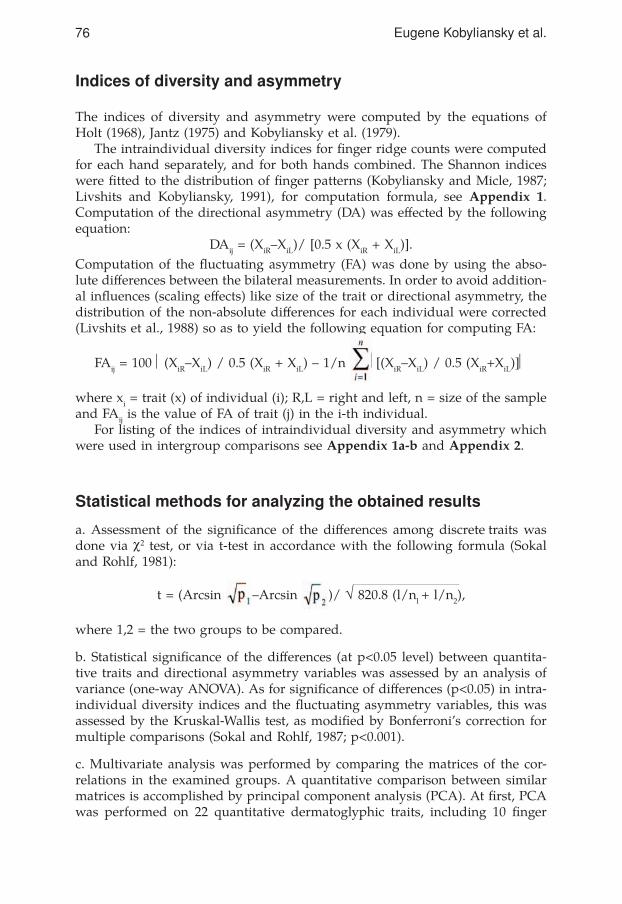
The indices of diversity and asymmetry were computed by the equations of Holt (1968), Jantz (1975) and Kobyliansky et al. (1979).
The intraindividual diversity indices for finger ridge counts were computedfor each hand separately, and for both hands combined. The Shannon indices were fitted to the distribution of finger patterns (Kobyliansky and Micle, 1987;Livshits and Kobyliansky, 1991), for computation formula, see Appendix 1. Computation of the directional asymmetry (DA) was effected by the followingequation:
DAij = (XiR–XiL)/ [0.5 x (XiR + XiL)].Computation of the ‚uctuating asymmetry (FA) was done by using the abso-lute differences between the bilateral measurements. In order to avoid addition-al in‚uences (scaling effects) like size of the trait or directional asymmetry, thedistribution of the non-absolute differences for each individual were corrected(Livshits et al., 1988) so as to yield the following equation for computing FA:
FAij = 100 (XiR–XiL) / 0.5 (XiR + XiL) – 1/n [(XiR–XiL) / 0.5 (XiR+XiL)]
where xi = trait (x) of individual (i); R,L = right and left, n = size of the sample and FAij is the value of FA of trait (j) in the i-th individual.
For listing of the indices of intraindividual diversity and asymmetry which were used in intergroup comparisons see Appendix 1a-b and Appendix 2.
Statistical methods for analyzing the obtained results
a. Assessment of the significance of the differences among discrete traits was done via χ2 test, or via t-test in accordance with the following formula (Sokal and Rohlf, 1981):
t = (Arcsin –Arcsin )/ √ 820.8 (l/nl + l/n2),
where 1,2 = the two groups to be compared.
b. Statistical significance of the differences (at p<0.05 level) between quantita-tive traits and directional asymmetry variables was assessed by an analysis of variance (one-way ANOVA). As for significance of differences (p<0.05) in intra-individual diversity indices and the ‚uctuating asymmetry variables, this wasassessed by the Kruskal-Wallis test, as modified by Bonferroni’s correction formultiple comparisons (Sokal and Rohlf, 1987; p<0.001).
c. Multivariate analysis was performed by comparing the matrices of the cor-relations in the examined groups. A quantitative comparison between similar matrices is accomplished by principal component analysis (PCA). At first, PCAwas performed on 22 quantitative dermatoglyphic traits, including 10 finger

77Dermatoglyphic sexual dimorphism
ridge counts, TRC, AbsRC, ridge counts of the a-b region and indices of PII and MLI. Next, the PCA was performed for 42 dermatoglyphic variables represent-ing indices of intra-individual diversity, directional asymmetry and ‚uctuatingasymmetry. The BMDP statistical software for PCA was used (Dixon, 1983).
d. Cluster analysis was carried out along similar principles to the PCA. The phenotypic correlations between the dermatoglyphic variables were examined separately for each group. The correlation matrices were used to compute the Euclidean distances between each pair of variables, while the results of these computations were grouped in dendrograms according to Hartigan (1983). Each variable represents a single branch and the two variables with the high-est correlation combine to form a common cluster. Continuation of this process results in clusters which contain the variables with the highest correlation be-tween them.
e. Discriminant analysis was performed by use of the SPSS statistical software (Nie et al., 1975). The purpose of this analysis was to compare the capability of sorting individuals into patient and control groups by the two categories of dermatoglyphic traits. The analysis was performed in two stages. In the firststage, independent variables were selected on the basis of their discriminating power F>4, according to the Willes stepwise method, and this from the two groups of dermatoglyphic variables, namely, the 22 quantitative traits and the 42 indices of variance and asymmetry. In the second stage we arranged a clas-sification basing on comparisons between the patient and control groups.
The data were processed by the central computer of Tel Aviv University us-ing the software of Nie et al. (1975) and Dixon (1983).
Sexual dimorphism in control group of healthy individuals
Differences between the sexes insofar as growth rate, morbidity and prenataldeath have been encountered in humans both in stressful, as well as comfort-able environmental conditions (Stinson, 1985). In the literature dealing with physical anthropology, it is maintained that males possess a lower bufferingcapacity than females against environmental in‚uences in the course of growthand development. Early reference to this can be found in the articles of Greulich (1951) and Greulich et al. (1953), who found inter-sex differences in regard tomorphological traits of children that survived the Hiroshima bombing. In ad-ditional investigations (Tobias, 1972; Stini, 1975, 1982; Waldron, 1983), men were found more susceptible than women to conditions of stress. Thus, in males there was under stress a stronger retardation of bodily size and bone age, as well as more instances of pre-natal or post-natal morbidity and mortality (Stin-son, 1985). The Statistical Annual of Israel (1990) reports that male infant (up to one year) mortality is 1.23 fold greater than that of female infants. Studies relating to responses to environmental stress at a later age yielded less clear-cut results, mainly because male offspring in many societies receive preferentialtreatment (Stinson, 1985; Ben-David (Kobyliansky) et al., 1989).

78 Eugene Kobyliansky et al.
Inter-sex differences regarding dermatoglyphic traits are known from the lit-erature (Cummins and Midlo, 1943, 1961; Holt, 1968; Bener, 1979; Schwidetzky and Jantz, 1979; Loesch, 1983; Micle and Kobyliansky, 1986, 1987, 1988; Kob-yliansky and Micle, 1987, 1988, 1989; Plato et al., 1991). Women are found to have narrower ridges, less whorls and radial loops and more loops and arches in the fingers of the hands. Furthermore, compared to men, women have morepatterns in the hypothenar and interdigital region IV and less patterns in other parts of the palm. On the other hand, men show PII values and finger ridgecounts which are higher than in women. Women usually have lower ‚uctuatingasymmetry than men, which re‚ects on developmental homeostasis and betterblocking of adverse in‚uences in the course of development (Ludwig, 1932;Hiernaux, 1968; Tobias, 1972; Stinson, 1985). Other investigations demonstrate that in individuals possessing a large number of homozygous loci there is higher ‚uctuating asymmetry than in individuals with numerous heterozygousloci (Lerner, 1954; Soule and Cuzin-Roudy, 1983; Kobyliansky and Livshits, 1983, 1986; Livshits and Kobyliansky, 1991). It may be presumed that in males, the homozygosity of the genes in the X-chromosome causes an increase in the ‚uctuating dermatoglyphic asymmetry, whereas in females, who possess twoX-chromosomes (one of which is not fully active), show better homeostatic ca-pacity which expresses itself in diminution of the ‚uctuating asymmetry (Micleand Kobyliansky, 1986, 1991).
Differences in the level of sexual dermatoglyphic dimorphism have been de-tected in various populations (Cummins and Midlo, 1943, 1961; Sachs and Bat-Miriam, 1957; Holt, 1968; Bat-Miriam Katznelson and Ashbel, 1973; Shaumann and Alter, 1976; Schwidetzky and Jantz, 1979; Loesch, 1983; Bejerano, 1986; Micle and Kobyliansky, 1986, 1991). Kobyliansky and Micle (1987, 1988, 1989), studied the dermatoglyphic traits of Jewish communities which lived for many generations under different economic, social and geographic conditions, butnevertheless displayed much similarity, both in their dermatoglyphic traits, as well as their biochemical and immunological properties (Livshits et al., 1991). Such communities did show differences in their sexual-dermatoglyphic dimor-phism, so that possibly environmental factors accounted for the observed inter-sex differences. In‚uence of the ambience finds greater expression in males,who are very sensitive to environmental changes at the onset of their embryo-nal development (Stinson, 1985), at which time the dermatoglyphic patterns are determined. Micle and Kobyliansky (1986, 1991) found differences betweenthe sexes in respect to the level of dermatoglyphic asymmetry (directional and ‚uctuating) in Jewish Israeli males and females and contrary to expectation,many of the measures were higher in women than in men.
The control sample
The control sample comprised 428 males and 445 females belonging to vari-ous Jewish groups now residing in Israel. The main groups serving as control were of North African extraction (Morocco, Algiers and Tunisia), the Middle

79Dermatoglyphic sexual dimorphism
East (Iraq and Iran) and East and Central Europe (the European part of the former USSR, Poland, Rumania, Hungary and Germany). The majority of con-trol subjects were born in Israel, while the remainder were immigrants arriv-ing from the mentioned countries. All subjects were over 18 years of age and in proper health.
The above sample was to serve as control group to individuals with vari-ous chromosomal syndromes (Turner’s, Klinefelter’s, Down’s), ones with C.F. (a monogenic disease), ones with CL[P] and CP (a polygenic defect), and wom-en which were suffering from endometrical or cervical carcinoma (diseaseswhose level of heritability is uncertain). The control pertained both to quantita-tive traits, discrete traits and indices of intraindividual diversity and asymme-try, as well as to inter-sex differences in these measures (sexual dimorphism). A part of the control sample was comprised of a group of 100 parental pairs to healthy children, which served as a control group to the parents of children with Down’s Syndrome, C.F. and also CL[P] and CP.
Results
a. Fingers
UL is the most common pattern, particularly in women (53.8% vs 50.9% in men) to be followed by W, which is more prevalent in men (42.6% vs 37.6% in women). Patterns A and RL occur in low frequencies in both sexes. Pattern A is more frequent in fingers II and III while RL is more frequent in fingerII. The frequency of UL increases from finger to finger in the following order:V>III>I>IV>II, and this in both hands and both sexes. Bilateral asymmetry in the pattern arrangement is more prominent in men (who have in the right hand more W and less UL, whereas women have in left hand less UL and more RL). Greater differences between the sexes were encountered in Jewish communi-ties from Eastern Europe (UL frequency in women 62.1% vs 46.7% in men, W frequency in men 45.5% vs 30.6% in women (Kobyliansky and Micle, 1989) and from North Africa (UL frequency in women 58.3% vs 52.4% in men, W fre-quency 42.6% in men vs 36.0% in women (Kobyliansky and Micle, 1987, 1988, 1989; Micle and Kobyliansky, 1987).

80 Eugene Kobyliansky et al.
Table 1.1. Frequencies in % of finger pattern types, by sex and hand; control group.
Pattern combinations on homologous fingers were found to be similar in the two sexes (Table 2.1). We encountered many individuals with symmetric pairs on finger V and few on finger II. The combination U-U was very prevalent, espe-cially in women, Kobyliansky and Micle (1987, 1988, 1989) obtained a range of results to wit: 72.8–75.6% of symmetric pairs in men, 73.3–76.3% in women.
Table 2.1. Pattern combinations (in %) on the pairs of right and left homologous fingers; controlgroup.
Pat.type
Left fingers Lefthand
Right fingers Righthand
BothhandsI II III IV V I II III IV V
Males
A 1.4 5.8 6.5 1.4 0.2 3.1 0.5 6.3 4.0 0.7 0.2 2.3 2.7
RL – 17.5 1.2 0.5 – 3.8 0.2 17.8 0.5 0.7 0.2 3.9 3.8
UL 49.3 31.1 65.0 44.6 80.4 54.1 37.6 25.9 67.3 36.0 71.7 47.7 50.9
W 49.3 45.6 27.3 53.5 19.4 39.0 61.7 50.0 28.3 62.6 27.8 46.1 42.6
Females
A 4.0 8.8 10.1 2.9 0.9 5.3 2.9 8.3 5.8 2.0 0.9 4.0 4.7
RL 0.7 20.7 1.8 1.3 – 4.9 0.4 12.6 0.9 0.4 – 2.9 3.9
UL 47.4 26.1 64.0 44.9 78.2 52.1 44.9 35.5 74.2 44.0 78.9 55.5 53.8
W 47.9 44.5 24.0 50.8 20.9 37.6 51.7 43.6 19.1 53.5 20.2 37.6 37.6
Pairs offingers
Pattern combination
A-A R-R U-U W-W A-R A-U A-W R-U R-W U-W Symmetrical pairs
Males
I-I 0.2 – 31.8 44.4 – 1.4 – – 0.2 22.0 76.4
II-II 3.5 8.4 14.5 37.1 2.5 2.4 0.2 10.2 5.6 15.4 63.5
III-III 2.8 – 54.0 18.0 0.2 4.2 0.4 1.1 0.2 18.9 74.8
IV-IV 0.5 – 29.0 47.4 – 1.1 – 0.7 0.4 20.8 76.9
V-V 0.2 – 68.7 16.4 – – – 0.2 – 14.4 85.3
Total 1.4 1.7 39.6 32.7 0.5 1.8 0.1 2.4 1.3 18.3 75.4
Females
I-I 2.5 0.2 34.8 38.7 – 1.1 0.9 0.4 0.2 21.1 76.2
II-II 5.6 6.5 17.8 34.6 2.0 3.6 0.2 11.0 7.2 11.5 64.5
III-III 4.7 – 57.5 13.9 0.2 6.0 0.2 2.2 0.2 14.8 76.1
IV-IV 1.3 – 32.8 41.6 – 2.3 – 0.9 0.9 20.2 75.7
V-V 0.7 – 72.4 14.6 – 0.4 – – – 11.9 87.7
Total 3.0 1.3 43.1 28.7 0.4 2.7 0.3 2.9 1.7 15.9 76.1

81Dermatoglyphic sexual dimorphism
Frequency of individuals with the same pattern on all ten fingers was 7.9%in men (4.9% with W and 3.0% with UL) and 9.4% in women (3.6% with W and 5.8% with UL). Higher values were observed in North African Jews (10.5% in men and 9.7% in women; (Kobyliansky and Micle, 1988) and East European Jews (8.9% in men and 12.0% in women) (Kobyliansky and Micle, 1988) and East European Jews (8.9% in men and 12.0% in women).Table 3.1. Frequency of pattern type combinations on the ten fingers; control group.
Shannon measures distributed similarly in the two sexes (Table 4.1). Within the range of low measures (0.000–0.611), the women (of the present study) displayed a lower frequency (50%) than did Jewish women from North Africa (54.8%), from the Middle East (55.0%) or from East Europe (53.6%) (Kobylian-sky and Micle, 1987, 1988, 1989).
Pattern intensity index (PII) revealed values of 13.98 and 13.29 in men and women respectively (Table 5.1). Other Jewish samples also yielded higher val-ues in men (13.16–14.40) than in women (12.67–13.42) (Cummins and Midlo, 1927; Sachs and Bat-Miriam, 1957; Bat-Miriam Katznelson and Ashbel, 1973; Dar and Winter, 1970; Pereira et al., 1977; Bejerano, 1986; Kobyliansky and Micle, 1987, 1988, 1989). Greater left-right differences were encountered in men,while higher right hand values were found in both sexes. A similar trend was reputed by Cummins and Midlo (1943, 1961), Kobyliansky et al. (1979) and Ko-byliansky and Micle (1987, 1988, 1989). Significant differences between the sexeswere detected for the right hand measures, as well as for the indices of the two hands combined (Table 19.1).
Ridge counts of the patterns and fingers – the pattern with the highest num-ber of ridges was W (Tables 6.1 and 7.1), as also found in other Jewish groups (Cummins and Midlo, 1927; Sachs and Bat-Miriam, 1957; Dar and Winter, 1970; Bat-Miriam Katznelson and Ashbel, 1973; Pereira et al., 1977; Bejerano, 1986; Kobyliansky and Micle, 1987, 1988, 1989).
Pattern presentMales Females
N % N %
W only 21 4.9 16 3.6
UL only 13 3.0 26 5.8
UL + W 241 56.3 223 50.1
UL + A 16 3.7 17 3.8
UL + RL 25 5.8 24 5.4
UL + A + W 16 3.7 33 7.4
UL + RL + W 73 17.0 70 15.7
UL + RL + A 6 1.4 12 2.7
UL + RL + A + W 16 3.7 21 4.7
RL + W 1 0.2 1 0.2
RL + A + W – – 1 0.2
A only – – 1 0.2
Total 428 100.0 445 100.0

82 Eugene Kobyliansky et al.
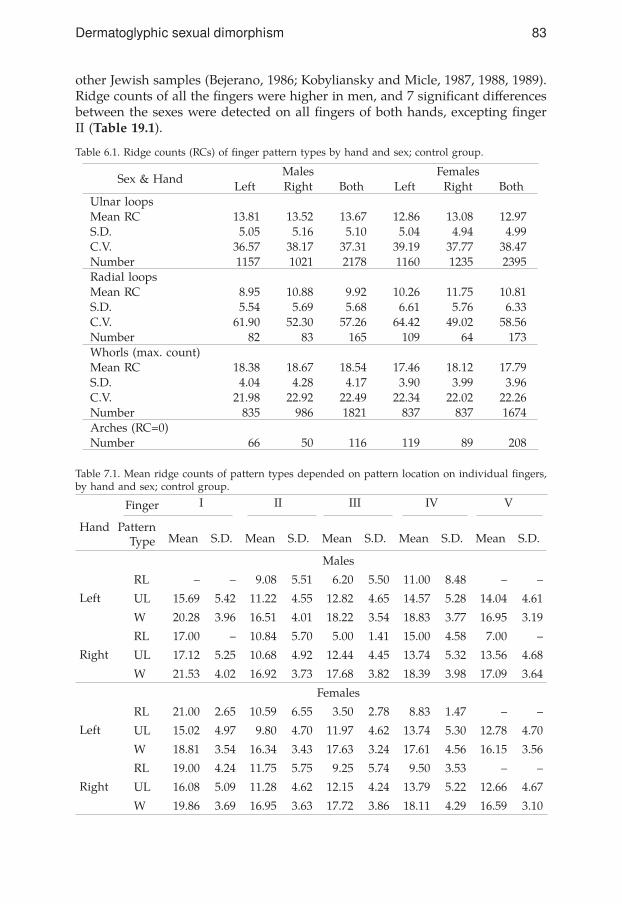
Higher ridge counts were encountered in men in connection with patterns W and UL, and in women, in connection with RL. The same trait was observed in East European Jews. In previous studies on North African Jews, the ridge counts in all the patterns were higher in men than in women (Kobyliansky and Micle, 1988, 1989). We found that the higher the ridge counts, the lower their coefficients of variance (C.V.), (Tables 6.1 and 8.1). Ridge counts of fingerI were the highest in all the patterns and this in both hands and both sexes, to be followed by the ridge counts of fingers IV and V. The lowest ridge count wasobserved in finger II in men and in finger II in women, as was also the case in
Table 4.1. The Shannon information measure derived from the finger pattern frequencies in eachindividual; control group. Individuals’ frequencies.
ShannonMeasure
Males Females
N % N %
.000 34 7.9 43 9.7
.325 53 12.4 48 10.8
.500 68 15.9 76 17.1
.611 64 15.0 55 12.4
.639 7 1.6 15 3.4
.673 73 17.1 58 13.0
.693 25 5.8 28 6.3
.802 26 6.1 45 10.1
.898 19 4.4 19 4.3
.940 3 0.7 2 0.4
.943 22 5.1 14 3.1
.950 9 2.1 7 1.6
1.030 11 2.6 10 2.2
1.055 1 0.2 6 1.3
1.089 4 0.9 5 1.1
1.168 1 0.2 2 0.4
1.194 1 0.2 – –
1.221 2 0.5 7 1.6
1.280 4 0.9 4 0.9
1.332 1 0.2 1 0.2
Total 428 100.0 445 100.0
Table 5.1. Pattern intensity index; control group.
HandMales Females
Mean S.D. C.V. Mean S.D. C.V.
Left 6.80 1.79 26.27 6.61 1.94 29.34
Right 7.19 1.82 25.35 6.68 1.85 27.68
Both 13.98 3.40 24.29 13.29 3.62 27.22
83Dermatoglyphic sexual dimorphism
other Jewish samples (Bejerano, 1986; Kobyliansky and Micle, 1987, 1988, 1989). Ridge counts of all the fingers were higher in men, and 7 significant differencesbetween the sexes were detected on all fingers of both hands, excepting fingerII (Table 19.1).
Table 6.1. Ridge counts (RCs) of finger pattern types by hand and sex; control group.
Table 7.1. Mean ridge counts of pattern types depended on pattern location on individual fingers,by hand and sex; control group.
Sex & HandMales Females
Left Right Both Left Right BothUlnar loopsMean RC 13.81 13.52 13.67 12.86 13.08 12.97S.D. 5.05 5.16 5.10 5.04 4.94 4.99C.V. 36.57 38.17 37.31 39.19 37.77 38.47Number 1157 1021 2178 1160 1235 2395Radial loopsMean RC 8.95 10.88 9.92 10.26 11.75 10.81S.D. 5.54 5.69 5.68 6.61 5.76 6.33C.V. 61.90 52.30 57.26 64.42 49.02 58.56Number 82 83 165 109 64 173Whorls (max. count)Mean RC 18.38 18.67 18.54 17.46 18.12 17.79S.D. 4.04 4.28 4.17 3.90 3.99 3.96C.V. 21.98 22.92 22.49 22.34 22.02 22.26Number 835 986 1821 837 837 1674Arches (RC=0)Number 66 50 116 119 89 208
Finger
Hand PatternType
I II III IV V
Mean S.D. Mean S.D. Mean S.D. Mean S.D. Mean S.D.
Left
Males
RL – – 9.08 5.51 6.20 5.50 11.00 8.48 – –
UL 15.69 5.42 11.22 4.55 12.82 4.65 14.57 5.28 14.04 4.61
Right
W 20.28 3.96 16.51 4.01 18.22 3.54 18.83 3.77 16.95 3.19
RL 17.00 – 10.84 5.70 5.00 1.41 15.00 4.58 7.00 –
UL 17.12 5.25 10.68 4.92 12.44 4.45 13.74 5.32 13.56 4.68
W 21.53 4.02 16.92 3.73 17.68 3.82 18.39 3.98 17.09 3.64
Left
Females
RL 21.00 2.65 10.59 6.55 3.50 2.78 8.83 1.47 – –
UL 15.02 4.97 9.80 4.70 11.97 4.62 13.74 5.30 12.78 4.70
Right
W 18.81 3.54 16.34 3.43 17.63 3.24 17.61 4.56 16.15 3.56
RL 19.00 4.24 11.75 5.75 9.25 5.74 9.50 3.53 – –
UL 16.08 5.09 11.28 4.62 12.15 4.24 13.79 5.22 12.66 4.67
W 19.86 3.69 16.95 3.63 17.72 3.86 18.11 4.29 16.59 3.10

84 Eugene Kobyliansky et al.
Table 8.1. Ridge counts of individual fingers, by sex and hand; control group.
Total ridge count was significantly higher in men (152.27) than in women(140.93) (Tables 9.1, 19.1a). This difference of 11.34 ridges between the sexescreated a sexual dimorphism index of 0.04, basing on Schwidetzky and Jantz (1979) where: (m–f) : (m+f) = 11.34 : 293.2 = 0.04.
In a previous study on North African Jews, a similar value of 0.0483 was obtained (Kobyliansky and Micle, 1988) while the equivalent value in East Eu-ropean Jews was higher, being 0.0774 (Kobyliansky and Micle, 1989). The RC values were higher in the right hand and the coefficients of variance (C.V.)lower. The overall C.V. values were higher in women.
Table 9.1. Ridge counts of left, right and both hands; control group.
Absolute Ridge Count (ARC) was significantly different between the sexes,being 207.47 and 186.15 in males and females, respectively (Table 22.1). Coef-ficients of correlation for finger ridge counts ranged between 0.367–0.816 in men and between 0.385–0.820 in women (Table 10.1). Higher correlations were found in women (31.1% of the correlations above 0.650 vs 13.3% in men), espe-cially between finger pairs in the two hands (higher symmetry). In both sexes,the highest coefficients of correlation pertain to pairs of homologous fingers,to be followed by those between ‘neighboring’ fingers: II and III, III and IV, IVand V, or between such pairs in both hands (e.g. II left and III right). The ridge counts of finger I have the least correlation with the remaining fingers exertingits homologous finger I. These findings were similar to those reported in otherinvestigations (Holt, 1959, 1968; Mavalwala, 1962; Singh, 1968; Micle et al., 1978; Kobyliansky and Micle, 1987, 1988, 1989).
Left hand Right hand Both hands (TRC)
Sex Mean S.D. C.V. Mean S.D. C.V. Mean S.D. C.V.
Males 74.91 21.54 28.76 77.36 20.29 27.09 152.27 41.54 27.28
Females 68.86 23.27 33.80 72.08 22.01 30.54 140.93 44.50 31.57
FingerLeft hand Right hand Both hands
Mean S.D. C.V. Mean S.D. C.V. Mean S.D. C.V.
Males
I 17.73 5.65 31.84 19.76 5.17 26.16 18.74 5.50 29.35
II 12.60 6.17 48.96 13.15 6.28 47.78 12.88 6.23 48.37
III 13.38 6.06 45.26 13.39 5.54 41.40 13.38 5.80 43.35
IV 16.63 5.36 32.22 16.56 5.20 31.39 16.59 5.27 31.77
V 14.57 4.57 31.36 14.50 4.74 32.70 14.53 4.65 32.00
Females
I 16.27 5.69 34.99 17.57 5.61 31.91 16.92 5.68 33.57
II 12.02 6.52 54.24 12.87 6.28 48.81 12.44 6.41 51.53
III 11.97 6.31 52.72 12.48 5.56 44.57 12.22 5.95 48.69
IV 15.24 5.86 38.47 15.80 5.63 35.65 15.52 5.75 37.05
V 13.37 4.84 36.18 13.34 4.82 36.11 13.36 4.82 36.08

85Dermatoglyphic sexual dimorphism
Table 10.1. Correlation coefficients of finger ridge counts by sex and hand; control group.
Males – above and left of the diagonal.Females – below and right of the diagonal.
b. Palms
Palm Patterns – in the hypothenar and interdigital regions III and IV there are numerous patterns, as compared to a paucity of patterns in the thenar and inter-digital region II (Table 11.1). In individuals having a pattern only in one hand, there is preference for particular regions. Thus, in the thenar and interdigital region IV, there are more patterns in the left hand, while in interdigital regions II and III there are more patterns in the right hand. Such bilateral differenceswere encountered in additional Jewish groups (Micle et al., 1982; Bejerano, 1986; Micle and Kobyliansky, 1987; Kobyliansky and Micle, 1987, 1988, 1989). Statisti-cally significant difference between the sexes was detected with regard to thehypothenar and also with the frequency of individuals showing patterns in both hands (32.0% in women and 23.7% in men – Table 22.1). This held true also in East European Jews, but in Jews of North Africa and the Middle East, there were more men with patterns in the hypothenar (Kobyliansky and Micle, 1987, 1988, 1989). In all palmar regions, the bilateral symmetry was higher in women and the intersex difference ranged from 1.8% for the hypothenar to 6.3% for the interdigi-tal region IV (the difference between the sexes being significant – Table 22.1).
Presence of additional (accessory) triradii and the absence of triradius c additional or accessory triradii are frequent in interdigital regions IV (d’) and II (a’), where 27.2% of men and 24.9% of women have d’, while 12.2% of men and 6.7% of women have a’. As for c’, it appears in low frequency, while b’ does not show up at all (Table 12.1). a’ is more frequent on the right hand and d’ – on the left hand. The symmetry is higher in women than in men (with smaller differences between the two hands). The absence of triradius c is more frequentin women than men (7.6% vs 6.6%) and more frequent in the left than right hand (3.8% in men vs 1.6% in women on the left hand, and 3.8% in men vs 1.1% in women on the right hand). Similar trends were discerned in other Jewish
FingerLeft hand Right hand
V IV III II I V IV III II I
I .376 .376 .373 .400 .730 .391 .454 .415 .406 –
II .481 .585 .617 .741 .447 .458 .612 .607 – .414
III .475 .651 .745 .616 .434 .466 .641 – .687 .399
IV .599 .816 .625 .545 .441 .570 – .684 .605 .432
V .723 .544 .454 .475 .367 – .602 .510 .525 .387
I .388 .424 .436 .398 – .385 .421 .385 .418 .777
II .430 .525 .643 – .446 .531 .610 .673 .774 .419
III .482 .645 – .693 .419 .534 .689 .816 .679 .435
IV .598 – .690 .623 .398 .658 .813 .676 .623 .407
V – .647 .522 .500 .433 .820 .568 .489 .522 .417

86 Eugene Kobyliansky et al.
groups, where men showed values of 2.2–6.6% on the left hand vs 0.0–1.1% on the right hand, while women showed 1.6–5.9% on the left hand and 0.0–4.0% on the right hand (Micle et al., 1982; Kobyliansky and Micle, 1987, 1988, 1989).
Table 11.1. Percent distribution of palmar patterns in males (M) and females (F); control group.
Table 12.1. Percentage frequencies of uncommon patterns of subdigital triradii in males (M) and females (F); control group.
Percent distribution of Sydney and Simian lines
Simian line and Sydney line – the Simian line was more prevalent in men (2.8%) than in women (2.1%). Contrariwise, the Sydney line was more frequent in wom-en (8.4%) than in men (4.2%). The differences were statistically significant (Tables 12.1 and 22.1). Significant left-right differences were not encountered, neither inmen nor in women, but the Sydney line was more frequent on the right hand, while the Simian line was more frequent on the left hand in women.
Main hand line index (MLI) was 8.96 in women and 8.79 in men (Table 13.1). The index was higher on the right hand, re‚ecting a transverse orientation ofthe main lines. The same trend was reported also in other investigations (Cum-
Presence of accessory triradii Absence ofc triradiusa` b` c` d`
Hand M F M F M F M F M F
On left hand only 1.6 0.4 – – 0.7 0.7 13.1 12.1 3.8 3.8
On right hand only 8.0 3.6 – – 0.7 1.1 3.5 5.4 1.6 1.1
On both hands 2.6 2.7 – – 0.2 – 10.6 7.4 1.2 2.7
Indiv. with trait 12.2 6.7 – – 1.6 1.8 27.2 24.9 6.6 7.6
Hands with trait 7.4 4.7 – – 0.9 0.9 18.9 16.2 3.9 5.2
Patternlocalization
Hypothenar ThenarInterdigital
II III IV
M F M F M F M F M F
On both palms:
Absent 50.6 48.6 78.3 84.8 86.8 92.9 23.4 27.9 32.8 34.7
Present 23.7 32.0 10.8 7.3 4.0 2.7 48.9 47.6 37.0 38.0
Same pattern 16.1 19.9 6.7 5.3 2.6 2.7 30.9 31.9 30.7 35.1
Different pattern 7.6 12.1 4.1 2.0 1.4 – 18.0 15.7 6.3 2.9
Bilateral symmetry 66.7 68.5 85.0 90.1 89.4 95.6 54.3 59.8 63.5 69.8
Pattern only on:
Left palm 12.9 9.5 9.3 5.5 1.9 0.2 5.1 8.1 24.8 19.5
Right palm 12.8 9.9 1.6 2.4 7.3 4.2 22.6 16.4 5.4 7.8
Left hand Right hand Both hands
M F M F M F
Sydney 4.2 7.8 4.2 9.0 4.2 8.4
Simian 2.8 2.9 2.8 1.3 2.8 2.1
87Dermatoglyphic sexual dimorphism
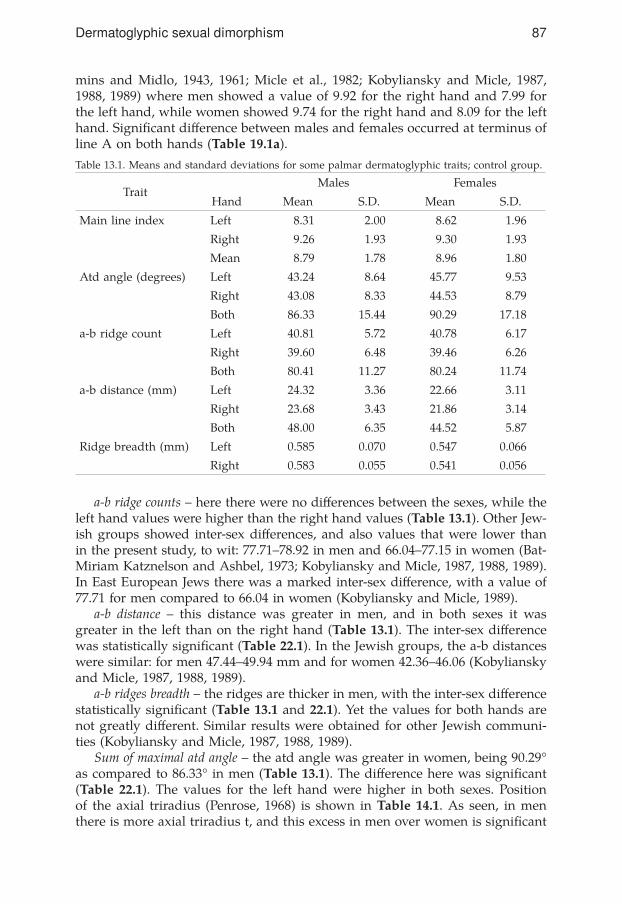
mins and Midlo, 1943, 1961; Micle et al., 1982; Kobyliansky and Micle, 1987, 1988, 1989) where men showed a value of 9.92 for the right hand and 7.99 for the left hand, while women showed 9.74 for the right hand and 8.09 for the left hand. Significant difference between males and females occurred at terminus ofline A on both hands (Table 19.1a).
Table 13.1. Means and standard deviations for some palmar dermatoglyphic traits; control group.
a-b ridge counts – here there were no differences between the sexes, while theleft hand values were higher than the right hand values (Table 13.1). Other Jew-ish groups showed inter-sex differences, and also values that were lower thanin the present study, to wit: 77.71–78.92 in men and 66.04–77.15 in women (Bat-Miriam Katznelson and Ashbel, 1973; Kobyliansky and Micle, 1987, 1988, 1989). In East European Jews there was a marked inter-sex difference, with a value of77.71 for men compared to 66.04 in women (Kobyliansky and Micle, 1989).
a-b distance – this distance was greater in men, and in both sexes it was greater in the left than on the right hand (Table 13.1). The inter-sex differencewas statistically significant (Table 22.1). In the Jewish groups, the a-b distances were similar: for men 47.44–49.94 mm and for women 42.36–46.06 (Kobyliansky and Micle, 1987, 1988, 1989).
a-b ridges breadth – the ridges are thicker in men, with the inter-sex differencestatistically significant (Table 13.1 and 22.1). Yet the values for both hands are not greatly different. Similar results were obtained for other Jewish communi-ties (Kobyliansky and Micle, 1987, 1988, 1989).
Sum of maximal atd angle – the atd angle was greater in women, being 90.29° as compared to 86.33° in men (Table 13.1). The difference here was significant(Table 22.1). The values for the left hand were higher in both sexes. Position of the axial triradius (Penrose, 1968) is shown in Table 14.1. As seen, in men there is more axial triradius t, and this excess in men over women is significant
TraitMales Females
Hand Mean S.D. Mean S.D.
Main line index Left 8.31 2.00 8.62 1.96
Right 9.26 1.93 9.30 1.93
Mean 8.79 1.78 8.96 1.80
Atd angle (degrees) Left 43.24 8.64 45.77 9.53
Right 43.08 8.33 44.53 8.79
Both 86.33 15.44 90.29 17.18
a-b ridge count Left 40.81 5.72 40.78 6.17
Right 39.60 6.48 39.46 6.26
Both 80.41 11.27 80.24 11.74
a-b distance (mm) Left 24.32 3.36 22.66 3.11
Right 23.68 3.43 21.86 3.14
Both 48.00 6.35 44.52 5.87
Ridge breadth (mm) Left 0.585 0.070 0.547 0.066
Right 0.583 0.055 0.541 0.056

88 Eugene Kobyliansky et al.
(Table 22.1). Contrariwise, in women, there was more t’ and t’’, which account-ed for the high value of the angle. The data from other Jewish communities are similar, excepting the Jews from the Middle East, who showed higher values in women (Kobyliansky and Micle, 1987).
Table 14.1. Percent distribution of the highest positions of axial triradius t in males (M) and females (F); control group.
Classification is according to Penrose (1968). t if atd angle ²45°; t’ if atd angle = 45.01°–56°; t” if atd angle >56.01°.
For multivariate analysis and for comparison between quantitative traits, between traits fitted to describe discrete traits, and between indices of diversityand directional or ‚uctuating asymmetry (for variables not dependent on ageof examinees), we employed a number of methods. Thus, to reduce the number of dermatoglyphic variables and to detect correlations between the variables of each of the groups, we carried out a principal component analysis (PCA). Another method for describing the connections between the variables of each group is cluster analysis.
Principal Component Analysis (PCA) – is a mathematical method designed to simplify complex variable systems into a smaller number of size dimen-sions. The components (factors) which are obtained in such an analysis possess a common content (biological denominator) for all the traits which comprise them (since they represent the same portion of the observed variance). Sepa-rate PCA is performed for men and women, removing primary independent components. The order of component removal re‚ects descending values of thepercentages of general variability accounted for by them. The initial analysis encompassed 22 quantitative traits (see paragraph on research methods in the “Introduction”), but then we removed 5 components for men and 4 components for women (Table 15.1). These components accounted for 77.13% of the total variance in men and 75.38% of the variance in women. Micle and Kobyliansky (1991) obtained lower percentages of variance, specifically 73.76% in men and73.39% in women (per 4 components in both sexes). The first component in the two sexes includes high loading for the finger ridge counts, the variables com-puted according to them, and the pattern intensity index (PII). The loadings for the finger ridge counts in men increase in the following order: II>III>IV,while the loadings of finger ridge counts for fingers V and I are smaller. Thehigh loadings of PII in men and ABS.RC in women point to high correlation between their finger ridge counts. The second component includes in men high loadings for ridge counts in fingers IV and V, and in women – the main handline variables. The third component in men includes the main hand lines and in women – the ridge counts a-b for both hands and negative loadings for the end points of line A and MLI. The fourth component in men includes the ridge
Highest positionLeft hand Right hand Both hands
M F M F M F
t 73.8 62.0 71.5 65.8 72.7 63.9
t’ 19.2 26.3 21.7 25.8 20.5 26.1
t” 6.8 11.7 6.8 8.3 6.8 10.0

89Dermatoglyphic sexual dimorphism
counts a-b, and in women – the ridge count of finger I in both hands. The fifthcomponent occurs in men only, and contains high loadings for the ridge counts of finger I. Thus, four of the five components are similar in the two sexes, exceptfor the second component in men, which includes the ridge counts of fingers IVand V on both hands and indicates a weak correlation between them and the other finger ridge counts.
Table 15.1. Rotated factor loadings – 22 quantitative dermatoglyphic traits.
In an analysis based on 42 measures of diversity and asymmetry (see para-graph “research methods” in the Introduction), 10 components were isolated from both sexes, for which we found that the accumulating percentage of vari-ance explained by them was 70.98% in men and 70.40% in women (Table 16.1.1 and 16.1.2). Micle and Kobyliansky (1991) obtained a similar result: 69.98% in
MalesFactor
FemalesFactor
Trait I II III IV V Trait I II III IV
PII .93 – – – – Abs.RC .94 – – –
PII lh .89 – – – – TRC .93 – – .31
PII rh .87 – – – – PII .88 – – –
Abs.RC .83 .43 – – .26 FRC,III-l .85 – – –
FRC,II-r .78 .26 – – – PII rh .85 – – –
FRC,II-l .76 .25 – – – FRC,III-r .84 – – –
TRC .70 .60 – – .36 FRC,IV-l .84 – – –
FRC,III-l .68 .42 – – – PII lh .83 – – –
FRC,III-r .66 .44 – – – FRC,II-r .83 – – –
FRC,V-l .32 .76 – – – FRC,IV-r .82 – – –
FRC,V-r .32 .73 – – – FRC,II-l .82 – – –
FRC,IV-l .51 .70 – – – FRC,V-r .72 – – –
FRC,IV-r .50 .69 – – – FRC,V-l .69 – – .28
MLI – – .96 –.26 – MLI – .96 –.28 –
D line,lh – – .84 – – D line,rh – .85 – –
D line,rh – – .82 – – D line,lh – .84 – –
a-b RC,rh – – – .88 – a-b RC,rh – – .87 –
a-b RC,lh – – – .82 – a-b RC,lh – – .86 –
A line,rh – – .53 –.62 – A line,lh – .48 –.65 –
A line,lh – – .54 – – A line,rh – .53 –.61 –
FRC, I-r .25 .26 – – .86 FRC,I-l .41 – – .82
FRC, I-l .36 – – – .80 FRC,I-r .41 – – .81
V.P. 6.61 3.36 2.89 2.28 1.83 V.P. 9.43 2.90 2.45 1.80
Cum.var. 43.55 59.19 67.18 72.53 77.13 Cum.var. 45.93 62.28 70.22 75.38Loadings values below 0.25 are omitted. The V.P. is the variance explained by each factor. Cum. var. is the cumulative proportion of explained variance.
90 Eugene Kobyliansky et al.
men and 70.06% in women. The first components represented in both sexes 10 indices of intraindividual diversity of the finger ridge counts (of which 4 were associated with all the fingers and the remaining 6 – with single handsleft/right). A second component in both sexes included high loadings for 3 indices of directional asymmetry (variance of the finger ridge counts in the right and left hand: I, V, VI, DAS). Indices of ‚uctuating asymmetry paralleling these appeared in the third component of both sexes. The fourth component in both sexes contained high loadings for the indices of ‚uctuating asymmetry: inmen FLAs IV (finger ridge count in both hands) and FLAs XI (ridge counts onfinger IV), and in women FLAs, IV, X, XI (ridge counts of both hands and offingers III and V). The fifth component contained in both sexes two indices of directional asymmetry, namely, DAS IV in high loading (finger ridge counts in both hands and DAs II in low loading (PII). A sixth component in women and a seventh in men, contained high loadings for directional asymmetry indices of the a-b region: distance – DAs VIII and ridge count – DAs III. A seventh component in women and a ninth component in men contained high loadings for ‚uctuating asymmetry indices of the a-b region (FLAs IV – ridge breadth, FLAs III, FLAs VIII). An eighth component in women and a tenth component in men, contained a directional asymmetry index (DAs IX) for breadth of ridges in the a-b region (The women also showed a corresponding, ‚uctuating asym-metry index at a lower loading). A ninth component in women and an eighth component in men contained an index of directional asymmetry (in men: also a corresponding index of directional asymmetry) for ridge counts of finger I (DAs XIV). A tenth component in women and a sixth component in men con-tained asymmetry indices of the atd angle (FLAs and DAs VII).
Cluster analysis
This analysis is founded on principles similar to PCA. Each variable is a single branch, and the variables with the highest intercorrelation form a common cluster. In the dendrograms (cluster trees) presented in Figs. 17.1a and 17.1b (numeration of figures was made as a continuation of the table’s numeration),as based on 22 quantitative traits, one can discern three primary clusters. The first cluster is broad and binds together finger ridge counts, TRC, AbsRC and PII. Traits whose variance was explained in component 1 of PCA (in men, ad-ditionally, traits whose variance was explained in component 2) appear at the margins of the cluster. Ridge counts of fingers I and V in both sexes, delimit thecluster on both sides and form for men lower correlations than in women (0.71 vs 0.78). The second cluster is narrower and binds together the five variablesof the primary hand lines, while the third cluster binds together two variables, namely, ridge counts a-b in both hands. The second and third clusters inter-change in the two sexes. Thus, in men the middle cluster contains the main hand lines indices and correlates positively with first cluster (0.04), whereasin women the corresponding correlation is negative (–0.14). Contrariwise, in women, the middle cluster contains the variables of the ridge counts a-b and
91Dermatoglyphic sexual dimorphism
forms a correlation of 0.00 with the cluster of finger ridge counts, while in menthe corresponding correlation is negative (–0.10). The dendrograms (cluster trees) basing on 42 indices of variance and asymmetry are given in Figs. 18.1a and 18.1b. A first cluster in both sexes binds together the 10 intraindividual diversity indices of the finger ridge counts into three sub-clusters, namely, the left hand indices (Div I, IV, VII), the right hand indices (Div II, V, VIII) and the indices of the ten fingers (Div III, VI, IX, X). The correlations between thediversity indices are higher in women than in men (0.82 vs 0.74).
These indices were found in high loadings in component 1 of the PCA. Three of the indices of directional asymmetry in finger ridge counts (DAs I, V,VI) appear together in a separate small cluster (in a correlation of 0.96 for both sexes) and conjoin by negative correlation into a dendrogram – thus –0.06 for men and –0.16 for women. (In PCA, they appear in high loadings in component 2). Another small cluster with high correlations (0.94 in both sexes) contains the indices of ‚uctuating asymmetry for finger ridge counts which appeared incomponent 3 in both sexes (FLAs I, V, VI).
The indices of ‚uctuating asymmetry for finger ridge counts are aggregatedin the heart of the dendrogram (FLAs XI, XII, XIII, XIV) excepting the fingerV index for women (FLAs X) which is more distanced; they include FLAs XVI (overall index of the ‚uctuating asymmetry) and Shannon’s index (Div XI). Sep-arate clusters bind together the indices of the MLI asymmetry, namely, DAs and FLAs XV (with correlations close to zero between the indices), and the indices of asymmetry in the a-b region, namely, FLAs and DAs III, VIII, IX. Indices of distance and a-b ridge counts appear together in common cluster (FLAs and DAs III, VIII), with breadth of the ridges (FLAs and DAs IX) at some distance from them–an arrangement which conforms with their appearance in the PCA components Micle and Kobyliansky (1991) obtained similar cluster patterns.
Comparison of 22 quantitative traits in the two sexes via ANOVA
In this comparison only traits not dependent on age of subjects were used. A total of 14 significant differences were found between the sexes for all ofwhich, excepting the terminal joint of line A in both hands, the values in men were higher (Table 19.1a). Micle and Kobyliansky (1991) reported 18 significantdifferences between the sexes, the additional significant differences pertainingto ridge counts on finger II in both hands, the PII in the left hand and the ridgecounts in the a-b region in both hands, whereas the terminations of line A in the right hand was not significantly different; in their study, like in the pres-ent one, for all the traits barring the main hand lines, the values in men were higher than in women. In the present study, the traits differing significantlybetween the sexes arrange in PCA as follows: the finger ridge counts occur incomponents 1 and 4 in women, as compared to components 1, 2 and 5 in men (for component 2 in men there are ridge counts of fingers IV and V, while forcomponent 4 in women and 5 in men, there are ridge counts of finger I). In the
92 Eugene Kobyliansky et al.
cluster trees of both sexes, the ridge count of finger I was found at the marginsof the first cluster, forming with it a low correlation (0.58 in men and 0.56 inwomen) as compared to that of the other fingers. The variables of the mainhand lines were found in component 2 in women and component 3 in men. The quantitative traits showing significant differences between the sexes arrange invarious components in PCA and in different clusters.
In a comparison of 11 indices of intraindividual diversity; (for details see Appendix 1a, b and 2) we found significant inter-sex difference for the vari-able Div III (difference between maximal and minimal ridge counts in fingersof both hands – Table 19.1b). All the indices of diversity were found higher in men, as also obtained by Micle and Kobyliansky (1991), but in the present study the indices for the two sexes were higher than those reported by Micle and Kobyliansky (1991). The indices of diversity were observed in high load-ings in component 1 in the PCA (Tables 16.1.1 and 16.1.2), and formed in the dendrogram a separate cluster with correlations of 0.75 in men and 0.81 in women (Fig. 18.1.a and Fig. 18.1.b). The indices of intra-individual diversity of both hands are more similar in women than in men.
In men, however, the asymmetry is greater, while the right hand values are high and display a greater diversity. Similar results were obtained with samples of Jews from East Europe and North Africa. In the sample of Middle East Jews, no differences between the sexes were encountered (Kobyliansky and Micle,1987, 1988, 1989).
In a comparison of 16 indices of ‚uctuating asymmetry (p<0.05; Table 19.1.b) we found 6 significant differences between the sexes. In 4 of these, the malevalues were higher (FLAs I, II, XV, XVI, variance in finger ridge counts, PII,MLI and the index of overall asymmetry in finger ridge counts), but in 2, thefemale values were higher, namely, in FLAs XI and IX (indices of ridge breadth and ridge counts of finger V). Micle and Kobyliansky (1991) found significantdifferences between the sexes in 10 out of 16 traits, and in 8 of these the valueswere higher in women, which differs from the present findings, where 10 of the‚uctuating asymmetry indices were higher in men. The indices which differedsignificantly between the sexes are located in PCA in components 1, 3, 4 and9 in men and components 3, 4 and 8 in women (Tables 16.1.1 and 16.1.2). In the dendrograms these indices were found in different clusters with lowcorrelations between them (Figs. 18.1.a and 18.1.b).
In our comparison of 15 indices of directional asymmetry (p<0.05; Table 19.1.c), we observed three significant differences between men and women, namely, inPII, atd and MLI (DAs II, VII, XV), all of which were higher in men. The indices are located in the PCA within component 5 for men and within components 5 and 10 for women (Tables 16.1.1 and 16.1.2); they occur in separate clusters and are distanced within the cluster trees (the correlations between the three indices are lower in women – Fig. 18.1.a and Fig. 18.1.b). Micle and Kobyliansky (1991) found 7/15 of the indices with significant differences between the sexes,of which two were higher in men and the other 5 in women.
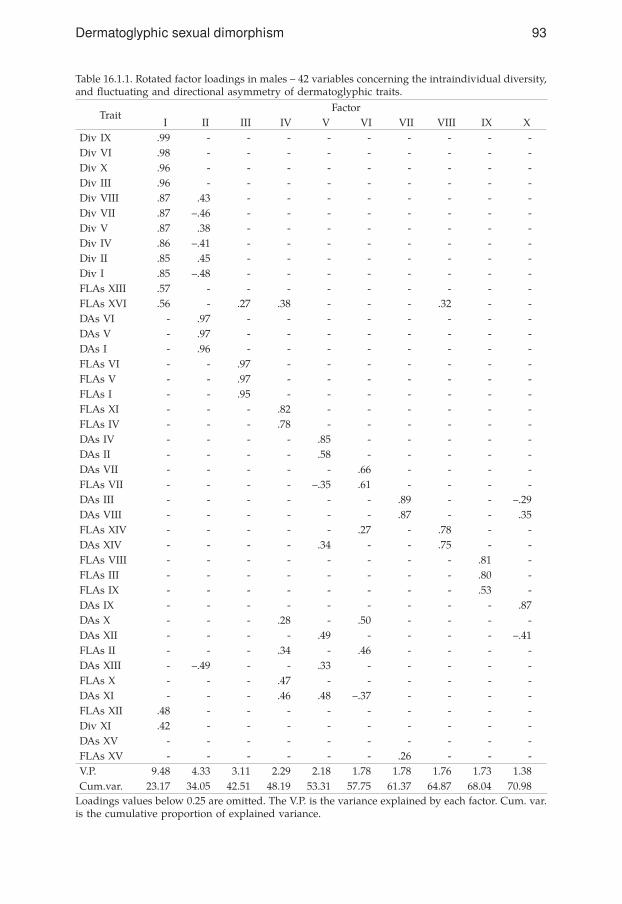
93Dermatoglyphic sexual dimorphism
Table 16.1.1. Rotated factor loadings in males – 42 variables concerning the intraindividual diversity, and ‚uctuating and directional asymmetry of dermatoglyphic traits.
TraitFactor
I II III IV V VI VII VIII IX XDiv IX .99 - - - - - - - - -Div VI .98 - - - - - - - - -Div X .96 - - - - - - - - -Div III .96 - - - - - - - - -Div VIII .87 .43 - - - - - - - -Div VII .87 –.46 - - - - - - - -Div V .87 .38 - - - - - - - -Div IV .86 –.41 - - - - - - - -Div II .85 .45 - - - - - - - -Div I .85 –.48 - - - - - - - -FLAs XIII .57 - - - - - - - - -FLAs XVI .56 - .27 .38 - - - .32 - -DAs VI - .97 - - - - - - - -DAs V - .97 - - - - - - - -DAs I - .96 - - - - - - - -FLAs VI - - .97 - - - - - - -FLAs V - - .97 - - - - - - -FLAs I - - .95 - - - - - - -FLAs XI - - - .82 - - - - - -FLAs IV - - - .78 - - - - - -DAs IV - - - - .85 - - - - -DAs II - - - - .58 - - - - -DAs VII - - - - - .66 - - - -FLAs VII - - - - –.35 .61 - - - -DAs III - - - - - - .89 - - –.29DAs VIII - - - - - - .87 - - .35FLAs XIV - - - - - .27 - .78 - -DAs XIV - - - - .34 - - .75 - -FLAs VIII - - - - - - - - .81 -FLAs III - - - - - - - - .80 -FLAs IX - - - - - - - - .53 -DAs IX - - - - - - - - - .87DAs X - - - .28 - .50 - - - -DAs XII - - - - .49 - - - - –.41FLAs II - - - .34 - .46 - - - -DAs XIII - –.49 - - .33 - - - - -FLAs X - - - .47 - - - - - -DAs XI - - - .46 .48 –.37 - - - -FLAs XII .48 - - - - - - - - -Div XI .42 - - - - - - - - -DAs XV - - - - - - - - - -FLAs XV - - - - - - .26 - - -V.P. 9.48 4.33 3.11 2.29 2.18 1.78 1.78 1.76 1.73 1.38Cum.var. 23.17 34.05 42.51 48.19 53.31 57.75 61.37 64.87 68.04 70.98
Loadings values below 0.25 are omitted. The V.P. is the variance explained by each factor. Cum. var. is the cumulative proportion of explained variance.

94 Eugene Kobyliansky et al.
Table 16.1.2. Rotated factor loadings in females – 42 variables concerning the intraindividual diver-sity, and ‚uctuating and directional asymmetry of dermatoglyphic traits.
Loadings values below 0.25 are omitted. The V.P. is the variance explained by each factor. Cum. var. is the cumulative proportion of explained variance.
TraitFactor
I II III IV V VI VII VIII IX XDiv IX .98 - - - - - - - - -Div VI .97 - - - - - - - - -Div X .96 - - - - - - - - -Div III .94 - - - - - - - - -Div VIII .89 .39 - - - - - - - -Div VII .89 –.40 - - - - - - - -Div V .89 .33 - - - - - - - -Div IV .88 –.35 - - - - - - - -Div I .88 –.40 - - - - - - - -Div II .88 .39 - - - - - - - -DAs V - .97 - - - - - - - -DAs VI - .97 - - - - - - - -DAs I - .96 - - - - - - - -FLAs V - - .96 - - - - - - -FLAs VI - - .95 - - - - - - -FLAs I - - .93 - - - - - - -FLAs IV - - - .74 - - - - .27 -FLAs XII .28 - - .59 - - - - - -FLAs X - - - .57 - .27 - - - -DAs XII - –.26 - .53 .34 - - - - -FLAs II - - - .52 –.41 - - .25 - -DAs IV - - - - .88 - - - - -DAs II - - - - .66 - - - - -DAs III - - - - - .89 - .31 - -DAs VIII - - - - - .83 - .34 - -FLAs III - - - - - - .85 - - -FLAs VIII - - - - - - .79 - - -DAs IX - - - - - - - .90 - -FLAs IX - - - - - - .42 .63 - -DAs XIV - - - - .28 - - - .69 -FLAs VII - - - - - - - - - .84DAs VII - - - - - - - - - .81DAs XIII - –.35 - - .27 - - - .36 -FLAs XVI .38 - .34 .45 .38 - - - - -DAs XV - - - - - - - - –.36 -DAs X - - - - .47 - - .28 –.38 -DAs XI - - - - .31 - - - - -FLAs XI - - - .43 - - - - - -Div XI .29 - - .29 - - - - - -FLAs XIII .42 - - .36 - - - - - -FLAs XIV - - - .33 .28 - - - .39 -FLAs XV - - - - - - - - –.36 -V.P. 9.15 3.98 3.13 2.66 2.40 1.95 1.66 1.63 1.51 1.49Cum.var. 23.10 34.32 41.54 47.02 52.03 56.38 60.36 64.18 67.52 70.40

95Dermatoglyphic sexual dimorphism
Fig. 17.1.a. Control males (quantitative traits).
Fig. 17.1.b. Control females (quantitative traits).
AM
ALG
AM
ATIO
N D
ISTAN
CES (r valu
es)
0.00.2
0.40.6
0.81.0 a-b R
C, lh
a-b RC
, rh
ML I
D-line, lh
D-line, rh
A-line, rh
A-line, lh
FRC
, I-rh
FRC
, I-lh
Abs. R
C
TRC
PII
PII, rh
PII, lh
FRC
, II-rh
FRC
, II-lh
FRC
, III-rh
FRC
, III-lh
FRC
, IV-rh
FRC
, IV-lh
FRC
, V-rh
FRC
, V-lh
AM
ALG
AM
ATIO
N D
ISTA
NC
ES (r valu
es)
D-lin
e, lh
ML I
D-lin
e, rh
A-lin
e, rh
A-lin
e, lh
a-b R
C, lh
a-b R
C, rh
FRC
, I-rh
FRC
, I-lhFRC
, II-lh
FRC
, II-rh
Abs. R
C
TBC
PII, rh
PII
PII, lh
FRC
, III-rh
FRC
, III-lh
FRC
, IV-rh
FRC
, IV-lh
FRC
, V-rh
FRC
, V-lh
-0.20.0
0.20.4
0.60.8
1.0

96 Eugene Kobyliansky et al.
Fig. 18.1.a. Control males (diversity & asymmetry).
Fig. 18.1.b. Control females (diversity & asymmetry).
�����
������
�������
��������������
-0.20.0
0.20.4
0.60.8
1.0 DA
s VI
DA
s VD
As I
FLAs X
vD
As X
vFLA
s XFLA
s IVFLA
s IIFLA
s VI
FLAs V
FLAs I
DA
s VII
DA
s VIII
DA
s IIIFLA
VII
FLAs IX
FLAs V
IIIFLA
s IIID
As X
DA
s IXD
As X
IFLA
s XIV
DA
s XIII
DA
s XIV
DA
s XV
DA
s IIFLA
s XII
DA
s XII
FLAs X
ID
1v XI
FLAs X
IIIFLA
s XV
ID
1v VD
1v VIII
D1v II
D1v X
D1v IX
D1v V
ID
1v IIID
1v IVD
1v VII
D1v I
�����
������
�������
�������������� FLA
s VIII
FLAs III
DA
s IXD
As V
ID
As V
DA
s IFLA
s VI
FLAs V
FLAs I
DA
s XFLA
s VII
DA
s VII
DA
s XV
FLAs X
VD
As V
IIID
As III
DA
s XIII
DA
s XII
DA
s XI
DA
s IVD
As II
FLAs X
IVD
As X
IVFLA
s XFLA
s XI
FLAs IV
FLAs II
D1v X
IFLA
s XII
FLAs X
VI
FLAs X
IIID
1v VD
1v VIII
D1v II
D1v X
D1v IX
D1v V
ID
1v IIID
1v IVD
1v VII
D1v I
-0.20.0
0.20.4
0.60.8
1.0 FLAs IX

97Dermatoglyphic sexual dimorphism
TraitMales Females Sex differences
Mean S.D. Mean S.D. F ratio Sign. *(p)
Finger RC, I-r 19.76 5.17 17.55 5.63 35.66 .00
Finger RC, II-r 13.15 6.28 12.85 6.29 0.43 .51
Finger RC, III-r 13.39 5.54 12.48 5.56 5.88 .02
Finger RC, IV-r 16.56 5.20 15.77 5.68 4.27 .04
Finger RC, V-r 14.50 4.74 13.33 4.83 12.71 .00
Finger RC, I-l 17.73 5.64 16.24 5.71 14.50 .00
Finger RC, II-l 12.60 6.17 12.02 6.51 1.85 .17
Finger RC, III-l 13.38 6.06 11.98 6.30 11.33 .00
Finger RC, IV-l 16.63 5.36 15.21 5.87 13.35 .00
Finger RC, V-l 14.57 4.57 13.34 4.87 14.27 .00
Total RC 152.27 41.54 140.77 44.59 15.11 .00
Absolute RC 207.47 81.84 186.15 81.42 14.36 .00
PII, lh 6.80 1.79 6.61 1.94 2.10 .15
PII, rh 7.19 1.82 6.67 1.85 16.57 .00
PII, both h 13.98 3.40 13.28 3.62 8.41 .00
a-b RC, rh 39.60 6.48 39.47 6.25 0.11 .75
a-b RC, lh 40.81 5.72 40.77 6.17 0.00 .95
A-line exit l 4.22 0.93 4.46 0.81 16.28 .00
A-line exit r 4.48 0.85 4.58 0.75 3.77 .05
D-line exit l 4.09 1.50 4.16 1.60 0.48 .49
D-line exit r 4.78 1.49 4.71 1.54 0.38 .54
Main line index 8.79 1.78 8.96 1.79 2.07 .15
Table 19.1.a. Comparison of 22 quantitative traits and indices in control group of males and females, by ANOVA method.
* The differences are statistically significant when p<.05.

98 Eugene Kobyliansky et al.
Table 19.1.b. Comparison of indices of diversity and of ‚uctuating asymmetry in control group ofmales and females, by Kruskal-Wallis method.
TraitMean values Mean ranks
χ2Males Females Males Females Sign.*(p)
Div I 9.93 9.69 442.07 432.12 0.34 .56
Div II 10.52 9.95 450.90 423.63 2.56 .11
Div III 12.78 11.98 454.16 420.50 3.91 .05
Div IV 81.88 79.01 439.97 434.14 0.12 .73
Div V 88.64 79.07 453.29 421.33 3.50 .06
Div VI 179.24 166.35 448.15 426.28 1.64 .20
Div VII 3.61 3.56 439.97 434.14 0.12 .73
Div VIII 3.81 3.58 453.29 421.33 3.50 .06
Div IX 3.90 3.75 448.15 426.28 1.64 .20
Div X 6.73 6.49 447.88 426.53 1.56 .21
Div XI 0.61 0.61 435.79 438.16 0.02 .89
FlAs I 39.25 35.43 458.80 416.04 6.28 .01
FlAs II 14.04 13.02 473.73 401.68 18.13 .00
FlAs III 8.78 8.55 435.38 438.56 0.04 .85
FlAs IV 11.48 11.98 426.86 446.76 1.36 .24
FlAs V 68.08 63.36 452.14 422.44 3.03 .08
FlAs VI 37.40 34.87 452.54 422.06 3.19 .07
FlAs VII 8.96 8.21 439.46 434.63 0.08 .78
FlAs VIII 7.68 7.29 449.79 424.70 2.16 .14
FlAs IX 5.59 6.26 410.77 446.36 4.42 .04
FlAs X 19.53 19.03 450.34 424.17 2.36 .13
FlAs XI 18.31 23.94 413.89 459.22 7.06 .01
FlAs XII 31.30 32.95 421.74 451.67 3.08 .08
FlAs XIII 37.68 37.95 438.37 435.69 0.03 .88
FlAs XIV 21.04 21.49 451.77 422.80 2.88 .09
FlAs XV 17.75 14.65 482.27 391.71 29.04 .00
FlAs XVI 8.03 7.46 457.60 418.21 5.32 .02* The differences are statistically significant when p<.05.

99Dermatoglyphic sexual dimorphism
Discriminant analysis
After processing the data, obtained by the various analytic methods, we performed a discriminant analysis. First, we selected those indices which had the highest discriminating power between the groups. Next, we carried out a classification which related each individual to the appropriate group. In orderto assess precisely the results of the analysis, there was need to examine the ratio between the number of individuals in the sample and the number of variables that are incorporated in the analysis. In anthropological research, it was customary to postulate a minimal ratio of 3:1 between the number of individuals and the number of tested traits (N/d>3). In our control group we obtained a ratio of 15:1 between the numbers of individuals and traits. For a firstanalysis we selected 3 of the 22 quantitative traits as suitable for classificationof the individuals (Table 20.1). Higher loadings for them were found in PCA in component 5 for men and component 4 for women, using ridge counts of fingerI of right hand, and in component 3 for men and component 2 for women, using A line left and D line right. Two of the variables differed significantly betweenthe sexes. In cluster analysis we found three variables in two clusters to correlate at –0.12 for women and +0.04 for men. These traits enabled correct classificationby sex in 61.05% of the subjects (with higher classification percentage of 64.4%for men as compared to 57.8% for women – Table 21.1.A).
Table 19.1.c. Comparison of directional asymmetry indices in control group of males and females by ANOVA method.
TraitMales Females Sex differences
Mean S.D. Mean S.D. F ratio Sign. *(p)
DAs I 6.53 48.71 2.84 45.92 1.31 .25
DAs II 5.77 18.99 1.11 20.86 11.88 .00
DAs III –3.41 12.78 –3.38 10.89 0.00 .99
DAs IV 3.80 18.79 5.26 19.38 1.40 .24
DAs V 11.45 81.35 3.27 77.65 2.28 .13
DAs VI 6.39 46.35 1.24 44.72 2.76 .10
DAs VII –0.10 16.24 –2.41 12.54 5.59 .02
DAs VIII –2.79 10.25 –3.62 9.94 1.69 .19
DAs IX 0.24 7.26 –0.46 7.12 2.08 .15
DAs X –0.79 29.49 0.19 32.38 0.07 .80
DAs XI 1.11 32.55 4.87 43.14 2.73 .10
DAs XII 4.54 56.48 11.37 58.52 3.10 .08
DAs XIII 2.83 62.94 9.09 63.53 2.35 .13
DAs XIV 13.61 34.94 8.93 39.23 3.42 .06
DAs XV 11.52 21.17 7.80 18.27 7.31 .01* The differences are statistically significant when p<.05.

100 Eugene Kobyliansky et al.
The 42 indices of diversity and asymmetry enabled correct classification bysex of 60.55% of subjects (63.9% in women and 57.0% in men – Table 21.1.B). Of these, 7 variables entered the discriminant analysis (Table 20.1) and in 5 of them these were significant inter-sex differences (DAs II–PII, FLAs XV–MLI,FLAs XI–FRC IV r-1, DAs XV–MLI of both hands, Div III–maximum FRC). These indices were encountered in 4 PCA components in women and 3 in men. The indices of diversity Div III and VII were encountered in component 1 for both sexes. The indices of directional asymmetry DAs II and DAs IV were encountered in component V in both sexes, and in women this component also contained the index of ‚uctuating asymmetry (FLAs XI), which in menappeared in component 4. The indices of MLI asymmetry (FLAs and DAs XV) were found in women in component 9, while in men FLAs XV were located in component 7. In the cluster trees of the two sexes, these indices arrange in different clusters with low correlations between them.
Table 20.1. Discriminant analysis between males and females of control group. The selected discriminant traits with F>4; their Wilks lambda and minimum D squared values.
Table 21.1. Results of discriminant analysis between males and females of control group.
A. By 22 quantitative dermatoglyphic traits. Percent of correctly classified cases = 61.05%.
B. By 42 dermatoglyphic traits including indices of intraindividual diversity and of directional and ‚uctuating asymmetry. Percent of correctly classified cases = 60.55%.
Variables Wilks lambda Minimum D squared
A. By 22 quantitative dermatoglyphic traits.
1) Finger RC I-r .955 .187
2) A line exit, lh .941 .251
3) D line exit, rh .936 .271
B. By 42 dermatoglyphic traits including indices of intraindividual diversity and of directional and ‚uctuating asymmetry.
1) DAs II .984 .064
2) FLAs XV .969 .129
3) FLAs XI .958 .173
4) Div III .949 .216
5) Div VII .939 .258
6) DAs IV .931 .298
7) DAs XV .925 .325
Real group No. of casesPredicted group
Males Females
Males 427 275 (64.4%) 152 (35.6%)
Females 446 188 (42.2%) 258 (57.8%)
Real group No. of casesPredicted group
Males Females
Males 426 243 (57.0%) 183 (43.0%)
Females 446 161 (36.1%) 285 (63.9%)

101Dermatoglyphic sexual dimorphism
The two groups of variables which were taken separately for discriminant analysis, yielded similar results in the classification according to sex. Micleand Kobyliansky (1991) obtained higher values, namely, 69.6% according to 22 quantitative traits and 68.8% according to the 42 indices of diversity and asymmetry.
Summary of the findings
Dermatoglyphic differences between the sexes have been reported in theliterature (Cummins and Midlo, 1943, 1961; Bener, 1979; Schwidetzky and Jantz, 1979; Micle and Kobyliansky, 1986, 1987, 1988, 1991; Kobyliansky and Micle, 1987, 1988, 1989; Plato et al., 1991). The present study confirms such differencesand provides a few additional ones which are to be described in the course of the summation.
Significant differences between men and women in thecontrol group
Fingers
The inter-sex differences in the frequency of loops and whorls (Table 1.1) are smaller in the present study than those found in Jewish communities from North Africa, East Europe and the Middle East (Kobyliansky and Micle, 1987, 1988, 1989). Consequently, the inter-sex differences in the PII indices are smaller,and are significant on the right hand, as well as in both hands combined (Table 19.1a). Micle and Kobyliansky (1991) found significant difference between thesexes also in the left hand index. Differences between the sexes in the values ofTRC, AbsRC and the sexual dimorphism index (Tables 9.1 and 19.1) are lower than those in other Jewish groups (Kobyliansky and Micle, 1987, 1988, 1989) but still significant. It is conceivable that in this control group which includeda variety of Jewish groups, the inter-sex differences moderated themselves. Theindices of diversity of the finger ridge counts were higher in women. For allfingers, men yielded higher ridge counts. In eight of the ten fingers, there weresignificant differences between the sexes (Table 19.1.a).
Palms
Palmar patterns – a significant inter-sex difference was detected with respectto frequency of the pattern in both hands in the hypothenar region (32.0% in women vs 23.7% in men – Table 22.1). The same trend was observed also in Jews of East Europe, but the reverse trend in Jews of North Africa and the Middle East (Kobyliansky and Micle, 1987, 1988, 1989). Higher bilateral symmetry of the trait was encountered in women, and this in all regions of the palm.

102 Eugene Kobyliansky et al.
Additional triradii – significant difference in frequency of a’ was detectedbetween men (12.2%) as compared to women (6.7%; Table 22.1). Extra triradii are prevalent in both sexes in interdigital regions IV (d’) and II (a’). As for c”, it appears in low frequency in both sexes. The a’ is more frequent on the right hand, whereas d’ is more frequent in the left hand. Similar results were recorded in other Jewish groups (Kobyliansky and Micle, 1987, 1988, 1989). A higher bilateral symmetry was observed in women in various palmar regions (with little differences between the two hands).
Absence of triradii c – this was more prevalent in women than men (7.6% vs 6.6%) but in both sexes the absence was more frequent on the left hand.
Sydney line – significant difference here between men (4.2%) and women(8.4%, Table 22.1).
Main Lines Index (MLI) – was 8.79 in men and 8.96 in women (Table 13.1). Similar values were reported by Cummins and Midlo (1943, 1961) and Kobyliansky and Micle (1987, 1988, 1989). Significant differences were detectedin the termini of line A on both hands (Tables 19.1a and 22.1).
a-b ridge count – was 80.41 in men and 80.24 in women (Table 13.1). In other Jewish groups the values were lower and the inter-sex differences greater (Bat-Miriam Katznelson and Ashbel, 1973; Bejerano, 1986; Kobyliansky and Micle, 1987, 1988). A marked inter-sex difference was observed in Jews of East Europe,namely, 77.71 in men vs 66.04 in women (Kobyliansky and Micle, 1989).
a-b distance – was greater in men, with the inter-sex difference statisticallysignificant. The distance was greater on the left hand in both sexes (Table 13.1). In other Jewish samples, the distances in men (47.44 to 49.94 mm) and in women (42.36 to 46.06 mm) (Kobyliansky and Micle, 1987, 1988, 1989) were similar.
a-b ridge breadth – the ridges were found to be thicker in men, with the inter-sex difference significant; in both sexes, there were no differences between thevalues for the two hands (Tables 13.1 and 22.1). Similar findings were obtainedin other Jewish communities (Kobyliansky and Micle, 1987, 1988, 1989).
Sum of atd maximal angle – this angle is significantly greater in women(90.29°) than in men (86.33°) (Tables 13.1 and 22.1). There are only minor bilateral differences in this regard in both sexes. The data on other Jewish groups aresimilar to these, excepting in the sample of Middle East Jews (Kobyliansky and Micle, 1987) who present higher values 91.27° in men and 94.62° in women).

103Dermatoglyphic sexual dimorphism
Table 22.1. Significant differences between men and women in the control group.
Variables Males FemalesSign. Differ.
Males/Females
Ridge counts of Whorls 18.54 17.79 **
Ridge counts of Ulnar Loops 13.67 12.97 *
Ridge counts of Radial Loops 9.92 10.81 *
FRC I-r 19.76 17.57 ***
FRC III-r 13.39 12.48 *
FRC IV-r 16.56 15.80 *
FRC V-r 14.50 13.34 ***
FRC I-l 17.73 16.27 ***
FRC III-l 13.38 11.97 ***
FRC IV-l 16.63 15.24 ***
FRC V-l 14.57 13.37 ***
TRC 152.27 140.93 ***
Absolute RC 207.47 186.15 ***
PII rh 7.19 6.68 ***
PII both hands 13.98 13.29 ***
Hypothenar patterns on both hands 23.7% 32.0% *
Bilateral symmetry, interdigital IV 63.5% 69.8% *
Indiv. with accessory triradius a’ 12.2% 6.7% **
Sydney line 4.2% 8.4% **
A line exit l 4.22 4.46 ***
A line exit r 4.48 4.58 *
Atd angle (degrees) 86.33 90.29 ***
Axial triradius t 72.7% 63.9% **
a-b distance (mm) 48.00 44.52 ***
Ridge breadth (mm) 0.584 0.544 ***
Div III 12.78 11.98 *
FLAs I 39.25 35.43 **
FLAs II 14.04 13.02 ***
FLAs IX 5.59 6.26 *
FLAs XI 18.31 23.94 **
FLAs XV 17.75 14.65 ***
FLAs XVI 8.07 7.46 *
Das II 5.77 1.11 ***
Das VII –0.10 –2.41 *
Das XV 11.52 7.80 *** = p<.05; ** = p<.01; *** = p<.001

104 Eugene Kobyliansky et al.
Results of PCA
First we examined 22 quantitative traits of which 5 components were isolated in men and 4 in women (Table 15.1). These isolated components accounted for 77.13% of the overall variance in men and 75.38% in women. These percentages are higher than those obtained by Kobyliansky and Micle (1991), which were 73.76% in men and 73.39% in women (in that study 4 components were isolated from both sexes). In both sexes there was low correlation between the ridge count of finger I and the other ridge counts (formation of a separate component).In men, also the ridge counts of fingers IV and V were weakly correlated withvariables of the first component (formation of a separate component). Mostof the quantitative traits showing significant inter-sex difference are arrangedin the first component in the PCA, that is, the sexes differ primarily in traitslinked to the finger ridge counts. In the second phase, we examined the 42 indices of diversity and asymmetry (Table 16.1 and 16.1.2), from which 10 components were isolated in the two sexes and these accounted for 70.98% of the total accumulating variance in men and 70.40% of that in women. Micle and Kobyliansky (1991) obtained similar results of about 70% in both sexes. Significant differences between the sexes were detected in 10 indices located in a number of components (the indices not being interdependent – an arrangement re‚ecting an inter-sex difference).
Results of cluster analysis
The dendrograms (‘cluster trees’) of the two sexes are similar in the two groups of variables. The correlations for the cluster variables of the finger ridge counts(in the analysis of the 22 quantitative traits) and the diversity variables in finger ridge counts (in the analysis of 42 indices of diversity and asymmetry)were higher in women than in men (0.78 and 0.82 vs 0.72 and 0.74). Micle and Kobyliansky (1991) obtained similar cluster arrangements.
Comparison of quantitative traits within the sexes
Of the 22 traits (Table 19.1a), 14 yielded significant inter-sex difference (actuallyonly 11, if to take into account the correction of Bonferroni), with the male values greater than those of the females in all of them (excepting the terminus of line A in both hands). Micle and Kobyliansky (1991) observed 18 significantdifferences between the sexes (with the added significant differences in ridgecounts of finger II in both hands, of PII in the left hand and of the a-b ridgecounts in both hands, but with no significant difference in the terminus of lineA in the right hand) and as in the present study, for all the traits (excepting the main hand lines) the values were higher in men than in women.

105Dermatoglyphic sexual dimorphism
Comparison of the indices of diversity and asymmetry
In comparing 11 indices of diversity, we observed significant inter - sex difference(p<0.05) for Div III index (the discrepancy between maximal and minimal ridge counts for the fingers of both hands – Table 19.1b). All the indices were higher in men, as also observed by Micle and Kobyliansky (1991). In the present study, the diversity indices for both sexes were higher than those observed by Micle and Kobyliansky (1991). In our comparison of 16 indices of ‚uctuating asymmetry (Table 19.1b), there were 6 significant inter-sex differences (2 afterBonferroni’s correction), for 4 of which the male values were higher. Micle and Kobyliansky (1991) found 10 significant inter-sex differences of which 8 werehigher in women. In the present study 10/16 of the ‚uctuating asymmetryindices were higher in men. In our comparison of 15 indices of directional asymmetry (Table 19.1c), there were 3 significant inter-sex differences (1 afterBonferroni’s correction) and their values were higher in men (PII, atd, MLI). Micle and Kobyliansky (1991) found 7/15 significant inter-sex differences (with2 indices higher in men and the other 5 higher in women).
Results of discriminant analysis
For an initial analysis, 3/22 quantitative traits were found suitable (Table 20.1), which enabled correct classification by sex of 61.05% of individuals [with a higher correct classification in men (64.4%) than in women (57.8%) – Table 21.1]. For the second analysis (42 indices of diversity and asymmetry) 7 indices were found suitable (Table 20.1), which enabled correct classification by sex of60.55% of individuals (of which 63.9% of women and 57.0% of men were correctly classified – Table 21.1). Micle and Kobyliansky (1991) obtained higher values in their classification by sex, namely, 69.6% according to the 22 quantitativetraits and 68.8% by the 42 indices of diversity and asymmetry. Conceivably the wide variety of sects in the control group of the present study diminished the classification capability inasmuch as inter-sex differences accreted to the inter-sex differences.
* * *
We need to mention that the results from the control group which embraced 874 Jewish-Israeli individuals of various sects (428 men and 445 women), and also the control group of 100 parent pairs of healthy children will be compared later on in the following articles to the groups of examinees and their parents.

106 Eugene Kobyliansky et al.
Appendix 1
First we list the 22 quantitative traits used to compare between the sexes and the groups, these were:
a) 22 quantitative traits
Finger RC, Ir Absolute RC (AbsRC) Finger RC, IIr PII, lh Finger RC, IIIr PII, rh Finger RC, IVr PII, both h Finger RC, Vr a-b RC, rh Finger RC, I l a-b,RC, lh Finger RC, II l A-line exit, l Finger RC, III l A-line exit, r Finger RC, IV l D-line exit, l Finger RC, V l D-line exit, r Total RC (TRC) MLI
b) 42 traits, representing indices of intraindividual diversity and asymmetry
Div I DAs XII max – min fRC (lh) fRC, IIIr – IIIl Div II DAs XIII max – min fRC (rh) fRC, IIr – Iil Div III DAs XIV max – min fRC (both hands) fRC, Ir – Il Div IV DAs XV S2 for lh, (or S2L) MLI, rh – lh Div V FlAs 1 S2 for rh, (or S2L) [Div I – Div II] Div VI FlAs II S2 (both hands) PII, [rh – lh] Div VII FlAs III IIDL (for lh) a-b, RC, [rh – lh] Div VIII FlAs IV IIDL (for rh) hRC, [rh – lh] Div IX FlAs V S , (for both hands, or IID) [Div V – Div IV] Div X FlAs VI S , (both hands) [Div VIII – Div VII] Div XI FlAs VII Shannon’s index atd angle, [r – l] DAs I FlAs VIII Div II – Div I a-b dist, [r – l] DAs II FlAs IX PII, rh – lh ridge breadth [r – l] DAs III FlAs X a-b RC, r – l fRC, [Vr – Vl] DAs IV FlAs XI hRC, rh – lh fRC, [IVr – IVl] DAs V FlAs XII S2, rh – lh fRC, [IIIr – IIIl] DAs VI FlAs XIII Div VIII – Div VII fRC, [IIr – IIl] DAs VII FlAs XIV atd angle, r – l fRC, [Ir – Il] DAs VIII FlAs XV a-b dist., r – l MLI, [rh – lh] DAs IX FlAs XVI ridge breadth, r – l A1, asymmetry DAs X fRC, Vr – Vl index DAs XI fRC, IVr – IVlAbbreviations: RC = ridge count; r = right; l = left; h = hand; PII – Pattern Intensity Index; MLI = main line index; Div I to Div XI = indices of intraindividual diversity of finger ridge counts; DAs I to DAs XV = indices of directional asymmetry; FlAs I to FlAs XVI = indices of ‚uctuating asymmetry.
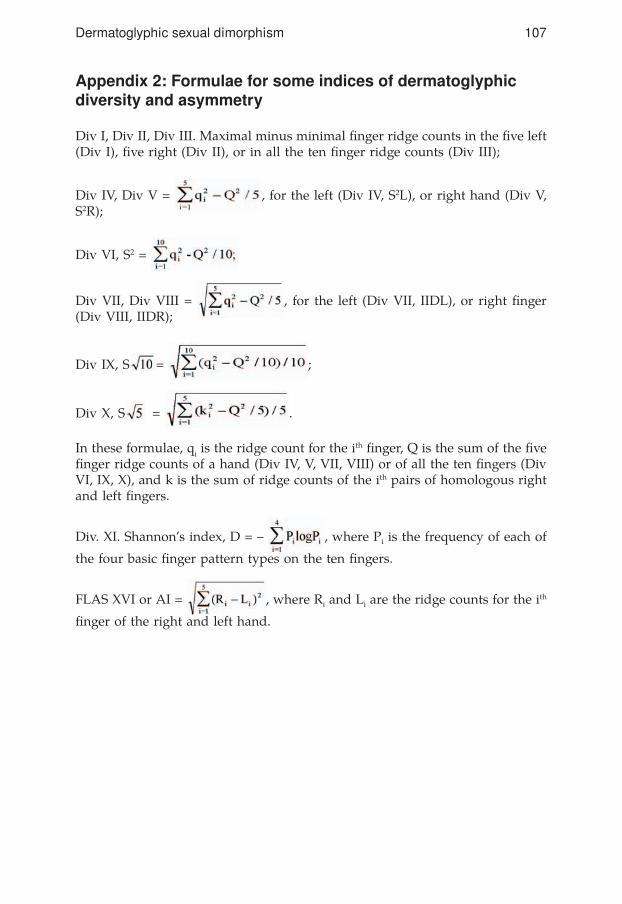
107Dermatoglyphic sexual dimorphism
Appendix 2: Formulae for some indices of dermatoglyphic diversity and asymmetry
Div I, Div II, Div III. Maximal minus minimal finger ridge counts in the five left(Div I), five right (Div II), or in all the ten finger ridge counts (Div III);
Div IV, Div V = , for the left (Div IV, S2L), or right hand (Div V, S2R);
Div VI, S2 =
Div VII, Div VIII = , for the left (Div VII, IIDL), or right finger(Div VIII, IIDR);
Div IX, S = ;
Div X, S = .
In these formulae, qi is the ridge count for the ith finger, Q is the sum of the fivefinger ridge counts of a hand (Div IV, V, VII, VIII) or of all the ten fingers (DivVI, IX, X), and k is the sum of ridge counts of the ith pairs of homologous right and left fingers.
Div. XI. Shannon’s index, D = – , where Pi is the frequency of each of
the four basic finger pattern types on the ten fingers.
FLAS XVI or AI = , where Ri and Li are the ridge counts for the ith
finger of the right and left hand.

108 Eugene Kobyliansky et al.
BibliographyAchs R., Harper R.G. and Siegel M.1966: Unusual dermatoglyphic findings associated with rubella embryopathy. New England,
J. Med. 274: 148–150.
Adams M.S. and Niswander J.D.1967: Developmental “noise” and a congenital malformation. Genet. Res. 10: 313–317.
Almeido J.C.C., Povoa L.C. and Rodriques J.1962: Sindrome de Turner: Apresentacao de um caso com estudo dos cromossomos
e das impressoes palmares. Arq. bras. Endocrin. Metab. 11: 23–30.
Alter M.1965: Is hyperploidy of sex chromosomes associated with reduced total finger ridge count?
Am. J. Hum. Genet. 17: 473–476.
Antley R.M.1976: Variables in the outcome of genetic counseling. Soc. Biol. 23: 108.
Arrieta M.I. and Lostao C.M.1988: Principal Components Analysis of digital dermatoglyphic patterns in a Basque population.
Hum. Biol. 60 (2): 191–204.
Atchley W.R., Herring S.W., Riska B. and Plummer A.A.1984: Effects of the muscular dysgenesis gene on developmental stability in the mouse mandible.
J. Craniofac. Genet. Dev. Biol. 4: 179–189.
Aue-Hauser G., Rosenkranz W., Wittwer B. and Maurer G.1982: Plantar zygodactylous triradii in patients with Trisomy 21. Ind. J. Phys. Anthrop. and
Hum. Genet. 8 (1): 1–16.
Babler W.J.1978: Prenatal selection and dermatoglyphic patterns. Am. J. Phys. Anthrop. 48: 21–28.1979: Quantitative differences in morphogenesis of human epidermal ridges. In: “Dermato-
glyphics: fifty years later”. W. Wertelecki and C. Plato (eds.). Birth Defects Origi-nal Article Series. 15 (6): 199–208. New York: Alan R. Liss.
1987: Prenatal development of dermatoglyphic patterns: Association with epidermal ridge, volar pad and bone morphology. Coll. Anthrop. 11: 297–304.
1991: Embryologic development of epidermal ridges and their configurations. Birth defects: Original article series. 27 (2): 95–112.
Bailit H.L., Workman P.L., Niswander J.D. and Maclean C.J.1970: Dental asymmetry as an indicator of genetic and environmental conditions in human
populations. Hum. Biol. 42: 626–638.
Balgir R.S.1984: Congenital oral clefts and dermatoglyphics. Israel J. Med. Sci. 20: 622–624.
Barden H.S.1980: Fluctuating dental asymmetry: A measure of developmental instability in Down Syn-
drome. Am. J. Phys. Anthrop. 52: 169–173.
Barlow P.1973: The in‚uence of inactive chromosomes on human development. Hum. Genet. 17: 105–
136.
Bat-Miriam Katznelson M.1968: Research of Gliforim in medical genetics. “Harefuah”, 103–100. (in Hebrew)1982: The dermatoglyphics of Jewish XXY Klinefelter’s and X Turner’s patients. In: “Progress
in dermatoglyphic research”. New York: Alan R. Liss, Inc., pp. 435–449.
109Dermatoglyphic sexual dimorphism
1982: Dermatoglyphics of Jewish Down patients. In: “Progress in dermatoglyphic research”. New York: Alan R. Liss, Inc., pp. 335–352.
Bat-Miriam Katznelson M. and Ashbel S.1973: Dermatoglyphics of Jews. 1. Normal Ashkenazi population. Z. Morph. Anthrop. 65 (1):
14–28.
Bat-Miriam Katznelson M., Bejerano M. and Kobyliansky E.1987: Dermatoglyphic distances between three Jewish isolates. Yemen, Cochine, and Ethiopia.
Coll. Anthrop. 11 (2): 373–382.
Baum R.M. and Lapin B.A.1983: Inbreeding effects on dental morphometrics in Papio Hamadryas. Am. J. Phys. Anthrop.
62: 129–135.
Behrman R.E. and Vaughan V.C.1987: Nelson textbook of pediatrics. Saunders Company. Japan.
Bejerano M.1986: Dermatoglyphic pecularities in Yemenite, Cochin and Ethiopian Jews. Final work for the
degree of “Master of Science” in the Faculty of Medicine, Tel Aviv University.
Ben-David Y. (E. Kobyliansky), Hershkovitz I., Rupin D. and Moscona D.1989: Inbreeding effects on tooth size, eruption age and dental directional and ‚uctuating asym-
metry among South Sinai Bedouins. Proceedings, VII International Symposium on Dental Morphology. Jerusalem, Israel, May 7–11. P. Smith, E. Tchernov and Y. Ben-David (eds.), pp. 5–9.
Bener A.1979: Sex differences and bilateral asymmetry in dermatoglyphic pattern elements on the finger-
tips. Ann. Hum. Genet. 42: 333–342.
Ben-Sasson S.A.1990: Genes and Cancer. “Science”, 168-172. (in Hebrew).
Berger E.1976: Heterosis and the maintenance of enzyme polymorphism. Am. Nat. 110: 823–839.
Bonne Tamir B.1980: A new look on the genetics of the Jews. “Science”, 3–4. (in Hebrew).
Bora K.L., Douglas G.R. and Nestmann F.R. (eds)1982: Progress in mutation research. Vol. 3. Amsterdam: Elsevier Biomedical Press.
Borger D., Held K.R. and Luttgen S.1986: Dermatoglyphics in Congenital Adrenal Hyperplasia (CAH). Clinic. Genet. 30: 173–176.
Bozicevic D., Milicic J., Schmutzer L.J., Szirovicza L. and Turek S.1991: Dermatoglyphics and disease – an analysis of quantitative traits. Coll. Anthrop. 15 (2):
271–282.
Brent R.L.1980: Radiation teratogenesis. Teratology, 21: 281.
Brown C.J., Ballabio A., Rupert J.L., Lafreniere R.G., Grompe M., Tonlorenzi R. and Willard H.F.1991: A gene from the region of the human X inactivation centre is expressed exclusively from
the inactive X chromosome. Nature, 349: 38–44.
Brown C.J., Lafreniere R.G., Powers V.E., Sebastio G., Ballabio A., Pettigrew A.L., Ledbetter D.H., Levy E., Craig I.W. and Willard H.F.1991: Localization of the X inactivation centre on the human X chromosome in Xq13. Nature,
349: 82–84.

110 Eugene Kobyliansky et al.
Butler P.M.1963: Tooth morphology and primate evolution. In: “Dental Anthropology”. Vol–5, Broth-
well D.R. (ed.). London: Pergamon Press.
Casarett A.P.1968: Radiation Biology. Prentice Hall.
Chakrabory R., Malhotra R.C. and Tateno Y.1982: Variation in dermal ridges in nine population groups of Maharashtra, India. Am. J. Phys.
Anthrop. 58: 53–59.1987: Biochemical heterozygosity and phenotypic variability of polygenic traits. Heredity.
59: 19–28.
Chowdury A.K.1991: Finger ridge count asymmetry in a small breeding isolate and two large groups of La-
haul of Himachal Pradesh. In: “Dermatoglyphics today”. Reddy et al. (eds), pp. 176–181.
Chung C.S., Rao D.C. and Ching G.H.S.1980: Population and family studies of Cleft Lip and Palate. In: “Etiology of Cleft Lip and
Cleft Palate”. M., Melnick, D., Bixler, E.D., Shields (eds): New York: Alan R. Liss. Inc., pp. 325–352.
Ciovirnache M., Florea I., Ionescu V., Popa M. and Popescu H.1988: Palmar and plantar ‚exion folds in children with Turner Syndrome and their parents. Rev.
Roum. Med. Endocrinol. Rom. J. Med. 26 (2): 127–137.
Clarke G.M. and McKenzie J.A.1987: Developmental stability of insecticide resistant phenotypes in blow‚y; a result of canaliz-
ing natural selection. Nature. 325: 345–346.
Corballis M.C. and Morgan M.J.1978: On the biological basis of human laterability: I. Evidence for maturational left-right gradi-
ent. Behav. Brain Sci. 2: 261–269.
Crawford F.C. and Sofaer J.A.1987: Cleft Lip with or without Cleft Palate: Identification of sporadic cases with a high level of
genetic predisposition. J. Med. Genet. 24: 163–169.
Cummins H.1936: Dermatoglyphic stigmata in mongoloid idiocy. Anat. Rec. 64: 11.1939: Dermatoglyphic stigmata in mongoloid imbeciles. Anat. Rec. 73: 407–415.
Cummins H. and Midlo C.1927: Dermatoglyphics in Jews. J. Phys. Anthrop. 10: 91–113.1943/1961: Finger prints, palms and soles. An introduction to dermatoglyphics. Blakiston
Comp (1943). Reprinted by Dover Publ. N.Y. (1961).
Cushman C.J. and Soltan H.C.1969: Dermatoglyphics in Klinefelter’s Syndrome (47, XXY). Hum. Hered. 19: 641–653.
Dahlberg A.A.1945: The changing dentition of man. Am. J. Dent. Assic, 32: 676–690.
Dankmeijer J.1938: Some anthropological data on finger prints. Am. J. Phys. Anthrop. 23: 377–388.
Dar H., Schmidt R. and Nitowsky H.M.1977: Palmar crease variants and their clinical significance: A study of newborns at risk. Pediat.
Res. 11: 103–108.

111Dermatoglyphic sexual dimorphism
Dar H. and Winter S.T.1970: A study of dermatoglyphics and the simian crease in familial deafness. Human Heredity.
20 (5): 493–506.
Davee M.A., Reed T. and Plato C.C.1989: The effect of a pattern in palmar interdigital II on a-b ridge count in black and white Down
Syndrome cases and controls. Am. J. Phys. Anthrop. 78: 439–447.
DiBennardo R. and Bailit H.L.1978: Stress and dental asymmetry in a population of Japanese children. Am. J. Phys. Anthrop.
48: 89–94.
Dixon W.J.1983: BMDP Statistical Software. Berkeley: University of California Press.
Doyle W.J. and Johnston O.1977: On the meaning of increased ‚uctuating dental asymmetry: A cross populational study.
Am. J. Phys. Anthrop. 46: 127–134.
Dzuiba P.1972: Dermatoglyphics in cases of hare lip and cleft palate. Int. Dermatog. Assoc. News Bull.
Emery A.E.H. and Rimoin D.L.1990: Principles and practice of medical genetics. Churchill Livingstone. London and
New York.
Falconer D.S.1981: Introduction to quantitative genetics. 2nd Edition. New York: Longman.
Fink A., Kosekoff J. and Lewis C.1977: A study of the resources available to Huntington’s disease patients, families and health
care providers. UCLA Health Services Research Centre Report HS - 2015.
Forbes A.P.1964: Fingerprints and palm prints. Dermatoglyphics and palmar ‚exion creases in gonadal
dysgenesis, pseudohypoparathyroidism and Klinefelter’s syndrome. New Engl. J. Med. 270: 1268–1277.
Fuhrmann W. and Vogel F.1982: Genetic Counselling, 3rd Edition. Heidelberg Science Library 10. , Berlin – Heidel-
berg – New York. Springer.
Galton F.1982: Fingerprints. London. Macmillan.
Garn S.M., Cohen M.M. and Geciauskas M.A.1970: Increased crown size asymmetry in Trisomy. G. J. Dent Res. 49: 465.
Goodman R., Bat-Miriam Katznelson M., Hertz M., Katznelson M. and Rotem D.1976: Congenital malformation in four siblings of a mother taking anticonvulsant drugs. Am.
J. Dis. Child. 130: 884–887.
Goodman R. and Meier R.J.1986: Easter Islander palmar dermatoglyhics: Sexual dimorphism, bilateral asymmetry and fam-
ily polymorphism. Am. J. Phys. Anthrop. 70: 125–132.
Greulich W.W.1951: The growth and development status of Guamanian school children in 1947. Am. J. Phys.
Anthrop. 9: 55–70.
Greulich W.W., Crimson C.S. and Turner M.L.1953: The physical growth and development of children who survived the atomic bombing of
Hiroshima or Nagasaki. J. Pediatr. 43: 121–145.

112 Eugene Kobyliansky et al.
Hall J.G., Pauli R.M. and Wilson K.M.1980: Maternal and fetal sequelae of anticoagulation during pregnancy. Am. J. Med. 68: 122.
Hall J.G., Powers E.K., McIlvaine R.T. and Ean V.H.1978: The frequency and financial burden of genetic disease in a pediatric hospital. Am. J. Med.
Genet. 1: 416–436.
Hanshow J.B. and Dudgeon J.A.1978: Viral disease of the fetus and newborn. Philadelphia: W.B. Saunders.
Harris E.F. and Nweeia M.T.1980: Dental asymmetry as a measure of environmental stress in the Ticuna Indians of Colum-
bia. Am. J. Phys. Anthrop. 53: 133–142.
Harrison T.R., Wilson J.D., Braunwald E., Isselbacher K.J., Petersdorf R.G., Martin J.B., Fauci A.F. and Root R.K.1991: Harison’s principles of internal medicine. McGraw-Hill Book Company.
Heinonen O.P., Slone D. and Shapiro S.1977: Birth defects and drugs in pregnancy. Littleton. Public. Science Group.
Hiernaux J.1968: Variabilite du dimorphisme sexuel de la stature en Afrique subsaharienne et en Europe. In:
“Anthropologie and Humangenetik”. Stuttgart: Gustav Fischer, pp. 42–50.
Holt S.B.1954: Genetics of dermal ridges: Bilateral asymmetry in finger ridge counts. Ann. Eugenics.
18: 211–231.1955: Genetics of dermal ridges: frequency distributions of total finger ridge count. Ann. Hum.
Genet. 20: 159–170.1959: The correlations between ridge counts of different fingers estimated from a population
sample. Ann. Hum. Genet. 23: 459–460.1963: Dermatoglyphic anomalies in associated with abnormal sex chromosomes. Proc. XI Int.
Congr. Genet. 1: 315.1964: The role of dermatoglyphics in medical biology. Med. World. Lond. 101: 112–125.1964: Fingerprint patterns in mongolism. Ann. Hum. Genet. 27: 279–282.1968: The genetics of dermal ridges. Springfield: C.C. Thomas Publ, Illinois.
Holt S.B. and Lindsten J.1964: Dermatoglyphic anomalies in Turner’s syndrome. Ann. Hum. Genet. Lond. 28: 87–100.
Hunter H1968: Finger and palm prints in chromatin positive males. J. Med. Genet. 5: 112–117.
Jacobs and Strong1959: Growth and physique in Down Syndrome children and adults. In Humanbiologia Buda-
pestinesis 20.
Jantz R.L.1975: Population variation in asymmetry and diversity from finger to finger for digital ridge
counts. Am. J. Phys. Anthrop. 42: 215–224.1978: Sex and lateral symmetry of the finger ridge count. Ann. Hum. Biol. 5: 285.1979: On the levels of dermatoglyphic variation. In: “Dermatoglyphics fifty years later”.
W. Wertelecki and C.C. Plato (eds). New York, Alan R Liss. Inc., pp. 53–62.
Jantz R.L. and Brehme H.1988: Palmar interdigital ridge counts in 45, X Turner syndrome. Hum. Biol. 60 (3): 453–460.
Jantz R.L. and Hunt D.R.1986: The in‚uence of sex chromosomes on finger dermatoglyphic patterns. Ann. Hum. Biol.
13: 287–295.

113Dermatoglyphic sexual dimorphism
Jantz R.L., Ranyard G.C. and Owsley D.W.1981: Finger ridge count variation in 45, X Turner’s Syndrome. Hum. Genet. 57: 376–379.
Jantz R.L. and Webb R.S.1980: Dermatoglyphic asymmetry as a measure of canalization. Ann. Hum. Biol. 7: 489–493.1982: Inter-population variation in ‚uctuating asymmetry of the palmar a-b ridge count. Am.
J. Phys. Anthrop. 253–259.
Jones K.L., Smith D.W., Ulleland C.N. and Streissguth A.P.1973: Pattern of malformation in offspring of chronic alcoholic mothers. Lancet. 1: 1267–1271.
Karmakar B.1990: Variability and asymmetry in main line index among 20 Dhangar castes of Maharastra,
India. In: “Trends in Dermatoglyphic Research”. N.M. Durham and C.C. Plato (eds) Kluwer Acad. Publ. Netherlands, pp. 69–83.
Kat P.W.1982: The relationship between heterozygosity for enzyme loci and developmental homeostasis in
peripheral populations of aquatic bivalves. Am. Nat. 119: 824–831.
Kieser J.A., Groeneveld H.T. and Preston C.B.1986: Fluctuating dental asymmetry as a measure of odontogenic canalization in man. Am.
J. Phys. Anthrop. 71: 437–444.1986: Fluctuating odontometric asymmetry in the Lengua Indians of Paraguay. Ann. Hum.
Biol. 13: 489–498.
Kobyliansky E. and Livshits G.1983: Relationship between levels of biochemical heterozygosity and morphological variability in
human populations. Ann. Hum. Genet. 47: 215-–223.1983: Genetic composition of Jewish populations: diversity and inbreeding. Ann. Hum. Biol.
10 (5): 453–464.1986: Anthropometric multivariate structure and dermatoglyphic peculiarities in biochemically
and morphologically different heterozygous groups. Am. J. Phys. Anthrop. 70: 251–263.
Kobyliansky E. and Micle S.1986: Handedness and dermatoglyphic directional and ‚uctuating asymmetry. Z. Morph. An-
throp. 76: 313–329.1987: Dermatoglyphic sexual dimorphism in Israeli Jews of different geographic extraction. Dis-
criminant analysis applied to quantitative traits. Proceedings of the 5 European Con-gress of Anthropology.
1987: Dermatoglyphic sexual dimorphism in Middle Eastern Jews. Bull. et Mem. de la Soc. d’Anthrop. de Paris, 4, serie XIV, 4: 271–290.
1988: Dermatoglyphic sexual dimorphism in North African Jews. Inter. J. Anthrop. 3 (1): 77–91.
1989: Dermatoglyphic sexual dimorphism in East European Jews. Bull. et Mem. de la Soc. d’Anthrop. de Paris, 1 (1–2), 13–26.
Kobyliansky E., Micle S., Arensburg B. and Nathan H.1979: Intra-individual variability and bilateral asymmetry of dermatoglyphic ridge counts in
Israeli males. Coll. Anthrop. 3: 107–111.
Kohn L.A.P. and Bennett K.A.1986: Fluctuating asymmetry in fetuses of diabetic Rhesus Macaques. Am. J. Phys. Anthrop.
71: 477–483.
Komatz Y., Kiriyama T. and Yoshida O.1979: Sole dermatoglyphics of patients with Klinefelter’s Syndrome (47, XXY). J. Med. Defic.
Res. 23: 85–90.
114 Eugene Kobyliansky et al.
Komatz Y. and Yoshida O.1976: Position of axial triradius in 51 cases of 47, XXY Klinefelter’s Syndrome. Jap. J. Hum.
Genet. 21: 123–128.1977: Termination of palmar main lines and main line indices in 47, XXY Klinefelter’s Syn-
drome. Jap. J. Hum. Genet. 22: 281–286.1978: Palmar dermatoglyphics of the patients with Klinefelter’s Syndrome (47, XXY). Jap.
J. Hum. Genet. 23: 245–248.
Krupp M.A., Chatton M.J. and Tierney L.M.1986: Current medical diagnosis and treatment. Maruzen Asian edition.
Kumbnani H.K.1964: The occurrence of symmetrical and asymmetrical terminations of main line D, C, B and
A in Mohammedans of Rajasthan. Acta. Genet. Med. Gemell. 13: 90–98.
Leamy L.1984: Morphometric studies in inbred and hybrid house mice. 5. Directional and ‚uctuating
asymmetry. Am. Nat. 123: 579–593.1986: Directional selection and developmental stability: Evidence from ‚uctuating asymmetry of
dental characters in mice. Heredity. 57: 381–388.
Leary R. and Allendorf F.1989: Fluctuating asymmetry as an indicator of stress: implication for conservation biology.
Three. 4: 214–219.
Leary R., Allendorf F. and Knudsen K.L.1985: Inheritance of meristic variation and the evolution of developmental stability in Rainbow
Trout. Evolution. 39: 308–314.
Leary R., Allendorf F., Wand F., and Knudsen K.L.1984: Superior developmental stability of heterozygotes at enzyme loci in Salmonid fishes. Am.
Nat. 124: 540–551.
Leguebe A., Vrydagh S. and Ducros J.1981: Finger ridge count correlations: Race, sex and hand differences. J. Hum. Evol. 10:
453–466.
Lerner I.M.1954: Genetic homeostasis. London: Oliver & Boyd.
Livshits G., Davidi L., Kobyliansky E., Ben-Amital D., Levi Y. and Merlob P.1988: Decreased developmental stability as assessed by ‚uctuating asymmetry of morphometric
traits in preterm infants. Am. J. Med. Genet. 29: 793–805.
Livshits G. and Kobyliansky E.1985: Lerner’s concept of developmental homeostasis and the problem of heterozygosity level in
natural populations. Heredity. 55: 341–353.1987: Dermatoglyphic traits as possible markers of developmental processes in humans. Am. J.
Med. Genet. 26: 111–122.1991: Fluctuating asymmetry as possible measure of the developmental homeostasis in humans.
Hum. Biol. 63: 441–466.
Loesch D.Z. and Martin N.G.1982: Directional and absolute asymmetry of digital ridge counts. Acta Anthropogenet. 6:
85–98.1983: Quantitative dermatoglyphics: Classification, genetics and pathology. Oxford: Oxford
University Press.
Ludwig W.1932: Das Rechts-Links Problem in Tierreich und beim Menschen. Berlin. Springer.

115Dermatoglyphic sexual dimorphism
Luxenberg J.S., Plato C.C., Fox K.M., Friedland R.P. and Rapoport S.I.1988: Digital and palmar dermatoglyphics in dementia of the Alzheimer type. Am. J. Med.
Genet. 30: 733–740.
Lyon M.F.1961: Gene action in the X-chromosomes of the mouse. Nature. 190: 372–373.
Malhotra K.C., Majumder L. and Reddy B.M.1991: Regional variation in ridge count asymmetry on hand. In: “Dermatoglyphics Today”.
Reddy et al. (eds) pp. 153–166.
Malhotra K.C., Vijayakumar M., Borecki I.B., Mathew S., Poosha D.V.R. and Rao D.C.1987: Resolution of genetic and uterine environmental effects in a family study of new dermato-
glyphic measure sole pattern ridge counts. Am. J. Phys. Anthrop. 74: 103–108.
Malina R. and Buschang P.1984: Anthropometric asymmetry in normal and mentally retarded males. Ann. Hum. Biol.
11: 515–531.
Malpas J.B.1990: Oncology. Postgrad. Med. J. 66: 80–93.
Markow T.A. and Gottesman1989: Fluctuating dermatoglyphic asymmetry in psychotic twins. Psychiat. Res. 29: 37–43.
Markow T.A. and Wandler K.1986: Fluctuating dermatoglyphic asymmetry and the genetics of liability to schizophrenia. Psy-
chiat. Res. 19: 323–328.
Martin A.O., Kurczinski T.W. and Steinberg A.G.1973: Familial studies of medical and anthropometric variables in a human isolate. Am. J. Hum.
Genet. 25: 581–593.
Martin N.G., Jinks J.L., Berry H.S. and Loesch D.Z.1982: A genetical analysis of diversity and asymmetry in finger ridge counts. Heredity. 48:
393–405.
Mather K.1964: Human diversity. Edinburg and London. Oliver & Boyd.
Mavalwala J.1962: Correlations between ridge counts on all digits of the Parsis of India. Ann. Hum. Genet.
26: 137–138.
McKeown T., Record R.G. and Turner R.D.1975: An interpretation of the decline of mortality in England and Wales during the twentieth
century. Population Studies. 29: 391–422.
McMillen M.M.1979: Differential mortality by sex in fetal and neonatal deaths. Science 204: 89–91.
Meier R.J.1978: Dermatoglyphic variation in five Eskimo groups from North Western Alaska. In: “Der-
matoglyphics: An interns perspective”. Mavalwala I. (ed). The Hague: Monton, pp. 145–152.
1980: Anthropological dermatoglyphics. A review. Yearbook of Phys. Anthrop. 23: 147–178.
Micle S. and Kobyliansky E.1985: Dermatoglyphic distances between Israeli Jewish population groups of different geographic
extraction. Hum. Biol. 57 (1): 97–111.1986: Dermatoglyphic sexual dimorphism in Israelis: Principal components and discriminant
analyses applied to quantitative traits. Hum. Biol. 58 (4): 485–498.

116 Eugene Kobyliansky et al.
1987: Dermatoglyphic sexual dimorphism in Yemenite Jews: Bulletins et Memoires de la Societe d’Anthropologie de Paris 4 (2): 95–114.
1988: Sex differences in the intraindividual diversity of finger dermatoglyphics: Pattern typesand ridge counts. Hum. Biol. 60 (1): 123–134.
1991: Asymmetry and diversity of dermatoglyphics. Homo. 42 (1): 21–42.
Micle S., Kobyliansky E., Nathan H. and Arensburg B.1978: Dermatoglyphic ridge counts in Israeli Jewish males. Coll. Anthrop. 2: 59–63.1982: Palmar dermatoglyphic traits in Israeli males. Coll. Anthrop. 6: 161–168.
Miller C.A.1985: Infant mortality in the U.S.A. Scien. Am. 253: 21–27.
Mittwoch U.1969: Do genes determine sex? Nature. 221: 446–448.
Mooney M.P., Siegel M.I. and Gest T.R.1985: Prenatal stress and increased ‚uctuating asymmetry in the parietal bones of neonatal rats.
Am. J. Phys. Anthrop. 68: 131–134.
Mukherjee A.1990: Inbreeding effects on bilateral asymmetry of dermatoglyphic patterns. Am. J. Phys. An-
throp. 81 (1): 77–89.
Mulvihill J.J. and Smith D.W.1969: The genesis of dermatoglyphics. J. Pediatr. 75: 579–589.
Nadel M. and Koss L.G.1967: Klinefelter‘s syndrome and male breast cancer. Lancet. 2: 366.
Neel J.V.1976: The study of spontaneous and induced mutation in man. Proceedings of the 5th Inter-
national Congress on Human Genetics.1978: Mutation and disease in man. Can. J. Genet. Cytol. 20: 295–306.1980: Some considerations pertinent to monitoring human populations for changing mutation
rates. Proceedings of the XIV International Congress of Genetics (Moscow). Vol 1, 1: 225–237.
Newell-Morris L. and Wienkler T.F.1989: Report from West Germany on the computerized diagnostic system – Dermalog. News
letter of American Dermatoglyphics Association. 8 (2): 14–20.
Nie N.H., Hull C.H., Jenkins J.B., Steinbrenner K. and Bent D.H.1975: SPSS: Statistical package for the social sciences. New York: McGraw Hill.
Niswander J.D. and Chung C.S.1965: The effects of inbreeding on tooth size in Japanese children. Am. J. Hum. Genet. 17:
390–398.
Noss J.F., Scott G.R., Potter R.H. and Dahlberg A.A.1983: Fluctuating asymmetry in molar dimensions and discrete morphological traits in Pima
Indians. Am. J. Phys. Anthrop. 61: 437–445.
Paneth N., Kiely J.L., Wallenstein S., Marcus M., Pakter J. and Susser M.1982: Newborn intensive care and neonatal mortality in low birth weight infants. N. Eng. J.
Med. 307: 149–155.
Paulsen C.A., Gordon D.L., Carpenter R.W.1968: Kline felter‘s syndrome and its variants: A hormonal and chromosome study. Recent Prof.
Horm. Res. 24: 321.
Penrose L.S.1967: Fingerprint pattern and the sex chromosomes. Lancet. 1: 298–300.

117Dermatoglyphic sexual dimorphism
1967: A suggested use of dermatoglyphic analysis in mongolism. Boston: Ciba Foundation study. Group No. 25 – Mongolism. Little, Brown & Company.
1968: Memorandum on dermatoglyphic nomenclature. Birth Defects. Original Article Series. 4 (3): 1–13.
Penrose L.S. and Loesch D.1967: A study of dermal ridge width in the second (palmar) interdigital area with special refer-
ence to aneuploid states. J. Ment. Defic. Res. 11: 36–42.
Pereira M., Petit-Maire N. and Iagolnitzer E.R.1977: Dermatoglyphes digitaux et palmaires d’Israeliens. Bulletins et Memoires de la Societe
d’Anthropologie de Paris, a) 4 (2): 149–164, b) 4 (3): 245–263.
Perizigian A.J.1977: Fluctuating dental asymmetry: variation among skeletal populations. Am. J. Phys. An-
throp. 47: 81–88.
Pizzarella D.J.1982: Radiation biology. Florida. CRC Press.
Plato C.C., Garruto R.M., and Schaumann B.A.,(1991): Dermatoglyphics: Science in transition. Birth defects foundation. Willey-Liss.
Polani P.E. and Polani N.1969: Chromosome anomalies, mosaicism and dermatoglyphic asymmetry. Ann. Hum. Genet.
Lond. 32: 391–402.1979: Dermatoglyphics in the testicular feminization syndrome. Ann. Hum. Biol. 6: 417–430.
Rajanikumari J. and Rao T.V.1984: Birth weight and natural selection. Hum. Heredity. 34: 170–173.
Reddy B.M., Malhotra K.C., Chakraborty B., Karmakar B., Kumar M.V. and Vasulu T.S.1991: Age variation in ridge count asymmetry. In: “Dermatoglyphics Today”. Reddy et al.
(eds) pp. 167–175.
Reddy B.M., Sengupta B. and Malhotra K.C.1985: Asymmetry and interdigital diversity in ridge counts among fishermen of Puri coast:
Population and sex variation. Indian Anthropologist. 15: 127–150.
Reed T.1981: Review: Dermatoglyphics in medicine – problems and use in suspected chromosome abnor-
malities. Am. J. Med. Genet. 8: 411–429.
Reed T. and Christian J.C.1979: Quantitative twin analysis of radial and ulnar ridge counts and ridge count diversity.
Acta. Genet. Med. Gemell. 28: 165–168.
Reed T., Reichmann A. and Palmar C.G.1977: Dermatoglyphic differences between 45, X and other chromosomal abnormalities of Turner
syndrome. Hum. Genet. 36: 13–23.
Reed T. and Young R.S.1982: Maternal effects in dermatoglyphics: similarities from twin studies among palmar, plantar
and fingertip variables. Am. J. Hum. Genet. 34: 349–352.
Rennert G.1990: Cancerous disease – frequency and risk. Science, 186–190. (in Hebrew).
Roberts D.F., Chavez J. and Court S.D.M.1970: The genetic component in child mortality. Arch. Dis. Child. 45: 33–38.

118 Eugene Kobyliansky et al.
Roberts D.F. and Coope E.1975: Components of variation in a multifactorial character: a dermatoglyphic analysis. Hum.
Biol. 47: 169–188.
Robson M.C., Santiago Q. and Huang T.W.1968: Bilateral carcinoma of the breast in a patients with Klinefelter’s syndrome. J. Clin. En-
docr. 28: 897.
Rommens J.M., Iannuzzi M.C., Kerem B., Drumm M.L., Melmer G., Dean M., Rozmahel R., Cole J.L., Kennedy D., Hidaka N., Zsiga M., Buchwald M., Riorda J.R., Tsui L.C. and Collins F.S.1989: Identification of the Cystic Fibrosis Gene: Chromosome walking and jumping. Science.
245: 1059-1065.
Rose R.J., Reed T. and Bogle A.1987: Asymmetry of a-b ridge count and behavioral discordance of monozygotic twins. Behav.
Genet. 17: 125–140.
Ross G.1983: Mortality and morbidity in very low weight infants. Pediatr. Ann. 12: 32–44.
Rudolph A.M. and Hoffman1987: Pediatrics. Norwalk, Connecticut. Appleton and Lange.
Sachs L. and Bat-Miriam M.1957: The genetics of Jewish population. Am. J. Hum Genet. 9: 117–126.
Saldana-Garcia P.1977: A dermatoglyphic study of the Thenar/first interdigital area of the palm in females and males
with sex chromosomal abnormalities. J. Ment. Defic. Res. 21: 127.1979: Dermatoglyphics in sex chromosome anomalies. J. Ment. Defic. Res. 23: 91–104.
Sanna E., Floris G. and Paderi R.1986: Some dermatoglyphic traits in breast carcinoma. Inter. J. Anthrop. 1 (1): 87–88.
Schardein J.L.1985: Chemically induced birth defects. New York: Dekker.
Schaumann B. and Alter M.1976: Dermatoglyphics in medical disorders. New York. Springer-Verlag.
Schwidetzky I. and Jantz R.L.1979: Race differences in the sex dimorphism of dermatoglyphics traits. J. Hum. Evol. 8:
773–776.
Sciulli F.W., Doyle W.J., Kelley C., Siegel P. and Siegel M.I.1979: The interaction of stressors in the induction of increased levels of ‚uctuating asymmetry
in the laboratory rat. Am. J. Phys. Anthrop. 50: 279–284.
Shapiro B.L.1983: Down Syndrome – A disruption of homeostasis. Am. J. Med. Gen. 14: 241–269.
Shimaguchi S., Ashizawa K., Endo B. and Sakura H.1961: An anthropometric approach to Turner‘s syndrome. A cytogenetical study of 57 patients.
Zinruigaku Zassi 72: 107–125.
Shiono H. and Kadowaki J.1975: Dermatoglyphics of congenital abnormalities without chromosomal aberrations. Clinic.
Pediatr. 14 (11): 1003–1013.
Shiono H., Kadowaki J. and Tanda H.1975: The palmar a-b ridge count and sex chromosomes. Hum. Biol. 47 (4): 505–509.

119Dermatoglyphic sexual dimorphism
Shiono H., Kadowaki J., Tanda H. and Hikita M.1977: Dermatoglyphics of Klinefelter‘s syndrome. J. Med. Genet. 14: 187–189.
Shohat M. and Ashkenazi S.1990: Children‘s medicine. Published by „Dionon“. Tel Aviv University. (in Hebrew).
Siegel M.I., Doyle W.J. and Kelley C.1977: Heat stress, ‚uctuating asymmetry and prenatal selection in the laboratory rat. Am.
J. Phys. Anthrop. 46: 121–126.
Siegel M.I. and Smookler H.H.1973: Fluctuating dental asymmetry and audiogenic stress. Growth. 37: 35–39.
Silver W.E.1966: Dermatoglyphics and Cleft Lip and Palate. Cleft Palate J. 3: 368–375.
Singh S.1968: A measure of asymmetry of finger ridge counts. Acta. Genet. 18: 599–603.
Singh S., Arkin M.A. and Westwood N.H.1977: Structural analysis of the ridge counts data of Australian Europeans using multivariate
analysis. Acta Genet. Med. et Gemell. 26: 167–171.
Sofaer J.A.1979: Human tooth-size asymmetry in cleft lip with or without cleft palate. Arch. Oral. Biol.
24: 141–146.
Sokal R.R. and Rohlf F.J.1981: Biometry. San Francisco. Freeman.
Sorenson Jamison C., Jamison P.L. and Meier R.J.1990: Dermatoglyphic and anthropometric relationship within the Inupiat (Eskimo) hand. Am.
J. Phys. Anthrop. 83 (1): 103–109.
Soule M.E.,1979: Heterozygosity and developmental stability: Another look. Evolution. 33: 396–401.1982: Allometric variation. 1. The theory and some consequences. Am. Nat. 120: 751–764.
Soule M.E. and Cuzin-Roudy Y.1982: Allometric variation. 2. Developmental instability of extreme phenotypes. Am. Nat. 120:
765–786.
Spielman R.S.1973: Differences among Yanomama Indian village: Do the patterns of allele frequences, anthro-
pometrics and map locations correspond?. Am. J. Phys. Anthrop. 39: 461–474.
Stanbury J.B., Wyngaarden J.B. and Fredrickson D.S.1983: The metabolic basis of inherited disease. 5th Edition New York: McGraw-Hill.
Stini W.A.1975: Adaptive strategies of human populations under nutritional stress. In “Biosocial Inter-
relations in Population Adaptation”. Watts E.S., Johnston F.E. and Lasker G.W. (eds): The Hague: Mouton. pp. 19–41.
Stinson S.1985: Sex differences in environmental sensitivity during growth and development. Yearbook
of Phys. Anthropol. 28: 123–147.
Thoday J.M.1955: Balance, heterozygosity and developmental stability. Cold Spring Herb. Symp. Quant.
Biol. 20: 318–326.1958: Homeostatis in a selection experiment. Heredity. 12: 401–415.

120 Eugene Kobyliansky et al.
Tobias P.V.1972: Growth and stature in South African populations. In “Human Biology of Environ-
mental Change”. D.J.M. Vorster (ed). London: International Biological Program, pp. 96–104.
Townsend G.C.1983: Fluctuating dental asymmetry in Down‘s syndrome. Australian Dental Journal. 28:
39–44.
Townsend G.C. and Brown T.1978: Heritability of permanent tooth size. Am. J. Phys. Anthrop. 49: 497–504.1980: Dental asymmetry in Australian Aboriginals. Hum. Biol. 52: 661–673.
Turner H.H.1938: A syndrome of ingantilism congenital webbed neck and cubitus valgus. Endocrinology
23: 566–578.
Uchida I.A. and Soltan H.C.1963: Evaluation of dermatoglyphics in medical genetics. Pediat. Clin. N. Amer. 10: 409–422.
Ulizzi L., Gravina M.F. and Terrenato L.1981: Natural selection associated with birth weight. II. Stabilizing and directional components.
Ann. Hum. Genet. 45: 207–212.
Van Valen L.1962: A study of ‚uctuating asymmetry. Evolution. 16: 125–142.
Varrela J., Vinkka H. and Alvesalo L.1984: The phenotype of 45, x females. An anthropometric quantification. Ann. Hum. Biol. 11:
53–66.
Vogel F.1990: Mutation in man. In “Principles and practice of medical genetics”. A.E.H. Emery
and D.L. Rimoin (1990): London and New York. Churchill Livingstone.
Vogel V.J.1979: Genetics of Retinoblastoma. Hum. Genet. 52: 1–54.
Vona G. and Porcella P.1983: Asymmetry and inter-finger variability of ridge counts in three samples of Italian popula-
tion. Coll. Anthropol. 7: 21–27.
Vormittag W., Weninger M., Raff M., Konard K. and Scheiber V.1986: Dermatoglyphics and creases in patients with Neurofibromatosis von Recklinghausen.
Am. J. Med. Genet. 25: 389–395.
Vormittag W., Weninger M., Hollman K. and Hoffman D.1979: Heterogenety of cleft lip and/or palate and dermatoglyphics. Birth Def. Orig. Artic. Ser.
15 (6): 649–659.
Vormittag W., Weninger M., Willvonseder R. and Wewalka F.1976: Dermatoglyphics of Homo – and heterozygostes for Wilson‘s Disease. Hum. Genet. 31:
211–218.
Vrijenhoek R.C. and Lerman S.1982: Heterozygosity and developmental stability under sexual and unsexual breeding systems.
Evol. 36: 768–776.
Waddington C.H.1942: Canalization of development and the inheritance of acquired characters. Nature. 150:
563–565.1957: The strategy of the genes. London: Allen and Unwin.1960: Experiments on canalizing selection. Genet. Res. 1: 140–150.

121Dermatoglyphic sexual dimorphism
Waldron I.1983: Sex differences in human mortality: The role of genetic factors. Soc. Sci. Med. 6: 321–333.
Webster E.W.1981: On the question of cancer induction by small X-ray doses. Am. J. Roentgenol. 137: 647.
Wolanski N. and Charzewska J.1967: Similarity of some anthropological characteristics of parents and their offspring in different
phases of ontogenetic development. Acta. Genet. 17: 365–381.
Woolf C.M. and Gianas A.D.1976: Congenital cleft lip and ‚uctuating dermatoglyphic asymmetry. Am. J. Hum. Genet. 28:
400–403.1977: A study of ‚uctuating dermatoglyphic asymmetry in the sibs and parents of cleft lip pro-
positi. Am. J. Hum. Genet. 29: 503–507.
Zakharov V.M., Olson M., Yablokov A.V. and Esipenko A.G.1989: Does environmental pollution affect the developmental stability of the Baltic seal (Hali-
choerus grypus)? In “In‚uence of human activities on the Baltic ecosystem”. Pro-ceedings of the Soviet-Swedish Symposium, Leningrad Gidrometeoizdat.
Zare N., Sorenson J.R. and Heeren T.1984: Sex of provider as a variable in effectic genetic counseling. Soc. Sci. Med. 19: 671.