relationship between media use and cultural adjustment: a
TRANSCRIPT

Marshall UniversityMarshall Digital Scholar
Theses, Dissertations and Capstones
2017
Relationship between media use and culturaladjustment: A study on international students atMarshall UniversityHaruka [email protected]
Follow this and additional works at: http://mds.marshall.edu/etd
Part of the Critical and Cultural Studies Commons, Journalism Studies Commons, and the MassCommunication Commons
This Thesis is brought to you for free and open access by Marshall Digital Scholar. It has been accepted for inclusion in Theses, Dissertations andCapstones by an authorized administrator of Marshall Digital Scholar. For more information, please contact [email protected],[email protected].
Recommended CitationYanagihara, Haruka, "Relationship between media use and cultural adjustment: A study on international students at MarshallUniversity" (2017). Theses, Dissertations and Capstones. 1083.http://mds.marshall.edu/etd/1083

RELATIONSHIP BETWEEN MEDIA USE AND CULTURAL ADJUSTMENT: A STUDY ON INTERNATIONAL STUDENTS AT MARSHALL UNIVERSITY
A thesis submitted to the Graduate College of
Marshall University In partial fulfillment of
the requirements for the degree of Master of Arts in Journalism
by Haruka Yanagihara
Approved by Dr. Chris Swindell, Committee Chair person
Dr. Robert Rabe Prof. Janet Dooley
Marshall University May 2017

ii

iii
ACKNOWLEDGEMENTS
I would like to express my special appreciation to everyone for allowing me to
study at Marshall University and experience various things in Huntington, WV, which I
would have never gone through in my home country. I must begin by expressing my deepest
appreciation to my mother, Mari. She always respects my decisions my entire life. It might
have been a hard decision for her to send me to the United States, but she offered me an
opportunity to make my dreams come true with her understanding and encouragement all the
time. Including this study, every single experience in the United States would have never
happened without her continuous support from Japan. I swear she is the best mother in the
world.
To the members of my committee: Dr. Swindell, Dr. Rabe, and Prof. Dooley, I
thank you all for providing me with knowledge and guidance. You were always there to
support not only this study, but also my student life at Marshall University.
With Dr. Swindell, I appreciate him for being the chair of this committee.
Especially, he helped on a lot of matters throughout this study and offered me a right
direction to the goal of the study. Also, he has established my fundamental knowledge from
the first semester of graduate school in journalism, because I had less background in media
study in undergraduate. His support during my class work and in this study, with his wisdom
and humor, lead me to conduct this study successfully.
Dr. Rabe, I thank him for encouragement and support for this study. Also, there are
not enough words to express my great appreciation for supervising my graduate schooling as
an advisor. He was always listening to me gently, and his attentiveness lightened up my
difficulties in my school life. His specialties, including writing with consistency, also helped
this study, and I am grad to be his student.

iv
Prof. Dooley, I appreciate her being a member of committee. Although it was a
sudden request to be a substitute, she accepted it and devoted so much to the completion of
this study. Especially, she offered me a lot of precise advice to improve this thesis. The
timetable for this study was packed, but her rapid responses and suggestions enabled me to
do everything as much as I can for this study during my stay in the United States.
Amanda is also one of my best cheerleaders in my school life. From the beginning
of school days, she shared her experience with her immigrant family member with me and
encouraged me greatly. I was saved by her understanding, and her brilliant smile got rid of
pressures or difficulties in my entire school life.
Finally, I would like to give my special thanks to my friends from Japan who I met
at Marshall University, especially Kennichi, Risa, Koshin, and Yuya, They motivated me to
focus on moving this study forward and also helped at various points such as the construction
of idea in this study, translation to English, creating a survey, and encouragement all the time.
I will never forget their support and our shared memories in Huntington.

v
TABLE OF CONTENTS
List of Tables vi
List of Figures ix
Abstract x
Chapter 1 1
Introduction 1
Chapter 2 4
Literature Review 4
Uses and Gratifications 4
Cross-cultural Adjustment 6
Models of Cultural Adjustment 8
U&G and Cross-Cultural Adaptation for International Students 11
Research Questions 12
Chapter 3 13
Methodology 13
Approach 13
Data collection 13
Participants 15
Data Analysis and Measurement 16
Chapter 4 17
Results 17
General Findings 17
RQ1: Media Use and Cultural Adjustment 19
RQ1 (1) Descriptive Statistics 19
RQ1 (2) Difference Among CAS 20

vi
RQ1 (3) Correlation with CAS 21
RQ2: American media interest and Cultural Adjustment 23
RQ2 (1) Descriptive Statistics 23
RQ2 (2) Difference Among CAS 25
RQ2 (3) Correlation with CAS 26
RQ3: U&G and Cultural Adjustment 30
RQ3 (1) Descriptive Statistics 30
RQ3 (2) Difference Among CAS 31
RQ3 (3) Correlation with CAS 32
Chapter 5 34
CONCLUSION 34
Limitations and Future Suggestions 36
REFFERENCES 37
APEENDIX A: Office of Research Integrity Approval Letter 40
APPENDIX B: Survey Questionnaires 41

vii
LIST OF TABLES
Table 1. Time using media in America categorized by CAS 20
Table 2. Frequency of using American news media categorized by CAS 20
Table 3. Frequency of using news media of home countries categorized by CAS 20
Table 4. Kruskal-Wallis Test: Mean Rank 21
Table 5. Test Statistics: Kruskal Wallis Test and Grouping Variable (CAS) 21
Table 6. Spearman’s rank order correlation: the frequency of using American media and CAS
22
Table 7. Categories and the Number of Interested News Contents in Honeymoon Stage 23
Table 8. Categories and the Number of Interested News Contents in Culture Shock Stage 24
Table 9. Categories and the Number of Interested News Contents in Recovery Stage 24
Table 10. Categories and the Total Number of Interested News Contents in Adjustment Stage
24
Table 11. Kruskal-Wallis Test: Mean Rank 25
Table 12. Test Statistics: Kruskal Wallis Test and Grouping Variable (CAS) 25
Table 13. Spearman’s rank order correlation: Economy and CAS 27
Table 14. Spearman’s rank order correlation: Politics and CAS 28
Table 15. Spearman’s rank order correlation: Counts and CAS 29
Table 16. Motivation of Using American Media in Honeymoon Stage 30
Table 17. Motivation of Using American Media in Culture Shock Stage 30
Table 18. Motivation of Using American Media in Recovery Stage 30
Table 19. Motivation of Using American Media in Adjustment Stage 31
Table 20. Kruskal-Wallis Test: Mean Rank 31
Table 21. Test Statistics: Kruskal Wallis Test and Grouping Variable (CAS) 31
Table 22. Spearman’s rank order correlation: Self-improvement and CAS 33

viii
Table 23. Lists of Results with Correlation 34
ix
LIST OF FIGURES
Figure 1. U-Curve Model of Cultural Adaptation 8
Figure 2. W-Curve Model of Cultural Adaptation 10
Figure 3. Time Using Media in America 3
Figure 4. Respondents in each CAS 4
Figure 5. Error Bar Graph: the frequency of using American media and CAS 22
Figure 6. Error Bar Graph: Economy and CAS 26
Figure 7. Error Bar Graph: Politics and CAS 28
Figure 8. Error Bar Graph: Economy and CAS 29
Figure 9. Error Bar Graph: Self-improvement and CAS 33

x
ABSTRACT
Due to the development of technology and globalization, the media environment
for international students has been dramatically changing. International students who use the
Internet now have more access to media produced in both home countries and host countries;
they have more options to select media produced in either country compared to students of
the past who lived without the Internet. Many scholars presume the media environment
directly influences international students’ lives in the host countries, including their level of
cultural adjustment. The purpose of this study is to examine the relationship between media
use and cultural adaptation among international students based on uses and gratifications
theory and U-Curve model of cultural adaptation (Lysgaard, 1955). Participants in this study
were 62 international students at Marshall University. The online, paper-based, and in-person
surveys collected data about their media use, categories of American news of interest to them,
and their motivation to use American media. Participants were classified into four stages of
cultural adaptation, which were self-reported: Honeymoon Stage, Culture Shock Stage,
Recovery Stage, and Adjustment Stage (Lysgaard, 1955). Using Kruskal-Wallis Test and
Spearman’s rank order correlation, five items had correlation with cultural adaptation stages
(the frequency of using American news media, interest in news about politics, interest in
news about economics, the total number of news categories of interest, and the motivation of
for self-improvement for using American media). Moreover, all five items slightly followed
the U-curve shape the same as Lysgaard’s (1955) U-Curve model of cultural adaptation.

1
CHAPTER1
INTRODUCTION
Trying oneself out in a new place is widely recognized as an essential element of
growth as a person. One of the Japanese proverbs says “let your dear child travel,” which
means the experience of solving problems by one’s self in new place during youth will bring
personal development. It would be the best time to let the child travel. The recent growth of
the global world allows more people to come across the sea. Studying abroad is one of the
most popular ways to jump into the global world. According to the Institute of International
Education (2016), 1,043,839 international students enrolled in schools in the United States
during the 2015-16, while it was only 564,766 during the 2005-6. The number is
approximately twice the one ten years ago. It is obvious the number of international students
has been dramatically increasing.
When people leave their home countries and move to another place, they have
many opportunities for previously unknown encounters. Sometimes, the common sense
acquired in their home countries cannot be shared in the host country. As they are trying to
adjust to the new culture, their cultural identities, constructed in their home countries since
they were born, loses stability (Ting-Toomey et al., 2000). The conflict triggered by the
cultural difference leads them to culture shock, and much effort is needed to deal with their
stress. The process of adjustment has several identifiable stages, and as time passes, they
gradually get over the frustration and learn how to interact well in the new culture (Lysgaard,
1955).
International students in the past had significantly fewer opportunities to be
exposed to their home cultures. Because of physical separation, it was difficult to obtain
information about their home countries and to communicate with people in their home
countries the same as before they moved to a host country. On the other hand, the rapid

2
development of technology in the 2010s influenced the lifestyle of international students
(Wong, 2016). Diffusion of the Internet significantly enhances the connections with their
home countries. It is possible to contact their families and friends with no boundaries, using
various channels such as social media, free calling and e-mail. The Internet is not limited by
time and space and visitors are easily contact their home countries (Chen, 2004). The author
also actually has experienced the effects derived from improvements with the connection
with the home country. Only email or phone calls with an expensive fee were available by
international traditional mobile phone eight years ago, while the author now has more
chances to chat with people in her home country with free Wi-Fi provided in many places
and with the development of smartphones in America.
As the Internet enables boundaries between host and home countries to fade, the
time being exposed to the media has also varied depending on the person. Park et al. (2014)
indicate international students who consume more social media hosted by the home country
tend to get stressed in the process of acculturation. As Cohen and Wills (1985) state, good
social contact from any source helps moderate stress in their lives, and connection with home
countries online might be considered to have the same value as the good social contact. It is
presumed that media use by international students and cultural adjustment would be closely
connected.
Moreover, mass media from all over the world now offer online news for free. This
means international students have instant access to the media produced in both home and host
countries. Even though they live in another country, international students still perceive news
about their home country as important (Sin et al., 2011). Also, the media from home
countries enable them to maintain ethnic values and beliefs (Melkote & Liu, 2000). However,
they actually live in the host country, and foreign mass media do not cover enough about

3
local news which probably influences their actual lives. Then, what does make them choose
the media offered in the host country?
Derived from the personal experience and a simple question of how international
students switch their media to the host country, the goal of this thesis project is to identify the
relationship between cultural adaptation and media use among international students. As a
subject of social science, the conceptualization of cross-cultural adaptation has been studied
at least for a hundred years (Padilla, 1980). Also, media consumption from an
audience-centered point of view has been studied since the 1940s. Those areas of study have
progressed separately. As the number of international students is increasing, on the other
hand, many scholars in media studies also are paying attention to them as research subjects.
Since the target group, international students, is relatively new, research on their media use
would have potential of expansion. Even in the traditional field of study, the findings might
be varied if the subject is a group of international students. Therefore, this study also tries
pioneering the hybrid idea of uses and gratification and the level of cultural adjustment from
the explorative perspective.
4
CHAPTER 2
REVIEW OF LITERATURE
The purpose of this study is to explore the relationship between the media use and
cultural adjustment of international students. The patterns of media use are described from
users’ point of view. Therefore, one of the essential elements is uses and gratifications
(U&G) approach.
Uses and Gratifications
U&G is an approach to understanding how and why people use media from an
audience-centered point of view (Katz et al., 1974). It is a concept, stemming from
functionalist paradigms, that users’ choice of a certain mass medium is determined to meet
the needs generated in their lives (Rui & Stefanone, 2016). In other words, people select and
use certain kinds of media contents for their satisfaction. U&G is applied to investigate fields
such as motivations, expectancy, value, audience activities, and media consumption
(Palmgreen et al., 1981). U&G is an essential approach for understanding the role of mass
communication in the society as well as media effects. It is still widely applied to media
study and expanded as the oldest program of research in the field (Liu, 2015).
While a traditional media effects study is conducted on a premise that audiences are
recognized as passive receivers, U&G presumes them as users who select media content
intentionally, actively, and rationally (McQuail & Windahl, 1981). Katz et al. (1974)
suggested five assumptions brought to U&G. First, people actively use media and it is
goal-directed, purposive and motivated. Second, people have initiatives, linking satisfaction
of needs or desires to select and use certain media. Third, the media competes with other
forms of resources to satisfy needs. Fourth, people are aware of their needs and motivation
and able to report them accurately to researchers. Finally, people assess and judge the value
of media content. As Roy (2008) summarized, Katz et al. (1974) proposed assumptions in

5
U&G: Media users are (1) “goal directed in their behavior”, (2) “active”, and (3) “aware of
their needs and select the media to gratify their needs” (p. 77).
Many prior studies attempted to identify and categorize the uses and gratifications
of media. McQuail et al. (1972) proposed four categories that represent the uses of different
types of media which are most widely applied for the basic constructive idea of the U&G
approach: (1) diversion, (2) personal relationships, (3) personal identity, and (4) surveillance.
The initiation of the preliminary approach of U&G was in the 1940s when forms of
media behavior became varied with diffusion of radio, newspaper, and television (Wimmer &
Dominick 1994). The history of the U&G was triggered by Lazarsfeld and Stanton (1941) to
investigate the audience’s underlying purposes for listening to radio (Tanaka, 2007). The
primary study was conducted in a descriptive method to classify responses into categories
and find a tendency among those categories (Ruggiero, 2000). The earliest form of the U&G
approach was applied on Herzog’s (1944) study with a classification of the reasons to choose
specific types of media. She eventually identified three types of gratifications (emotional,
wishful thinking, and learning) through a survey to fans of soap operas. While conventional
media research subjected a one-direction influence on media itself through the audience’s
perception and behaviors, U&G was the first strategy based on the audience-centered point of
view. Indeed, it was a breakthrough concept to explore the perception of media users in
media study at the time and a significant change that lead media study to a functionalist
paradigm of social science.
While U&G have been played an essential theory in media studies, several scholars
criticize that U&G has not been regarded as a fully conceptualized theory due to the
inadequacies in conceptual clarity and explanation of mechanisms (Rubin, 1983). McQuail
(1994) stated that most scholars recognized the early research was conducted under less
theoretical consistency. In some of the ideas proposed by scholars in academic journals,

6
criticisms are categorized into two aspects, mainly on its research method. One critical
perspective is that the U&G approach tends to ignore elements that restrict free choice of
media consumers. Indeed, U&G assumes that people have entirely free choice on media use
without considering the effects of the media hegemony (Severin & Tankard, 1997). Also, as
Katz (1987) pointed out, the early conceptualization of U&G does not have enough
consideration for the social origin of needs linking to the media, and is too cursory to
accommodate with the function of audience satisfaction both for individuals and the society.
Blumler et al. (1985) also insisted further U&G research should focus on the cultural context
around media use and motivations. The social aspects and personal differences, such as age
and personality, which possibly influence media use, are also deprecated.
Although some researchers in the past criticized and questioned the free choice of
audiences, the development of technology in these decades has enhanced user’s free choice
of media contents or media devices. Recently, the U&G approach has been widely used to
interpret the use of various media since the current media environment brings people to select
media individually and actively. While the influence has not been thoroughly revealed yet in
science fields, new media, especially social networking services or user-generated media,
change the world of entertainment, information, and communication (Shao, 2009). In this era,
media effects study itself is not enough for the description of user behaviors in multi-media
use, compared to the time when traditional media, such as television and radio, was the
mainstream.
Cross-cultural Adaptation
Another key factor of the purpose of this study is cultural adaptation. When people
go to other countries, they often encounter new things far different from their home countries.
The process of learning the rules, social norms, customs, and language of a new culture is
called cross-cultural adaptation. Adaptation is regarded as an active process of coping with

7
stress (Zhou et al., 2008). Although adaptation can be conceptualized in different ways,
culture shock is one of the elements of cultural adaptation. Culture shock is triggered by the
anxiety following the loss of familiar signs and symbols of social intimacies, oriented in daily
life (Oberg, 2006). Once people enter a strange country, the signs and symbols they are
familiar with are removed due to cultural differences (Oberg, 2006). Therefore, it is
necessary for people who are involved in cross-cultural encounters to be resilient, to adapt to
their surroundings, and to evolve from the stress these encounters produce (Zhou et al.,
2008).
Culture shock does not simply mean psychological factors; it is also composed of
some other elements. Katsu (1998) identified four elements of cultural adaptation based on
culture shock: psychological health, various emotions toward the host country, personal
relationships, and verbal communication. Katsu (1998) concluded that the level of culture
shock is influenced by other individual reasons. For example, personal relationships are
affected by gender. Also, the major of study, home region, and length of stay influences the
emotions toward the host country.
The level of cultural adaptation is measured in multiple ways, depending on which
elements of acculturation the researcher is trying to scale. For example, a 20-item
Cross-cultural Social-efficacy Scale for students developed by Fan and Mak (1998) is a major
method of measurement. It has four items to scale: absence of social difficulties, social
confidence, sharing interests, and friendship initiative. Socio-cultural Adaption Scale (SCAS)
is another scale, which measure behavioral adaptation and cognitive adaptation. Zhao (2010)
individually applies these scales to describe how much international students adapt to the host
country.

8
Models of Cultural Adjustment
As reviewed above, many recent researchers tend to identify specific items of
cultural adaptation, such as behavior and cognition, and scale them numerically. At the
beginning of the cross-cultural study, on the other hand, the level of cultural adjustment was
described more generally. The U-Curve model of cultural adaptation initiated by Lysgaard
(1955) is one of the first illustrations of the stages of cross-cultural adjustment, which has
been widely used in many related studies. Lysgaard (1955) hypothesized that “the cultural
adjustment as a process over time follows U shaped curve.” The U-Curve framework has
been used to explain the cultural adjustment process of employees or sojourners from
different cultural communities within the host country. (Black & Mendenhall, 1990).
Figure 1. U-Curve Model of Cultural Adaption

9
As Figure 1 shows, Lysgaard (1955) identified four stages of acculturation process.
Over the years, several other researchers have illustrated and developed the U-curved model
as shown in Figure 1, which refers to the levels of cross-cultural adjustment through four
stages of culture shock as Lysgard (1955) proposed. The first period is the Honeymoon Stage.
People in this phase are fascinated and infatuated with the new things by new surroundings,
such as the language, people and food. Therefore, they are able to optimistically deal with
cultural differences. The next Culture Shock Stage refers to the period of frustration and
rejection. The most significant change is communication. People feel psychological
depression brought by realization or misunderstanding as a foreigner in the new culture.
Differences between their home and host cultures create anxiety or anger, and their attitude
toward the new culture can be perceived as offensive. Even though they feel lonely, creating
new relationships can be difficult due to obstacles such as language barriers and different
styles of nonverbal communication. After the extreme stress of adapting to the new culture,
people start understanding and coping with the differences. This phase is called the Recovery
Stage. People feel more comfortable than they were during the Culture Shock Stage and
become more emotionally comfortable. Finally, the Adjustment Stage is the period when
people integrate into the host culture. They are satisfied with the new culture, and less effort
is necessary to function.
10
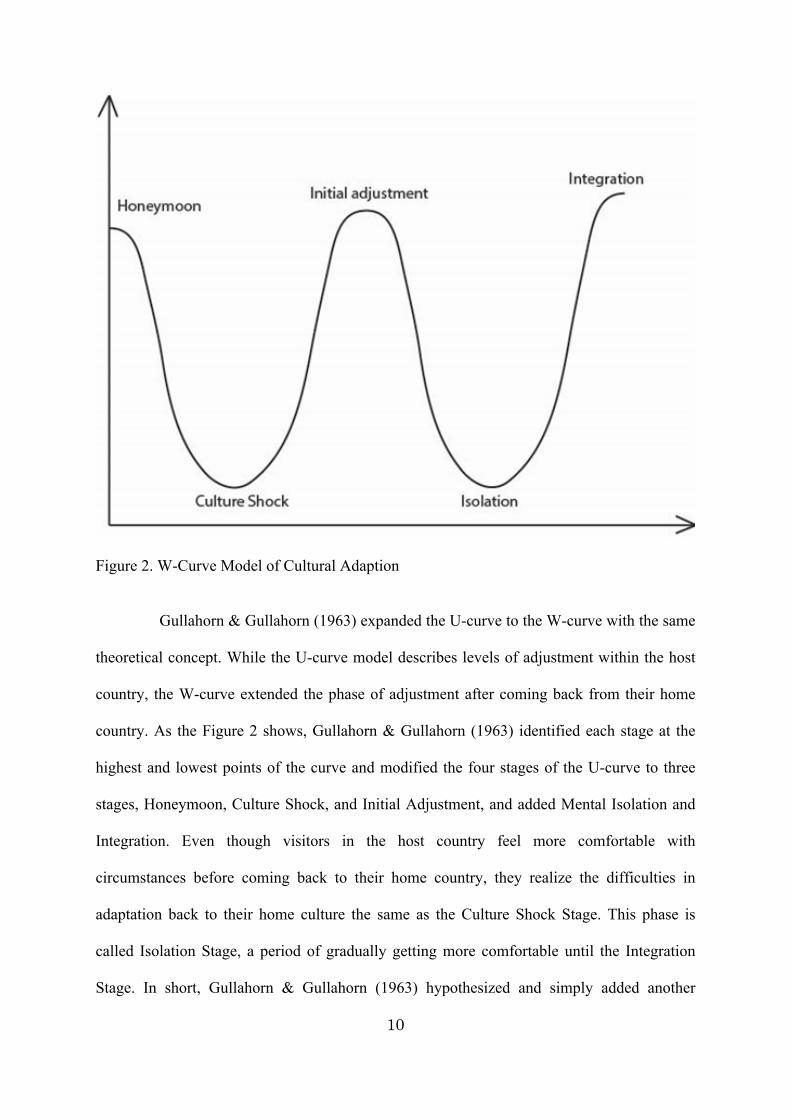
Figure 2. W-Curve Model of Cultural Adaption Gullahorn & Gullahorn (1963) expanded the U-curve to the W-curve with the same
theoretical concept. While the U-curve model describes levels of adjustment within the host
country, the W-curve extended the phase of adjustment after coming back from their home
country. As the Figure 2 shows, Gullahorn & Gullahorn (1963) identified each stage at the
highest and lowest points of the curve and modified the four stages of the U-curve to three
stages, Honeymoon, Culture Shock, and Initial Adjustment, and added Mental Isolation and
Integration. Even though visitors in the host country feel more comfortable with
circumstances before coming back to their home country, they realize the difficulties in
adaptation back to their home culture the same as the Culture Shock Stage. This phase is
called Isolation Stage, a period of gradually getting more comfortable until the Integration
Stage. In short, Gullahorn & Gullahorn (1963) hypothesized and simply added another

11
U-Curve to the Lysgaard’s (1955) U-Curve for after re-entry to the host country from their
home country.
U&G and Cross-Cultural Adaptation for International Students
Literature about international students’ media use was likely to combine U&G and
elements of the level of cultural adaptation to describe media use of international students.
While McQuail et al.’s (1972) four categories of motivation [(1) diversion, (2) personal
relationships, (3) personal identity, and (4) surveillance] is the standard in U&G study in
general, it is assumed that international students’ gratification for using media is different and
depends on whether they use media from home countries or host countries.
For example, Kim (2014) summarized seven gratifications of social media use for
international students: social support, information, maintenance of relationships with people
back home, social surveillance, adjustment, acculturation, and language improvement. Those
categories can be covered with McQuail et al.’s (1972) gratifications, but only home media
are able to satisfy maintenance of relationships with people back home. In contrast, only host
media can satisfy adjustment, acculturation, and language improvement. In Rahman’s (2014)
study, moreover, the reasons for using social networking sites by international students were
categorized into four groups: “connect with friends,” “connect with family,” and “find old
friends.” Also in this case, only host media enable them to connect to people in their home
countries, fulfilling the function of to “connect with family” and “find old friends.” Thus, it is
inevitable to consider host and home media separately through investigations of media use of
international students.
Moreover, the choice of which countries’ media they use influences the level of
cultural adaptation. Park et al. (2014) also indicated that international students, who use more
home social media, tend to get stressed in the process of acculturation in the host countries.
On the other hand, host media use has related to the enhancement of their cultural adaptation.

12
In other words, people more culturally adapted to the new culture are likely to use host media.
Zhu and Krever (2017) claimed international students’ use of some host media devices is
correlated with their level of cultural adaptation. Indeed, it turned out international students
who read newspapers tend to belong to a group with a higher level of cultural adaptation in
their study. U&G and cultural adaptation are an inseparable relationship to understand
media use of international students.
Research Questions
Through reviews of literature related to the purpose of this thesis, it is obvious
U&G is the best approach to investigate international students’ media use and the relationship
with the level of cultural adaptation. The author realized recent studies rarely measure
cultural adjustment in general and became interested in exploring the measurement of how
international students’ media use is correlated by cultural adjustment stage (CAS) proposed
by Lysgaard (1955). It seems the U-Curved model is more appropriate than the W-Curved
model since media use in America would be described only during the term of four stages of
U-Curve. Therefore, this study poses three research questions.
RQ1: Is there a correlation between media using patterns in America and CAS?
RQ2: Is there a correlation between interest of American news and CAS?
RQ3: Is there a correlation between the purpose of American media use and CAS?

13
CHAPTER 3
METHODOLOGY
This chapter is divided into four sections. First, the approach and strategy for this
study is explained. The second section offers the method of data collection. The third section
represents participants of this survey, and the final section represents the demographic
information of participants.
Approach
This study aims to examine the correlation between media use and cultural
adaptation of international students. To identify the levels of cultural adjustment, Lysgaad’s
U-Curve model of cultural adaptation was employed. It has a visual illustration and simple
stages widely applied to variety of cross-cultural communication theories.
The CAS model includes four stages: Honeymoon, Culture Shock, Recovery, and
Adjustment. Although some researchers propose statistical measurement of the level of
cultural adaptation, like the sociocultural adaptation scale by Furnham and Bochner (1982),
the relationship with the Lysgaad’s four stages of cultural adaptation is considered uncertain.
For example, both the beginning and the end of U-Curve model are in higher level of
adjustment, but the measurement of levels of sociocultural adaptation scale is unable to
explain which stage of cultural adaptation the score shows. Therefore, respondents were
categorized into these stages by self-report with description of Lysgaad’s (1955) U-Curve
model. After the classification of CAS, the relationship with media use and interest were
investigated.
Data Collection
For data collection, surveys were conducted by three strategies: online, paper based,
and interview. The online survey was organized through Google Forms, and the link to the
survey was sent to all international students at Marshall University using international

14
mailing lists by international office at Marshall University. The online survey opened on
November 29, 2016, and closed on January 30, 2017. Interviews and paper-based surveys
were conducted from November 20 to January 16 on campus at Marshall University.
The research requires finding respondents from each CAS. Therefore, the
consideration of language ability was necessary especially for students who had just arrived
in America. Regarding the limitation of language efficiency of international students who are
not native English speakers, both in-person and written surveys were conducted for
alleviation of difficulties of reading and writing with in-person interview and of listening and
speaking with online and paper based surveys. A native Japanese speaker, the author,
sometimes translated into Japanese the survey questions to respondents originally from Japan
during interviews.
Regarding the difference of English fluency and expressions, the number of survey
questions were selected and arranged through consultation with several international students,
including one of the Japanese respondents. All of the strategies for data collection employed
the same twenty questions. The survey contains three sections: demographic questions, CAS,
and media use. Survey questions were arranged by testing with some of respondents, to be
complete in about ten minutes for people with about 78 on TOEFL ibt score, which is the
criterion for enrollment to undergraduate at Marshall University. International students at
Marshall University are classified into three categories: ESL (INTO Marshall), undergraduate,
and graduate. INTO is an English language school located on campus of Marshall University.
INTO is partnered with Marshall University and assists international students who are eager
to study English or aim to enroll at Marshall University. Therefore, it is considered the
English score would be the most appropriate standard for collecting pure data, reducing the
risks of abstention or misunderstanding.

15
The first section had seven questions to describe demographic data. The questions
included gender, home country, age and length of staying in America. Gender was asked in
multiple-choice form and the other questions were in narrative form. For classification of
cultural adaptation stages, one multiple-choice question asked which CAS they would be in.
CAS was determined by self-report. In order to distinguish among the stages and obtain
accurate self-assessments, descriptions of each stage were added beside selections of the
name of the CAS. Regarding the language limitation, the descriptions were expressed with
only several words with characteristics of each stage. Finally, 16 questions were asked to
investigate their patterns of interest and media use. For RQ1, participants were asked to
choose how often they use a certain medium in America and in their home countries. For
RQ2, 12 items of American news categories, such as weather, crime, and sports, were chosen.
Participants were asked to check the items from the list as many as they are interested in. For
RQ3, the purpose of using American media was assessed in 4-point Likert scales to obtain
numerical data. Participants chose one from four items: strongly disagree, disagree, agree,
and strongly agree, depending on whether their use of American media suits each statement.
The statements used in this question were derived from the four types of U&G proposed by
McQuail et al. (1972): (1) diversion, (2) personal relationships, (3) personal identity, and (4)
surveillance.
Participants
Sixty-two international students at Marshall University participated in this study.
The age range is from 18 to 32, in average of 24.5. Females represented 41.9% of participants
(n=26), and 58.1% (n=36) were male. They are graduate students (41.9%), INTO students
(48.4%), freshman (4.8%), and junior, senior and exchange students were the same number
(1.6%). They are from 16 different countries, including China (33.9%), Japan (14.5%) and

16
India (9.7%). Their average length of stay in America is ten months. The longest stay was 3
years, while the shortest was 4 days.
Data Analysis and Measurement
To answer RQ1, data analysis focused on three survey questions: daily time of
using media in America, time of using American news media, and time of using media from
their home countries. For RQ2, data analysis focused on two aspects, the total number of
interests in American news categories and which categories they are interested in. For RQ3,
the intensity of motivation in using American media on each item, described as numbers from
1-4, were analyzed. The same three steps below were repeatedly conducted to answer RQ1 to
RQ3. First, the author categorized the data into four stages and showed the statistical
description. Second, CAS was converted to number from 1 to 4 in order of stages. Then,
Kruskal-Wallis Test was used to determine whether there was a difference among CAS.
Finally, if the test in the second step indicated there was a significant difference in a certain
item, the correlation between the variable and stages were examined by Spearman’s
rank-order correlation. Spearman’s rank-order correlation determines linear correlation
relationship following the rank. Therefore, the numbers given in the cultural adaptation
stages were altered following the order of mean rank to attain more pure results of connection
between variables.

17
CHAPTER 4
RESULTS
General Findings
The most popular range of time using media in America was 3-4 hours on a daily
basis (43.5%, n=27), followed by 1-2 hours (22.6%, n=14), more than 5 hours (17.7%, n=11),
and less than 1 hour (16.1%, n=10). Among all participants, time spent using home country
media is more dominant than time spent using home country media. As Figure 4 shows,
22.6% (n=14) of respondents use American news media daily or more while 58.1% (n=36)
check news about home countries. Also, 29% (n=18) of respondents rarely use American
news media while only 6.5% (n=4) rarely reach to news in their home countries. To check
American news, they use social media the most (n=59, 95.2%), and following are television
(n=22, 35.5%) and newspaper (n=10, 16.1%). For news about their home countries, they also
use social media the most (n=59, 95.2%), and others after are newspaper (n=21, 33.9%) and
television (n=5, 8.1%). This result shows social media is the main source of information for
most participants. From the self-classification on the survey, the 62 respondents were
categorized as 21% (n=13) in Honeymoon stage, 25.8% (n=16) in Culture Shock stage, 21%
(n=13) in Recovery stage, and 32.3% (n=20).

18
Figure 3. Time Using Media in America
Figure 4. Respondents in each CAS
>5 18%
3-4 43%
1-2 23%
<1 16%
Honeymoon 21%
Culture Shock 26% Recovery
21%
Adjustment 32%

19
RQ1. Media use and cultural adaptation stage
RQ1 (1) Descriptive Statistics
Description of time using media in America categorized into CAS is represented on
Table 1. Participants’ daily use of media in America are represented as follows: 1=5 hours,
2=3-4 hours, 3=1-3 hours, and 4=less than 1 hour. The minimum and maximum time of using
media in America were the same results in each CAS. However, the answers spread more
widely in Adjustment Stage (SD=1.137). Means of time using media in America were in a
range of 2.08 to 2.65. In the first two stages, respondents reported less time of media
consumption in America (Honeymoon: M=2.08, Culture Shock: M=2.13) than those in the
later two stages (Recovery: M=2.62, Adjustment: M=2.65).
Table 2 represents the frequency of using American news media in each CAS.
Participants’ frequency of using American news are represented as follows: rarely, 2= several
times a month, 3=several times a week, and daily or more. Only in Recovery Stage, the
maximum point was 3, which means nobody used American news media daily or more, while
people access American news everyday in other stages. Means of frequency of using
American news media were relatively more different than the time using media in America.
Means of this item in each CAS were in a range of 1.63 (Culture Shock) to 2.90
(Adjustment).
Table 3 shows the frequency of using news media about home countries in each
CAS. Participants’ frequency of using news media about home countries are represented as
follows: rarely, 2= several times a month, 3=several times a week, and daily or more. Culture
Shock Stage is the only one in which everyone accesses news of the home countries several
times a week or more (Minimum=3). Means of each CAS, on the other hand, were all more
than 3. It demonstrated that participants check news about home countries more than
American news, according to the means of each items.

20
N Minimum Maximum M SD Honeymoon 13 1 4 2.08 .862 Cultureshock 16 1 4 2.13 .806 Recovery 13 1 4 2.62 .870 Adjustment 20 1 4 2.65 1.137 Table 1. Time using media in America categorized by CAS N Minimum Maximum M SD Honeymoon 13 1 4 2.85 1.214 Cultureshock 16 1 4 1.63 1.147 Recovery 13 1 3 2.54 .660 Adjustment 20 1 4 2.90 1.021 Table 2. Frequency of using American news media categorized by CAS N Minimum Maximum M SD Honeymoon 13 1 4 3.38 .870 Cultureshock 16 3 4 3.81 .403 Recovery 13 1 4 3.00 .913 Adjustment 20 1 4 3.25 1.070
Table 3. Frequency of using news media of home countries categorized by CAS
RQ1 (2) Difference Among CAS
To find the difference of each item among CAS, CAS was converted to numbers; 1
for Honeymoon stage, 2 for Culture Shock stage, 3 for Recovery stage, and 4 for Adjustment
stage.
From the results shown in Table 5, the p-value is lower than .05 only in time using
American news media (p=.006). Therefore, there was not a significant difference among CAS
in time using media in America (p=.196), and there was not significant difference in the
frequency of using news media of home countries (p=.056), while there was a significant
difference among CAS in using American news media.

21
CAS N Time American Home 1 13 25.92 37.19 31.08 2 16 26.94 18.88 39.53 3 13 36.04 31.65 23.27 4 20 35.83 37.80 30.70
Total 62 Table 4. Kruskal-Wallis Test: Mean Rank Time American Home Chi-Square 4.695 12.486 7.564 df 3 3 3 Asymp. Sig. .196 .006 .056 Table 5. Test Statistics: Kruskal Wallis Test and Grouping Variable (CAS)
RQ1 (3) Correlation with CAS
There was a significant difference only for the frequency of using American news
media among CAS, so the correlation between these two variables was tested in this step. In
order to examine the correlation, the order of stage changed to ascending to apply
Spearman’s rank order correlation, which examines the significance of linear correlation.
According to Table 4, ascending order of mean will be Culture Shock (Mean
Rank= 18.88), Recovery (Mean Rank= 31.65), Honeymoon (Mean Rank=37.19), and
Adjustment (37.80). Therefore, numbers were assigned to each CAS as follows: 1=Culture
Shock, 2=Recovery, 3=Honeymoon, and 4=Adjustment. From the results represented in
Table 6, p-value for this test was .001 (p<0.01). There was a moderate correlation with an
uphill linear relationship (r=.40<.413<.59) between tested variables and grouping variables.
In other words, there was a moderate correlation between the frequency of time using
American media and original CAS with weakly u-curved as shown in the Figure 5.

22
Figure 5. Error Bar Graph: the frequency of using American media and CAS
CAS AmericanNews Spearman's rho CAS Correlation Coefficient 1.000 .413**
Sig. (2-tailed) . .001 N 62 62
AmericanNews Correlation Coefficient .413** 1.000 Sig. (2-tailed) .001 . N 62 62
**. Correlation is significant at the 0.01 level (2-tailed). Table 6. Spearman’s rank order correlation: the frequency of using American media and CAS

23
RQ2: Interest of American news and cultural adaptation stage
RQ2 (1) Descriptive Statistics
Participants selected from a list of categories of American news as many as they
wanted. To analyze collected data, nominal answers were converted to numbers:
0=unselected, and 1=selected. For this research question, each category and total number of
interest categories were divided into CAS. The item of “Count”on Table 7 represents how
many categories they selected in total. Also, comparing the means, one of the findings is that
weather news was much higher than other categories (Honeymoon: M=.85, Culture
Shock:M=.94, Recovery: M=.77, Adjustment: M=.94). Another finding is that there was no 0
at maximum, except the items of Other, in Honeymoon, Recovery, Adjustment, while Culture
Shock stage has three categories of 0s. Participants in Adjustment Stage (M= 5) were
interested in wider areas of news contents, twice as much as the ones in Culture Shock Stage
(M=2.38).
Items N Minimum Maximum M SD
Entertainment 13 0 1 .54 .519 Weather 13 0 1 .85 .376 Crime 13 0 1 .31 .480 Economy 13 0 1 .15 .376 Sport 13 0 1 .31 .480 Art/ Music 13 0 1 .54 .519 Business 13 0 1 .15 .376 Politics 13 0 1 .38 .506 Science/ Nature 13 0 1 .08 .277 Health/ Medical 13 0 1 .23 .439 Education 13 0 1 .08 .277 Other 13 0 1 .15 .376 Count 13 1 8 3.77 1.833
Table 7. Categories and the Number of Interested News Contents in Honeymoon Stage

24
Items N Minimum Maximum M SD Entertainment 16 0 1 .19 .403 Weather 16 0 1 .94 .250 Crime 16 0 1 .38 .500 Economy 16 0 0 .00 .000 Sport 16 0 1 .31 .479 Art/ Music 16 0 1 .13 .342 Business 16 0 1 .19 .403 Politics 16 0 1 .19 .403 Science/ Nature 16 0 0 .00 .000 Health/ Medical 16 0 0 .00 .000 Education 16 0 1 .06 .250 Other 16 0 0 .00 .000 Count 16 1 7 2.38 1.668
Table 8. Categories and the Number of Interested News Contents in Culture Shock Stage
Items N Minimum Maximum M SD Entertainment 13 0 1 .54 .519 Weather 13 0 1 .77 .439 Crime 13 0 1 .69 .480 Economy 13 0 1 .08 .277 Sport 13 0 1 .31 .480 Art/ Music 13 0 1 .15 .376 Business 13 0 1 .23 .439 Politics 13 0 1 .46 .519 Science/ Nature 13 0 1 .23 .439 Health/ Medical 13 0 1 .08 .277 Education 13 0 1 .08 .277 Other 13 0 0 .00 .000 Count 13 2 6 3.62 1.261
Table 9. Categories and the Number of Interested News Contents in Recovery Stage
Items N Minimum Maximum M SD
Entertainment 20 0 1 .60 .503 Weather 20 0 1 .80 .410 Crime 20 0 1 .45 .510 Economy 20 0 1 .40 .503 Sport 20 0 1 .55 .510 ArtMusic 20 0 1 .30 .470 Business 20 0 1 .35 .489 Politics 20 0 1 .70 .470 ScienceNature 20 0 1 .20 .410 HealthMedical 20 0 1 .30 .470 Education 20 0 1 .35 .489 Other 20 0 0 .00 .000 Count 20 1 11 5.00 2.271
Table 10. Categories and the Total Number of Interested News Contents in Adjustment Stage

25
RQ2 (2) Difference Among CAS
The results from Table 12 show the items that the p-value is lower than 0.05 were
Economy (p=.012), Politics (p=.023), and Counts (p=.001). Therefore, there were significant
difference among CAS in the interest of economy, politics, and the number of interested
categories of American news content. On the other hand, this test concludes the interest of
weather especially has similar response among CAS (p=.612).
Items 1: Honeymoon 2:Culture Shock 3: Recovery 4:Adjustment
Entertainment 33.69 22.81 33.69 35.60 Weather 31.73 34.56 29.35 30.30 Crime 27.04 29.13 38.96 31.45 Economy 30.77 26.00 28.38 38.40 Sport 29.04 29.19 29.04 36.55 Art/ Music 39.69 26.88 27.77 32.30 Business 28.77 29.81 31.15 34.85 Politics 29.42 23.31 31.81 39.20 Science/ Nature 29.88 27.50 34.65 33.70 Health/ Medical 33.65 26.50 28.88 35.80 Education 28.88 28.44 28.88 37.35 Other 35.27 30.50 30.50 30.50 Count 32.04 17.66 31.85 42.00 Table 11. Kruskal-Wallis Test: Mean Rank Chi-Square df Asymp.Sig. Entertainment 6.862 3 .076 Weather 1.815 3 .612 Crime 4.435 3 .218 Economy 11.009 3 .012 Sport 3.250 3 .355 Art/ Music 7.246 3 .064 Business 2.057 3 .561 Politics 9.573 3 .023 Science/ Nature 4.701 3 .195 Health/ Medical 6.955 3 .073 Education 7.662 3 .054 Other 7.664 3 .053 Count 16.656 3 .001 Table 12. Test Statistics: Kruskal Wallis Test and Grouping Variable (CAS)

26
RQ2 (3) Correlation with CAS
The significant differences among CAS were found in the items of Politics,
Economy, and Counts in step 2. The correlation between these three items and CAS were
tested by Spearman’s rank order correlation with reordering CAS with ascending number of
mean rank. For the Economy, the numbers for mean rank was assigned as follows: 1=Culture
Shock (Mean Rank=26.00), 2=Recovery (Mean Rank=28.38), 3=Honeymoon (Mean
Rank=30.77), and 4=Adjustment (Mean Rank=38.40). From the results represented in
Table15, p-value for this test was .001(p<0.01). There was a moderate correlation with an
uphill linear relationship (r=.40<.412<.59) between tested variables and grouping variables.
In other words, there was a moderate correlation between the interest of economy as news
content in America and original CAS with weakly u-curved as shown in the Figure 6.
Figure 6. Error Bar Graph: Politics and CAS

27
CAS Economy Spearman's rho CAS Correlation Coefficient 1.000 .412**
Sig. (2-tailed) . .001 N 62 62
Economy Correlation Coefficient .412** 1.000 Sig. (2-tailed) .001 . N 62 62
**. Correlation is significant at the 0.01 level (2-tailed). Table 13. Spearman’s rank order correlation: Economy and CAS
For Politics, the numbers for mean rank were assigned as follows: 1=Culture Shock
(Mean Rank=29.42), 2=Recovery (Mean Rank=23.31), 3=Honeymoon (Mean Rank=31.81),
and 4=Adjustment (Mean Rank=39.20).
From the results represented in Table17, p-value for this test was .005 (p<0.01).
There was a weak correlation with an uphill linear relationship (r=.20<.315<.39) between
tested variables and grouping variables. In other words, there was a weak correlation between
the interest of politics as an American news content and original CAS with weakly u-curved
as shown in the Figure7.

28
Figure 7. Error Bar Graph: Politics and CAS CAS Politics Spearman's rho CAS Correlation Coefficient 1.000 .356**
Sig. (2-tailed) . .005 N 62 61
Politics Correlation Coefficient .356** 1.000 Sig. (2-tailed) .005 . N 61 61
**. Correlation is significant at the 0.01 level (2-tailed). Table 14. Spearman’s rank order correlation: Politics and CAS
For the number of interested categories of American news content, the numbers for
mean rank are assigned as follows: 1=Culture Shock (Mean Rank=32.04), 2=Recovery
(Mean Rank=17.66), 3=Honeymoon (Mean Rank=31.85), and 4=Adjustment (Mean
Rank=42.00). From the results represented in Table 15, p-value for this test was .000
(p<0.01). There was a moderate correlation with an uphill linear relationship

29
(r=.40<.502<.59) between tested variables and grouping variables. In other words, there was
a moderate correlation between the number of interested categories of American news
contents and original CAS with moderately u-curved as shown in the Figure 8.
Figure 8. Error Bar Graph: Economy and CAS CAS Counts Spearman's rho CAS Correlation Coefficient 1.000 .502**
Sig. (2-tailed) . .000 N 62 62
Counts Correlation Coefficient .502** 1.000 Sig. (2-tailed) .000 . N 62 62
**. Correlation is significant at the 0.01 level (2-tailed). Table 15. Spearman’s rank order correlation: Counts and CAS

30
RQ3: Uses and gratification of American media and cultural adaptation stage
RQ3 (1) Descriptive Statistics
Participants selected numbers from 1 to 4 to indicate each purpose for using
American media (1=strongly disagree, 2=disagree, 3=agree, and 4=strongly agree).
Comparing the means of each item in Honeymoon Stage, as represented in Table 16, the most
popular motivation of using American media was language skill (M=3.67), while fewer
participants reported using American media to learn topics for conversations with American
people (M=2.50). The same tendency was seen in Culture Shock Stage. Although the least
popular motivation was for conversation topics in all CAS, the most popular purpose was the
item of Know Surroundings on Table 16-19 in Recovery Stage (M= 3.38) and Adjustment
Stage (M=3.70).
N Minimum Maximum M SD Language skill 12 2 4 3.67 .651 Know surroundings 12 3 4 3.58 .515 Diversion 12 1 4 3.00 1.128 Self-improvement 12 1 4 3.42 .900 Know American culture 12 3 4 3.58 .515 Conversation topic 12 1 4 2.50 1.243 Table 16. Motivation of Using American Media in Honeymoon Stage
N Minimum Maximum M SD Language skill 16 1 4 2.94 .772 Know surroundings 16 1 3 2.69 .602 Diversion 16 1 4 2.25 .775 Self-improvement 16 1 4 2.31 1.014 Know American culture 16 1 4 2.81 .655 Conversation topic 16 1 3 1.44 .629 Table 17. Motivation of Using American Media in Culture Shock Stage N Minimum Maximum M SD Language skill 13 2 4 3.15 .555 Know surroundings 13 2 4 3.38 .650 Diversion 13 1 4 3.00 1.155 Self-improvement 13 2 4 2.92 .641 Know American culture 13 1 4 2.46 .877 Conversation topic 13 1 4 2.38 .768 Table 18. Motivation of Using American Media in Recovery Stage

31
N Minimum Maximum M SD Language skill 20 1 4 2.80 1.056 Know surroundings 20 3 4 3.70 .470 Diversion 20 1 4 2.85 1.089 Self-improvement 20 1 4 3.20 .894 Know American culture 20 2 4 2.95 .759 Conversation topic 20 1 4 2.75 .967
Table 19. Motivation of Using American Media in Adjustment Stage
RQ3 (2) Difference among CAS
The results from Table 21 shows the items that the p-value is lower than 0.05 were
only in self-improvement (p=.012). Therefore, there was significant difference among CAS
in the intensity of needs for self-improvement. On the other hand, this test concludes
respondents from each CAS have similar response for the needs to know surroundings
(p=.612) and know American culture (p=.355).
Items 1: Honeymoon 2: Culture Shock 3: Recovery 4:Adjustment
Language skill 44.08 27.69 31.15 26.60 Know surroundings 35.85 16.09 32.35 40.45 Diversion 35.73 22.72 35.77 33.00 Self-improvement 40.08 20.56 29.31 36.10 Know American culture 45.85 28.75 21.27 31.03 Conversation topic 35.58 17.00 33.19 39.35 Table 20. Kruskal-Wallis Test: Mean Rank Chi-Square df Asymp.Sig. Language skill 6.862 3 .076 Know surroundings 1.815 3 .612 Diversion 4.435 3 .218 Self-improvement 11.009 3 .012 Know American culture 3.250 3 .355 Conversation topic 7.246 3 .064 Table 21. Test Statistics: Kruskal Wallis Test and Grouping Variable (CAS)

32
RQ3 (3) Correlation with CAS
The significant differences among CAS were found in the items of
self-improvement in step 2, so the correlation between the intensity of needs of American
media for self-improvement and CAS were tested by Spearman’s rank order correlation.
The numbers for mean rank for self-improvement is assigned as follows: 1=Culture
Shock (Mean Rank=20.56), 2=Recovery (Mean Rank=29.31), 3=Adjustment (Mean
Rank=36.10), and 4=Honeymoon (Mean Rank=40.08).
From the results represented in Table 22, p-value for this test was .001 (p<0.01).
There was a moderate correlation with an uphill linear relationship (r=.40<.427<.59) between
tested variables and grouping variables. In other words, there was a moderate correlation
between the intensity of needs for self-improvement and original CAS with weakly u-curved
as shown in the Figure 9.

33
Figure 9. Error Bar Graph: Self-improvement and CAS
CAS Self-Improvement Spearman's rho
newCAS Correlation Coefficient 1.000 .427** Sig. (2-tailed) . .001 N 62 62
Self-Improvement Correlation Coefficient .427** 1.000 Sig. (2-tailed) .001 . N 62 62
**. Correlation is significant at the 0.01 level (2-tailed).
Table 22. Spearman’s rank order correlation: Self-improvement and CAS

34
CHAPTER 5
CONCLUSION
Although this study was an explorative trial to integrate two theoretical frameworks,
uses and gratification theory and Lysgaard’s (1955) U-curve of cultural adaptation, five items
as summarized in Table 23, had a moderate or weak correlation with the stages of cultural
adaptation. All items contained the points of U-curve when respondents were categorized into
CAS, as well as the U-curved model of cultural adaptation (Lysgaad 1955) with the lowest
point at Culture Shock stage and the highest point either at Honeymoon stage or Adjustment
stage.
Items Nonlinear U-curve Minimum Maximum p r
American News ✔ ✔ Culture Shock Adjustment .001 .413
Economy ✔ ✔ Culture Shock Adjustment .001 .412
Politics ✔ ✔ Culture Shock Adjustment .005 .356
Count ✔ ✔ Culture Shock Adjustment .000 .502
Self-improvement ✔ ✔ Culture Shock Honeymoon .001 .427 Table 23. Lists of Results with Correlation
Significant difference in the frequency of checking news about home countries
could not be seen among CAS in this study, while there was a significant difference in the
frequency of using American news. The daily time of media use also does not have a
significant difference among CAS. These results suggest the importance of news about home
countries might be immutable, while the importance of American news might increase as the
level of cultural adjustment. Indeed, 75.8% of participants in this survey (n=47) believed
news about home countries is more important. On the other hand, only 11.3% (n=7)
perceived American news as more important than home country news, and 12.9% (n=8)
considered both are equally important. This result supports the idea of Sin et al. (2011) that
international students perceive news about home countries as more important.
35
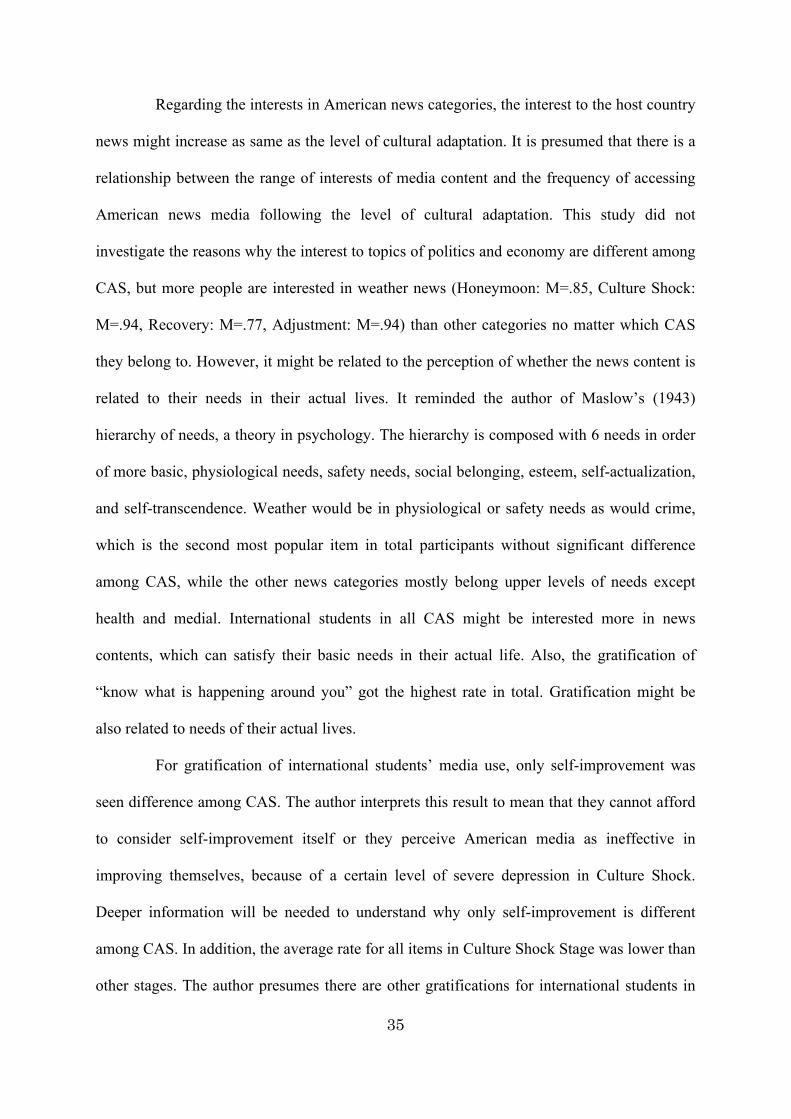
Regarding the interests in American news categories, the interest to the host country
news might increase as same as the level of cultural adaptation. It is presumed that there is a
relationship between the range of interests of media content and the frequency of accessing
American news media following the level of cultural adaptation. This study did not
investigate the reasons why the interest to topics of politics and economy are different among
CAS, but more people are interested in weather news (Honeymoon: M=.85, Culture Shock:
M=.94, Recovery: M=.77, Adjustment: M=.94) than other categories no matter which CAS
they belong to. However, it might be related to the perception of whether the news content is
related to their needs in their actual lives. It reminded the author of Maslow’s (1943)
hierarchy of needs, a theory in psychology. The hierarchy is composed with 6 needs in order
of more basic, physiological needs, safety needs, social belonging, esteem, self-actualization,
and self-transcendence. Weather would be in physiological or safety needs as would crime,
which is the second most popular item in total participants without significant difference
among CAS, while the other news categories mostly belong upper levels of needs except
health and medial. International students in all CAS might be interested more in news
contents, which can satisfy their basic needs in their actual life. Also, the gratification of
“know what is happening around you” got the highest rate in total. Gratification might be
also related to needs of their actual lives.
For gratification of international students’ media use, only self-improvement was
seen difference among CAS. The author interprets this result to mean that they cannot afford
to consider self-improvement itself or they perceive American media as ineffective in
improving themselves, because of a certain level of severe depression in Culture Shock.
Deeper information will be needed to understand why only self-improvement is different
among CAS. In addition, the average rate for all items in Culture Shock Stage was lower than
other stages. The author presumes there are other gratifications for international students in

36
Culture Shock Stage, or their negative feelings toward American culture influenced their
response.
In conclusion, this study succeeded in finding the correlated relationship between
five items of media use and CAS, which also described the points of the U-Curve The results
suggest that there would be two clear groups of international students’ American media use:
things they highly share through all CAS and things decreased in Culture Shock Stage. Also,
this study would be meaningful by the reason of finding more possible topics inside and
outside of theoretical frameworks to develop understanding media use of international
students.
Limitations and Future Suggestions
This study relied on the methodology established by the author, emerging from the
previous studies and conceptual theory of cross-cultural study, to measure the relationship
between media use and CAS of international students at Marshall University. Therefore, it
was considered there are mainly three limitations: self-reported data, cultural diversity of the
sample, and language limitations. The 62 participants of the survey were from 16 different
countries, including China (33.9%), Japan (14.5%) and India (9.7%). While the subject of
this study included international students from variety of countries, the differences of their
home cultures might influence the perceptions or patterns of media use. Also, CAS of
participants was thoroughly classified by self-report because a method of scaling CAS has
not been established. For international students who had just arrived in America, reading or
speaking might be difficult, while the level of English in the survey was adjusted to the
criteria for enrollment in undergraduate school. With these limitations, the results found in
this study would not be used as a predictive tool. The author suggests that the established
scales of CAS will help improve reliability. Also, focusing on a certain nationality as a
subject is expected to eliminate the concerns of their different home cultures.

37
REFERENCES
Black, J.S. & Mendenhall, M. (1990). Cross-cultural training effectiveness: A review and a theoretical framework for future research. Academy of Management Review, 15(1), 113-136.
Blumler, J. G., Gurevitch, M., & Katz, E. (1985). Reaching out: A future for gratifications research. In K. E. Rosengren, L. A. Wenner & P. Palmgreen (Eds.), Media gratifications research: Current perspectives (pp. 255- 273). Beverly Hills: Sage.
Fan, C., & Mak, A. S. (1998). Measuring social self-efficacy in a culturally diverse student population. Social Behavior and Personality, 26(2), 131-144.
Furnham, A., & Bochner, S. (1982) Social difficulty in a foreign culture: An empirical analysis of culture shock. In Cultures In Contact: Studies In Cross-cultural Interaction, S. Bochner (ed.), Oxford: Pergamon, 161-98.
Gullahorn, J., E., & Gullahorn, J., T. (1963). An extension of the U-Curve hypothesis. Journal of Social Issues, 19, 33-47.
Herzog, H. (1941). Professor quiz: A gratifications study. Radio Research 1941. In P. F. Lazarsfe1d & N. F. Stanton (eds.), New York: Duell, Sloan and Pearce.
Katsu, B. (1998). Research of international students’ cross-cultural adaptation: Application of questionnaire and semi-structured interview. Journal of developmental psychology, 331-332.
Katz, E. (1987). Communications research since Lazarsfeld. Public Opinion Quarterly, 51 (4 Part 2), 25-45.
Katz, E., Blumler, J. G., & Gurevitch, M. (1974). Utilization of mass communication by the individual. The uses of mass communications: Current perspectives on gratifications research (pp.19-32). Beverly Hills, CA: Sage.
Katz, E., Blumler, J. G., & Gurevitch, M. (1974). Uses and gratifications research. The Public Opinion Quarterly, 37 (4), 509-523.
Kim, J. (2014). The main uses and gratifications of Facebook use for international students in Hawaii, Honolulu, HI: University of Hawaii.
Lazarsfeld, P. F. (1941). Remarks on administrative and critical communications research. Studies in Philosophy and Science, 9, 3-16.
Liu, W. (2015). A historical overview of uses and gratifications theory. Cross-Cultural Communication, 11( 9), 71-78. DOI:10.3968/7415/.
Lysgaard, S. (1955). Adjustment in a foreign society: Norwegian Fulbright grantees visiting the United States. International Social Science Bulletin, 7, 45-51.

38
Melkote, S, R., & Liu, D. J. (2000). The role of the Internet in forging a pluralistic integration: A study of Chinese intellectuals in the United States. Gazette, 62, 495-504.
McQuail, D., & Windahl, S. (1981). Communication models for the study of mass communications.
McQuail, D. (1994). The rise of media of mass communication. Mass communication theory: An introduction, 1-29
McQuail, D., Blumler, J., & Brown, J. (1972). The television audience: A revised perspective. In D. McQuail (Ed.), Sociology of mass communications, 135–165.
Oberg, K. (2006). Cultural shock: Adjustment to new cultral environments. Curare 29, 2 (3), 142-146.
Palmgreen, P., Wenner, L. A., & Rayburn II, J. D. (1981). Gratification discrepancies and news program choice. Communication Research, 8, 451-478.
Park, N., Song, H., Lee, K.,M.(2014). Social networking sites and other media use, acculturation stress, and psychological well-being among East Asian college students in the United States. Computers in Human Behavior, 36, 138–146.
Padilla, A. M. (Ed.). (1980). Acculturation: Theory, models and some new findings.
Washington, DC: Westview.
Rubin, A. M. (1983). Television uses and gratifications: The interactions of viewing patterns and motivations. Journal of Broadcasting, 27, 37-51.
Rui, J., R. & Stefanone, M., A. (2016). The desire for fame: An extension of uses and gratifications theory, Communication Studies.
Rahman N. (2014). The usage and online behavior of social networking sites among international students in New Zealand. The Journal of Social Media in Society, 3(2), 65-81.
Roy, S., K. (2008). Determining Uses and Gratifications for Indian Internet Users. CS-BIGS 2(2), 78-91.
Ruggiero, T., E. (2000). Uses and Gratifications Theory in the 21st century. Mass Communication & Society, 3(1), 3-37.
Severin, W., J., & Tankard, J., W. (1997). Uses of mass media. Communication theories: Origins, methods, and uses in the mass media.
Sin, S., J., Kim, K., Yang, J., Park, J., & Laugheed, Z., T. (2011). International students' acculturation information seeking: Personality, information needs and uses. The Journal of Academic Librarianship, 48(1), 1-4. DOI: 10.1002/meet.2011.14504801222.

39
Shao, G. (2009).Understanding the appeal of user-generated media: a uses and gratification perspective. Internet Research, 19 (1), 7-25.
Tanaka, H. (2007). Mass Communication and consumer behavior: Attitude and persuasion. Introduction to Consumer Behavior 43(4), 85-59.
Ting-Toomey, S., Yee-Jung, K., K., Shapiro, R., B., Garcia, B., Wright, T., j., & Oetzel, J., G. (2000). Ethnic/cultural identity salience and conflict styles in four US ethnic groups. International Journal of Intercultural Relations, 24(1),47-81.
Wimmer, R. D., & Dominick, J. R. (1994). Mass media research: An introduction. Belmont, CA: Wadsworth.
Wong, W. (2016). Media use of international students: Acceptance of international news and cross-cultural adaptation. Modern Social Study, 62, 109-125.
Ward, C., Okura, Y., Kennedy, A., & Kojima, T. (1998). The u-curve on trial: A longitudinal study of psychological and sociocultural adjustment during cross-cultural transition. International Journal of Intercultural Relations, 22, 277-291
Zhao, L. (2010). Socio-cultura Adjustmnet of international students as expatriates in America. Bowling Green, KY: Western Kentucky University.
Zhou, Y., Jindal-Snape, D., Topping, K. & Todman, J. (2008). Theoretical models of culture shock and adaptation in international students in higher education, Studies in Higher Education, 33(1), 63-75, DOI: 10.1080/03075070701794833.
Zhu, P., & Krever, R. (2017). Media use and cultural adaptation by foreign students in Chinese universities. Journal of Media & Cultural Studies, 31 (2), 307-324

40
APEENDIX A: OFFICE OF INTEGRITY APPROVAL LETTER
- 1 - Generated on IRBNet
w w w . m a r s h a l l . e d u
Office of Research IntegrityInstitutional Review BoardOne John Marshall DriveHuntington, WV 25755
FWA 00002704 IRB1 #00002205IRB2 #00003206
October 18, 2016
Chris Swindell, Ph.D.School of Journalism and Mass Communications
RE: IRBNet ID# 964193-1At: Marshall University Institutional Review Board #2 (Social/Behavioral)
Dear Dr. Swindell:
Protocol Title: [964193-1] Media choice and cultural adjustment: A study of MarshallUniversity international students
Expiration Date: October 18, 2017 Site Location: MUSubmission Type: New Project APPROVEDReview Type: Exempt Review
In accordance with 45CFR46.101(b)(2), the above study and informed consent were granted Exemptedapproval today by the Marshall University Institutional Review Board #2 (Social/Behavioral) Desginee forthe period of 12 months. The approval will expire October 18, 2017. A continuing review request for thisstudy must be submitted no later than 30 days prior to the expiration date.
This study is for student Haruka Yanagihara.
If you have any questions, please contact the Marshall University Institutional Review Board #2 (Social/Behavioral) Coordinator Bruce Day, ThD, CIP at 304-696-4303 or [email protected]. Please includeyour study title and reference number in all correspondence with this office.

41
APPENDIX B: SURVEY QUESTIONS
1. Which country are you from?
2. What is your gender?
3. How old are you?
4. How long have you been in America?
5. Which year are you in at Marshall University?
- INTO
- Freshman
- Sophomore
- Junior
- Senior
- Graduate
- Exchange student
6. When are you planning to go back to your home country?
7. What are your English scores? (optional)
8. Which cultural adaptation stage are you in? (Based on how you feel living in America.)
- "Honeymoon Stage": Fun/ Excited to see new things and people in America/
Expectation
- "Culture Shock Stage": Lots of stress/ Hesitate to speak English/ Hard to
communicate with others/ Hard to accept American culture
- "Recovery Stage": Less stress than before/ Know how to behave in America/ Feel
America is not that bad
- "Adjustment Stage": Relaxed/ Adapted/ Feel comfortable living in America

42
9. What kind of media do you use in America?
1: Rarely 2: Several times a month 3: Several times a week 4: Daily/ More
- Television
- Radio
- Newspaper
- Magazine
- Social media
10. How much time did you spend media in a day?
- More than 5 hours
- 3-4 hours
- 1-2 hours
- Less than 1 hour
11. How often did you access American news media?
- Rarely
- Several times a month
- Several times a week
- Daily/ more
12. How much time do you spend on media in a day?
- More than 5 hours
- 3-4 hours
- 1-2 hours
- Less than 1 hour
13. How often do you get news from social media?
- Rarely
- Several times a month

43
- Several times a week
- Daily/ more
14. What kind of American news are you interested in?
- Entertainment
- Weather
- Crime
- Economy
- Sports
- Arts/ Music
- Business
- Politics
- Science/ Nature
- Health/ Medical
- Education
- Other
15. How often do you use American news media?
- Rarely
- Several times a month
- Several times a week
- Daily/ more
16. How often do you use news media of your country?
- Rarely
- Several times a month
- Several times a week
- Daily/ more

44
17. How do you check American news?
- Television
- Radio
- Social media
- Newspaper
- Magazine
- Other
18. How do you check news about your home country?
- Television
- Radio
- Social media
- Newspaper
- Magazine
- Other
19. Your purpose of using American media is to...
1: Strongly disagree 2: Disagree 3: Agree 4: Strongly agree
- improve your English skills
- know what is happening around you
- escape from reality/ kill time
- improve your self
- know American culture
- make conversation topics with American people