relationship between room characteristics and speech
TRANSCRIPT

International Journal of Automotive and Mechanical Engineering (IJAME)
ISSN: 2229-8649 (Print); ISSN: 2180-1606 (Online);
Volume 13, Issue 2 pp. 3451 - 3461, September 2016
©Universiti Malaysia Pahang Publishing
DOI: https://doi.org/10.15282/ijame.13.2.2016.13.0285
3451
Relationship between room characteristics and speech intelligibility in
contemporary churches in Malaysia
Nazli bin Che Din*, Lew Han Yong and Asrul Sani Abdul Razak
Department of Architecture, Faculty of Built Environment,
University of Malaya, 50603 Kuala Lumpur, Malaysia, *Email: [email protected]
ABSTRACT
Church as a place of worship has a unique architectural style and is of great social
importance for the Christian community. The church geometric configurations vary from
classical cruciform to octagonal-shaped plan. Acoustically, some geometric shapes work
much better than others while others can be downright awful. The objective of this study
is to investigate the relationship between room characteristics and speech intelligibility in
church acoustics. At the first stage of this study, a total of eight existing churches in
Malaysia were identified and then grouped into three types, i.e. fan, rectangular, and
cruciform. Then, a fan-shaped room model was selected to be simulated in detail for
sectional studies. Nine different ceiling shapes were constructed for evaluation purposes.
All the selected churches were modelled using the 3D modelling software, SketchUp and
then exported into the commercial acoustic software, ODEON, for acoustical simulation.
The simulated results were then compared to the parameter of speech transmission index
(STI). The results indicate that there was no specific relationship of the STI with all three
groups of room types. However, a direct relationship between the STI means value with
its room volume as well as its distance between sound source and receiver points can be
observed, whereby F3 being the highest average value of STI (0.44) whereas R2 showed
the lowest average value of STI (0.30). All room models generally achieved ‘fair’ STI
values at the front position of the altar but the STI values drop into ’poor’ when the
distance exceeds over than 6.5 m. In the second stage, the results obtained show a direct
relationship between the STI means values with the lower ceiling height above the sound
source and a shorter distance between the sound source and its surrounding walls that
may provide higher speech intelligibility due to the strong early sound energy. This paper
provides fundamental data on the relationships between room characteristics and speech
intelligibility, which would then help with future refinements.
Keywords: Room shape; speech intelligibility; church.
INTRODUCTION
Churches have unique architectural style and typically serve as a place of worship for the
Christian community. Modern worship services demand active interaction and visual
linkage between the stage (the preacher) and congregation (the public). The main goal of
a church service is to deliver God’s message to all participants in the church. The preacher
primarily leads the service with speech [1, 2]. In addition, the listeners in the worshipping
space have a dual function. They are not only sound receivers but also sound sources. At
first, as the sound receivers, it is essential for them to clearly receive speech sound from

Relationship between room characteristics and speech intelligibility in contemporary churches in
Malaysia
3452
the preacher and the singing sound from the musical performance group. As the sound
sources, the congregational singing is the most important church music because
congregational singing is the way participants respond to the God’s message [3]. Thus, it
is essential to produce adequate speech sound so that it can be heard clearly at any seating
positions in the building, otherwise, the participants may feel a sense of alienation.
Everyone in the church service must be in an equal acoustical environment because
everyone is equal in the house of God [4].
Looking at the historical context in the western European history, from the middle
ages through the Renaissance, the construction of Roman Catholic cathedrals became
larger by the scale and as a result has high reverberant acoustic environments for liturgical
music and chants. However, the early synagogues which emphasized sermons and
scriptural readings required less reverberant spaces than the medieval cathedrals. The
Protestant Reformation began in early 1517. It was a movement which broke up the
institutional unity of the church in the Western Europe and established the third great
branch of Christianity. Since the Reformation time period, high speech intelligibility has
become a more common and important requirement for the church service than in the
medieval cathedral [2]. In the early 1940s, some churches were built in isolated places
and it was not necessary to worry about acoustic problems such as noises from outside
activities, mechanical installations or even interior human activities [5]. After the World
War II, many countries such as Korea and Japan which experienced terrible war needed
to rebuild worshipping spaces and started to use sound reinforcement systems [6]. At first,
this application seemed to be financially successful because inexpensive sound
reinforcement systems were used. However, people started to realize that they did not
have adequate acoustical equipment [5].As there were increasing number of service
participants, much bigger organ facility and bigger room size were required. Therefore,
the architectural aspects of the church design also started to change. At the same time,
many types of mechanical equipment and new musical instruments such as electronic
organs and synthesizers were installed while traditional instruments like the pipe organ
and piano were still in use. These made it possible to start to invest in the acoustical
quality of churches and establish the need for acoustic experts to assist in achieving not
only proper architectural designs for natural acoustics but also the proper installation of
the sound reinforcement systems.
Modern churches involve many different types of functions based on their
liturgical style. Modern worship services often require active interaction between the
preacher, performing musical group and congregation. The main goal of worship service
is to provide God’s message to all participants in the service. Thus, it is necessary for the
space in the church to have good acoustics to allow good verbal and musical
communication travel. The highly reverent acoustics of a cathedral are well suited to the
organ and Gregorian chants. However, the simultaneous need for high speech
intelligibility is also important for the cathedral style of church. On the other hand, an
evangelical style of the church has as large volume as a cathedral but contemporary
popular music is usually played with an electronic organ [2]. Contemporary church
auditoriums require various functions. A church space is no longer only for worshipping
but also many other activities such as classes, meetings, and recreation. These different
functions need different acoustical conditions. Each room should provide optimum
acoustic parameters for the functions it will have. Acoustically, churches have a complex
mission to meet the requirements of both speech and music, which often seem
incompatible. The acoustics for the church music requires enough reverberant sound for
instruments and congregational singing but speech sound requires only about one-half of

Che Din et al. /International Journal of Automotive and Mechanical Engineering 13(2) 2016 3451-3461
3453
the reverberation time for the church music because it must be heard clearly to be
understood. Therefore, it is not easy to satisfy the acoustical requirements for these two
environments at the same time. Ideally, one should not be sacrificed for the other [3].
Good acoustic is central to the function of many occasions in the church; it is essential
that architects consider the acoustical properties in the early stage of the design process,
such as geometrical form and material used. Acoustics in the church have been the focus
of research groups in the European countries [7-12]; however, the amount of available
research information on the church acoustics is immeasurably less in Malaysia, in
particular, the studies of contemporary church design and how space and form affect
acoustical performance.
In the church design, fundamental room shape i.e. fan, rectangular, steeped and
reverse fan shapes and its spatial volume represent the primary design considerations to
provide the optimum acoustic environment. Curved surfaces can cause the destructive
focus of sound and therefore, should be avoided if it is not properly treated with sound
diffusing materials [13]. Having walls in the wrong place or at an awkward angle can
cause acoustic problems such as standing waves, flutter echo, sound focusing and
intensive late reflections. Long and flat parallel walls cause undesirable flutter echo which
can ultimately reduce speech intelligibility. Spatial volumetric separation by alcoves,
archways, and moveable and fixed objects, which are seen in many older churches, may
also diminish the effectiveness of early arriving sound energy and weaken the speech
intelligibility. Wide fan shapes and semi-circular floor plan usually do not provide strong,
early lateral reflections because the side walls are too far apart. Unless overhead sound
reflectors can be used to overcome the absence of lateral sound reflected from walls, the
playing of musical instruments will be heard as very distant and lack of full tone quality.
This geometrical consideration must be given not only in the design of the building floor
plan but also in the design of the section as well. Also, in the prediction of acoustical
simulation, the dimensional ratios of the room length to its width as well as the ratios of
the room height to width are important considerations in the design [14-16]. At present,
church geometric configurations vary from classical rectangular shaped to the octagonal-
shaped plan. The purpose of this study is to investigate the relationship between the room
characteristics and speech intelligibility in the selected contemporary churches using
computer modelling and simulation analysis, particularly on spatial distribution patterns
of speech intelligibility in the absence of sound reinforcement systems. The results were
then compared with the parameter of Speech Transmission Index (STI).
METHODOLOGY
Simulation 1: Room Shape vs. Speech Intelligibility
The primary purpose of this study is to investigate the relationship between the room
geometrical shape and speech intelligibility in the church in the absence of sound
reinforcement system. The selection sample of a representative of the contemporary
churches in Malaysia was based on shape, layout and other factors contributed to the final
selection in addition to the architectural drawing availability. Eight churches in Perak,
Malaysia were selected from three major room shapes: rectangular, fan, and cruciform.
The categorization of these shapes was taken from a review of numerous church projects
done by a local architect firm in Perak.
Relationship between room characteristics and speech intelligibility in contemporary churches in
Malaysia
3454
Simulation 2: Sectional Studies vs. Speech Intelligibility In the second stage of this study, the better-simulated result from the previous section of
the selected shape of the room model was chosen to be further analysed for the sectional
studies. The modification of ceiling shapes was designed accordingly to identify the
impact of the ceiling profile onto the acoustical performance. All of the modelled rooms
that have identical room plan and seating capacity have been set as the originally shaped
model.
Model Construction and Simulation
The building and modelling of the 3D digital models were carried out using SketchUp,
an off the shelf and affordable 3D software modelling tool. The complex architectural
details such as an ornament, cornice, framing etc. were omitted because they do not
produce any strong early reflections to the receiver [15]. Table 1 presents data
summarizing the main physical characteristics of the eight selected churches. In the next
stage, the architectural digital models of these churches were then simplified for the
purpose of acoustical computational analysis using the commercial software of ODEON
Room Acoustic version 12.10 Industrial [16]. When assigning a boundary condition in
ODEON, its validity must be checked. The performed simulation involved verification
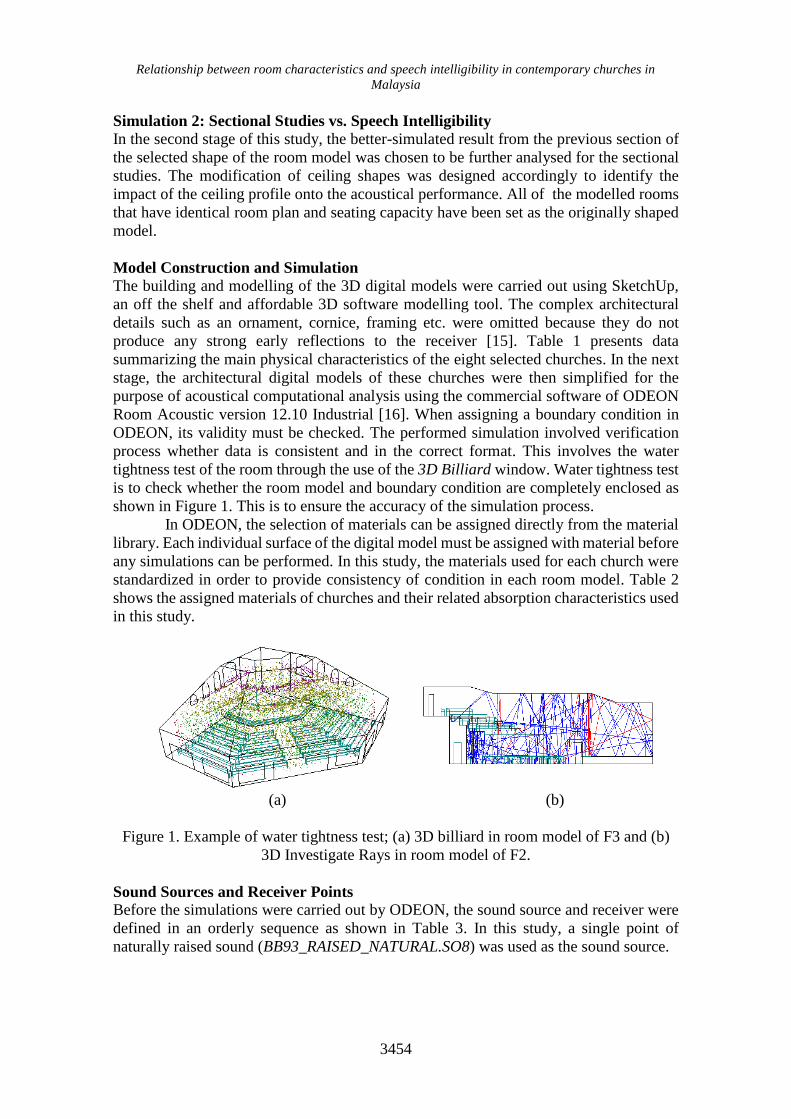
process whether data is consistent and in the correct format. This involves the water
tightness test of the room through the use of the 3D Billiard window. Water tightness test
is to check whether the room model and boundary condition are completely enclosed as
shown in Figure 1. This is to ensure the accuracy of the simulation process.
In ODEON, the selection of materials can be assigned directly from the material
library. Each individual surface of the digital model must be assigned with material before
any simulations can be performed. In this study, the materials used for each church were
standardized in order to provide consistency of condition in each room model. Table 2
shows the assigned materials of churches and their related absorption characteristics used
in this study.
(a) (b)
Figure 1. Example of water tightness test; (a) 3D billiard in room model of F3 and (b)
3D Investigate Rays in room model of F2.
Sound Sources and Receiver Points
Before the simulations were carried out by ODEON, the sound source and receiver were
defined in an orderly sequence as shown in Table 3. In this study, a single point of
naturally raised sound (BB93_RAISED_NATURAL.SO8) was used as the sound source.

Che Din et al. /International Journal of Automotive and Mechanical Engineering 13(2) 2016 3451-3461
3455
Table 1. Basic characteristics and description of each room model.
Churc
h
Abbrv.
3D Room Model Type
(Shape)
Volume
, m3
Max
Height
, m
Area,
m2
Numbe
r of
seat
F1
Fan shape 1617.5 6.89 306.2
6 300
F2
Fan shape 3638.5 6.91 473.9
3 620
F3
Fan shape 1422.3 6.95 290.6
5 270
R1
Rectangula
r shape 4153.0 7.32
564.0
3 750
R2
Rectangula
r shape 7286.4 10.10
845.9
3 1150
R3
Rectangula
r shape 2629.4 8.08
368.6
6 350
C1
Cruciform 2026.8 8.49 326.0
2 295
C2
Cruciform 2026.8 8.49 326.0
2 295
P1
123
45
6
7
8
9
10
11
12
13
141516
17
1819
20
21
22
23
24
25
26
Odeon©1985-2013 Licensed to: University of Malaysia, Malaysia Restricted version - research and teaching only!
P11
2
34
5 6
7
8
9
10
1112
13
14
15
16
17
18
19
20 21
22
2324
Odeon©1985-2013 Licensed to: University of Malaysia, Malaysia Restricted version - research and teaching only!
P1
12
3
4
5
6
7
8
9
10
1112
13
14
15
16
17
18
Odeon©1985-2013 Licensed to: University of Malaysia, Malaysia Restricted version - research and teaching only!
P1
1
2
3
4
5
6
78
9
10
11
12
13
14
15
16
17
18
1920
21
2223
24
2526
27
2829
30
Odeon©1985-2013 Licensed to: University of Malaysia, Malaysia Restricted version - research and teaching only!
P1
1
2
3
4
5
6
7
8
9
10
11
12
13
14
15
16
17
18
19 20
21 22
23 24
2526
27
28
29
30
Odeon©1985-2013 Licensed to: University of Malaysia, Malaysia Restricted version - research and teaching only!
P1
12
3
45
6
78
9
1011
12
13
1415
16
1718
19
2021
2223
24
25
26
Odeon©1985-2013 Licensed to: University of Malaysia, Malaysia Restricted version - research and teaching only!
P1
1
2
3
4
5
6
7
8
9
10
11
12
13
14
15
16
17
18
19
2021
2223
24
Odeon©1985-2013 Licensed to: University of Malaysia, Malaysia Restricted version - research and teaching only!
P1
1
2
3
4
5
6
7
8
9
10
11
12
13
14
15
16
17
18
19
2021
2223
24
Odeon©1985-2013 Licensed to: University of Malaysia, Malaysia Restricted version - research and teaching only!

Relationship between room characteristics and speech intelligibility in contemporary churches in
Malaysia
3456
The sound source was placed at 1 m set back from the edge of the altar area and
raised 1.5 m from the altar floor. The directivity of this sound source was derived from
Egan [17]. Then, the receiver locations were occupied uniformly across the whole area
of the church room as the example shown in Figure 2.
Table 2. Sound absorption coefficient of materials used in this study.
Frequency
No. Building component and materials 250 500 100 2000
1 Floor: Ceramic tiles. Perforation = 12%, Mineral
wool in cavity 0.44 0.68 0.79 0.56
2 Walls: Smooth brickwork, 10mm depth pointing, pit
sand mortar 0.09 0.12 0.16 0.22
3 Ceiling: Perforated 27mm gypsum board (16%), d=
4.5mm 300mm from ceiling 0.55 0.60 0.90 0.86
4 Concrete column: Concrete block, painted 0.05 0.06 0.07 0.09
5 Chair: Audience on wooden chairs, 1 per sq.m. 0.24 0.56 0.69 0.81
6 Window: Glass, Ordinary window glass 0.25 0.18 0.12 0.07
7 Door: Solid wooden door 0.10 0.06 0.08 0.10
8 Railing: Solid glass block 0.02 0.02 0.02 0.02
Table 3. Basic information on the simulation settings fixed in ODEON.
No. of sound source : 1 (set at 1.5 m high)
Sound source type : BOSE BB93_NORMAL_NATURAL_S08; Total
power: 68.4 dB(A)
No. of multi-point
source
: Grid Points (all set at 1.5 m high)
F1: 26
F2: 24
F3: 16
R1: 30
R2: 30
R3: 26
C1: 24
C2: 24
Impulse response
length
: between 1660 ms to 6020 ms
(a) (b)
Figure 2. Example of sound source location (red) and receiver points (blue); (a) room
model of F2 and (b) room model of R3.
P11
2
34
5 6
7
8
9
10
1112
13
14
15
16
17
18
19
20 21
22
2324
Odeon©1985-2013 Licensed to: University of Malaysia, Malaysia Restricted version - research and teaching only!
P1
12
3
45
6
78
9
1011
12
13
1415
16
1718
19
2021
2223
24
25
26
Odeon©1985-2013 Licensed to: University of Malaysia, Malaysia Restricted version - research and teaching only!
Che Din et al. /International Journal of Automotive and Mechanical Engineering 13(2) 2016 3451-3461
3457
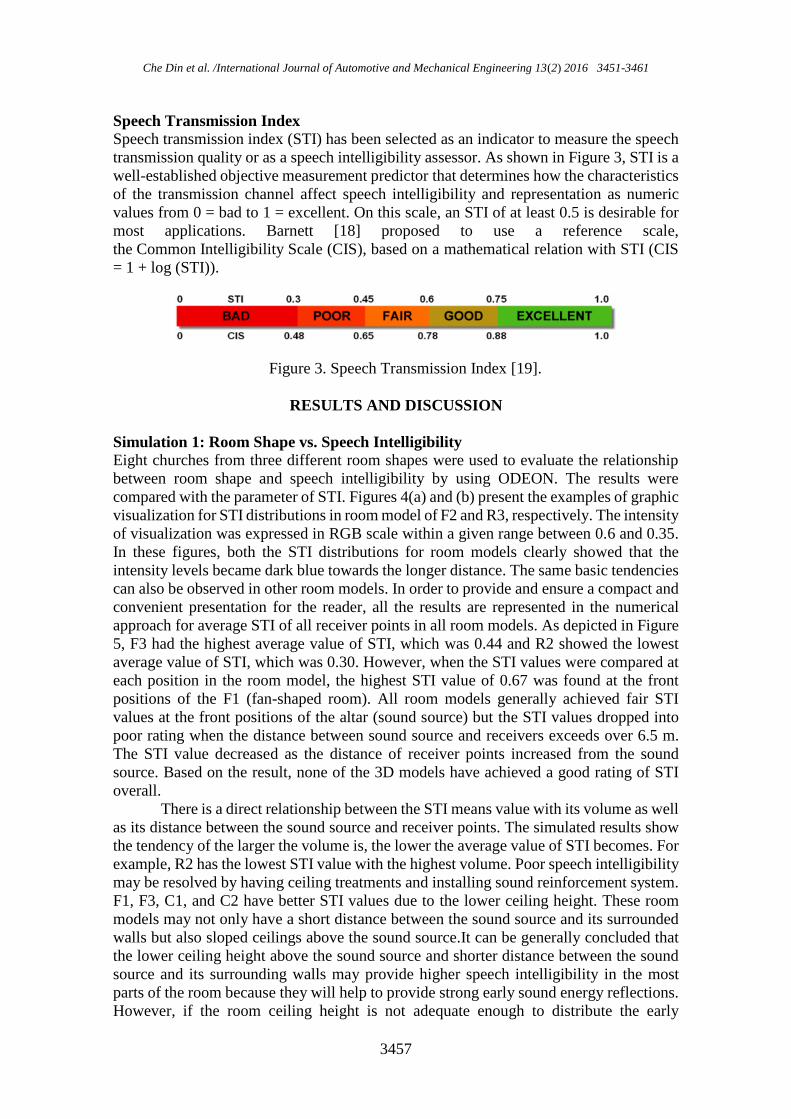
Speech Transmission Index
Speech transmission index (STI) has been selected as an indicator to measure the speech
transmission quality or as a speech intelligibility assessor. As shown in Figure 3, STI is a
well-established objective measurement predictor that determines how the characteristics
of the transmission channel affect speech intelligibility and representation as numeric
values from 0 = bad to 1 = excellent. On this scale, an STI of at least 0.5 is desirable for
most applications. Barnett [18] proposed to use a reference scale,
the Common Intelligibility Scale (CIS), based on a mathematical relation with STI (CIS
= 1 + log (STI)).
Figure 3. Speech Transmission Index [19].
RESULTS AND DISCUSSION
Simulation 1: Room Shape vs. Speech Intelligibility
Eight churches from three different room shapes were used to evaluate the relationship
between room shape and speech intelligibility by using ODEON. The results were
compared with the parameter of STI. Figures 4(a) and (b) present the examples of graphic
visualization for STI distributions in room model of F2 and R3, respectively. The intensity
of visualization was expressed in RGB scale within a given range between 0.6 and 0.35.
In these figures, both the STI distributions for room models clearly showed that the
intensity levels became dark blue towards the longer distance. The same basic tendencies
can also be observed in other room models. In order to provide and ensure a compact and
convenient presentation for the reader, all the results are represented in the numerical
approach for average STI of all receiver points in all room models. As depicted in Figure
5, F3 had the highest average value of STI, which was 0.44 and R2 showed the lowest
average value of STI, which was 0.30. However, when the STI values were compared at
each position in the room model, the highest STI value of 0.67 was found at the front
positions of the F1 (fan-shaped room). All room models generally achieved fair STI
values at the front positions of the altar (sound source) but the STI values dropped into
poor rating when the distance between sound source and receivers exceeds over 6.5 m.
The STI value decreased as the distance of receiver points increased from the sound
source. Based on the result, none of the 3D models have achieved a good rating of STI
overall.
There is a direct relationship between the STI means value with its volume as well
as its distance between the sound source and receiver points. The simulated results show
the tendency of the larger the volume is, the lower the average value of STI becomes. For
example, R2 has the lowest STI value with the highest volume. Poor speech intelligibility
may be resolved by having ceiling treatments and installing sound reinforcement system.
F1, F3, C1, and C2 have better STI values due to the lower ceiling height. These room
models may not only have a short distance between the sound source and its surrounded
walls but also sloped ceilings above the sound source.It can be generally concluded that
the lower ceiling height above the sound source and shorter distance between the sound
source and its surrounding walls may provide higher speech intelligibility in the most
parts of the room because they will help to provide strong early sound energy reflections.
However, if the room ceiling height is not adequate enough to distribute the early

Relationship between room characteristics and speech intelligibility in contemporary churches in
Malaysia
3458
reflections to the rear room, speech intelligibility will be poor relative to the other parts
of the room [20].
(a) (b)
Figure 4. Example of STI distribution in room models; (a) F2 and (b) R3.
Figure 5. Comparison of Speech Transmission Index, STI for each room model.
Simulation 2: Section Studies vs. Speech Intelligibility
In this section, one type of the fan-shaped room models, F3, was selected to be simulated
for the sectional studies based on the highest value of STI as presented in the previous
section. Nine different ceiling shapes were designed depending on the ceiling shape
modifications as illustrated in Figure 6. The main purpose of the simulations in this
section is to evaluate the impact of ceiling profiles on the speech intelligibility. All of
these sectional cut-outs have identical room plan and a seating capacity of 270 seats as
the original fan-shaped model. The materials, sound source and receivers’ positions used

Che Din et al. /International Journal of Automotive and Mechanical Engineering 13(2) 2016 3451-3461
3459
in the computer simulations remained the same.Based on the results obtained in Table 4;
FS1, FS2, FS3, and FS4 have generally improved on the STI values compared to the
original room model. However, when the STI values were compared at each position in
the room model, the highest STI value of 0.58 was found to be located at the front position
of FS1 and FS2. All room models achieved fair STI value occurring at the front position
of the altar (sound source) but the similar tendency of STI values dropped into poor rating
when the distance between sound source and receivers exceeded 6.5 m as found in the
previous section.
In addition, a direct relationship can be observed between the STI means values
with its ceiling profile above the sound source. FS1, FS2, FS3, and FS4 have better STI
value due to their lower ceiling above the sound source. The lower ceiling height above
the sound source and shorter distance between the sound source and its surrounding walls
may provide a higher speech intelligibility in most parts of the room because they help to
provide strong early sound energy reflections. However, FS5, FS6, FS7, FS8, and FS9
have lower STI values compared to the original room model because the ceiling
characteristics have been lifted up and flattened the ceiling of the room. Even though
some improvement on the STI values can be observed in the simulated STI, they can be
considered as less significant based on no enhancement towards better STI rating.
O: Original room
model
FS1: Single-sloped
ceiling (45°) above
sound source
FS2: Single-sloped
ceiling (30°) above
sound source
FS3: Double-sloped
ceiling (45° & 30°)
above sound source
FS4: Double-sloped
ceiling (30° & 45°)
above sound source
FS5: Totally flat
roof
FS6: Single-sloped
ceiling (45°) above
sound source with
flat ceiling
FS7: Single-sloped
ceiling (30°) above
sound source with
flat ceiling
FS8: Double-sloped
ceiling (45° & 30°)
above sound source
with flat ceiling
FS9: Double-sloped
ceiling (30° & 45°)
above sound source
with flat ceiling
Figure 6. Different section drawings of fan-shaped room modification.

Relationship between room characteristics and speech intelligibility in contemporary churches in
Malaysia
3460
Table 4. Speech Transmission Index (STI) for the sectional study.
Church Speech Transmission Index, STI
MAX MIN AVR.
Original 0.56 0.31 0.44
FS1 0.58 0.32 0.44
FS2 0.58 0.32 0.44
FS3 0.57 0.32 0.44
FS4 0.57 0.32 0.44
FS5 0.54 0.30 0.41
FS6 0.55 0.30 0.41
FS7 0.55 0.30 0.41
FS8 0.55 0.31 0.41
FS9 0.54 0.32 0.41
: Original room model result
: STI Improved
CONCLUSIONS
In this study, a series of simulations in different main shapes of contemporary churches
without using sound reinforcement systems were performed. The first stage of the
simulation showed that the speech intelligibility of the church was affected by the room
characteristics and its ceiling profile. A series of simulation confirmed that the larger the
volume is, the lower the average value of STI becomes. Simulations onto different types
of ceiling shape modification revealed that ceiling profiles yield relatively improvement
on the simulated STI but it has the less significant influence to show the effectiveness in
the overall STI. Adequate ceiling height above the sound source and shorter distance
between the sound source and its surrounding walls may provide higher speech
intelligibility in most parts of the room because they can help to provide strong early
sound energy reflections. Further investigations and comparative simulations on other
acoustical parameters towards room characteristics are now being intensively pursued.
ACKNOWLEDGEMENTS
The authors are grateful to the Architect Ding Poi Kooi firm for providing research
materials and churches drawings. The authors also would like to thank Ms. Nurul Amira
and Mr. Zufar Adzahan for their continuous contribution towards this research.
REFERENCES
[1] Lee S. Comparative Analysis of Speech Intelligibility in Church Acoustics using
Computer Modeling: University of Florida; 2003.
[2] Lubman D, Wetherill EA. Acoustics of worship spaces: American Institute of
Physics for the Acoustical Society of America; 1985.
[3] Berry R, Kinzey Jr B. Planning for sound in church worship. Architectural
Forum1954. p. 164-6.
[4] R R. Acoustics in the worship space, I, II, III, IV, VI, VII, respectively. 380 E.
Northwest Highway, Suite 200, Des Plaines, IL: Diapason Magazine; 1983-1990.
Che Din et al. /International Journal of Automotive and Mechanical Engineering 13(2) 2016 3451-3461
3461
[5] Buglio JD. Why is church sound so confusing? . JdB Sound, Acoustic. Lab; 2016.
[6] Nagata. Church acoustics. Nagata Acoustics News; 2001.
[7] Brezina P. Measurement of intelligibility and clarity of the speech in romanesque
churches. Journal of Cultural Heritage. 2015;16:386-90.
[8] Sygulska A. Contemporary two-storey churches – acoustic investigations. Journal
of Architecture and Urbanism. 2015;39:140-8.
[9] Iannace G TA, Qandil A. The acoustics of the Catacombs. Archives of Acoustics.
2015;39:583-90.
[10] Tallon A. Acoustics at the intersection of architecture and music. Journal of the
Society of Architectural Historians. 2016;75:263-80.
[11] Suárez R, Alonso A, Sendra JJ. Intangible cultural heritage: The sound of the
Romanesque cathedral of Santiago de Compostela. Journal of cultural heritage.
2015;16:239-43.
[12] Elicio L, Martellotta F. Acoustics as a cultural heritage: The case of Orthodox
churches and of the “Russian church” in Bari. Journal of Cultural Heritage.
2015;16:912-7.
[13] Kleiner M, Klepper DL, Torres RR. Acoustics in the Worship Spaces. Acoustics
in the Worship Spaces. 1986.
[14] Berardi U. Simulation of acoustical parameters in rectangular churches. Journal
of Building Performance Simulation. 2014;7:1-16.
[15] Siltanen S, Lokki T, Savioja L, Lynge Christensen C. Geometry reduction in room
acoustics modeling. Acta Acustica united with Acustica. 2008;94:410-8.
[16] Christensen C, Koutsouris G. ODEON Room Acoustics Software, Version 12,
User Manual. Kgs. Lyngby: Odeon A/S; 2013.
[17] Egan MD. Architectural acoustics: McGraw-Hill Custom Publishing; 1988.
[18] Barnett P, Acoustics A. Overview of speech intelligibility. Proceedings-Institute
of Acoustics. 1999;21:1-16.
[19] Steeneken HJ, Houtgast T. A physical method for measuring speech‐transmission
quality. The Journal of the Acoustical Society of America. 1980;67:318-26.
[20] Bradley J, Sato H, Picard M. On the importance of early reflections for speech in
rooms. The Journal of the Acoustical Society of America. 2003;113:3233-44.