relationship between school climate and student achievement
TRANSCRIPT

Georgia Southern University
Digital Commons@Georgia Southern
Electronic Theses and Dissertations Graduate Studies, Jack N. Averitt College of
Fall 2017
Relationship Between School Climate and Student Achievement Gail H. Greenway
Follow this and additional works at: https://digitalcommons.georgiasouthern.edu/etd
Part of the Curriculum and Instruction Commons, Educational Leadership Commons, and the Elementary and Middle and Secondary Education Administration Commons
Recommended Citation Greenway, G. (2017) The relationship between school climate and student achievement. Doctoral dissertation, Georgia Southern University.
This dissertation (open access) is brought to you for free and open access by the Graduate Studies, Jack N. Averitt College of at Digital Commons@Georgia Southern. It has been accepted for inclusion in Electronic Theses and Dissertations by an authorized administrator of Digital Commons@Georgia Southern. For more information, please contact [email protected].

RELATIONSHIP BETWEEN SCHOOL CLIMATE AND STUDENT ACHIEVEMENT
by
GAIL HOOKS GREENWAY
Under the Direction of Daniel W. Calhoun
ABSTRACT
Increasingly public schools in the United States are finding that factors beyond
curriculum and instruction impact student achievement. Much research has been
conducted on the relationship between school climate and student achievement (Cohen,
McCabe, Michelli, & Pickeral, 2009; Guo & Higgins-D’Alessandro, 2011). This study
set out to determine if there was a correlation between school climate and student
achievement in middle schools in the Central Savannah River Area Regional Educational
Service Agency region in the state of Georgia. Findings from this quantitative study
indicated that there is a statistically significant, positive relationship between school
climate and student achievement in middle schools in this region. Discussion and
implications of the findings suggest practical recommendations for schools to implement
changes were needed. Recommendations for future research include expanding the
research to elementary and high schools as well as other regions of Georgia.
INDEX WORDS: School climate, Student achievement, Middle schools

RELATIONSHIP BETWEEN SCHOOL CLIMATE AND STUDENT ACHIEVEMENT
by
GAIL HOOKS GREENWAY
B.S., Georgia Southern University, 1991
M. A., Georgia Southern University, 1994
Ed. S., Georgia Southern University, 2000
A Dissertation Submitted to the Graduate Faculty of Georgia Southern University in
Partial Fulfillment of the Requirements for the Degree
DOCTOR OF EDUCATION
STATESBORO, GEORGIA

© 2017
GAIL HOOKS GREENWAY
All Rights Reserved

1
RELATIONSHIP BETWEEN SCHOOL
CLIMATE AND STUDENT ACHIEVEMENT
by
GAIL HOOKS GREENWAY
Major Professor: Daniel W. Calhoun
Committee: Juliann McBrayer
Teri Denlea Melton
Electronic Version Approved:
December 2017

2
DEDICATION
I was fortunate to be raised by two parents who instilled the importance of
education in their children. My parents, Wendel and June Hooks, supported my journey
and encouraged me to continue to strive for more. I dedicate this study to them with
love, respect, and admiration. Unfortunately, my father did not live to see me complete
this degree and that will be something that I will always regret. However, I know that his
dream of me receiving a doctorate is why I was able to get through this process. My
parents spent their lives running our family farm. Hard work that took many long hours.
There were many days that my daddy left before daylight and did not get home until well
after dark. All the while my mother was working beside him or managing to keep our
household running smoothly. The lessons of hard work and determination that were
taught to me by my parents have been the most valuable of my life. I can never
verbalize the amount of love I have for them both, but this quote says so much about how
this farmer’s daughter feels about her hard-working, loving parents.
“When he comes home late, hungry, and missing our school activities, he
does not truly realize the impact he has made on us. We are proud of him and his
dedication to agriculture. My father is a farmer. During harvest, he spends hours
away from his family doing what he loves, the noble responsibility of feeding the
world. During harvest, he eats away from his table, only to put food on everyone
else’s.” –Kristin Liepold

3
ACKNOWLEDGMENTS
During my studies, I have been fortunate to receive encouragement and support
from many individuals. I am thankful for each person that motivated me to stay the
course and guided me with wisdom. I want to acknowledge the following people for the
important role that have played in this journey.
My Husband. Thank you for your encouragement, patience, and love through this
process. You have stood by my side and believed in me when I was not so sure about
myself.
My Children. I always want you to strive for the top. Thank you for helping me
see this process to completion, and I hope it will encourage you to work hard for your
dreams.
My Siblings and Family. The support the Hooks and Greenway families have
shown throughout this journey will never be forgotten. Your belief in my abilities and
support have been a game changer.
My Dissertation Committee: Dr. Calhoun I appreciate your willingness to chair
my committee and for never giving up on me. Your patience with me has been
remarkable. Thank you to Dr. Melton and Dr. McBrayer for serving on my committee
and for your support in helping me achieve this degree. I would be remiss if I did not
also extend my thanks to Dr. Sorgen for generously giving of his time to assist me with
the statistics involved in this study.
4
TABLE OF CONTENTS
ACKNOWLEDGMENTS ....................................................................................................3
LIST OF TABLES ...............................................................................................................8
LIST OF FIGURES .............................................................................................................9
CHAPTER 1
INTRODUCTION .............................................................................................................10
Statement of Problem and Purpose Statement ...................................................................13
Conceptual Framework ......................................................................................................14
Research Questions ............................................................................................................14
Procedures ..........................................................................................................................16
Significance of Study .........................................................................................................17
Definition of Key Terms ...................................................................................................18
Chapter Summary ..............................................................................................................19
Organization of Study ........................................................................................................19
CHAPTER 2
REVIEW OF LITERATURE ............................................................................................21
Introduction ........................................................................................................................21
School Climate ...................................................................................................................22
5
School Climate Defined .........................................................................................24
Interpersonal Relationships ....................................................................................25
Teaching and Learning Practices ...........................................................................26
Organizational Structures.......................................................................................30
Student Achievement .........................................................................................................33
National Trends ......................................................................................................33
Georgia Data ..........................................................................................................34
Middle School Implications ...............................................................................................35
History of Middle School.......................................................................................35
Middle Schools and School Climate ......................................................................36
School Climate and CCRPI Score Calculations ...............................................................38
School Climate .......................................................................................................38
Student Achievement .............................................................................................41
Chapter Summary ..............................................................................................................42
CHAPTER 3
METHODOLOGY ............................................................................................................44
Purpose Statement and Research Questions ......................................................................45
Research Design.................................................................................................................46

6
Participants .............................................................................................................46
Sample....................................................................................................................48
Data Collection ......................................................................................................48
Data Analysis .........................................................................................................49
Limitations, Delimitations, and Assumptions ....................................................................50
Chapter Summary ..............................................................................................................50
CHAPTER 4
Report of Data and Data Analysis .....................................................................................52
Research Findings ..............................................................................................................54
Chapter Summary ..............................................................................................................62
CHAPTER 5
DISCUSSION AND RECOMMENDATIONS .................................................................64
Introduction ........................................................................................................................64
Problem Statement .............................................................................................................65
Research Questions ............................................................................................................66
Analysis and Discussion of Findings .................................................................................67
Implications for Practice ....................................................................................................69
Implication One: State Leaders ..............................................................................70
7
Implication Two: District and School Leaders ......................................................70
Improving School Discipline .................................................................................71
Improving School Attendance ...............................................................................72
Improving Interpersonal Relationships ..................................................................73
Recommendations for Future Research .............................................................................74
Impact Statement ...............................................................................................................76
Conclusion .........................................................................................................................76
References ..........................................................................................................................78
APPENDIX A ....................................................................................................................92
APPENDIX B ....................................................................................................................93
APPENDIX C ....................................................................................................................94
APPENDIX D ....................................................................................................................95

8
LIST OF TABLES
Table 1: Achievement. School Climate, Rural/Urban, Poverty Rate for participating
schools................................................................................................................................55
Table 2: Shapiro-Wilk test for normality ...........................................................................57
Table3: Correlational and descriptive statistics for school climate calculation and student
achievement .......................................................................................................................58
Table 4: Correlational and descriptive statistics for school climate calculation and student
achievement of urban schools ............................................................................................59
Table 5: Correlational and descriptive statistics for school climate calculation and student
achievement of rural schools .............................................................................................60
Table 6: Correlational and descriptive statistics for school climate calculation and student
achievement of low poverty schools ..................................................................................61
Table 7: Correlational and descriptive statistics for school climate calculation and student
achievement of high poverty schools .................................................................................62

9
LIST OF FIGURES
Figure 1: Conceptual Framework ......................................................................................14
Figure 2: Histogram illustrating frequency distribution of the variable climate ...............56
Figure 3: Histogram illustrating frequency distribution of the variable achievement .......56
Figure 4: Scatterplot to demonstrating the positive correlation between the variables .....57
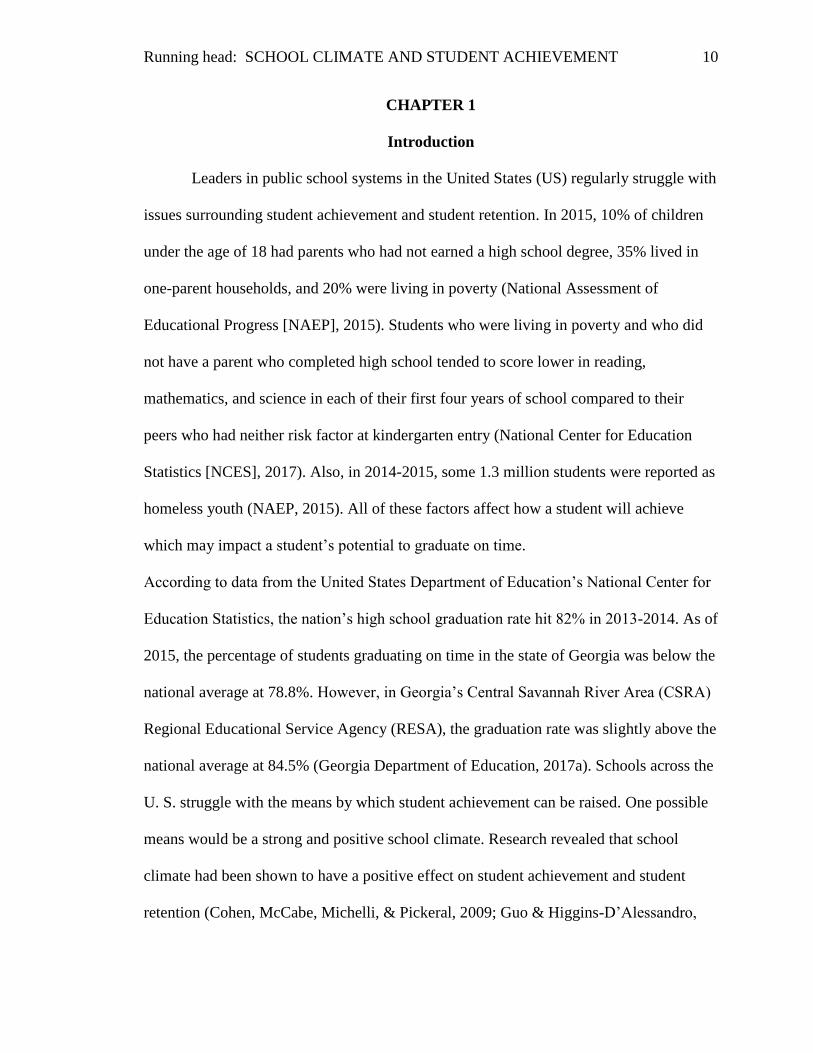
Running head: SCHOOL CLIMATE AND STUDENT ACHIEVEMENT 10
CHAPTER 1
Introduction
Leaders in public school systems in the United States (US) regularly struggle with
issues surrounding student achievement and student retention. In 2015, 10% of children
under the age of 18 had parents who had not earned a high school degree, 35% lived in
one-parent households, and 20% were living in poverty (National Assessment of
Educational Progress [NAEP], 2015). Students who were living in poverty and who did
not have a parent who completed high school tended to score lower in reading,
mathematics, and science in each of their first four years of school compared to their
peers who had neither risk factor at kindergarten entry (National Center for Education
Statistics [NCES], 2017). Also, in 2014-2015, some 1.3 million students were reported as
homeless youth (NAEP, 2015). All of these factors affect how a student will achieve
which may impact a student’s potential to graduate on time.
According to data from the United States Department of Education’s National Center for
Education Statistics, the nation’s high school graduation rate hit 82% in 2013-2014. As of
2015, the percentage of students graduating on time in the state of Georgia was below the
national average at 78.8%. However, in Georgia’s Central Savannah River Area (CSRA)
Regional Educational Service Agency (RESA), the graduation rate was slightly above the
national average at 84.5% (Georgia Department of Education, 2017a). Schools across the
U. S. struggle with the means by which student achievement can be raised. One possible
means would be a strong and positive school climate. Research revealed that school
climate had been shown to have a positive effect on student achievement and student
retention (Cohen, McCabe, Michelli, & Pickeral, 2009; Guo & Higgins-D’Alessandro,
SCHOOL CLIMATE AND STUDENT ACHIEVEMENT 11
2011). The National School Climate Council (2007) has defined school climate in the
following way:
School climate refers to the quality and character of school life. School climate is
based on patterns of students’, parents’ and school personnel’s experiences of
school life and reflects norms, goals, values, interpersonal relationships, teaching
and learning practices, and organizational structures.
A sustainable, positive school climate fosters youth development and
learning necessary for a productive, contributing and satisfying life in a
democratic society. This climate includes norms, values, and expectations that
support people feeling socially, emotionally and physically safe. People are
engaged and respected. Students, families, and educators work together to
develop, live and contribute to a shared school vision. Educators model and
nurture attitudes that emphasize the benefits and satisfaction gained from
learning. Each person contributes to the operations of the school and the care of
the physical environment (p. 4).
Over the last 30 years a growing body of empirical research has shown that a positive
and sustained school climate is associated with and may be predictive of positive youth
development, effective risk prevention and health promotion efforts, student learning and
academic achievement, increased student graduation rates, and teacher retention (Cohen
& Geier, 2010).
School climate improvement is a continuous process. Effective school
improvement efforts involve the students, parents, and guardians, school personnel, and
community leaders (Cohen et al., 2009). Efforts to keep students on the graduation path
SCHOOL CLIMATE AND STUDENT ACHIEVEMENT 12
should be paired with efforts to close achievement gaps. It is during the middle grades,
particularly in lower-performing schools that serve high-poverty populations that
achievement gaps often become so large that they cannot be overcome by students as
they move forward into high school (Balfanz, 2009). If middle schools provide a solid
curriculum base for students and engage students in the learning process, students should
be more invested in the educational process and may be more likely to complete high
school. Students who end their ninth grade year on track to graduate in four years are four
times more likely to earn a diploma than those who fall off-track (University of Chicago,
2012). One way to improve retention rates for high school students is to focus on
achieving student success earlier in students’ academic careers, namely, at the middle
school level.
Eccles (2008) determined that middle school reform efforts have successfully
reduced the dropout rates in secondary school. Eccles concluded that middle schools that
included opportunities for students to have six types of experiences create environments
that resulted in higher graduation rates. The six opportunities students should be exposed
to include the following:
1. building strong personal relationships with non-familial adults;
2. strong safety nets to identify disengagement early;
3. provision of support for the mastery of learning;
4. mastery of, and a strong sense of efficacy for acquiring, the skills and
competencies necessary for a successful transition to adulthood;
5. visioning a productive adulthood along with the means of obtaining the
associated goals; and,
SCHOOL CLIMATE AND STUDENT ACHIEVEMENT 13
6. students should be given experiences that build a strong sense of mattering
and high-quality instruction in a psychologically and physically safe
environment. (Eccles, 2008)
Similarly, Balfanz (2009) found that reform efforts at the middle grades level that
combine curricula and instructional practices linked to college and career readiness and
enhanced teacher quality can improve student success, thus, magnifying the impact of the
middle grades on student success and retention at the secondary level. Therefore, schools
working to implement school improvement and reform successfully would be wise to
acknowledge the impact that middle schools have to ensure that students are successful in
school and in turn graduate from high school. To fully appreciate this issue, it is
important to understand both how school climate and student achievement is determined
in the state of Georgia and what those calculations look like at the middle school level.
Statement of Problem and Purpose Statement
Georgia schools continue to struggle to ensure that student achievement has
reached targeted levels and to close the gap in student achievement. In Georgia,
assessments are used to determine if schools are meeting standards identified that
represent student achievement. One such measure is College and Career Readiness
Performance Index (CCRPI). Another strong indicator of what is going on in a particular
school or schools is the school climate calculation. The CCRPI is a comprehensive school
improvement, accountability, and communication platform for all educational
stakeholders designed to promote college and career readiness for all Georgia public
school students (Georgia Department of Education, 2017c). A myriad of research has
indicated that there is a direct and symbiotic relationship between school climate and
SCHOOL CLIMATE AND STUDENT ACHIEVEMENT 14
student achievement (Cohen et al., 2009; Guo & Higgins-D’Alessandro, 2011). However,
before this study, it was unknown if this relationship existed in Georgia middle schools in
the CSRA RESA district. Therefore, the purpose of this study was to examine if a
relationship exists between school climate, as measured by the school climate calculation,
and student achievement, as measured by CCPRI, in the Georgia middle schools located
in the CRSA RESA district.
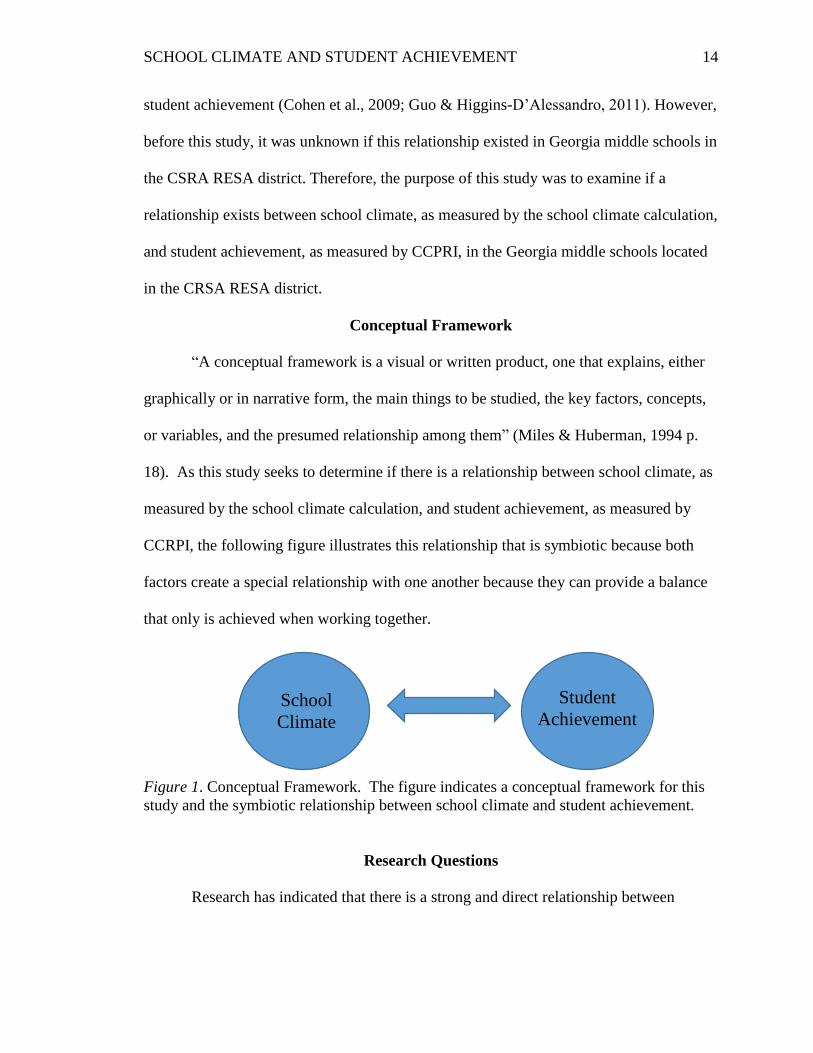
Conceptual Framework
“A conceptual framework is a visual or written product, one that explains, either
graphically or in narrative form, the main things to be studied, the key factors, concepts,
or variables, and the presumed relationship among them” (Miles & Huberman, 1994 p.
18). As this study seeks to determine if there is a relationship between school climate, as
measured by the school climate calculation, and student achievement, as measured by
CCRPI, the following figure illustrates this relationship that is symbiotic because both
factors create a special relationship with one another because they can provide a balance
that only is achieved when working together.
Figure 1. Conceptual Framework. The figure indicates a conceptual framework for this
study and the symbiotic relationship between school climate and student achievement.
Research Questions
Research has indicated that there is a strong and direct relationship between
School
Climate
Student
Achievement

SCHOOL CLIMATE AND STUDENT ACHIEVEMENT 15
school climate and student achievement (Cohen et al., 2009; Guo & Higgins-
D’Alessandro, 2011). However, it had yet to be determined if this relationship exists in
middle schools within the CRSA RESA of Georgia. As this study sought to determine if
a relationship exists, the following overarching question guided this study: What is the
relationship between school climate, as measured by school climate calculation, and
student achievement, as measured by the College and Career Ready Performance Index
(CCRPI) in middle schools in the Central Savannah River Area (CSRA) Regional
Educational Service Agency (RESA) region in Georgia? The CSRA RESA district has 31
middle schools. These middle schools have varying socio-economic rates and are located
in both rural and urban locations.
In order to fully answer this question, four sub-questions were developed:
1. What is the relationship between school climate, as measured by school
climate calculation, and student achievement, as measured by the College
and Career Ready Performance Index (CCRPI) in urban middle schools in
the Central Savannah River Area (CSRA) Regional Educational Service
Agency (RESA) region in Georgia?
2. What is the relationship between school climate, as measured by school
climate calculation, and student achievement, as measured by the College
and Career Ready Performance Index (CCRPI) in rural middle schools in
the Central Savannah River Area (CSRA) Regional Educational Service
Agency (RESA) region in Georgia?
3. What is the relationship between school climate, as measured by school
climate calculation, and student achievement, as measured by the College

SCHOOL CLIMATE AND STUDENT ACHIEVEMENT 16
and Career Ready Performance Index (CCRPI) in low poverty middle
schools in the Central Savannah River Area (CSRA) Regional Educational
Service Agency (RESA) region in Georgia?
4. What is the relationship between school climate, as measured by school
climate calculation, and student achievement, as measured by the College
and Career Ready Performance Index (CCRPI) in high poverty middle
schools in the Central Savannah River Area (CSRA) Regional Educational
Service Agency (RESA) region in Georgia?
Procedures
A quantitative study is appropriate given that the research question seeks to
examine the relationship between variables (Creswell, 2013). The variables, school
climate calculation, and student achievement have been measured so that numbered data
can be analyzed using statistical procedures (Creswell, 2013). A correlational model was
used because the direction from cause to effect cannot be established with certainty, and
extraneous variables can never be ruled out completely. Causal models can be extremely
useful for generating hypotheses for future research and for predicting potential causal
sequences in instances where experimentation is not feasible (Myers & Hansen, 2002),
such as in the field of education.
The researcher used archival data to analyze the correlation between the school
climate, as measured by the school climate calculation, and student achievement, as
measured by CCRPI, in middle schools in the CSRA RESA district. The archival data
used were collected by the Georgia Department of Education to report aspects of the
CCRPI for schools in Georgia for the 2015 school-term. This is a study based on archival
SCHOOL CLIMATE AND STUDENT ACHIEVEMENT 17
data; therefore, there were be no participants, per se. Instead, the researcher used the de-
identified data located on the Georgia Department of Education website via
http://ccrpi.gadoe.org/2016/. A Pearson’s correlational analysis to determine the
correlation was performed for each middle school in the CSRA RESA district. The
Pearson’s correlational analysis was used to determine whether the school climate
calculation has a significant relationship with student achievement for the 31 middle
school included in the study.
Significance of Study
CSRA RESA is a mixed geographical area that includes both rural and urban
settings. School leaders in this region need to attend to the needs of all students and
school stakeholders. If a relationship exists between school climate and students
achievement, then school leaders in this region might be encouraged to be purposeful and
look at improving the dimensions of school climate to ensure student achievement
growth. Districts and middle schools within the CSRA RESA region may take results
and find ways to improve their student achievement by impacting school climate. School
leaders should engage students, families, and educators to work together to develop, live,
and contribute to a shared school vision following the definition of school climate. For
the purpose of this study, the researcher used the National School Climate Council
definition for school climate: School climate is based on patterns of students’, parents’
and school personnel’s experience of school life and reflects norms, goals, values,
interpersonal relationships, teaching and learning practices, and organizational structures
(The National School Climate Council, 2007). If the relationship between school climate
and student achievement exists, schools should make this a focus of their school
SCHOOL CLIMATE AND STUDENT ACHIEVEMENT 18
improvement initiatives.
The researcher provides sufficient information regarding the region so that a
reader may transfer the findings to his or her setting. Once established, correlations can
be used to make predictions. In the future leaders throughout the state of Georgia could
use this research to investigate needs in their schools and apply findings to increase the
achievement of students in their schools. This research can be done in the CSRA RESA
district when looking at elementary and secondary settings, as well as in other RESA
regions for all educational levels.
Definition of Key Terms
Several items used in this study need further clarification because they are
acronyms and terms used primarily in the education realm and not generally known. The
meaning of the acronyms, CSRA, CCRPI, RESA must first be delineated. Also, the
definition of the term school climate and school climate calculation, as used in this study,
must be explained.
Central Savannah River Area (CSRA) - CSRA is division of RESA that serves the
counties of Burke, Columbia, Emanuel, Glascock, Jefferson, Jenkins, Lincoln,
McDuffie, Richmond, Taliaferro, Warren, and Wilkes by providing shared
services to improve the effectiveness of educational programs and services for
local school systems and to provide direct instructional programs to selected
public school students (Georgia Department of Education, 2017b).
College and Career Readiness Performance Index (CCPRI) - This index is a
comprehensive school improvement, accountability, and communication platform
for all educational schools that will promote college and career readiness for all
SCHOOL CLIMATE AND STUDENT ACHIEVEMENT 19
Georgia public school students (Georgia Department of Education, 2017c).
Regional Educational Service Agency (RESA) - RESA is an agency established to
provide shared services to improve the effectiveness of educational programs and
services for local school systems and to provide direct instructional programs to
selected public school students (Georgia Department of Education, 2017).
School Climate - School climate as the quality and character of school life. School
climate is based on patterns of students’, parents’ and school personnel’s
experience of school life and reflects norms, goals, values, interpersonal
relationships, teaching and learning practices, and organizational structures (The
National School Climate Council, 2007).
School Climate Calculation - The school climate calculation is the average score
generated from the survey score, the student discipline score, the safe and
substance-free learning environment score, and the school-wide attendance score
(Georgia Department of Education, 2017d).
Chapter Summary
Overall, concerns facing public education and the task of schools to increase
student achievement and graduate students by improving school climate is vital. This
study provides data for determining if school climate has a relationship with student
achievement. Schools would have a path to increasing student achievement by focusing
on ways to improve the climate of their school. If a positive correlation is determined in
this study, the information could assist schools in their school improvement efforts.
Organization of Study
This dissertation is organized into five chapters including the introduction,
SCHOOL CLIMATE AND STUDENT ACHIEVEMENT 20
literature review, methodology, data analysis, and discussion and implications of the data
analysis. Chapter 1 covers the introductory examination of challenges that schools are
facing, focusing on school climate and student achievement as a catalyst for
improvement. Chapter 2 provides a targeted literature review for establishing a more
detailed background on issues impacting school climate and student achievement in
middle schools. Chapter 3 describes the quantitative approach used in this study, as well
as data collection, participants, research design and research analysis. Chapter 4 provides
the analysis of the data used in this study including descriptive statistics and data tables
and charts. Chapter 5 discusses the data while tying findings back to prior research;
additionally, the implications of the findings, as well as recommendations future research,
are presented.
SCHOOL CLIMATE AND STUDENT ACHIEVEMENT 21
CHAPTER 2
REVIEW OF LITERATURE
Introduction
The review of literature cites key studies relevant to this examination of the
relationship between school climate and student achievement. Through a comprehensive
review of the literature, this chapter is intended to provide a background of the literature
that will aid in understanding this study. In conducting this review of the literature,
various definitions for school climate emerged, but the researcher identified one specific
definition that best suited this project. Using that definition, the review of the literature
addresses three main areas of school climate, including interpersonal skills, teaching and
learning practices, and organizational structure. These areas address the major ways that
school climate can be impacted by school leaders and staff. School climate was reviewed
regarding student achievement from both a national and state perspective. To understand
the correlation between school climate and student achievement, the overall review of
current trends in student achievement is necessary. As this study specifically addresses
middles schools, to complete the review of the literature, the researcher has highlighted
the history of middle schools, as well as existing research on the relationship between
middle schools and school climate. This information is crucial to understanding the
dynamics of a middle school, as well as how school climate in middle schools has been
reviewed in previous research.
The existence of a strong and positive school climate is essential for the
successful function of a school (Hoy & Hannum, 1997) and failing to nurture positivity in
a school is the best way to ensure lower student achievement (Moller, Mickelson,

SCHOOL CLIMATE AND STUDENT ACHIEVEMENT 22
Stearns, Bottia, Banerjee, & Society for Research on Educational Effectiveness, 2011). A
positive school climate focused on student learning is correlated to student achievement
(Hallinger, Bickman, & Davis, 1996). Successful schools have a school climate that is
significantly more positive than their less successful counterparts (Lindahl, 2009). Since
leaders play a pivotal role in fostering and sustaining school climate, it behooves them to
concentrate effort in this area (Johnson & Uline, 2005). Cohen et al. pointed out, “There
is a glaring gap between school climate research findings on the one hand and policy,
school improvement practice, and teacher educator efforts on the other. This gap
undermines K-12 students’ ability to learn and develop in healthy ways” (2009, p.181).
Therefore, this study examined if a relationship does exist in the middle schools in the
CRSA RESA district between school climate and student achievement.
School Climate
School climate is a relatively enduring quality of the school environment that is
experienced by teachers, student, and staff affects their behavior and is based on their
collective perceptions of behavior in schools (Hoy & Miskel, 2005; Keefe, Kelley, &
Miller 1985; Marks 1995; Tableman, 2004). School climate describes the atmosphere,
working conditions, and job demands at a school. Climate is an individual phenomenon
that lends itself to quantitative research (Dennison, 1996; Hellriegel & Slocum, 1974).
However, Benson (2003), Morrison (2007), and Sims (2005), noted in their quantitative
dissertation studies that widening the scope of their studies by using different
methodological lenses (Sims, 2005) and permitting others with the ability to see the real
world differences in school climate would deepen the understanding of the construct of
school climate and its impact on student achievement. Also contributing to this construct
SCHOOL CLIMATE AND STUDENT ACHIEVEMENT 23
would be allowing teachers to express their opinions about the relationship between
school climate and student achievement (Benson, 2003). Many researchers suggested
that variables associated with school climate such as social support, caring classroom,
teacher commitment, and student-teacher relations not be only desirable but prerequisites
for positive behavioral change (Flay, 2000; Zullig, Huebner & Patton, 2010).
Increased policing of schools, the use of metal detectors, and punitive disciplinary
practices are factors that have been found to diminish a school’s climate. While these
methods are aimed at making schools safer, the use of surveillance technologies and full-
time law enforcement has not served as an effective deterrent for problematic behaviors
(Devine, 1996; Kupchik, 2010; Schreck, Miller, & Gibson, 2003). Increased surveillance
measures in schools are linked to decreased clarity and fairness of rules (Gottfredson,
Gottfredson, Payne, & Gottfredson, 2005), decreased relational trust within the school
community (Bryk, Sebring, Allensworth, Luppescu, & Easton, 2010) and decreased
student perceptions of safety, respect, and socio-emotional learning (McCoy, Roy, &
Sirkman, 2013). Additionally, Black students and those with particular educational
disabilities, even in schools where delinquency and disorder were reported as low (Welch
& Payne, 2010), were disproportionately likely to be removed from the classroom for
disciplinary reasons (Fabelo, Thompson,Carmichael, Marchbanks, & Booth, 2011) or
suspended (Hoffman, 2014). Similarly, punitive measures were found to push out
students from the school community and lead to higher dropout rates (Gonzalez, 2012).
An American Psychological Association Task Force (2008) concluded that these punitive
measures contributed to reduced school climate ratings.
When school climate is defined narrowly, it can appear as a relatively

SCHOOL CLIMATE AND STUDENT ACHIEVEMENT 24
independent factor. However, when viewed contextually, it becomes clear that it is
related to everything else. In a study of urban public schools, Jones, Shindler, Cadenas,
& Taylor (2003) found that all of the various aspects of climate were correlated to one
another at most schools. Where one variable was found to be either high or low, the
others were as well. In other words, no cases were found in which one variable, such as
the discipline culture was low and another, such as student interaction was high. While
more direct methods of intervention with the goal of improving student achievement
make sense, if the basic structure of a school is dysfunctional, its capacity to promote its
desired goals is limited (Fullan, 2003).
As Anderson, (1982) and Brown & House, (1967) noted, by completing a review
of the research on school climate, it was determined that school climate is a complex
construct that is unique to individual organizations and understanding this construct will
improve the understanding of how schools function and impact student learning. For this
study, the researcher used the following definition developed by The National School
Climate Council (2007):
School climate refers to the quality and character of school life. School climate is
based on patterns of students’, parents’ and school personnel’s experience of
school life and reflects norms, goals, values, interpersonal relationships, teaching
and learning practices, and organizational structures.
A sustainable, positive school climate fosters youth development and
learning necessary for a productive, contributing and satisfying life in a
democratic society. This climate includes norms, values, and expectations that
support people feeling socially, emotionally and physically safe. People are

SCHOOL CLIMATE AND STUDENT ACHIEVEMENT 25
engaged and respected. Students, families, and educators work together to
develop, live and contribute to a shared school vision. Educators model and
nurture attitudes that emphasize the benefits and satisfaction gained from
learning. Each person contributes to the operations of the school and the care of
the physical environment. (p. 4)
The definition developed by the National School Climate Council focuses on
three key areas: interpersonal relationships, teaching and learning practices, and
organizational structures. In this section of the literature review, the researcher focused
on these three areas and positive ways to improve school climate
Interpersonal Relationships
The professional knowledge of effective teachers reaches beyond merely the
knowledge of subject matter (content knowledge) and instructional strategies
(pedagogical knowledge); indeed, professional knowledge also encompasses an
understanding of students and environmental contexts (Cochran, DeRuiter, & King,
1993). An attribute of professionalism is a commitment to continuous improvement and
perpetual learning. Interestingly, effective teachers monitor and strengthen the
connection between their own development and students’ development (Fullan, 1993).
Research has also shown that teacher's work environment, peer relationships and feeling
of inclusion and respect are important aspects too. In a study of 12 middle schools, Guo
(2012) found that the teachers' work environment, which may be considered as an
indicator of teachers' relationship with each other and school administrators, fully
mediated the path from a whole school character intervention to school climate change.
Albanese (2004) further noted that interpersonal skills define who we are and for

SCHOOL CLIMATE AND STUDENT ACHIEVEMENT 26
teachers, it distinguishes their ability to be average, good, or outstanding in their
interactions with their students, and in their ability to teach the curriculum.
Teachers’ interpersonal skills can also affect their ability to help students gain
information from the curriculum that they are taught (Albanese, 2004; Cemalogu, 2007).
Fan (2012) concluded that all teachers should bear in mind that a healthy interpersonal
relationship is one indispensable instrument of high productivity and achievement in
fields of human endeavor including the education industry. The relationship between
teachers and students foster a bond, which in turn, teaches the students self-confidence
and creates a positive working relationship between students and teachers (Baker, Rieg,
& Clendaniel, 2006; Greenlee & Bruner, 2001). In middle school students, the quality of
peer relationships accounts for 33 to 40% of the variance in the achievement of middle
school students (Johnson, Johnson, & Roseth, 2010). Capitalizing on positive teacher-
student relationships during adolescence can be a powerful way to increase youth
development (Yu, Johnson, Deutsch, & Varga, 2016). If a school has an emphasis on
learning, students will be more likely to embrace this process and rise to the high
expectations that have been set for them (Goddard, Hoy, & Woolfolk, 2000; Muijs &
Reynolds, 2002; & Roney, Coleman, & Schlichting, 2007). These relationships between
students and their teachers solidify the teachers’ beliefs that students will become
successful learners, which can affect a students' academic performance (Hamre & Pianta,
2005; McGuigan & Hoy, 2006). In research by Mitchell, Bradshaw, & Leaf (2010)
students viewed student-teacher relationships as one of the school level factors that
influenced school climate.
Teaching and Learning Practices

SCHOOL CLIMATE AND STUDENT ACHIEVEMENT 27
Curriculum alignment and planning is essential to create a positive climate in a
school. In high-poverty schools with significant and sustained improvements in student
performance, researchers found that some of these schools compiled and gave teachers
three-ring binders full of well-designed lesson plans at the beginning of the year
(Chenoweth, 2009). Teachers seemed to welcome the support because it allowed them to
focus on delivering the lessons well and managing behavior. In the words of one teacher
at Lockhart Junior High, "It was very overwhelming my first year. There was just a lot to
keep up with and keep track of." Striking lesson planning from her list of first-year
worries removed some creases from her brow and made her feel "like I had support" (p.
101). High-quality lesson plans can give new or struggling teachers, in particular, an
important lifeline. This may be the best way to think of packaged or borrowed lesson
plans—as a support for teachers, not a mandatory "teacher-proof" curriculum (Goodwin,
2016).
All teachers whether veteran or novice must generate curriculum plans for their
students. To generate compelling curriculum, teachers have to embed the standards in
learning contexts that enliven the curiosity and thinking of students and that represent
with validity the nature and intent of the disciplines they teach (Tomlinson, 2010).
Continual review of plans to ensure that lessons are aligned to standards is part of the
curriculum planning process. Effective teachers alter, adjust, and change their instruction
depending on who is in the classroom and the extent to which those students are
achieving. Effective teachers are not so devoted to their practice that they ignore the
students in front of them (Christenbury, 2010). The curriculum planning process is an
essential element that is necessary to strengthen school climate.

SCHOOL CLIMATE AND STUDENT ACHIEVEMENT 28
Various research studies have found that effective teachers tend to demonstrate
certain behaviors while making planning decisions (Haynie, 2006; Fuchs, Fuchs, &
Phillips, 1994; McEwan, 2002). One such behavior is that effective teachers construct a
blueprint of how to address the curriculum during the instructional time (McEwan, 2002).
Teachers that are successful also collaborate with one or more teachers while planning,
rather than plan lessons alone (Haynie, 2006). A third strong indicator of effectiveness is
a teacher that facilitates planning units in advance to make intra- and interdisciplinary
connections (McEwan, 2002). Another very important behavior demonstrated by good
teachers is using student assessment data to plan what goals and objectives to address
(Haynie, 2006) as well as taking into account the abilities of their students and the
students’ strengths and weaknesses as well as their interest level (Fuchs et al., 1994).
Research has also determined that effective teachers plan for the context of the
lesson to help students relate, organize, and make knowledge become a part of students’
long-term memory (Marzano, Pickering, & Pollock, 2001). Another indicator of success
is to sequence material to promote student’s cognitive and developmental growth
(Panasuk, Stone, & Todd, 2002) while using their knowledge of available resources to
determine what resources they need to acquire or develop (Buttram & Waters, 1997).
Lastly, effective teachers plan instruction in a multi-sourced manner (Allington &
Johnston, 2000).
Assessment is another key component of teaching and learning practices. Using
assessment practices to monitor student progress, improve teacher practices, and adjust
instruction based on results enhance the educational experience for students. Schools
have used grades for a variety of purposes: communication, self-evaluation, sorting and

SCHOOL CLIMATE AND STUDENT ACHIEVEMENT 29
selecting, motivation, and program evaluation (Guskey, 1996) and therein lies the
problem. Some teachers emphasize one purpose, and some emphasize another.
Consequently, they use different criteria for determining grades, which can result in
students who achieve at the same level receiving different grades (O’Connor & Wormeli,
2011). Grades are small symbols used as shorthand for much larger descriptors.
Contrary to the emotional baggage so often applied to each one, they are not full
descriptors themselves. Grades must be informative to support students' learning. We
are mindful of each symbol's purpose in the learning process and, in particular, whether
they refer to formative or summative assessments (O’Connor & Wormeli, 2011).
Instruction is the third component of teaching and learning practices that
influence school climate. Effective teachers use criteria such as appropriateness for grade
level, alignment to national, state, or local standards, the accuracy of information, the
time allowed for the lesson or unit, and the learning benefits that come from using the
resource (Buttram & Waters, 1997). Once the learning objectives are developed,
evidence suggests that expert teachers are more competent in translating their
instructional plans into actions than non-expert teachers (Borko & Livingston, 1989).
Additionally, expert teachers anticipate the difficulties students might encounter while
learning the content of the lesson. They consider students’ thinking to assess the success
of the lesson plan and then modify their instruction promptly (Leinhardt, 1993). With the
onslaught of standardized testing, teachers feel less capable of being flexible with the
curriculum. Teachers report a narrowing of the curriculum that focuses on tested items
and breadth of content while sacrificing depth (Au, 2007). Pacing guides have become a
prescribed solution to ensure time is spent on certain lessons and topics. The best pacing
SCHOOL CLIMATE AND STUDENT ACHIEVEMENT 30
guides emphasize curriculum guidance instead of prescriptive pacing. The guides focus
on central ideas and provide links to exemplary curriculum material, lessons, and
instructional strategies (David, 2008).
Organizational Structures
Research indicates that instructional leaders do impact student achievement,
though indirectly (Hallinger, 2005). Effective, forward-thinking leaders understand that
creating a vision is at the heart of what they do. Creating a vision is a first step that
becomes the impetus through which all future decisions, goals, and dreams are funneled
(Kearney & Herrington, 2010). They also understand that if a vision is to reach fruition,
it must be inspiring enough to be embraced by others within the organization; it must
become a shared vision (Kouzes & Posner, 2002). Principals of high achieving schools
are clear about the school’s vision and goals (Leithwood & Riehl, 2003). From the
vision, goals for learning are established. Buy-in to both the vision and the learning goals
are important; the savvy leader understands this and seeks a commitment from the school
community (Kearney & Harrington, 2010).
High-achieving schools have principals who communicate to all that the school’s
most important mission is learning (Cotton, 2003) believe that established school goals
are attainable (Leithwood & Riehl, 2003), and expect that both teachers and students can
meet established goals (Leithwood & Riehl, 2003). Research related to leaders’ roles in
monitoring curriculum and instruction indicates that both teachers and leaders believe it
is important that someone is positioned to guide the curriculum and to make decisions
about staff development needs (Portin, Schneider, DeArmond, & Gundlach, 2003). Also,
effective leaders ensure continuity in the school instructional program (Leithwood &

SCHOOL CLIMATE AND STUDENT ACHIEVEMENT 31
Riehl, 2003) and must spend time in classrooms to monitor instructional programs,
curriculum implementation, and the quality of instructional practices (Fink & Resnick,
2001). Hoy, Sabo, & Barnes, (1996) and Abu-Saad & Hendrix, (1995) affirmed that the
principal is the single most important individual in the development of a school’s climate.
In schools, therefore, principals can become effective change agents who are responsible
for creating a healthy school climate.
In a meta-analysis of 70 studies, Waters, Marzano, and McNulty found that
effective leadership is comprised of 21 key areas of responsibility (Waters, Marzano, &
McNulty, 2003). Each of these areas is positively correlated with higher levels of student
achievement. Many of these 21 areas require planning for fruition. For instance, one of
the key areas of responsibility is order. To help maintain order, effective leaders
establish a set of standard operating procedures and routines. These procedures are the
result of planning. The importance of planning for both daily operations and long-range
goal attainment cannot be underestimated. Likewise, consider the key area of
responsibility that is discipline. To maintain discipline, effective leaders establish
procedures that “protects teachers from issues and influences that would detract from
their teaching time or focus” (Waters et al., 2003, p. 4). Without planning, creating and
implementing these procedures would be impossible. As evidenced, efficient and
comprehensive planning is an essential skill of effective leaders.
Several quantitative studies (Hallinger & Heck, 1998; Hoy, Tarter, & Bliss, 1990;
Kelley, Thornton, & Daughtery, 2005) have affirmed that school principals have the
potential to impact student achievement and the climate within the school building. A
smoothly functioning school requires a leader's focused time and effort on those factors

SCHOOL CLIMATE AND STUDENT ACHIEVEMENT 32
that keep it running so. More than anything else, the school must first be a safe and
positive learning environment for all. School leaders are charged to ensure this (Cotton,
2003). Schools showing academic improvement are more likely to have strong
organizational managers (Horng & Loeb, 2010). Thoughtful and careful consideration
while scheduling can result in more time for instruction (Danielson, 2002).
It behooves all school leaders to involve parents in the school community.
Principals who reach out to involve parents and community members are more successful
than others (Stronge & Leeper, 2012). In a series of focus groups and a nationally
representative survey of 1,006 parents of current and recent high school students from
urban, suburban, and rural communities, Bridgeland et al. noted that among other
findings, high-performing schools do a better job of communicating with parents, high-
performing schools are more likely to be perceived as encouraging parental involvement,
and parents of students in low-performing schools are much less likely than their peers to
talk with their children’s teachers. Also, high performing schools are more likely than
low performing schools to notify and engage parents if their child is having performance
issues at school (Bridgeland, Dilulio & Morison, 2008).
Effective leaders understand they do not act in a vacuum; they realize the
importance of bringing stakeholders into the mix in a collaborative decision-making
model. Moreover, they reach out to stakeholders on a continual basis (Cotton, 2003).
School leaders serve as advocates for their schools. As such, it is their responsibility to
“communicate a positive image of their school” (Stronge, Richard, & Catano, 2008, p.
159). In a study of partnering benefits, two Ontario secondary schools heavily involved
in community partnerships served as the sample. Conclusions drawn about partnering

SCHOOL CLIMATE AND STUDENT ACHIEVEMENT 33
benefits include, educators met the needs of their students and programs that could not be
addressed in the school; partnering provided material, financial, and social support;
principals obtained district resources unavailable to other schools, and the schools’
reputations within the communities were raised. Partnering with outside agencies can
benefit students, teachers, programs, and participating agencies (Hands, 2010). In their
review of the school climate research, Skiba et al. (2014) found a significant association
between school-level climate variables, especially principals’ perspectives on discipline
and racial disparities in out-of-school suspension and expulsion; however, their study’s
focus was on infraction rates, so student academic performance was beyond their scope.
Student Achievement
National Trends
When examining data from the National Assessment of Educational Progress
(NAEP), the trends indicate a one % growth for 4th graders in reading, while 8th grade
math scores declined. 8th grade reading and 4th grade math continue with a slight
downward trend. For 8th grade students in mathematics, the average reading score in
2015 of 265 was lower than the 2013 score of 268. Among 8th-grade students in reading,
the percentage performing at or above Basic in 2015, 76%, was lower than in 2013 when
the percentage was 78. However, the percentage was higher in 2015 than in 1992 when
only 69% scored at or above Basic. Similarly, in 2015, only 34% of 8th grade students
performed at or above Proficient compared to the 2013 result of 36%. When comparing
4th and 8th grades students to their international peers, both grade levels scored higher
than the international average score in math and science (National Center for Education
Statistics, 2016).

SCHOOL CLIMATE AND STUDENT ACHIEVEMENT 34
According to the United States Department of Education’s 2011 Condition of
Education report, about 68% of 12th-graders in high-poverty schools graduated with a
diploma in 2008, compared with 91% of 12th-graders in low-poverty schools (National
Center of Education Statistics, 2011). While each major racial and ethnic group had
more students graduate as of the class of 2011, massive gaps remained between different
groups of students. While 87% of Asian students and 84% of White students in the class
of 2011 graduated on time, only 71% of Hispanic, 67% of Black and 65% of American
Indian students in the same class graduated on time. Similarly, 77% of male students
graduated on time in 2011 compared with 84% of female students. The statistics show
that male students, from minority backgrounds, graduate on time a rate of only about one
half (Stetser & Stillwell, 2014).
Georgia Data
When reviewing the most recent CCRPI reports for Georgia, the middle schools
in the CSRA RESA district have an average achievement score of only 25.9 points. In
comparison, the average achievement score for middle schools in Georgia was 30.2
points (Georgia Department of Education, 2017c). In the content mastery category,
middle schools in the CSRA RESA earned an average of 19.29 points compared to all
middle schools in Georgia earning an average of 24.97 points (Georgia Department of
Education, 2017c).
Data from Georgia performance on the 2015 National Assessment of Educational
Progress (NAEP) shows declines in the percentage of students performing at or above
proficient level in 4th grade math and 8th grade math and reading. In 2015 only 35% of
4th graders achieved this level of proficiency, down from 39% in 2013 and lower than the

SCHOOL CLIMATE AND STUDENT ACHIEVEMENT 35
national percentage of 39%. 4th grade reading showed no growth with 34% of students
at or above proficient in 2013 and 2015 and was not significantly different from the
nation at 35%. 8th grade students in math declined from 29% proficient in 2013 to 28%
in 2015. The 8th grade math percentage was smaller than national percentage at 32%.
8th grade reading dropped two percentage points from 32% in 2013 to 30% in 2015 and
remained below national percentage of 33% (NAEP, 2015).
Middle School Implications
History of Middle School
Middle Schools were designed to create a bridge for students, one that would
focus on the specific needs and developmental stages of children between the ages of 11
and 13 (Cushman & Rogers, 2008). Educational reformers began pushing for the
creation of junior high schools beginning in the 1940s. They argued that specialized
schools for students in grades seven through nine would better prepare young adolescents
for high school by exposing them to a high school like environment without the trauma of
placing them in the same building as older teenagers. By the late 1960s, middle school
supporters were similarly arguing that sixth grade students would benefit from being
separated from elementary school children. They believed that the social, psychological,
and academic needs of young adolescents are distinct from young children and older
youth (National Middle School Association, 1995). Thus, placing young adolescents
with high school students hinders social development while placing them with
elementary school students slows academic progress. They, therefore, argued that middle
school systems have lower dropout rates relative to junior high school systems (Clark and
Clark, 1993; National Center for Education Statistics [NCES], 2002).

SCHOOL CLIMATE AND STUDENT ACHIEVEMENT 36
In 1993 to 1994, there were 80,740 public schools in the United States, about 15
% of them were middle schools. The number of middle schools increased from 9,086 to
11,712 between 1987-88 and 1993–94, while the number of elementary and secondary
schools remained about the same. The growth occurred almost solely in schools with
grades 6–8. Of some 41.6 million students in public schools in 1993–94, 6.8 million
were enrolled in middle schools [NCES], 2011. A substantial change in the way middle
grade students are educated has taken place over the last twenty years. An ever-
increasing number of sixth grade students are being educated in middle schools. The
motivation for this change was to better prepare students for high school by providing
young adolescents with more specialized courses and a high school like environment
without actually placing pre-teens in high schools (Bedard & Do, 2005).
Despite the positive rhetoric of middle school advocates, several researchers have
raised concerns about the lack of personal attention and monitoring in middle schools.
Although we know of no systematic evidence, before this study, to either validate or
refute these concerns, some researchers have pointed to the decline in sixth grade math
and science scores as evidence that middle schools are failing (Bedard & Do, 2005).
Middle Schools and School Climate
Although middle schools are organized for the expressive development of
students, academic achievement remains an important objective for all public schools
including middle schools (Hoy & Hannum, 1997). Several researchers have focused their
climate studies on the middle school level. Sumner (2006) conducted a quantitative study
designed to extend previous research by determining the extent to which value-added
gains made by middle schools in Tennessee could be attributed to changes in climate.

SCHOOL CLIMATE AND STUDENT ACHIEVEMENT 37
DeLisi (2008) studied the climate of middle schools in the era of accountability and
attempted to determine how that accountability had impacted climate. Finally, Bergren
(2014) analyzed the relationship between school climate and student achievement
through the creation of an index of climate-factors for which publicly available data
existed. Sumner (2006) investigated the relationship between school climate and student
performance to confirm previous research by specifically examining value-added gains
over time. Using the School Climate Inventory (SCI) and the 2005 State of Tennessee
Report Card, Sumner used a correlation analysis to analyze 40 middle schools in the State
of Tennessee. He found a significant correlation between climate and achievement in
language arts (r =.44, p<.05); he also found significance with regard to climate and
social studies (r=.37, p<.05) and science (r = .33, p<.05) scores. In doing so, Sumner
was able to confirm previous research that had identified a relationship between school
climate and student achievement.
DeLisi (2008) found a connection between academics and the use of data-driven
decision making and improved achievement. DeLisi was primarily concerned with how
the accountability movement had impacted the behaviors of schools attempting to
improve their accountability status. DeLisi compared two middle schools, one that had
improved its accountability status and one that had not. Students (n = 156) and teachers
(n = 38) at both schools were surveyed regarding their perceptions of climate, leadership,
and educational practices. The results of the surveys from the two school were
compared. DeLisi determined that the improving school had done so through focused
decision making and implementation of best practices in the context of a culture of
caring, whereas the non-improving school had compromised a culture of caring.
SCHOOL CLIMATE AND STUDENT ACHIEVEMENT 38
Bergren (2014) revealed a statistically significant relationship between the
Climate Inventory and student achievement in middle schools. Similarly, the regression
model built on the same climate factors as the Climate Inventory indicated a statistically
significant relationship between school climate and student achievement in each content
area. Middle schools (n = 335) in the Commonwealth of Virginia were selected for this
study. Each of the cited studies found a relationship between school climate and the
achievement of students at the middle school level. For the purposes of this study, the
research also focused on the middle level, examining middle schools in the CSRA RESA
region of Georgia.
School Climate and CCRPI Score Calculations
This section of the literature review reviews how the state of Georgia measures
school climate by using the Georgia Student Health Survey II, Georgia Personnel Survey,
and Georgia Parent Survey. All of these documents will be defined, and their part in the
school climate calculation will be explained. This section also explains how Georgia
measures student achievement. An explanation is offered of the calculations of the
CCRPI score for student achievement and how it is determined.
School Climate
The Georgia Department of Education (GaDOE) is one of the first states with a
defined method in the collection and analysis of school climate data. Using the National
School Climate Center definition for school climate as a guide, the Georgia Department
of Education developed a school climate calculation (Georgia Department of Education,
2017d). The GaDOE determines a school climate calculation based in part on data
collected from a statewide annual survey titled the Georgia Student Health Survey II
SCHOOL CLIMATE AND STUDENT ACHIEVEMENT 39
(GSHS II). The GSHS II is an anonymous, statewide survey instrument developed by the
GaDOE in collaboration with the Georgia Department of Public Health and Georgia State
University. The GSHS II identifies safety and health issues that can have a negative
impact on student achievement and school climate (Georgia Department of Education,
2017d). The GaDOE identified four dimensions of school climate: safety, teaching and
learning, interpersonal relationships, and institutional environment (Georgia Department
of Education, 2017d). These dimensions are correlated to the GSHS II questions in
Appendix A.
Georgia uses four components to calculate the school climate, a survey score, a
student discipline score, a safe and substance-free learning environment score, and a
school-wide attendance score (Georgia Department of Education, 2017d). The results of
the GSHS II are averaged along with data from two other instruments, the Georgia
Personnel Survey (GSPS) and the Georgia Parent Survey. The Georgia School Personnel
Survey (GSPS) is modeled after the student survey and includes 31 questions. The GSPS
is for all certified and classified staff members who work at least 50% of the day in the
school. At least 75% of certified and classified staff members must participate in the
survey to be eligible for the School Climate Star Rating. Survey responses are
anonymous and are submitted directly to the Georgia Department of Education for
analysis. All parents in Georgia are encouraged to participate annually online in the
Georgia Parent Survey. As with the personnel survey, all responses are anonymous and
are submitted to the Georgia Department of Education for analysis.
The safe and substance-free learning environment score is based upon data on
student drug-related incidents, violent incidents, bullying and harassment incidents and

SCHOOL CLIMATE AND STUDENT ACHIEVEMENT 40
survey results on violent incidents and bullying and harassment incidents. The school-
wide attendance score is averaged from data collected on student attendance, average
daily personnel attendance, average daily administrator attendance, and average daily
staff attendance. The final component is the student discipline score that is a weighted
suspension rate. The weighted suspension rate is calculated based on discipline outcomes
for students in the school. Each student receives one score from the following criteria
based on the most severe discipline incident. Students receiving any In School
Suspension (ISS) are assigned .50 point, one to two days Out of School Suspension
(OSS) is assigned one point, three to four days of OSS is assigned three points, five to
nine days of OSS is assigned five points, and students over ten days of OSS are assigned
ten points. Students that have to attend an Alternative School for discipline reasons are
assigned six points, and students that are expelled from school are assigned seven points.
The sum of the student weighted suspension rate is then divided by the total number of
students enrolled, subtracted from one and multiplied by 100. This calculation
determines a school’s weighted suspension rate. These four components, the survey
score, the student discipline score, the safe and substance-free learning environment
score, and the school-wide attendance score are averaged together for the final school
climate calculation (Georgia Department of Education, 2017).
For reporting purposes, the GaDOE uses a star rating system of one to five stars,
with five stars representing an excellent school climate, and one star representing a
school climate most in need of improvement. In 2016, middle schools were awarded a
one star rating for a calculation of 71.1 and below, a two-star rating for a calculation
between 71.2 and 77.2, a three-star rating for a calculation between 77.3 and 83.3, a four-

SCHOOL CLIMATE AND STUDENT ACHIEVEMENT 41
star rating was awarded for a calculation between 83.4 and 89.4 and the five star award
was given to schools with a climate calculation at 89.5 and above (Georgia Department of
Education, 2017). Schools have access to comprehensive reports which allow them to
identify areas in need of improvement and plan targeted student interventions to improve
achievement for all students (Georgia Department of Education, 2017).
Student Achievement
The most common way to measure student achievement in Georgia is to review
scores based on the College and Career Ready Performance Index (CCRPI). The CCRPI
is a comprehensive school improvement, accountability, and communication platform for
all educational stakeholders designed to promote college and career readiness for all
Georgia public school students (Georgia Department of Education, 2017c). This measure
provides five areas in which schools can earn points toward their score and include
achievement, progress, achievement gap, Economically Disadvantaged (ED)/English
Learners (EL)/Students with Disabilities (SWD) performance, and exceeding the bar.
Each of the five areas is broken down into specific data points for each level of K-12
education. For this research, the focus was on middle school components. Appendix B
illustrates the breakdown of the achievement area for middle schools.
The achievement area accounts for 50% of the overall CCRPI score. The
progress area is calculated based on the growth of student performance for each school
and is 25% of the overall score. The achievement gap score is determined by reviewing
the gaps in performance for each curriculum area: language arts/reading, math, social
studies, and science. This calculation is 15% of the overall score. Schools can earn
additional points when the performance of economically disadvantaged, English learners,

SCHOOL CLIMATE AND STUDENT ACHIEVEMENT 42
and students with disabilities meet state performance levels. Additional points are earned
for state-approved school-level initiatives. The total points in these areas are calculated
to determine an overall CCRPI score for each middle school in Georgia. In 2016,
Georgia middle schools fell short of high marks by having an average CCRPI score of
71.5 out of 100 possible points. Middle schools in Georgia earned 30.2 points for
achievement, 34.6 for progress, and 6.7 points in the achievement gap category (Georgia
Department of Education, 2017c). In 2016 middle schools in the CSRA RESA area
scored an average of 66.3 on CCRPI and only earned an average of 25.73 points for
achievement (Georgia Department of Education, 2017c).
The CCPRI for Georgia is a complex system of calculations to determine different
aspects of school effectiveness. This study is focusing on the school climate calculation
and the student achievement score from the CCRPI report.
Chapter Summary
To date, no study had been undertaken in the state of Georgia CRSA RESA
region to investigate the correlation between school climate and student achievement.
Absent from the literature was the formulation of a process for quantitatively determining
the impact of school climate on student achievement using only publicly available data.
This study commenced filling that gap by using archival data to determine if there is a
correlation between the school climate score, as measured by the school climate
calculation and student achievement, as measured by the CCRPI in middle schools in the
CSRA RESA region.
Using the National School Climate Council definition, addressed were three main
areas of school climate, including interpersonal skills, teaching and learning practices,

SCHOOL CLIMATE AND STUDENT ACHIEVEMENT 43
and organizational structure. Following the review of school climate, student
achievement was reviewed from both a national and state perspective to understand the
correlation between school climate and student achievement. In addition, the overall
review of current trends in student achievement was reviewed. The final section
highlighted the implications of middle schools by sharing the history of middle schools,
as well as research on the relationship between middle school student achievement and
school climate.
This review of the literature informs the methodology to examine the relationship
between school climate, as measured by school climate calculation and student
achievement, as measured by the College and Career Ready Performance Index (CCRPI)
in middle schools in the Central Savannah River Area (CSRA) Regional Educational
Service Agency (RESA) region in Georgia.
SCHOOL CLIMATE AND STUDENT ACHIEVEMENT 44
CHAPTER 3
METHODOLOGY
This chapter will introduce the research methods used in this study. The chapter
begins by restating the problem, as well as the purpose statement and research question.
This chapter describes the quantitative approach used in this study, as well as research
design, participants, data collection, and research analysis.
An alternative to measuring school climate through the use of surveys and other
perception-based data was to develop a quantitative study to examine the relationship
between school climate and student achievement using state-reported data that is publicly
available as archival data on the Georgia Department of Education website. This
approach provided a noninvasive method for the study of school climate and eliminated
the need to control for variations in routine behaviors that might influence survey
responses and skew results (Smith, 2005).
Georgia schools continue to struggle to ensure that student achievement has
reached targeted levels and to close the gap in student achievement. In Georgia,
assessments are used to determine student achievement and if schools are meeting
standards identified. Schools are expected to use the data from assessments to remediate
or enrich learning for students and strengthen areas that address school effectiveness. The
CCPRI offers schools quantitative data on multiple dimensions of school effectiveness.
School climate and student achievement are two important aspects of school
effectiveness that are reported in the CCRPI. Research has been conducted to show a
correlation between these components (Cohen et al., 2009; Guo & Higgins-
D’Alessandro, 2011). However, at this point, it is unknown if this relationship exists in

SCHOOL CLIMATE AND STUDENT ACHIEVEMENT 45
middle schools in the CSRA RESA district. Therefore, this study examined if, in fact, a
relationship does exist in the middle schools in the CRSA RESA district between school
climate and student achievement.
Purpose Statement and Research Questions
The purpose of this study was to determine if there is a correlation between the
school climate score, as measured by the school climate calculation, and student
achievement, as measured by the CCRPI in middle schools in the CSRA RESA region.
Therefore, the following overarching question guided this study: What is the relationship
between school climate, as measured by school climate calculation and student
achievement, as measured by the College and Career Ready Performance Index (CCRPI)
in middle schools in the Central Savannah River Area (CSRA) Regional Educational
Service Agency (RESA) region in Georgia?
In order to fully answer this question, four sub-questions were developed:
1. What is the relationship between school climate, as measured by school
climate calculation, and student achievement, as measured by the College
and Career Ready Performance Index (CCRPI) in urban middle schools in
the Central Savannah River Area (CSRA) Regional Educational Service
Agency (RESA) region in Georgia?
2. What is the relationship between school climate, as measured by school
climate calculation, and student achievement, as measured by the College
and Career Ready Performance Index (CCRPI) in rural middle schools in
the Central Savannah River Area (CSRA) Regional Educational Service
Agency (RESA) region in Georgia?

SCHOOL CLIMATE AND STUDENT ACHIEVEMENT 46
3. What is the relationship between school climate, as measured by school
climate calculation, and student achievement, as measured by the College
and Career Ready Performance Index (CCRPI) in low poverty middle
schools in the Central Savannah River Area (CSRA) Regional Educational
Service Agency (RESA) region in Georgia?
4. What is the relationship between school climate, as measured by school
climate calculation, and student achievement, as measured by the College
and Career Ready Performance Index (CCRPI) in high poverty middle
schools in the Central Savannah River Area (CSRA) Regional Educational
Service Agency (RESA) region in Georgia?
Research Design
The design is a quantitative, correlational study. Correlation is appropriate as it
seeks to determine if there is a relationship between two variables. These variables can
be measured so that numbered data can be analyzed using statistical procedures
(Creswell, 2013). A correlational model was used because the direction from cause to
effect cannot be established with certainty, and other variables can never be ruled out
completely. Causal models can be extremely useful for generating hypotheses for future
research and for predicting potential causal sequences in instances where experimentation
is not feasible (Myers & Hansen, 2002). This study does not seek to determine causality;
therefore, there was no independent or dependent variable.
Participants
This is a study based on archival data; therefore, there were no participants per se.
Instead, the researcher used de-identified data located on the Georgia Department of

SCHOOL CLIMATE AND STUDENT ACHIEVEMENT 47
Education website (http://www.gadoe.org/CCRPI/Pages/default.aspx). The datasets used
for this study represented the School Climate Score and the Achievement Score from
each school’s 2016 CCRPI calculation. These data were obtained from the Georgia
Department of Education by using the CCPRI website to identify data for each middle
school in the CSRA RESA region. The school climate score is a calculation of the results
of the Georgia Student Health Survey II (GSHS) that is administered annually to all
Georgia public school students. The GSHS II for middle and high school students covers
various topics, such as school climate and safety, graduation, school dropouts, alcohol
and drug use, bullying and harassment, suicide, nutrition, and sedentary behaviors. The
GSHS II for elementary students includes school safety and school climate questions only
(Georgia Department of Education, 2017). The school climate score is a calculation of the
results of the GSHS II. These scores are averaged along with data from two other
instruments, the Georgia Personnel Survey (GSPS), which annually surveys all teachers,
staff, and administrators in Georgia schools, and the Georgia Parent Survey, an annual
survey that parents complete online.
The student achievement data is collected from the annual CCRPI report. This
measure provides five areas in which schools can earn points toward their score and
include achievement, progress, achievement gap, Economically Disadvantaged
(ED)/English Learners (EL)/Students with Disabilities (SWD) performance, and
exceeding the bar. Each of the five areas is broken down into specific data points for
each level of K-12 education. All data used in this study are publicly available on the
Georgia Department of Education website. The advantages of using archival data for this
study include resource savings, relative ease of data transfer and storage, and the

SCHOOL CLIMATE AND STUDENT ACHIEVEMENT 48
organization may be more open to using existing data versus collecting new data
(Hoffman, Reiter-Palman, Shultz, 2005).
Sample
The population for this study was the data pulled from the 31 middle schools in
the CSRA RESA region of Georgia. The region consists of the counties Burke,
Columbia, Emanuel, Glascock, Jefferson, Jenkins, Lincoln, McDuffie, Richmond,
Taliaferro, Warren, and Wilkes. Many of the counties are in rural areas of the state and
have one middle school. Richmond and Columbia counties are urban including the areas
around Augusta, Georgia. Richmond County has 12 middle schools, and Columbia
County has seven middle schools. Economic diversity is apparent in the 12 counties in
the CSRA RESA region. The percent of children living in poverty in these 12 counties
ranges from 11.3% in Columbia County to 54.4% in Taliaferro County (Georgia Family
Connection Partnership [GFCP], 2017). See Appendix C for a Poverty Table for all
CSRA RESA counties.
Data Collection
A list of all schools by county and their grade configurations are available on the
Georgia Department of Education website. The researcher used this list to identify every
school with a sixth through eighth-grade configuration in each of the 12 counties in the
CSRA RESA region. This list of 31 middle schools established the sample group used in
this study. School climate calculation and student achievement, as measured by the
CCRPI, have been gathered and calculated by the Georgia Department of Education and
made public on the state website. The researcher retrieved the scores for all 31 schools in
the CSRA RESA region by accessing the CCRPI reports for each county, as well as the

SCHOOL CLIMATE AND STUDENT ACHIEVEMENT 49
report for each middle school within the county. As these data are a matter of public
record, no permission is needed to obtain these records.
Because all data were drawn from the Georgia Department of Education (GDOE),
reliability is strong. The GDOE uses a consistent collection process that draws data from
all school in Georgia and reports it publicly in a consistent format. Intrinsically, the
procedures used in this study can easily be repeated from year-to-year as new data sets
become available. While this study focuses on middle schools in the CRSA RESA
region, other studies could apply these procedures to different grade configurations or
various areas of the state for future research.
Data Analysis
Data analysis is a Pearson’s correlational analysis using IBM SPSS software. The
findings helped to determine if there is a direct relationship, an inverse relationship, or no
relationship between school climate as measured by school climate calculation and
student achievement as measured by the CCRPI. This Pearson’s correlation is a measure
of the strength and direction that exists between two groups (Laerd Statistics, 2017),
allowing the researcher to compare school climate score and student achievement score to
determine if there is a relationship. Tables and graphs are presented for climate
calculations, student achievement, and analysis of data. The narrative reports sample size
(N), mean (M) and standard deviation (SD) for both samples, t value, degrees of freedom
(df), significance (p), and confidence interval (CI .95). All data collected is currently
available on the Georgia Department of Education website. For example, data collected
includes the final score calculated for school climate on each school in the study. This
data is located on the CCRPI website by choosing the system and school being studied.

SCHOOL CLIMATE AND STUDENT ACHIEVEMENT 50
Once the school is selected the School Climate tab on the school’s CCRPI report is where
the data is located.
Limitations, Delimitations, and Assumptions
This study was limited due to the relatively small sample size for correlational
statistics. Due to the small sample size, the data from this study may only apply to
schools in this RESA and may not be transferable to other schools in Georgia or other
populations. Certain components of the school climate calculation may cause limitations
such as the parent survey. Parent surveys are done on a voluntary basis, and the number
of participants can vary from school-to-school. The researcher assumed that a large
enough population of parents responded to the surveys for the 31 middle schools
involved in this study. Delimitations of this study are as follows: 1) Schools in the CSRA
RESA region of Georgia; and 2) Middle schools in the CSRA RESA region of Georgia
meaning only the schools in the following school districts: Burke, Columbia, Emanuel,
Glascock, Jefferson, Jenkins, Lincoln, McDuffie, Richmond, Taliaferro, Warren, and
Wilkes. This region and the schools within the region may have characteristics that would
limit transferability to other areas of the state of Georgia or other areas of the United
States. These characteristics include but are not limited to geographic, socio-economic,
and demographic data.
Chapter Summary
This was a quantitative correlational study seeking to determine if there is a
relationship between school climate, as measured by school climate calculation, and
student achievement, as measured by the CCRPI in 31 middle schools in the CSRA
RESA region in Georgia. All data is available on Georgia Department of Education
SCHOOL CLIMATE AND STUDENT ACHIEVEMENT 51
website. There were no humans subjects involved. Data analyses determined if there is a
correlation between the school climate calculation and student achievement in the 31
middle schools included in the study. Furthermore, data were analyzed to determine if
there are any differences in the results of urban schools versus rural schools and schools
with a poverty rate of less than 50% to schools with a poverty rate of greater than 50%.

SCHOOL CLIMATE AND STUDENT ACHIEVEMENT 52
CHAPTER 4
REPORT OF DATA AND DATA ANALYSIS
The purpose of this study was to examine the relationship that exists between the
school climate calculation and student achievement, as measured by CCPRI, in middle
schools in the CSRA RESA region of Georgia. The researcher used a quantitative,
correlational design to complete the research and analysis of archival data publicly
available at http://ccrpi.gadoe.org/2016/ on the Georgia Department of Education
website. The research was guided by the following research question: What is the
relationship between school climate, as measured by school climate calculation, and
student achievement, as measured by the College and Career Ready Performance Index
(CCRPI) in middle schools in the Central Savannah River Area (CSRA) Regional
Educational Service Agency (RESA) region in Georgia?
In order to fully answer this question, four sub-questions were developed:
1. What is the relationship between school climate, as measured by school
climate calculation, and student achievement, as measured by the College
and Career Ready Performance Index (CCRPI) in urban middle schools in
the Central Savannah River Area (CSRA) Regional Educational Service
Agency (RESA) region in Georgia?
2. What is the relationship between school climate, as measured by school
climate calculation, and student achievement, as measured by the College
and Career Ready Performance Index (CCRPI) in rural middle schools in
the Central Savannah River Area (CSRA) Regional Educational Service
Agency (RESA) region in Georgia?

SCHOOL CLIMATE AND STUDENT ACHIEVEMENT 53
3. What is the relationship between school climate, as measured by school
climate calculation, and student achievement, as measured by the College
and Career Ready Performance Index (CCRPI) in low poverty middle
schools in the Central Savannah River Area (CSRA) Regional Educational
Service Agency (RESA) region in Georgia?
4. What is the relationship between school climate, as measured by school
climate calculation, and student achievement, as measured by the College
and Career Ready Performance Index (CCRPI) in high poverty middle
schools in the Central Savannah River Area (CSRA) Regional Educational
Service Agency (RESA) region in Georgia?
This was a study based on archival data, and therefore, there were no participants,
per se. Instead, the researcher used publicly available aggregated data located on the
Georgia Department of Education website. The Pearson’s correlation analysis was
performed for each middle school in the CSRA RESA district. Correlational analysis was
used to determine whether the school climate calculation shows a relationship with
student achievement for the 31 middle school included in the study. The school climate
calculation and the student achievement score from the 2016 CCRPI reports were
collected for each of the 31 middle schools in the CSRA Region (Table 6). Schools were
assigned a number label for identification purposes and to protect their identity.
IBM SPSS software was used to perform a bivariate test to analyze the correlation
between the two variables; school climate score and student achievement. This chapter
presents an overview of collected data and descriptive findings associated with the
research question.

SCHOOL CLIMATE AND STUDENT ACHIEVEMENT 54
Research Findings
The school climate calculation and the student achievement score data were
retrieved from the Georgia Department of Education website for 31 middle schools in the
CRSA RESA region. School 20 was eliminated from the study by the researcher because
the climate score for that school was an outlying data point. This school data
unnecessarily skews the normality of the data used in the study. The scores for
participating schools are presented in Table 1.

SCHOOL CLIMATE AND STUDENT ACHIEVEMENT 55
Table 1
Achievement. School Climate, Rural/Urban, Poverty Rate for participating schools
School Achievement Climate Rural/Urban Poverty Rate
School 1 80.60 87.40 Rural High
School 2 80.20 88.20 Urban Low
School 3 69.80 83.60 Urban Low
School 4 66.20 85.80 Urban Low
School 5 61.00 89.60 Urban Low
School 6 58.40 88.60 Urban Low
School 7 63.40 83.30 Urban Low
School 8 52.60 78.00 Urban Low
School 9 58.60 78.90 Rural High
School 10 53.20 82.00 Rural High
School 11 44.20 77.80 Rural High
School 12 49.00 80.40 Rural High
School 13 58.20 85.30 Rural High
School 14 50.00 78.60 Rural High
School 15 49.20 91.30 Urban High
School 16 48.00 89.50 Urban High
School 17 45.40 84.70 Urban High
School 18 43.20 77.50 Urban High
School 19 35.60 79.50 Rural High
School 21 32.80 79.80 Urban High
School 22 46.80 85.80 Rural High
School 23 49.20 77.60 Urban High
School 24 90.00 90.70 Rural High
School 25 24.60 68.40 Urban High
School 26 75.20 84.30 Rural High
School 27 44.00 73.40 Urban High
School 28 29.20 58.10 Urban High
School 29 31.40 71.10 Rural High
School 30 39.20 74.40 Rural High
School 31 32.60 70.00 Rural High
The mean for achievement scores is 52.07, and the mean score for climate is
80.79. The achievement scores range from 31.30 to 90.00, and the scores for climate
range from 58.10 to 91.30. The histograms represented by Figure 2 and Figure 3 illustrate
the frequency distribution of the continuous variables in the study, which are

SCHOOL CLIMATE AND STUDENT ACHIEVEMENT 56
achievement and climate. As indicated, they have a linear relationship and outliers have
been removed so not to skew the results. Figure 4 illustrates the positive correlation that
exists between the two variables being used in this study. The Shapiro-Wilk test for
normality of the variable was performed. Table 2 shows that with a p-value of .487 for
achievement and .076 for climate, no significant departure from normality was found. It
is appropriate to perform correlational analysis of the data using the Pearson’s correlation
having shown these four assumptions true.
Figure 2
Histogram illustrating frequency distribution of the variable climate
Figure 3
Histogram illustrating the frequency distribution of the variable achievement
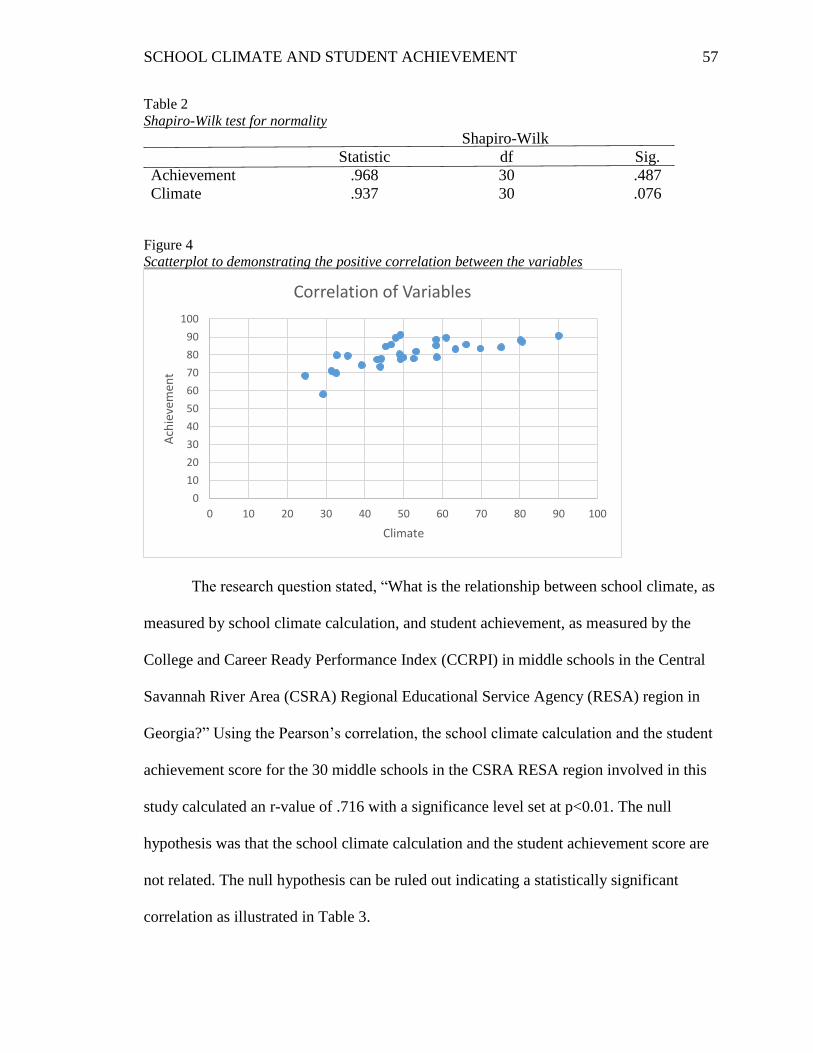
SCHOOL CLIMATE AND STUDENT ACHIEVEMENT 57
Table 2
Shapiro-Wilk test for normality
Shapiro-Wilk
Statistic df Sig.
Achievement .968 30 .487
Climate .937 30 .076
Figure 4
Scatterplot to demonstrating the positive correlation between the variables
The research question stated, “What is the relationship between school climate, as
measured by school climate calculation, and student achievement, as measured by the
College and Career Ready Performance Index (CCRPI) in middle schools in the Central
Savannah River Area (CSRA) Regional Educational Service Agency (RESA) region in
Georgia?” Using the Pearson’s correlation, the school climate calculation and the student
achievement score for the 30 middle schools in the CSRA RESA region involved in this
study calculated an r-value of .716 with a significance level set at p<0.01. The null
hypothesis was that the school climate calculation and the student achievement score are
not related. The null hypothesis can be ruled out indicating a statistically significant
correlation as illustrated in Table 3.
0
10
20
30
40
50
60
70
80
90
100
0 10 20 30 40 50 60 70 80 90 100
Ach
ieve
men
t
Climate
Correlation of Variables
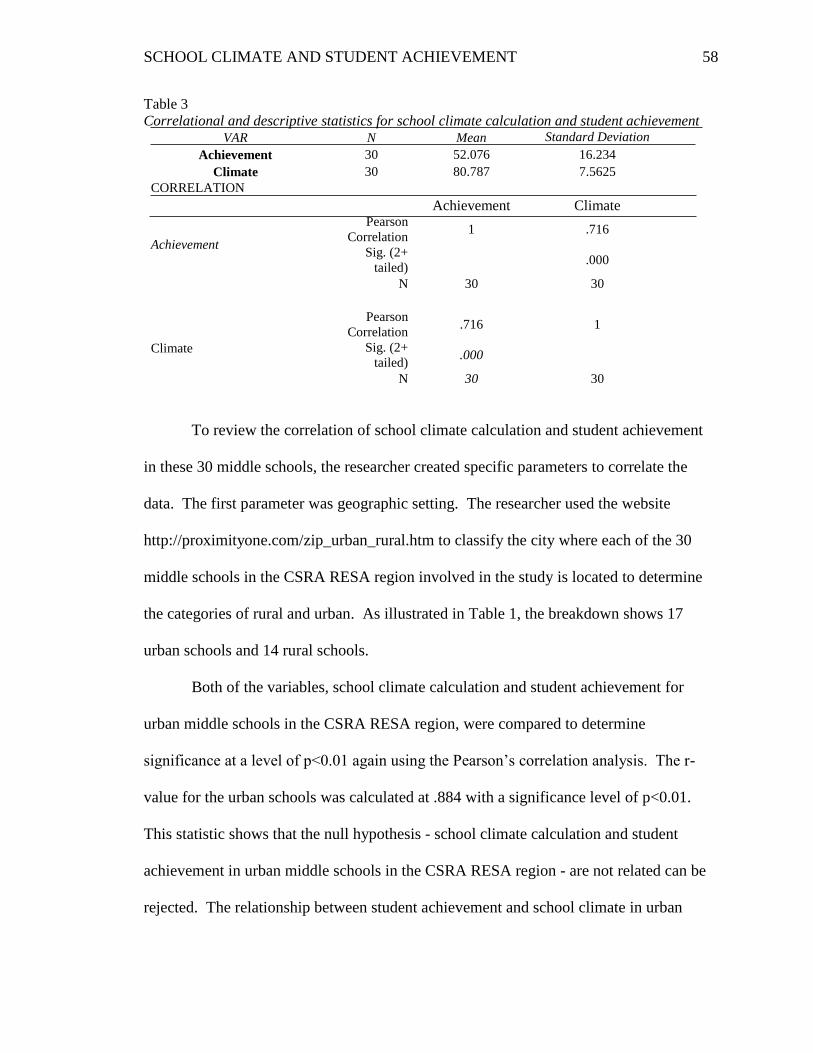
SCHOOL CLIMATE AND STUDENT ACHIEVEMENT 58
Table 3
Correlational and descriptive statistics for school climate calculation and student achievement VAR N Mean Standard Deviation
Achievement 30 52.076 16.234
Climate 30 80.787 7.5625
CORRELATION
Achievement
Achievement Climate Pearson
Correlation 1 .716
Sig. (2+
tailed) .000
N 30 30
Climate
Pearson
Correlation .716 1
Sig. (2+
tailed) .000
N 30 30
To review the correlation of school climate calculation and student achievement
in these 30 middle schools, the researcher created specific parameters to correlate the
data. The first parameter was geographic setting. The researcher used the website
http://proximityone.com/zip_urban_rural.htm to classify the city where each of the 30
middle schools in the CSRA RESA region involved in the study is located to determine
the categories of rural and urban. As illustrated in Table 1, the breakdown shows 17
urban schools and 14 rural schools.
Both of the variables, school climate calculation and student achievement for
urban middle schools in the CSRA RESA region, were compared to determine
significance at a level of p<0.01 again using the Pearson’s correlation analysis. The r-
value for the urban schools was calculated at .884 with a significance level of p<0.01.
This statistic shows that the null hypothesis - school climate calculation and student
achievement in urban middle schools in the CSRA RESA region - are not related can be
rejected. The relationship between student achievement and school climate in urban

SCHOOL CLIMATE AND STUDENT ACHIEVEMENT 59
schools shows a strong, positive correlation, which is statistically significant. Table 4
indicates the statistical significance of this correlation.
Table 4
Correlational and descriptive statistics for school climate calculation and student achievement of
urban schools VAR N Mean Standard Deviation
Achievement 17 56.329 19.987
Climate 17 79.871 9.192
CORRELATION
Achievement
Achievement Climate Pearson
Correlation 1 .884
Sig. (2+
tailed) .000
N 17 17
Climate
Pearson
Correlation .884 1
Sig. (2+
tailed) .000
N 17 17
When analyzing the data for the 13 rural schools, the researcher used the
Pearson’s correlation analysis to determine if there was a relationship between the school
climate calculation and the student achievement score. The r-value for the rural schools
is .270 and a significance level of p<.373. The null hypothesis that school climate and
student achievement in rural schools are not correlated can be retained. There is no
correlation in the two variables for rural schools. Table 5 illustrates the descriptive
statistics for the analysis.

SCHOOL CLIMATE AND STUDENT ACHIEVEMENT 60
Table 5
Correlational and descriptive statistics for school climate calculation and student achievement of
rural schools VAR N Mean Standard Deviation
Achievement 13 46.492 6.697
Climate 13 81.985 4.777
CORRELATION
Achievement
Achievement Climate Pearson
Correlation 1 .270
Sig. (2+
tailed) .373
N 13 13
Climate
Pearson
Correlation .270 1
Sig. (2+
tailed) .373
N 13 23
The researcher also analyzed the data of the 30 middle schools in the CSRA
RESA that had a high poverty rate of greater than 50% and schools with a poverty rate of
less than 50%. The poverty rates for each of the middle schools included in the study
were obtained from the Georgia Department of Education website:
https://oraapp.doe.k12.ga.us/ows-bin/owa/fte_pack_frl001_public.entry_form. Of the 30
middle schools included in the study, 7 have a low poverty. Schools with a high poverty
rate numbered 23. Table 1 illustrates the schools and the poverty rates associated with
them.
Both variables, school climate calculation, and student achievement were
examined using the Pearson’s correlation analysis. The r-value for the schools with a low
poverty rate was calculated at 0.004 below the significance level of p=0.994. This
statistic shows that the null hypothesis can be retained. The school climate calculation
and student achievement in middle schools in the CSRA RESA region with a low poverty
are not related. Table 6 indicates there is no statistical significance of this correlation.
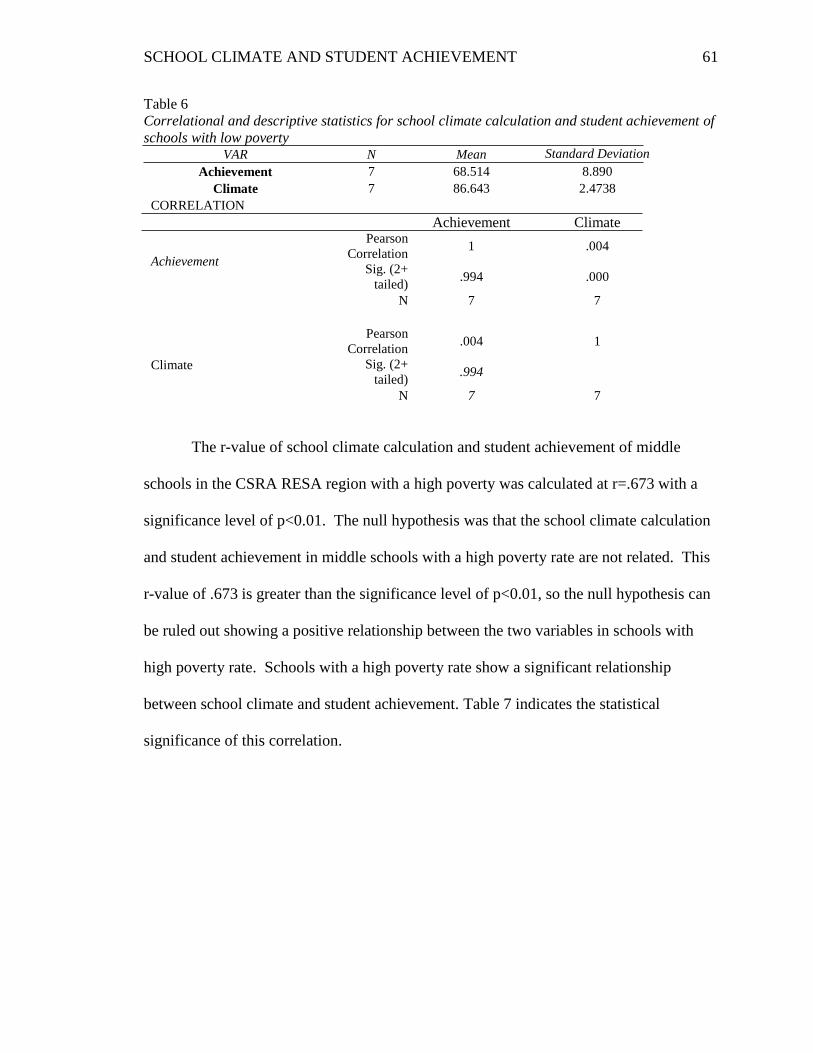
SCHOOL CLIMATE AND STUDENT ACHIEVEMENT 61
Table 6 Correlational and descriptive statistics for school climate calculation and student achievement of
schools with low poverty VAR N Mean Standard Deviation
Achievement 7 68.514 8.890
Climate 7 86.643 2.4738
CORRELATION
Achievement
Achievement Climate Pearson
Correlation 1 .004
Sig. (2+
tailed) .994 .000
N 7 7
Climate
Pearson
Correlation .004 1
Sig. (2+
tailed) .994
N 7 7
The r-value of school climate calculation and student achievement of middle
schools in the CSRA RESA region with a high poverty was calculated at r=.673 with a
significance level of p<0.01. The null hypothesis was that the school climate calculation
and student achievement in middle schools with a high poverty rate are not related. This
r-value of .673 is greater than the significance level of p<0.01, so the null hypothesis can
be ruled out showing a positive relationship between the two variables in schools with
high poverty rate. Schools with a high poverty rate show a significant relationship
between school climate and student achievement. Table 7 indicates the statistical
significance of this correlation.
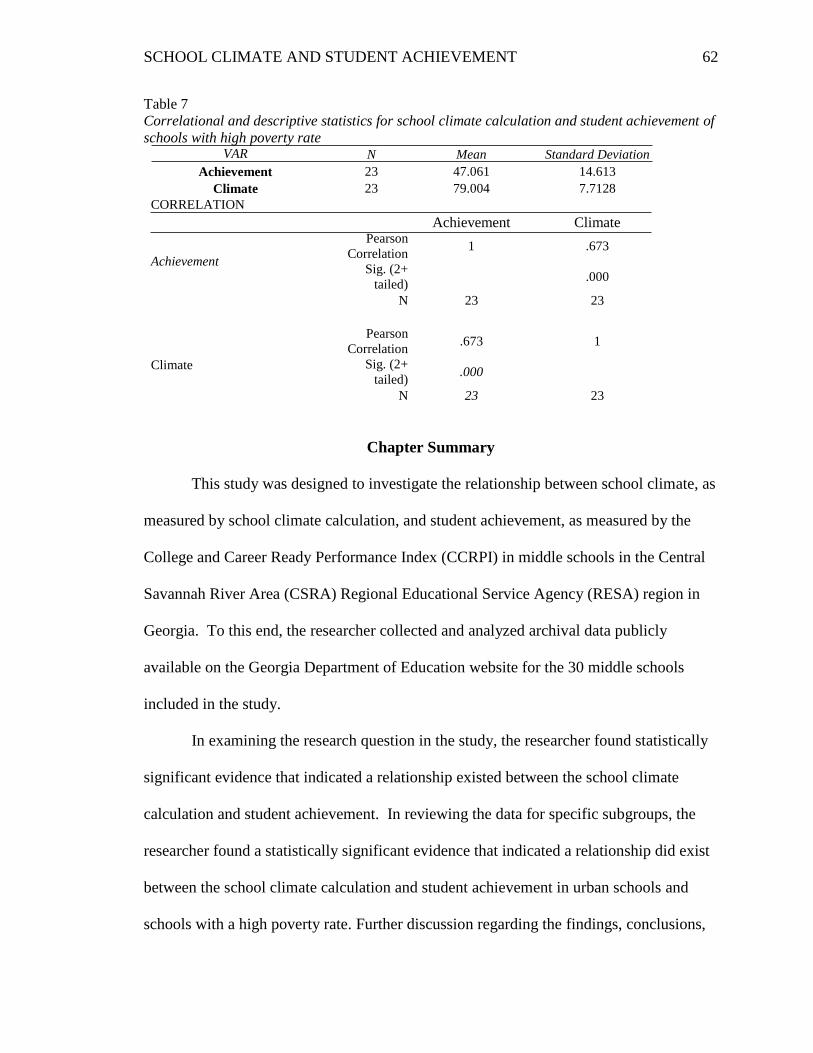
SCHOOL CLIMATE AND STUDENT ACHIEVEMENT 62
Table 7
Correlational and descriptive statistics for school climate calculation and student achievement of
schools with high poverty rate VAR N Mean Standard Deviation
Achievement 23 47.061 14.613
Climate 23 79.004 7.7128
CORRELATION
Achievement
Achievement Climate Pearson
Correlation 1 .673
Sig. (2+
tailed) .000
N 23 23
Climate
Pearson
Correlation .673 1
Sig. (2+
tailed) .000
N 23 23
Chapter Summary
This study was designed to investigate the relationship between school climate, as
measured by school climate calculation, and student achievement, as measured by the
College and Career Ready Performance Index (CCRPI) in middle schools in the Central
Savannah River Area (CSRA) Regional Educational Service Agency (RESA) region in
Georgia. To this end, the researcher collected and analyzed archival data publicly
available on the Georgia Department of Education website for the 30 middle schools
included in the study.
In examining the research question in the study, the researcher found statistically
significant evidence that indicated a relationship existed between the school climate
calculation and student achievement. In reviewing the data for specific subgroups, the
researcher found a statistically significant evidence that indicated a relationship did exist
between the school climate calculation and student achievement in urban schools and
schools with a high poverty rate. Further discussion regarding the findings, conclusions,

SCHOOL CLIMATE AND STUDENT ACHIEVEMENT 63
and recommendations are discussed in Chapter 5.

SCHOOL CLIMATE AND STUDENT ACHIEVEMENT 64
CHAPTER 5
DISCUSSION AND RECOMMENDATIONS
The purpose of this study was to examine if a relationship exists between school
climate, as measured by the school climate calculation, and student achievement, as
measured by CCPRI, in the Georgia middle schools located in the CRSA RESA district.
This chapter will provide an overview of the study including the problem statement,
research questions, and the research methodology used. A summary of the results from
Chapter 4 will be presented to discuss the research question in more depth. This will be
followed by implications for practices and recommendations for future research. Finally,
the chapter will summarize the study in conclusion.
Introduction
Schools across the U. S. struggle with the means by which student achievement
can be raised. One possible meaning would be a strong and positive school climate.
Research revealed that school climate had been shown to have a positive effect on student
achievement and student retention (Cohen et al., 2009; Guo & Higgins-D’Alessandro,
2011). The National School Climate Council (2007) has defined school climate in the
following way:
School climate refers to the quality and character of school life. School climate is
based on patterns of students’, parents’ and school personnel’s experiences of
school life and reflects norms, goals, values, interpersonal relationships, teaching
and learning practices, and organizational structures.
A sustainable, positive school climate fosters youth development and
learning necessary for a productive, contributing and satisfying life in a
SCHOOL CLIMATE AND STUDENT ACHIEVEMENT 65
democratic society. This climate includes norms, values, and expectations that
support people feeling socially, emotionally and physically safe. People are
engaged and respected. Students, families, and educators work together to
develop, live and contribute to a shared school vision. Educators model and
nurture attitudes that emphasize the benefits and satisfaction gained from
learning.Each person contributes to the operations of the school and the care of
the physical environment (p. 4).
Similarly, Balfanz (2009) found that reform efforts at the middle grades level that
combine curricula and instructional practices linked to college and career readiness and
enhanced teacher quality can improve student success, thus, magnifying the impact of the
middle grades on student success and retention at the secondary level. Therefore, schools
working to implement school improvement and reform successfully would be wise to
acknowledge the impact that middle schools have to ensure that students are successful in
school and in turn graduate from high school.
Problem Statement
The state of Georgia currently offers The College and Career Ready Performance
Index (CCRPI) to schools to illustrate performance in a variety of areas, including school
climate and student achievement. The CCRPI is a comprehensive school improvement,
accountability, and communication platform for all educational stakeholders designed to
promote college and career readiness for all Georgia public school students (Georgia
Department of Education, 2017c). A myriad of research has indicated that there is a
direct and symbiotic relationship between school climate and student achievement
(Cohen et al., 2009; Guo & Higgins-D’Alessandro, 2011). However, up until this point, it
SCHOOL CLIMATE AND STUDENT ACHIEVEMENT 66
has been unknown if this relationship exists in Georgia middle schools in the CSRA
RESA district. The CSRA RESA district has 31 middle schools of varying socio-
economic rates located in both rural and urban locations. Therefore, the purpose of this
study was to examine if a relationship does exist between school climate, as measured by
the school climate calculation, and student achievement, as measured by CCPRI, in the
Georgia middle schools located in the CRSA RESA district.
Research Questions
This study sought to determine if a relationship exists in middle schools in the
CSRA RESA region, the following overarching question guided this study: What is the
relationship between school climate, as measured by school climate calculation, and
student achievement, as measured by the College and Career Ready Performance Index
(CCRPI) in middle schools in the Central Savannah River Area (CSRA) Regional
Educational Service Agency (RESA) region in Georgia?
In order to fully answer this question, four sub-questions were developed:
1. What is the relationship between school climate, as measured by school
climate calculation, and student achievement, as measured by the College
and Career Ready Performance Index (CCRPI) in urban middle schools in
the Central Savannah River Area (CSRA) Regional Educational Service
Agency (RESA) region in Georgia?
2. What is the relationship between school climate, as measured by school
climate calculation, and student achievement, as measured by the College
and Career Ready Performance Index (CCRPI) in rural middle schools in
the Central Savannah River Area (CSRA) Regional Educational Service
SCHOOL CLIMATE AND STUDENT ACHIEVEMENT 67
Agency (RESA) region in Georgia?
3. What is the relationship between school climate, as measured by school
climate calculation, and student achievement, as measured by the College
and Career Ready Performance Index (CCRPI) in low poverty middle
schools in the Central Savannah River Area (CSRA) Regional Educational
Service Agency (RESA) region in Georgia?
4. What is the relationship between school climate, as measured by school
climate calculation, and student achievement, as measured by the College
and Career Ready Performance Index (CCRPI) in high poverty middle
schools in the Central Savannah River Area (CSRA) Regional Educational
Service Agency (RESA) region in Georgia?
Analysis and Discussion of Findings
The researcher used a quantitative, correlational design to implement the research
and analysis of archival data publicly available at http://ccrpi.gadoe.org/2016/ on the
Georgia Department of Education website. The data collected included the student
achievement score on the CCRPI for the 31 middle schools in the CSRA RESA region.
The school climate calculation was also obtained for these schools. During the analysis
phase, one school, designated as School 20, had to be eliminated from the study because
data from this school produced outliers that unnecessarily skewed the normality of the
data. The final sample of 30 schools was used to determine the relationship between the
school climate calculation and student achievement. Additionally, the study addressed if
the school climate calculation and student achievement showed correlation when
comparing middle schools in the region that were urban compared to rural as well as

SCHOOL CLIMATE AND STUDENT ACHIEVEMENT 68
schools with high poverty to schools with low poverty. For purposes of this study,
schools with poverty greater than 50% were considered high poverty, and schools with a
poverty rate of less than 50% were considered low poverty. Results were analyzed
comparing the school climate calculation and the student achievement for low poverty
schools and for high poverty schools. Likewise, the two variables of school climate and
student achievement were analyzed for urban schools versus rural schools.
Research has indicated that there is a strong and direct relationship between
school climate and student achievement (Cohen et al., 2009; Guo & Higgins-
D’Alessandro, 2011). The results of this study using the Pearson’s correlational analysis
supported the research above. A significant relationship was found between school
climate and student achievement in the 30 middle schools in the CSRA RESA region
(r=.716, N=30, p<.01). These findings suggest, as discussed in Chapter 2 that positive
school climate focused on student learning is correlated to student achievement
(Hallinger, Bickman, & Davis, 1996). Successful schools have a school climate that is
significantly more positive than their less successful counterparts (Lindahl, 2009).
In further analysis of the variables school climate and student achievement, the
researcher grouped the schools into four like groups: urban, rural, low poverty, and high
poverty. The researcher used the Pearson’s correlational analysis to determine a
relationship between school climate and student achievement in the schools that were in
each of the four classifications.
Urban schools showed a strong correlation between school climate and student
achievement (r=.884, N=17, p<.01) indicating that one variable does have a positive
effect on the other. Rural schools did not show a significant relationship between school

SCHOOL CLIMATE AND STUDENT ACHIEVEMENT 69
climate and student achievement (r=.270. N=13, p=.373). The null hypothesis for low
poverty schools was also retained (r=.004, N=7, p=.01). This analysis had the limitation
of the small sample size of 7 that may have affected the results. A conflating factor for
this analysis included that all low poverty schools were in an urban setting. The last
classification, high poverty schools, was analyzed to show a strong correlation between
school climate and student achievement (r=.673, N=23, p=.01).
Implications for Practice
When considering the impact of this study on educational leaders, there are
implications at the state, district, and school levels. State leaders should consider the
results of this study and determine if this applies to other school levels or in other regions
of Georgia. District leaders in urban settings or areas with high poverty should pay close
attention to the results of this study. A strong positive relationship was found in urban
schools (r=.884, N=17, p<.01) between school climate and student achievement and in
schools with high poverty (r=.673, N=23, p=.01). If schools in their district fall into at
least one of these categories, district leaders would be wise to implement changes to the
practices in their schools. Specific changes based on the data will be offered later in this
section. The results of this study provide several practical implications for middle school
leaders in the CSRA RESA region. The existence of a strong and positive school climate
is essential for the successful function of a school (Hoy & Hannum, 1997) and failing to
nurture positivity in a school is the best way to ensure lower student achievement
(Moller, Mickelson, Stearns, Bottia, Banerjee, & Society for Research on Educational
Effectiveness, 2011). The results of this study echo this sentiment and imply that changes
in middle school climate could impact changes in student achievement. As such, middle

SCHOOL CLIMATE AND STUDENT ACHIEVEMENT 70
school leaders within this region should be purposeful and look at improving dimensions
of school climate to ensure student achievement growth. In reviewing the data from this
study, practical implications emerge for the district and school leaders.
Implications for State Leaders
The results of this study show a strong correlation between school climate and
student achievement (r=.716, N=30, p<.01). State leaders should explore further to
determine if the results of this study of middle schools in the CSRA RESA region can be
replicated and applied to elementary and high schools in all regions of Georgia. Also the
results this study centered upon the relationship between school climate and student
achievement showed a positive relationship in urban (r=.884, N=17, p<.01) and high
poverty (r=.673, N=23, p=.01) schools. This information could be impactful to the
schools in Georgia that have historically struggled the most with improving student
achievement. Additional implications based on the data from this study are discussed in
the next section. Those concerning discipline, attendance, and interpersonal relationships
could lead state leaders to consider implementing changes in all Georgia schools to
improve school climate.
Implications for District and School Leaders
Previous research indicates that a positive school climate that is focused on
student learning is correlated to student achievement (Hallinger, Bickman, & Davis,
1996). The results of this study reinforce that research and show that in middle schools
in the CSRA RESA region that school climate does have a significant positive
relationship to student achievement (r=.716, N=30, p<.01). Addressing areas that impact
the calculation of school climate score can help middles schools improve climate and in
SCHOOL CLIMATE AND STUDENT ACHIEVEMENT 71
turn student achievement. As stated earlier in this paper, the school climate calculation is
determined using four components; student discipline score, school attendance score, safe
and substance-free learning environment score, and the score generated from the GSHS II
survey, parent survey, and school personnel survey. Each of these dimensions provides
areas that schools can focus to have a positive impact on student achievement by
improving the school climate.
Improving School Discipline. One approach district and school leaders can do to
improve their school climate is to focus their resources on improving student discipline.
The student discipline score is a weighted suspension rate. The weighted suspension rate
is calculated based on discipline outcomes for students in the school. Each student
receives one score from the following criteria based on the most severe discipline
incident. Students receiving any In School Suspension (ISS) are assigned .50 point, one
to two days Out of School Suspension (OSS) is assigned one point, three to four days of
OSS is assigned three points, five to nine days of OSS is assigned five points, and
students over ten days of OSS are assigned ten points. Students that have to attend an
Alternative School for discipline reasons are assigned six points, and students that are
expelled from school are assigned seven points. The sum of the student weighted
suspension rate is then divided by the total number of students enrolled, subtracted from
one and multiplied by 100. This calculation determines a school’s weighted suspension
rate. Schools must focus on alternatives to suspension to impact this score. One such
strategy is Positive Behavior Interventions and Supports (PBIS). PBIS is a proven data-
driven framework that can reduce disciplinary incidents. “The premise of PBIS is that
continual teaching, combined with acknowledgment or feedback of positive student

SCHOOL CLIMATE AND STUDENT ACHIEVEMENT 72
behavior will reduce unnecessary discipline and promote a climate of greater
productivity, safety, and learning” (Georgia Department of Education, 2017e). When
PBIS is implemented with fidelity, it provides a multi-tiered approach to prevention.
PBIS uses disciplinary data and principles of behavior analysis to develop school-wide,
targeted, and individualized interventions and supports to improve school climate for all
students (Georgia Department of Education, 2017e). Successful implementation can
reduce the number of suspensions a school has, and this impacts the student discipline
score. A school can improve their school climate calculation by implementing a strategy
such as PBIS to reduce suspensions and improve the climate. Improving overall school
discipline will also impact the Safe and Substance Free Environment score. By
implementing PBIS and cutting down the number of suspensions, serious discipline
violations should also be reduced which is how the Safe and Substance Free Environment
score is calculated.
Improving School Attendance. School attendance is a second area that schools
can focus attention to improve their school climate calculation. The school-wide
attendance score is one-fourth of the school climate calculation. The school-wide
attendance score is averaged from data collected on student attendance, average daily
personnel attendance, average daily administrator attendance, and average daily staff
attendance. Improving this data for a school would have a direct impact on improving
the school climate calculation. This study shows that by increasing the school climate
score, student achievement will be positively impacted (r=.716, N=30, p<.01).
Monthly reviews of student and staff attendance data will create an atmosphere
within the schools of the importance of regular attendance. Educating parents in the
SCHOOL CLIMATE AND STUDENT ACHIEVEMENT 73
importance of regular attendance including signing out of school early or being tardy will
assist a school as they change the culture to emphasize student attendance. Georgia
Department of Education reported that 9.7% of students in Georgia schools in 2010
missed 15 days or more (Georgia Department of Education, 2017f). When comparing
absences to graduation rate, Georgia showed that students, who miss zero days of school
in 8th grade, have a graduation rate within four years of 81.89%. The percentage of
students that miss over 15 days in 8th grade that graduate in four years is only 38.09%.
“To prevent and correct serious attendance problems, schools need to change the way
they are structured, improve the quality of courses, and intensify interpersonal
relationships between students and teachers” (Epstein & Sheldon, 2002, p.309).
While many schools consider student attendance when they are looking for ways
to improve, much of the time staff attendance is overlooked. Schools should implement
strategies that reward teachers that do not miss days of school. Incentive programs can
offer teachers a plethora of rewards for having perfect attendance for a grading period or
per month. If a student is absent ten days a semester and the teacher is absent for four,
that is approximately 98 hours of instruction lost in a self-contained elementary
classroom. Teacher attendance has a major impact on student achievement and should be
considered when implementing practices to impact attendance.
Improving Interpersonal Relationships. Improving interpersonal relationships
is the third area for the district and school leaders to focus when working to improve
school climate. As discussed in Chapter 2, research has also shown that teacher's work
environment, peer relationships, and feeling of inclusion and respect are important
aspects too. Guo (2012) found that the teachers' work environment, which may be

SCHOOL CLIMATE AND STUDENT ACHIEVEMENT 74
considered as an indicator of teachers' relationship with each other and school
administrators, fully mediated the path from a whole school character intervention to
school climate change. This also extends to relationships between teachers and parents
and administration and parents. Communication with all stakeholders is essential. All
stakeholders must contribute to a shared school vision. Both parents and teachers must
feel that they are an essential part of the process to improve student performance and
ultimately school performance. The parent survey and the personnel survey conducted in
Georgia impact the school climate calculation. Implementing intentional efforts to make
students, parents, and teachers work as a cohesive unit, feel engaged and respected would
impact the results of these surveys which would improve the school climate calculation
and have a positive impact on student achievement.
The analysis of the data concerning school climate and student achievement
shows a Pearson’s correlation of .716, demonstrating that there is a strong relationship
between these two variables. School leaders should engage students, families, and
educators to work together to develop, live, and contribute to a shared school vision.
Creating an atmosphere where all students, parents, and educators feel welcome and
included in the school is the first step. Communicating constantly to make sure all parties
are informed of events, learning, and procedures of the school will offer the inclusive
atmosphere that will impact both the schools personnel’s and parent’s attitudes when they
are completing surveys tied to the school climate calculation.
Recommendations for Future Research
Findings from this study reveal a need to expand the research to include a larger,
more diverse sample to improve the generalizability of the results. Future research could

SCHOOL CLIMATE AND STUDENT ACHIEVEMENT 75
focus on all middle, elementary, or high schools in Georgia to increase the sample size.
To fully examine the relationship between school climate and student achievement,
another recommendation for future research would be to use trend data over multiple
years to determine if a relationship between school climate and student achievement
exist. Utilizing a larger data set should be part of a continuous improvement model for
schools in Georgia.
Another area of future research utilizing the parent survey result’s dataset. The
parent survey is one of the surveys used to calculate school climate score. Further study
into this set of data to analyze demographic characteristics could be meaningful.
Focusing on ethnicity, race, or student gender would offer schools data on ways to
improve schools for specific subgroups. A final recommendation for future research
concerns the reporting of the data for poverty rate. During the analysis, the researcher
found that systems in the CSRA RESA region reported poverty differently. All the
systems but one reported a percentage determined by each school in the system.
However, one system reported a system average for each school which may have
impacted results. In this study, all schools in the district in question were classified as low
poverty. If in fact, some schools in the district have an individual poverty rate higher than
50%, they would have fallen into a different category when analyzing the data. This
would have changed the population size for low and high poverty and may have made the
results for high poverty schools more reliable since there were only seven schools in this
category for this research. Future studies should consider using a more consistent means
of reporting poverty percentages for schools included in research to a get more accurate
representation of the data across districts.

SCHOOL CLIMATE AND STUDENT ACHIEVEMENT 76
Impact Statement
State, district, and school leaders are consistently trying to find ways to increase
student achievement and improve school climate. This study shows that school climate
and student achievement have a positive correlation in middle schools in the CSRA
RESA region. Additional findings show that this positive correlation is also found in
urban schools and schools with high poverty. Based on these findings, I would
recommend middle school leaders should focus efforts on creating and maintaining a
positive school climate, with emphasis placed upon improving discipline, attendance, and
interpersonal relationships. This work can benefit all middle school stakeholders since
based upon the findings of this study, when the school climate is improved student
achievement should also increase.
Conclusion
As stated in Chapter 1, over the last 30 years a growing body of empirical
research has shown that a positive and sustained school climate is associated with and
may be predictive of positive youth development, effective risk prevention and health
promotion efforts, student learning and academic achievement, increased student
graduation rates, and teacher retention (Cohen & Geier, 2010). It is during the middle
grades, particularly in lower-performing schools that serve high-poverty populations that
achievement gaps often become so large that they cannot be overcome by students as
they move forward into high school (Balfanz, 2009).
One method by which student achievement could be improved would be through
attention to school climate. By understanding the relationship between school climate
and student achievement, middle schools can implement strategies to improve school

SCHOOL CLIMATE AND STUDENT ACHIEVEMENT 77
climate and, ultimately, have a positive effect on improving student achievement.
Furthermore, more research can be and should be completed to determine if this same
correlation can be found in elementary and high schools in various regions of Georgia.

SCHOOL CLIMATE AND STUDENT ACHIEVEMENT 78
References
Abu-Saad, I., & Hendrix, V. L. (1995). Organizational climate and teachers’ job
satisfaction in a multi-cultural milieu: The case of the Bedouin Arab schools in
Israel. International Journal of Educational Development, 15(2), 141-153.
Albanese, M. (2004, October). Psychological size and distance: A step towards better
defining the human elements critical to learning. Medical Education, 38(10),
1020-1021.
Allington, R. L., & Johnston, P. H. (2000). What do we know about effective fourth-grade
teachers and their classrooms? Albany, NY: The National Research Center on
English Learning & Achievement, State University of New York.
Anderson, C. S. (1982). The search for school climate: A review of research. Review of
Educational Research, 52(3), 368-420.
Au, W. (2007). High-stakes testing and curricular control: A qualitative metasynthesis.
Educational Researcher, 36, 258-267.
Baker, J. D., Rieg, S. A., & Clendaniel, T. (2006). An investigation of an after school
math tutoring program: University tutors + elementary students = a successful
partnership. Education, 127(2), 287-293.
Balfanz, R. (2009). Putting middle grades students on the graduation path. National
Middle School Association, John Hopkins University, prepared for the Everyone
Graduates Center and Talent Development Middle Grades Program, Baltimore,
MD. Retrieved from https://www.amle.org/portals/0/pdf/articles /policybrief_
balfanz.pdf.
Bedard, K., & Do, C. (2005). Are middle schools more effective? The impact of school
SCHOOL CLIMATE AND STUDENT ACHIEVEMENT 79
structure on student outcomes. Journal of Human Resources, 40(3), 660-682.
Benson, E. E. (2003). The relationship between school climate and student achievement
in low income elementary schools. Doctoral dissertation, University of Virginia,
Virginia. UMI No. 3083109.
Bergren, D. A. (2014) The impact of school climate on student achievement in the middle
schools of the Commonwealth of Virginia: A quantitative analysis of existing
data (Doctoral dissertation). Retrieved from ProQuest: Full Text. (UMI Number
3615518)
Borko, H., & Livingston, C. (1989). Cognition and improvisation: Differences in
mathematics instruction by expert and novice teachers. American Educational
Research Journal, 26(4), 473-498.
Brown, A. F., & House, J. H. (1967). The organizational component in education. Review
of Educational Research, 37(4), 399-416.
Bryk, A. S., Sebring, P. B., Allensworth, E., Luppescu, S., & Easton, J. Q. (2010).
Organizing schools for improvement: Lessons from Chicago. Chicago, IL:
University of Chicago.
Bridgeland, J. M., Dilulio, J. J. Jr., & Morison, K. B. (2006, March). The silent epidemic:
Perspectives of high school dropouts. Washington, DC: Civic Enterprises, LLC.
Buttram, J. L., & Waters, J. T. (1997). Improving America’s schools through standards-
based education. Bulletin, 81(590), 1-5.
Cemalogu, N. (2007). The relationship between organizational health and bullying that
teachers experience in primary schools in Turkey. Educational Research
Quarterly, 31(2), 3-29.
SCHOOL CLIMATE AND STUDENT ACHIEVEMENT 80
Chenoweth, K. (2009). How it's being done: Urgent lessons from unexpected schools.
Cambridge, MA: Harvard Education Press.
Christenbury, L. (2010). The flexible teacher. Educational Leadership, 68(4), 46-50.
Clark, S. and D. Clark. (1993). Middle level school reform: The rhetoric and the reality.
Elementary School Journal, 93(5), 447-60.
Cochran, K., DeRuiter, L., & King, R. (1993). Pedagogical content knowledge: An
integrative model for teacher preparation. Journal of Teacher Education, 4, 18-
29.
Cohen, J., & Geier, V.K. (2010). School climate research summary: January 2010. New
York, N.Y. Retrieved from www.schoolclimate.org/climate/research.php.
Cohen, J., McCabe, E. M., Michelli, N. M., & Pickeral, T. (2009). School climate:
Research, policy, practice, and teacher education. Teacher College Record, 111
(1), 180-213.
Cotton, K. (2003). Principals and student achievement: What the research says.
Alexandria, VA: Association for Supervision and Curriculum Development
Creswell, J. W. (2013). Research design: Qualitative, quantitative, and mixed methods
approaches. Thousand Oaks, CA: Sage.
Cushman, K., & Rogers, L. (2008). Middle school students talk about social forces in the
classroom. Middle School Journal, 39(3), 14-24.
Danielson, C. (2002). Enhancing student achievement: A framework for school
improvement. Alexandria, VA: Association for Supervision and Curriculum
Development.
David, J. L. (2008). Pacing guides. Educational Leadership, 66(2), 87-88. p. 88

SCHOOL CLIMATE AND STUDENT ACHIEVEMENT 81
DeLisi, J. (2008). School climate and student achievement: A comparison of two urban
middle schools’ responses to educational accountability (Doctoral dissertation).
Retrieved from Dissertations & Theses: Full Text. (Publications No.
AAT3308131)
Dennison, D. R. (1996). What is the difference between organizational culture and
organizational climate? A native’s point of view on a decade of paradigm wars.
The Academy of Management Review, 21(3), 619-654.
Devine, J. (1996). Maximum security: The culture of violence in inner-city schools.
Chicago, IL: The University of Chicago Press.
Eccles, J. (2008). Can middle school reform increase high school graduation rates?
Santa Barbara, CA: California Dropout Research Project.
Epstein, J. L., & Sheldon, S. B. (2002). Present and accounted for: Improving student
attendance through family and community involvement. The Journal of
Educational Research, 95(5), 308-318.
Fabelo, T., Thompson, M., Plotkin, M., Carmichael, D., Marchbanks, M. P. III, & Booth,
E. A. (2011). Breaking schools’ rules: A statewide study of how school discipline
relates to students’ success and juvenile justice involvement. New York, NY:
Council of Governments Justice Center. Retrieved from
http://knowledgecenter.csg.org/kc/system/files/Breaking_School_Rules.pdf.
Fan, F. A. (2012). Teacher: Students’ interpersonal relationships and students’ academic
achievements in social studies. Teachers and Teaching, 18(4), 483-490.
Fink, E., & Resnick, L. B. (2001). Developing principals as instructional leaders. Phi
Delta Kappan, 82(8), 598-606.

SCHOOL CLIMATE AND STUDENT ACHIEVEMENT 82
Flay, B. R. (2000). Approaches to substance use prevention utilizing school curriculum
plus environmental, social change. Addictive Behaviors, 25, 861-885.
Fuchs, L. S., Fuchs, D., & Phillips, N. (1994). The relation between teachers’ beliefs
about the importance of good work habits, teacher planning, and student
achievement. The Elementary School Journal, 94(3), 331- 345.
Fullan, M. (2003) Leadership for the 21st century; breaking the bonds of dependency.
Educational Leadership, 55(7), 6-10.
Fullan, M. G. (1993). Why teachers must become change agents. Educational
Leadership, 50(6), 12-17.
Georgia Department of Education (2017a). Data and reporting: Graduation rate.
Retrieved from http://www.gadoe.org/Pages/Home.aspx.
Georgia Department of Education (2017b). RESA. Retrieved from:
http://www.gadoe.org/External-Affairs-and-Policy/State-Board-of-
Education/SBOE%20Rules/160-5-1-.13.pdf#search=RESA
Georgia Department of Education (2017c). CCRPI. Retrieved from:
http://ccrpi.gadoe.org/2016/
Georgia Department of Education (2017d). School climate and student achievement.
Retrieved from: http://www.gadoe.org/Curriculum-Instruction-and-
Assessment/Curriculum-and Instruction/Documents/School Climate and Student
Achievement_July 2013.ppt
Georgia Department of Education (2017e). Positive behavioral interventions and
supports. Retrieved from: http://www.gadoe.org/Curriculum-Instruction-and-
Assessment/Special-Education-Services/Pages/Positive-Behavioral-Interventions-
SCHOOL CLIMATE AND STUDENT ACHIEVEMENT 83
and-Support.aspx
Georgia Department of Education (2017f). Student attendance: Changing the
conversation. Retrieved from: http://www.gadoe.org/External-Affairs-and-
Policy/Policy/Documents/Student%20Attendance%20and%20Student%20Achiev
ement%20Updated%20March%202016.pdf
Goddard, R. D., Hoy, W. K., & Woolfolk Hoy, A. (2000). Collective teacher efficacy: Its
meaning, measure, and impact on student achievement. Leadership in Action,
28(4), 3-7.
Gonzalez, T. (2012). Keeping kids in schools: Restorative justice, punitive discipline, and
the school to prison pipeline. Journal of Law and Education, 41(1), 281-335.
Goodwin, B. (2016). Novice teachers benefit from lesson plans. Educational Leadership,
74(2), 75-76.
Gottfredson, G. D., Gottredson, D. C., Payne, A. A., & Gottfredson, N. C. (2005). School
climate predictors of school disorder: Results from a national study of
delinquency prevention in schools. Journal of Research in Crime and
Delinquency, 42(4), 412-444.
Greenlee, B. J., & Bruner, D. Y. (2001). Effects of success for all reading programs on
reading achievement in Title 1 schools. Education, 122(1), 177-188.
Guo, P., & Higgins-D’Alessandro, A. (2011, October). The place of teachers’ views of
teaching in promoting positive school culture and student prosocial and academic
outcomes. Paper presented at the Association for Moral Education annual
conference, October 10, 2011, Nanjing, China.
Guo, P. (2012). School culture: A validation study and exploration of its relationship with

SCHOOL CLIMATE AND STUDENT ACHIEVEMENT 84
teachers' work environment (Doctoral dissertation, Fordham University).
Guskey, T. (1996). Reporting on student learning. Lessons from the past—prescriptions
for the future. In T. Guskey. (Ed.), Communicating student learning: The 1996
ASCD yearbook (pp. 13-24). Alexandria, VA: Association of Supervision and
Curriculum Development.
Hallinger, P. (2005). Instructional leadership and the school principal: A passing fancy
that refuses to fade away. Leadership and Policy in School, 4(3), 221-239.
Hallinger, P., Bickman, L., & Davis, K. (1996). School context, principal leadership, and
student reading achievement. The Elementary School Journal, 96(5), 527-549.
Hallinger, P., & Heck, R. H. (1998). Exploring the principal’s contribution to school
effectiveness: 1980-1995. School Effectiveness and School Improvement, 9(2),
157-191.
Hamre, B. K., & Pianta, R. C. (2005). Can instructional and emotional support in the
first-grade classroom make a difference for children at risk of school failure?
Child Development, 76(5), 949-967.
Hands, C. (2010). Why collaborate? The differing reasons for secondary school
educators' establishment of school-community partnerships. School Effectiveness
& School Improvement, 21(2), 189-207.
Haynie, G. (2006). Effective Biology teaching: A value-added instructional improvement
analysis model. Retrieved from http://files.eric.ed.gov/fulltext/ED564400.pdf.
Hellriegel, D., & Slocum, J. W. K. Jr., (1974). Organizational climate: Measures,
research, and contingencies. The Academy of Management Journal, 17(2), 255-
280.
SCHOOL CLIMATE AND STUDENT ACHIEVEMENT 85
Hoffman C., Reiter-Palmon R., & Shultz, K. (2005) Using archival data for i-o research:
Advantages, pitfalls, sources, and examples. The Industrial-Organized
Psychologist. 42(3), 31-37. Retrieved from
http://www.psychology.csusb.edu/facultyStaff/docs/Shultz_et_al_2005_TIP.pdf.
Hoffman, S. (2014). Zero benefit: Estimating the effect of zero tolerance discipline
policies on racial disparities in school discipline. Educational Policy, 28(1), 69-
95.
Horng, E., & Loeb, S. (2010). New thinking about instructional leadership. Phi Delta
Kappan, 92(3), 66-69. Retrieved from EBSCOhost.
Hoy, W., & Hannum, J. (1997). Middle school climate: An empirical assessment of
organizational health and student achievement. Educational Administration
Quarterly, 33(3), 290-311.
Hoy, W. K., & Miskel, C. G. (2005). Educational administration: Theory, research, and
practice, (7th ed.). Boston, MA: McGraw Hill.
Hoy, W. K., Sabo, D., & Barnes, K. (1996, Spring). Organizational health and faculty
trust: A view from the middle level. Research in Middle Level Educational
Quarterly, 21-39.
Hoy, W. K., Tarter, C. J., & Bliss, J. R. (1990). Organizational climate, school health,
and effectiveness: A comparative analysis. Educational Administration Quarterly,
26(3), 260-279.
Johnson, J. F. Jr., & Uline, C. L. (2005). Preparing educational leaders to close
achievement gaps. Theory Into Practice, 44(1), 45-52.
Johnson, D. W., Johnson, R. T., & Roseth, C. (2010). Cooperative learning in middle

SCHOOL CLIMATE AND STUDENT ACHIEVEMENT 86
schools: Interrelationship of relationships and achievement. Middle grades
research journal, 5(1), 1-19.
Jones, A., Shindler, J., Cadenas, H., & Taylor, C. (2003, January). Transcending
traditional school assessment: Examining the efficacy of a participant driven
school climate assessment and improvement system. Presentation at the American
Association of Colleges for Teacher Education, New Orleans, L.A.
Kearney, W., & Herrington, D. (2010). High performing principals in historically low-
performing minority-serving schools: A glimpse into the success of 90/90/90
Schools in South Central Texas. National Forum of Applied Educational
Research Journal, 24(1/2), 63-72.
Keefe, J. W., Kelley, E. A., & Miller, S. K. (1985). School climate: Clear definitions and
a model for a larger setting. NASSP Bulletin, 69(484), 70-77.
Kelley, R. C., Thornton, B., & Daughtery, R. (2005). Relationship between measures of
leadership and school climate. Education, 126(1), 17-25.
Kouzes, J. M., & Posner, B. Z. (2002). The leadership challenge (3rd ed.). San Francisco,
CA: Jossey–Bass.
Kupchik, A. (2010). Homeroom security: School discipline in an age of fear. New York,
NY: New York University Press.
Laerd Statistics (2017) Retrieved from: https://statistics.laerd.com/spss-
tutorials/pearsons-product-moment-correlation-using-spss-statistics.php.
Leinhardt, G. (1993). On teaching. In R. Glaser (Ed.), Advances in instructional
psychology, Vol. 4, pp. 1-54. Hillsdale, NJ: Lawrence Erlbaum Associates.
Leithwood, K. A., & Riehl, C. (2003). What do we already know about successful school
SCHOOL CLIMATE AND STUDENT ACHIEVEMENT 87
leadership? Washington, DC: AERA Division A Task Force on Developing
Educational Leadership.
Lindahl, R. (2009). School climate differences between high-performing and low-
performing schools that serve high-poverty populations, NCPEA Education
Leadership Review, 10(1). Retrieved from http://cnx.org/ content/
m19508/latest/?collection=col10630/latest.
Marks, E. S. (1995). Entry strategies for school consultation. New York, NY: Guilford
Press.
Marzano, R. J., Pickering, D. J., & Pollock, J. E. (2001). Classroom instruction that
works: Research-based strategies for increasing student achievement.
Alexandria, VA: Association for Supervision and Curriculum Development.
McCoy, D. C., Roy, A. L., & Sirkman, G. M. (2013). Neighborhood crime and school
climate as predictors of elementary school academic quality: A cross-lagged panel
analysis. American Journal of Community Psychology, 52:128-140.
McEwan, E. K. (2002). Ten traits of highly effective teachers: How to hire, coach, and
mentor successful teachers. Alexandria, VA: Association for Supervision and
Curriculum Development.
McGuigan, L., & Hoy, W. K. (2006). Principal leadership: Creating a culture of academic
optimism to improve achievement for all students. Leadership and Policy in
Schools, 5(3), 203-229.
Miles, M. B., & Huberman, A. M. (1994). Qualitative Data Analysis (2nd ed.). Thousand
Oaks, CA: Sage Publication.
Mitchell, M. M., Bradshaw, C. P., & Leaf, P. J. (2010). Student and teacher perceptions
SCHOOL CLIMATE AND STUDENT ACHIEVEMENT 88
of school climate: A multilevel exploration of patterns of discrepancy. Journal of
School Health, 80(6), 271-279.
Moller, S., Mickelson, R., Stearns, E., Bottia, M., Banerjee, N. & Society for Research on
Educational Effectiveness, (2011). The benefits of collective pedagogical teacher
culture for diverse students' mathematics achievement by academic engagement.
Society for Research on Educational Effectiveness.
Morrison, S. K. (2007). Relationship between elementary school teachers’ and
principals’ perceptions of school climate and student achievement in
communication arts. (Doctoral dissertation) Saint Louis University, MI. UMI No.
3280217.
Muijs, D., & Reynolds, D. (2002). Teachers’ beliefs and behaviors: What really matters?
Journal of Classroom Interaction, 37(2), 3-15.
Myers, A., & Hansen, C. (2002). Experimental psychology. Pacific Grove, CA:
Wadsworth.
National Assessment of Educational Progress (NAEP). (2015). Nation’s Report Card.
Available
at:https://www.nationsreportcard.gov/profiles/stateprofile/overview/GA?cti=PgTa
b_Findings&chort=2&sub=MAT&sj=GA&fs=Grade&st=MN&year=2015R3&sg
=Gender%3A+Male+vs.+Female&sgv=Difference&ts=Single+Year&tss=2015R
3-2015R3&sfj=NP
National Center of Education Statistics. (2002). Condition of education 2002.
Washington, DC: U.S. Department of Education.
National Center of Education Statistics. (2011). Condition of education 2011.

SCHOOL CLIMATE AND STUDENT ACHIEVEMENT 89
Washington, DC: U.S. Department of Education.
National Center for Education Statistics. (2016) Condition of education 2016.
Washington, DC: U. S. Department of Education.
National Center for Education Statistics. (2017) Condition of education 2017.
Washington, DC: U. S. Department of Education.
National Middle School Association. (1995). This We Believe: Developmentally
Responsive Middle Level Schools, Columbus, OH.
National School Climate Council. (2007). The school climate challenge: narrowing the
gap between school climate research and school climate policy, practice
guidelines and teacher education policy. Available at:
http://www.schoolclimate.org.climate.documents.policy/school-climate-
challenge-web.pdf.
O’Connor, K., & Wormeli, R. (2011). Reporting student learning. Educational
Leadership, 69(3), 40-44.
Panasuk, R., Stone, W., & Todd, J. (2002). Lesson planning strategy for effective
mathematics teaching. Education, 22(2), 714, 808-827.
Portin, B., Schneider, P., DeArmond, M., & Gundlach, L. (2003, September). Making
sense of leading schools: A study of the school principalship. Seattle, WA: Center
on Reinventing Public Education.
Roney, K., Coleman, H., & Schlichting, K. A. (2007). Linking the organizational health
of middle grades schools to student achievement. NASSP Bulletin, 91(4), 289-321.
Schreck, C. J., Miller, J. M., & Gibson, C. L. (2003). Trouble in the school yard: A study
of risk factors of victimization at school. Crime and Delinquency, 49(3), 460-484.

SCHOOL CLIMATE AND STUDENT ACHIEVEMENT 90
Sims, C. E. (2005). The effects of principals’ leadership practices on school climate and
student achievement in Title I elementary schools. (Doctoral dissertation). Union
University, Tennessee. UMI No. 3797286.
Skiba, R. J., Chung, C., Trachok, M., Baker, T. L., Sheya, A., & Hughes, R. L. (2014).
Parsing disciplinary disproportionality: Contributions of infraction, student, and
school characteristics to out-of-school suspension and expulsion. American
Educational Research Journal, 51(4), 640-670.
Smith, J. J. (2005). The relationship between school division climate and student
achievement of school divisions in the commonwealth of Virginia (Doctoral
dissertation, Virginia Tech).
Stetser, M. C., & Stillwell, R. (2014). Public high school four year on-time graduation
rates and event dropout rates: School years 2010-11 and 2011-12. National
Center for Education Statistics. Retrieved from
https://nces.ed.gov/pubs2014/2014391.pdf
Stronge, J., & Leeper, L. (2012). Research synthesis of Virginia principal evaluation
competencies and standards. Virginia Department of Education. Retrieved from
http://www.doe.virginia.gov/teaching/performance_evaluation/research_synthesis
_of_principal_eval.pdf
Stronge, J. H., Richard, H. B., & Catano, N. (2008). Qualities of effective principals.
Alexandria, VA: Association for Supervision and Curriculum Development.
Sumner, M. G. (2006). Climate and student performance in Tennessee middle schools
(Doctorial dissertation). Retrieved from Dissertations & Theses: Full Text.
(Publication No. AAT 3235518)

SCHOOL CLIMATE AND STUDENT ACHIEVEMENT 91
Tableman, B. (2004). School climate and learning. Best Practice Briefs, 31, 1-10.
Tomlinson, C. A. (2010). Lessons plans well served. Educational Leadership, 74(2), 89-
90.
Waters, J. T., Marzano, R. J., & McNulty, B. (2003). Balanced leadership: What 30
years of research tells us about the effect of leadership on student achievement: A
working paper. Aurora, CO: Mid-continent Research for Education and Learning
(McREL).
Welch, K., & Payne, A. A. (2010). Racial threat and punitive school discipline. Social
Problems, 57(1), 25-48.
Yu, M. V. B., Johnson, H. E., Deutsch, N. L., & Varga, S. M. (2016). “She calls me by
my last name” Exploring adolescent perceptions of positive teacher-student
relationships. Journal of Adolescent Research. Retrieved from:
http://journals.sagepub.com/doi/full/10.1177/0743558416684958
Zullig, K. J., Huebner, E. S., & Patton, J. M. (2010). Relationships among school climate
domains and school satisfaction. Psychology in the Schools, 48(2), 133-145.

SCHOOL CLIMATE AND STUDENT ACHIEVEMENT 92
Appendix A
Dimensions GSHS II Questions
SAFETY
1 Rules and Norms School Climate #4: “My School Sets
Clear Rules or Behavior”
2 Sense of Physical Security School Climate #5: “I know what to do if
there is an emergency at my school”
3 Sense of Social-Emotional Security School Climate #11: “School is a place
at which I feel safe”
TEACHING AND LEARNING
4 Support for Learning School Climate #3: “I feel my school has
high standards for achievement”
5 Social and Civic Learning School Climate #8: “Students are
frequently recognized for their good
behavior”
INTERPERSONAL RELATIONSHIPS
6 Respect for Diversity N/A
7 Social Support-Adults School Climate #6: “Teachers treat me
with respect”
8 Social Support- Students School Climate #7: “The behaviors in
the classroom allow the teacher to teach
so I can learn”
School Climate #10: “I get along with
other students and adults”
INSTITUTIONAL ENVIRONMENT
9 School Connectedness/Engagement School Climate #1: “ I Like School”;
School Climate #2: “I Feel Successful at
School”
10 Physical Surroundings School Climate #9: “I feel my school
counselor would be helpful if I needed
assistance”
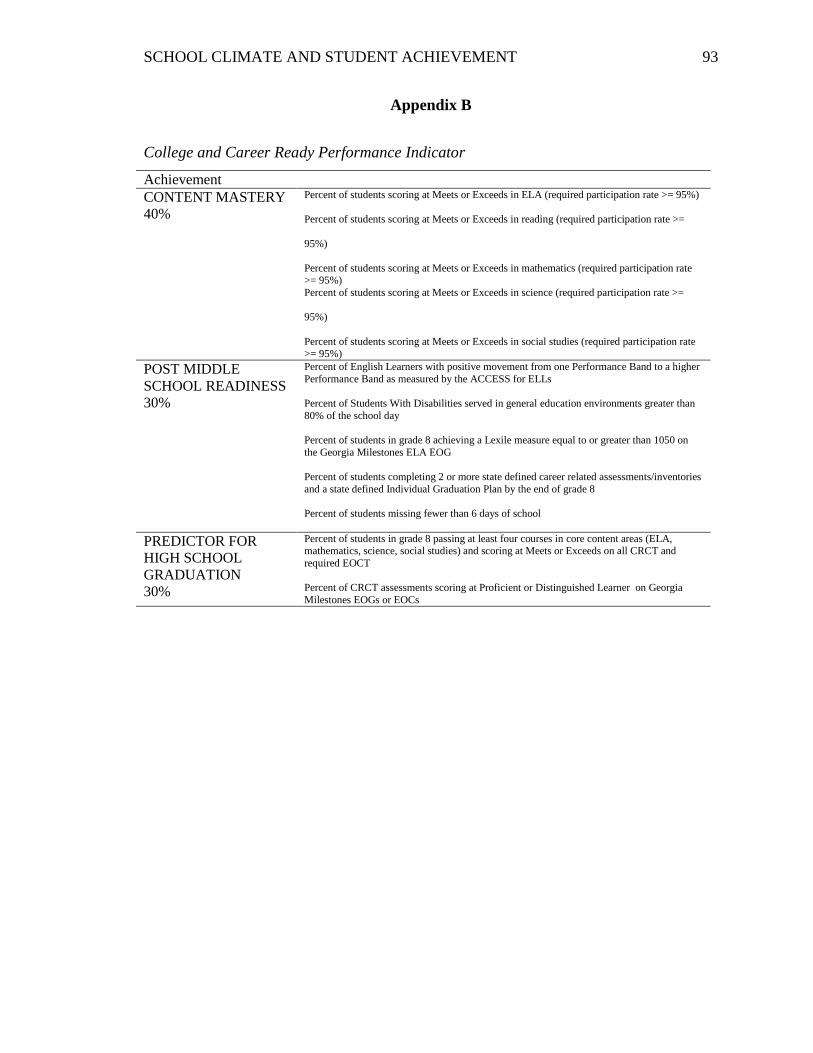
SCHOOL CLIMATE AND STUDENT ACHIEVEMENT 93
Appendix B
College and Career Ready Performance Indicator
Achievement
CONTENT MASTERY
40%
Percent of students scoring at Meets or Exceeds in ELA (required participation rate >= 95%)
Percent of students scoring at Meets or Exceeds in reading (required participation rate >=
95%)
Percent of students scoring at Meets or Exceeds in mathematics (required participation rate >= 95%)
Percent of students scoring at Meets or Exceeds in science (required participation rate >=
95%)
Percent of students scoring at Meets or Exceeds in social studies (required participation rate >= 95%)
POST MIDDLE
SCHOOL READINESS
30%
Percent of English Learners with positive movement from one Performance Band to a higher
Performance Band as measured by the ACCESS for ELLs
Percent of Students With Disabilities served in general education environments greater than
80% of the school day
Percent of students in grade 8 achieving a Lexile measure equal to or greater than 1050 on
the Georgia Milestones ELA EOG
Percent of students completing 2 or more state defined career related assessments/inventories
and a state defined Individual Graduation Plan by the end of grade 8
Percent of students missing fewer than 6 days of school
PREDICTOR FOR
HIGH SCHOOL
GRADUATION
30%
Percent of students in grade 8 passing at least four courses in core content areas (ELA, mathematics, science, social studies) and scoring at Meets or Exceeds on all CRCT and
required EOCT
Percent of CRCT assessments scoring at Proficient or Distinguished Learner on Georgia
Milestones EOGs or EOCs

SCHOOL CLIMATE AND STUDENT ACHIEVEMENT 94
Appendix C
County % of Children Living in Poverty
Burke 37.9%
Columbia 11.3%
Emanuel 40.2%
Glascock 24.4%
Jefferson 39.7%
Jenkins 47.3%
Lincoln 31.9%
McDuffie 40.5%
Richmond 37.7%
Taliaferro 54.4%
Warren 43.9%
Wilkes 34.7%
(gafcp.org, 2017)

SCHOOL CLIMATE AND STUDENT ACHIEVEMENT 95
Appendix D
IRB Approval