relationship betweenvegetation indicesof landsat-7 … · relationship betweenvegetation indicesof...
TRANSCRIPT

IOSR Journal of Agriculture and Veterinary Science (IOSR-JAVS)
e-ISSN: 2319-2380, p-ISSN: 2319-2372. Volume 8, Issue 2 Ver. II (Feb. 2015), PP 18-31 www.iosrjournals.org
DOI: 10.9790/2380-08221831 www.iosrjournals.org 18 | Page
Relationship Betweenvegetation Indicesof Landsat-7 ETM+, MSS
Data and Some Soil Properties: Case Study of Baqubah,
Diyala, Iraq
Amal M. Saleh College of Agriculture /University of Baghdad.
Abstract: Vegetation Indices (VIs) are combinations of surface reflectance at two or more wavelengths
designed to highlight a particular property of vegetation. They are derived using the reflectance properties of
vegetation. The NDVI (Normalized Difference Vegetation Index) and MSAVI2 (Modified Soil Adjusted
Vegetation Index) differencing methods using Landsat satellite ETM+7 and MSS images were implemented to
assess the relationship between some soil physical-chemical properties and these two vegetation indices in
Baqubah (the capital of Iraq's Diyala Governorate). The relationship between chemical _textural soil properties
and NDVI, MSAVI2 could not be established due mainly to the effect of climatic conditions and some geological and pedological processes. A significant Pearson correlation was found between MSAVI2and CaCO3 content at
the 0.05 level (2-tailed) of Landsat ETM+7. It is also observed that there were negative correlation coefficients
between CaCO3 content and the spectral reflectance values of Landsat MSS bands at the 0.05 level (2-tailed).
This means that, the soils of the Lower Mesopotamian Plain are extremely calcareous. There were statistically
significant correlation coefficients between sand, clay, and organic matter (O.M.) contents and panchromatic
band of Landsat ETM+7 data. These results are related to the higher spatial resolution of ETM+7
Panchromatic band in comparison to the lower spatial resolution of reflective bands.
Keywords:Remote sensing; MSAVI2; NDVI; Spectral reflectance; Vegetation indices; Landsat-7 ETM+; MSS
data.
I. Introduction
Remote sensing is the acquisition of information about an object or phenomenon without making
physical contact with the object and thus in contrast to in situ observation. In modern usage, the term generally
refers to the use of aerial sensor technologies to detect and classify objects on Earth (both on the surface, and in
the atmosphere and oceans) by means of propagated signals (e.g. electromagnetic radiation). It may be split into
active remote sensing, when a signal is first emitted from aircraft or satellites) or passive (e.g. sunlight) when
information is merely recorded (Liu andMason, 2009). Remote sensing is expected to offer possibilities for improving incomplete spatial and thematic
coverage of current regional and global soil databases. Traditionally, remotely sensed imagery have been used to
support segmentation of the landscape into rather homogeneous soil–landscape units for which soil composition
can be established by sampling. Soil properties have also been inferred from optical and microwave data using
physically-based and empirical methods. Used as a secondary data source, remotely sensed imagery may
support spatial interpolation of sparsely sampled soil property data (Mulder et al., 2011).
The remotely acquired data and their relationships with soil mineralogy, texture organization, and
pedogenetic process have been well demonstrated by numerous studies. Nevertheless, the majority of these
studies are based on the use of ground spectral data obtained either under lab conditions or directly in the field
(Nanni and Demattê, 2006). Recently, others have tried to apply laboratory spectral analysis methodologies for
use in soil surveying (Demattê et al., 2004). Remote sensing techniques offer fast access to information about soil conditions and have been applied
over a number of regions worldwide for mapping physical and chemical properties of bare ground. However, in
case of surfaces covered with vegetation it is also possible to estimate of soil conditions using remote sensing
data since vegetation patterns often reflect underlying soil properties. The pixel value on the satellite imagery is
proportional to the amount ofreflected radiation from a vegetated surface. Abundant, non-stressed plants reflect
more near-infrared energy and less visible light than a sparser vegetation cover. Since there are strong
relationships between soil conditions, plant biomass and their spectral response thus green vegetation can serve
as an indirect measure of underlying soils (Piekarczyk et al., 2012).
Alavi Panah and Goossens (2001)have shown thatthe behavior of the MSS and TM wavebands on
surface soil salinity conditions are almost the same.Based on the correlation obtained between the soil salinity
and TM and MSS DN values,they may generally conclude that thermal band of Landsat TM imagery provided
some useful information that may have an important role in soil salinity studies.
Relationship BetweenVegetation IndicesOf Landsat-7 ETM+, MSS DATA and Some...
DOI: 10.9790/2380-08221831 www.iosrjournals.org 19 | Page
Soil properties that have been measured using remote or proximal sensing approaches include
mineralogy, texture, soil iron, soil moisture, soil organic carbon, soil salinity and carbonate content. In sparsely
vegetated areas, successful use of space borne, airborne, and in situ measurements using optical, passive and active microwave instruments has been reported. On the other hand, in densely vegetated areas, soil data
acquisition typically relied on indirect retrievals using soil indicators, such as plant functional groups,
productivity changes, and Ellenberg indicator values (Mulder et al., 2011).
Using remote sensing, Dogana and Kılıça (2013) investigated relationships among Landsat-7 Enhanced
Thematic Mapper Plus (Landsat-7 ETM+) satellite bands and some soil surface variables of Central Kelkit
Basin in Turkey such as calcium carbonate (CaCO3), pH, electrical conductivity (EC), organic matter (OM),
nitrogen (N), phosphorus (P), exchangeable potassium (EK), and texture (clay, silt, and sand). They studied
possible relationships between the soil variables and the bands' DN values by using correlation (Pearson)
analysis. They found that four soil variables including pH, OM, CaCO3, and N have significant correlations
with band 5 (short wave infrared) DN values.
The objective of the research described here was to investigate therelationship between some soil physical-chemical properties andthe vegetation indicesusing Landsat satelliteETM+7 and MSS Datathat could
be correlated with real information.
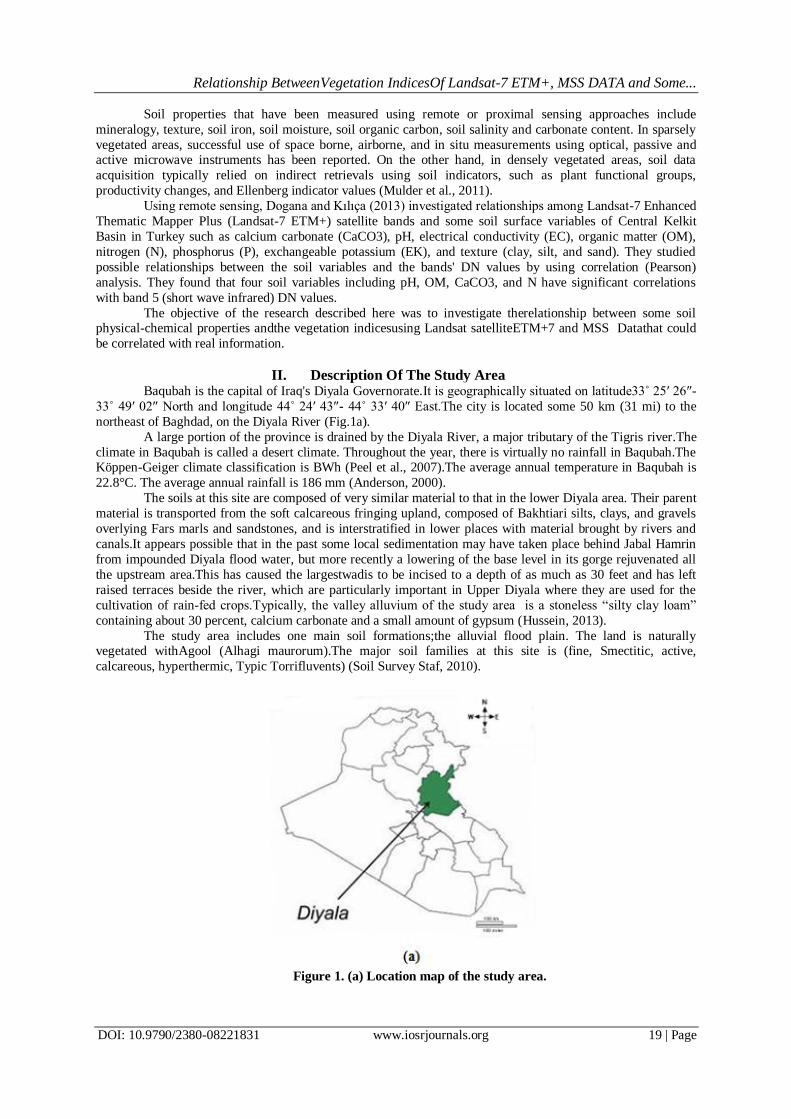
II. Description Of The Study Area Baqubah is the capital of Iraq's Diyala Governorate.It is geographically situated on latitude33˚ 25′ 26″-
33˚ 49′ 02″ North and longitude 44˚ 24′ 43″- 44˚ 33′ 40″ East.The city is located some 50 km (31 mi) to the
northeast of Baghdad, on the Diyala River (Fig.1a).
A large portion of the province is drained by the Diyala River, a major tributary of the Tigris river.The
climate in Baqubah is called a desert climate. Throughout the year, there is virtually no rainfall in Baqubah.The Köppen-Geiger climate classification is BWh (Peel et al., 2007).The average annual temperature in Baqubah is
22.8°C. The average annual rainfall is 186 mm (Anderson, 2000).
The soils at this site are composed of very similar material to that in the lower Diyala area. Their parent
material is transported from the soft calcareous fringing upland, composed of Bakhtiari silts, clays, and gravels
overlying Fars marls and sandstones, and is interstratified in lower places with material brought by rivers and
canals.It appears possible that in the past some local sedimentation may have taken place behind Jabal Hamrin
from impounded Diyala flood water, but more recently a lowering of the base level in its gorge rejuvenated all
the upstream area.This has caused the largestwadis to be incised to a depth of as much as 30 feet and has left
raised terraces beside the river, which are particularly important in Upper Diyala where they are used for the
cultivation of rain-fed crops.Typically, the valley alluvium of the study area is a stoneless ―silty clay loam‖
containing about 30 percent, calcium carbonate and a small amount of gypsum (Hussein, 2013).
The study area includes one main soil formations;the alluvial flood plain. The land is naturally vegetated withAgool (Alhagi maurorum).The major soil families at this site is (fine, Smectitic, active,
calcareous, hyperthermic, Typic Torrifluvents) (Soil Survey Staf, 2010).
Figure 1. (a) Location map of the study area.

Relationship BetweenVegetation IndicesOf Landsat-7 ETM+, MSS DATA and Some...
DOI: 10.9790/2380-08221831 www.iosrjournals.org 20 | Page
(b) The Satellite Landsat ETM+7 scene.
(c) The Satellite Landsat MSS scene.
III. Materials And Methods Landsat Enhanced Thematic Mapper Plus (ETM+7)imageries among other Satellites provide a number
of bands inthe visible, SWIR and thermal infrared regions, centered onparticular spectral features due to
different kinds of surfacematerial (Drury, 1993).
Theyareavailable and free of charge via theUSGS Global visualization Viewer
(http://glovis.usgs.gov).The selection of the imageries was based on the acquisitiondate, availability and spatial
resolution. A total of four MSS and seven ETM+7 bands,collected on 03/10/2013 (170 km x 185 km) and
03/06/2014 (170 km x 183 km)respectivelyhave been utilized in thisstudy (Fig. 1b, 1c). MSSincludefour
spectral bands with 60 m spatial resolution whilethe selected bands of ETM+7 include band 1through band 5
and band 7 (Visible & Reflected Infrared ―VNIR‖) that characterized with 30m spatial resolution. Inaddition to
band 8 as the Panchromatic band (15m). Thethermal Infrared band 6 has been excluded for its low
spatialresolution (60 m).

Relationship BetweenVegetation IndicesOf Landsat-7 ETM+, MSS DATA and Some...
DOI: 10.9790/2380-08221831 www.iosrjournals.org 21 | Page
ERDAS IMAGINE 9.2 software packages are used in digital processing to enhance the quality of the
satellite raw digital data and produce image suitable forvisual soil interpretation. Geo-referenced topographical
mapswere overlaid on the subset Landsat ETM+, MSS imageries to create a field map (scale 1:100,000) using Arc GIS 9.3 software. The map facilitatedimage classificationprocessing for NDVI, MSAVI2 differencing
technique.
3.1. Digital image processing
The major role of digital image processing is to increase theextractedsoil informationthroughthe
enhancement of the qualities of tones and hues, imagetextures, fracture patterns, lineaments and their
trends(Gupta, 2003).Based on the objectives and techniques, digital image processing can be categorized into:
(i)pre-processing techniques including geometric and radiometric correctionsof the satellite raw data;mosaiking
and subsetting techniquesfor the targeted area.
(ii)Image spatialenhancement techniquesinvolve procedures for creation of new modified images thatcontain
more information to ease the visual interpretations ofcertain features. Edge Detect is one of the spatial convolution filtering that detect lineaments in a specific direction. The
linear and edge in the original image become more obvious and sharper in the filtered image (Fig. 2a, 2b).
The initial step toward digital image proccessing is to calculate the statistical parameters of the raw
satellite data(Table 1).These parameters are used indifferent image transformations.
(a) (b)
Figure 2.(a) Spatial _ Enhancement image of Landsat ETM+7data, (b) Spatial _ Enhancement image of
Landsat MSS data.
Table 1. Calculated Basic Statistics of Landsat ETM+7, MSS Data. Coeficien
ofvariation
Standard
Deviation Mean Maximum Minimum Band
Scene
(Path, Row)
25.47 17.44 68.47 171 34 1
ET
M+
7
(p1
69
, r3
7)
37.78 25.14 66.53 158 26 2
51.71 41.89 81.01 186 13 3
42.28 32.49 76.84 152 7 4
54.17 44.73 82.56 172 1 5
57.62 38.39 66.62 143 1 7
75.91 21.15 27.86 98 0 1
MS
S
(p1
81
, r3
7)
79.32 32.64 41.15 130 0 2
76.51 33.16 43.34 128 0 3
76.24 25.45 33.38 102 0 4
3.2. Laboratory Spectral Data of Soils
Soil samples were collected from eachpoint of the 32 locations of the different soil sites (Fig.3).
Eachpoint was georeferenced using the differential global positioningsystem (DGPS) with a maximum error of
3 meters.At each point, the soil was sampled at 0-20cmdepth (top horizon).The soil samples were analysed to
determine their physical and chemical properties: organic matter (O.M.), calcium carbonate (CaCO3), pH,
electrical conductivity (ECe), and particle size distribution (sand, silt and clay).

Relationship BetweenVegetation IndicesOf Landsat-7 ETM+, MSS DATA and Some...
DOI: 10.9790/2380-08221831 www.iosrjournals.org 22 | Page
The collected soil samples were sent for physical, and chemicalanalysis in the laboratory. Soil samples
were taken to laboratory where they were dried at 45°C for 48 h and sieved to 2 mm. The contents of total sand,
silt, and clay were determined by the densimeter method (Bowman and Hutka, 2002). Soil chemical analyses included pH (using CaCl2 solution 0.01 N),organic matter (O.M.) (Colorimeter method) were determined (Raij
et al., 1987). electrical conductivity (ECe) using saturated paste was determined (Zhang et al., 2005). Calcium
carbonate (Calcimeter Bernard method) was performed (Lagacherie et al., 2008).
Field soil survey data associated with their image characteristics and collecting sufficient data were
used for validating the interpretation soil map generated from the satellite imageries(Table2).
Figure 3. Soil sampling sites.

Relationship BetweenVegetation IndicesOf Landsat-7 ETM+, MSS DATA and Some...
DOI: 10.9790/2380-08221831 www.iosrjournals.org 23 | Page
Table 2.Chemical and Textural Soil Dataat the study area.
3.3. Spectral reflectance measurements
Atmospheric correction is the most important preprocessing factorand also is the most difficult to correct due to the complexity of atmospheric conditions in time and space. The first step of the image-based
atmospheric correction method is to convert remotely sensed ETM+, MSS DN values to at-satellite radiance
based on themaximal and minimal spectral radiancevalue for each band, which was provided by Markham and
Barker (1986).
Lλ = ((LMAXλ - LMINλ)/(QCALMAX-QCALMIN)) * (QCAL-QCALMIN) + LMINλ……………………… (1)
where:
Lλ = Spectral Radiance at the sensor's aperture in watts/(meter squared * ster * μm).
LMINλ = the spectral radiance that is scaled to QCALMIN in watts/(meter squared * ster * μm).
LMAXλ = the spectral radiance that is scaled to QCALMAX in watts/(meter squared * ster * μm).
QCALMIN = the minimum quantized calibrated pixel value (corresponding to LMINλ) in DN.
QCALMAX = the maximum quantized calibrated pixel value (corresponding to LMAXλ) in DN. QCAL = the quantized calibrated pixel value in DN.
The at-sensor radiance values calculated using Equation 1 must be corrected for solar variability caused
by annual changes in the Earth-Sun distance d, producing unitless at-sensor(or top-of-atmosphere) reflectance
(NASA, 2011).
Rλ = ᴫ * d2 * Lλsensor /(Esunλ* COS(ϴS)) ……………………… (2)
Where:
Rλ = Unitless planetary reflectance.
Lλsensor = Spectral radiance at the sensor's aperture in watts/(meter squared * ster * μm).
d = Earth-Sun distance in astronomical units.
Esunλ =Mean solar exoatmospheric irradiances in watts/(meter squared * μm).
ϴS = Solar zenith angle in degrees.
Relationship BetweenVegetation IndicesOf Landsat-7 ETM+, MSS DATA and Some...
DOI: 10.9790/2380-08221831 www.iosrjournals.org 24 | Page
3.4. Vegetation indices The MSS based NDVI, MSAVI2 was used as an indicator of vegetation cover to separate bare soil
from vegetation cover in 2013 and the ETM+7 based NDVI, MSAVI2 was taken to separate bare soil from
vegetation cover in 2014.
Green vegetation cover indices are sensitive to plant cover and provide an estimate of the― greenness‖
of the area. These indices are related to vegetation vigor and amount. The most known and widely used
vegetation index is the Normalized Difference Vegetation Index (NDVI) developedby Rouse et al. (1973).It
minimizes the topographic effects (Holben and Justice, 1981) and It is based on the contrast between the
maximum absorption in the red due to chlorophyll pigments and the maximum reflection in the infrared
causedby leaf cellular structure.
The NDVI algorithm subtracts the red reflectance values from the near-infrared anddivides it by the
sum of near-infrared and red bands.
Defining an appropriate soil adjustment factor for pixels across an entire image, where the quantity and
type of vegetation and soil is not constant, is likely to cause non-systematic errors in estimates of variation in
vegetation indices among pixels within or between images. MSAVI2avoids thisproblem by replacing the
constant, empirical, adjustment factor for soil with adynamic,inductive one that varies inversely with the amount
of vegetation present in each pixel (Qi et al.,1994).
Qi et al. (1994)developed an improved SAVI (MSAVI2) with a self-adjustment factor L that does not
appear in the formulation of MSAVI2whichwas calculated from red band and near-infrared band reflectance using thefollowingequation:
The following Bands from the satellite sensors MSS, ETM+7 were used to calculate NDVI, MSAVI2:
Landsat MSS -- bands 2 (600-700 nm) and 3 (700-800 nm).
Landsat ETM+7 -- bands 3 (630-690 nm) and 4 (750-900 nm).
The algebraic combinations of red and NIR reflectance were designed in particular to minimize the
effect of external influences such as solar irradiance changes due to atmospheric effect and due to variations in
soil background optical properties in the vegetation canopy spectral response (Chabrillat, 2006).
IV. Results And Discussion
4.1.Analysis of vegetation density (NDVI, MSAVI2) using Landsat ETM+7, MSS data
We calculated the values of the two vegetation indices (NDVI, MSAVI2)of Landsat ETM+7, MSS
datausing combinations (pairs) of reflectance values in the red and NIR bands (Fig.4, 5).
Fig. 4 (a) shows the spatial distribution of NDVI from the LandsatETM+7 image. The NDVI values
estimated are in the range of 0.060 to 0.828, having a mean value of 0.366 with standard deviation of 0.255. It is
seems that lower NDVI value(dark area) is getting mixed with high dense built-up area on the south-west part of image. Medium NDVI values (grey areas to bright areas) are observed over agricultural cropland, in the
northern part of the image. It is observed that the dense vegetation (orchids), and sparse vegetation (grass/park)
appear in bright tone, while waste land/bare soil appears in bright to gray tone. Residential (low and high dense
built-up areas) and water bodies (Diyala river) appear in dark tone.
A distribution of vegetation is found in theMSS image Fig. 4 (b), which is represented in range from
0.001 to 0.298, having a mean value of 0.058 with standard deviation of 0.057. It is observed that most of the
agricultural croplands appear in dark tone. It is also observed that some of the sparse vegetation is getting mixed
with low dense built-up and fallow land is getting mixed with waste land/bare soil. This is mainly due to the
lower spatial resolution of Landsat MSS reflective bands (60 m).
Fig. 5 (a) shows the spatial distribution of MSAVI2 from the Landsat ETM+7 image. The MSAVI2
values are represented in the range from -1.00 to -0.062, having a mean value of -0.463 with standard deviation of 0.261. It is found that higher MSAVI2 value (bright area) corresponds to high dense vegetation (orchids) on
the south-west part of image. It is also observed that agricultural croplands appear in bright tone in the northern
part of the image.

Relationship BetweenVegetation IndicesOf Landsat-7 ETM+, MSS DATA and Some...
DOI: 10.9790/2380-08221831 www.iosrjournals.org 25 | Page
Analysis between the NDVI and the MSAVI2 of LandsatETM+7 images shows a negative Pearson’s
correlation coefficient of -0.880** and correlation is significant at the level of 0.01 (2-tailed). The differences
between these twovegetationindices indicate that the NDVI showed a very slight sensitivity to soil background influences while the MSAVI2 nearly eliminated these influences completely.
Fig. 5 (b) shows a distribution of vegetation in theMSS image. The MSAVI2 values estimated are in
the range of 0.00 to 0.064, having a mean value of 0.016 with standard deviation of 0.013. Analysis between the
NDVI and the MSAVI2 of LandsatMSS images shows a positive Pearson’s correlation coefficient of 0.987**and
correlation is significant at the level of 0.01 (2-tailed). This means that the spatial distribution of NDVI and
MSAVI2 in the LandsatMSS images is similar.
Figure 4. (a) NDVI (band 3_band 4) of Landsat ETM+7 data, (b)NDVI (band 2_band 3)of
Landsat MSS data.
Figure 5. (a) MSAVI2 (band 3_band 4)of Landsat ETM+7 data, (b)MSAVI2(band 2_band 3)of Landsat
MSS data
4.2. Relationship between vegetationindices and soil spectral properties
To determine the model for the prediction ofNDVI, MSAVI2, different regression types were
investigated. Fig. 6, 7, 8, 9 show the specification of linear, logarithmic,second-third-orderpolynomial, power
and exponential regression types forvegetation indices. The figures shows that the second- third
orderpolynomial equation has the highest correlation withchemical and textural soil properties.
Table 3 shows that regression coefficient (R2) of Landsat ETM+7between clay and CaCO3 contents
with NDVI was found 0.168, 0.160 respectively. It was observed that regression coefficient (R2)of Landsat MSS

Relationship BetweenVegetation IndicesOf Landsat-7 ETM+, MSS DATA and Some...
DOI: 10.9790/2380-08221831 www.iosrjournals.org 26 | Page
between clay content with NDVI, MSAVI2 was found 0.146, 0.141 respectively (Table 4), otherwise the
performance of soil properties in predicting MSAVI2 values is better than that of NDVI because of its ability to
minimize high reflectance of the soil. In general, the results from this investigation show no clear relationship between chemical _textural
soil properties and NDVI, MSAVI2 due mainly to the effect of climatic conditions and some geological and
pedological processes.
The soil climate at the study area is extreme, surface soil horizons are very dry and hot. Chemical
weathering and soil formation are extremely slowand physical weathering predominates in response to the
extreme variations in temperature.This is attributed to the long periods of dryness, since in winter,rain falls in
short heavy showers. The soil parent material consists mainly of river sediments. Besides the fluviatile sediment
which is carried by the Tigris river, some material of aeolian origin, blown out of the deserts, is accumulated
and mixed with the fluviatile deposits. Absence of vegetational cover results in an extremely low production of
organic matter.The morphology of soils reflects the weak processes of soil formation.The water in the surface
soil horizons evaporates rapidly. The remaining soil moisture therefore determines the rate and duration of the chemical reactions, the production of organic matter and the biological activity (Dost, 2003).
4.3. Variation of Correlation Coefficients between soil spectral properties and NDVI, MSAVI2 indices
Table 5 shows the variation of Pearson correlation coefficients between soil properties and vegetation
indices of Landsat ETM+7, MSS data.The results of correlation analysis are as follows:
1. There was no significant correlation between NDVI and soil physical and chemical properties of Landsat
ETM+7, MSS. Thismeans that NDVI and soil propertiesare decorrelatedor independentof each other on
soils.
2. In the case of MSAVI2, no significant correlation was foundwith soil properties, but a significant
correlation was found between MSAVI2and CaCO3 content at the 0.05 level (2-tailed) of Landsat ETM+7.
This means that, the soils of the LowerMesopotamian Plain are extremely calcareous (20 to 30 % lime) and
are Alluvial soils of the arid zone (Buringh, 1960).
(a) (b) (c)
Figure 6. Regression types of Landsat ETM+7 for predicting NDVI and MSAVI2 with Textural Soil
properties:
(a) Relationship between NDVI, MSAVI2 and Sandcontent.
(b) Relationship between NDVI, MSAVI2 and Silt content. (c) Relationship between NDVI, MSAVI2 and Clay content.

IOSR Journal of Agriculture and Veterinary Science (IOSR-JAVS)
e-ISSN: 2319-2380, p-ISSN: 2319-2372. Volume 8, Issue 2 Ver. II (Feb. 2015), PP 18-31 www.iosrjournals.org
DOI: 10.9790/2380-08221831 www.iosrjournals.org 27 | Page
(d) (e) (f)
Figure7. Regression types of Landsat ETM+7 for predicting NDVI and MSAVI2 with Chemical Soil
properties:
(a) Relationship between NDVI, MSAVI2 and ECe.
(b) Relationship between NDVI, MSAVI2 and CaCO3content.
(c) Relationship between NDVI, MSAVI2 and organic matter (O.M.)content.
(a) (b) (c)
Figure 8. Regression types of Landsat MSS for predicting NDVI and MSAVI2 with Textural Soil
properties:
(a) Relationship between NDVI, MSAVI2 and Sandcontent.
(b) Relationship between NDVI, MSAVI2 and Silt content.
(c) Relationship between NDVI, MSAVI2 and Clay content.

Relationship BetweenVegetation IndicesOf Landsat-7 ETM+, MSS DATA and Some...
DOI: 10.9790/2380-08221831 www.iosrjournals.org 28 | Page
(d) (e) (f)
Figure9. Regression types of Landsat MSS for predicting NDVI and MSAVI2 with Chemical Soil
properties: (a) Relationship between NDVI, MSAVI2 and ECe. (a) Relationship between NDVI, MSAVI2 and CaCO3content.
(b) Relationship between NDVI, MSAVI2 and organic matter (O.M.) content.
Table 3.Regression types of Landsat ETM+7 for predicting NDVI and MSAVI2with Chemical and
Textural Soil properties.
Relationship BetweenVegetation IndicesOf Landsat-7 ETM+, MSS DATA and Some...
DOI: 10.9790/2380-08221831 www.iosrjournals.org 29 | Page
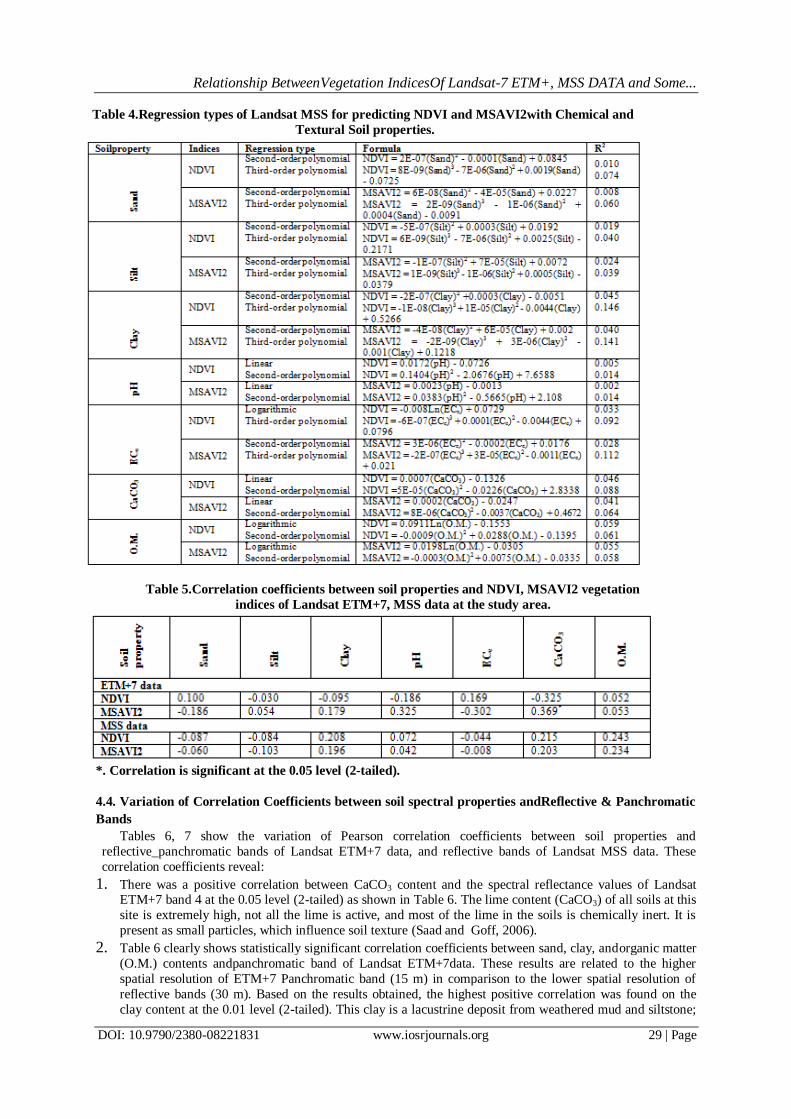
Table 4.Regression types of Landsat MSS for predicting NDVI and MSAVI2with Chemical and
Textural Soil properties.
Table 5.Correlation coefficients between soil properties and NDVI, MSAVI2 vegetation
indices of Landsat ETM+7, MSS data at the study area.
*. Correlation is significant at the 0.05 level (2-tailed).
4.4. Variation of Correlation Coefficients between soil spectral properties andReflective & Panchromatic
Bands
Tables 6, 7 show the variation of Pearson correlation coefficients between soil properties and
reflective_panchromatic bands of Landsat ETM+7 data, and reflective bands of Landsat MSS data. These
correlation coefficients reveal:
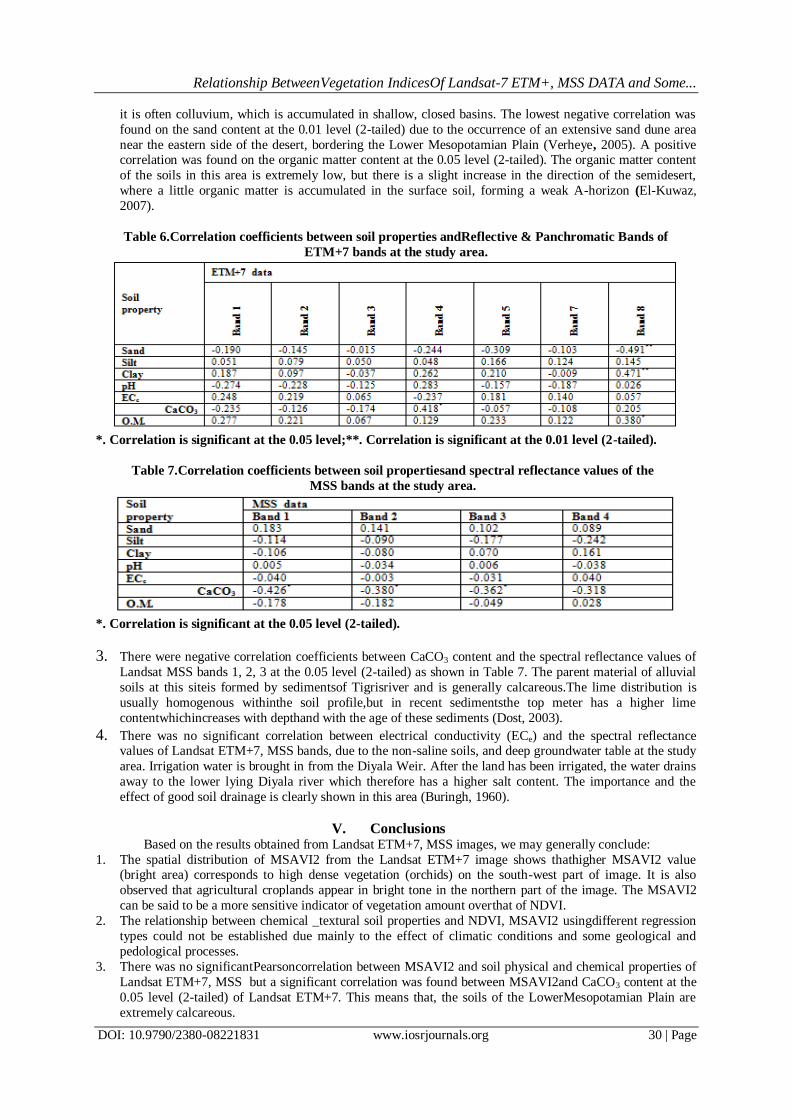
1. There was a positive correlation between CaCO3 content and the spectral reflectance values of Landsat ETM+7 band 4 at the 0.05 level (2-tailed) as shown in Table 6. The lime content (CaCO3) of all soils at this
site is extremely high, not all the lime is active, and most of the lime in the soils is chemically inert. It is
present as small particles, which influence soil texture (Saad and Goff, 2006).
2. Table 6 clearly shows statistically significant correlation coefficients between sand, clay, andorganic matter
(O.M.) contents andpanchromatic band of Landsat ETM+7data. These results are related to the higher
spatial resolution of ETM+7 Panchromatic band (15 m) in comparison to the lower spatial resolution of
reflective bands (30 m). Based on the results obtained, the highest positive correlation was found on the
clay content at the 0.01 level (2-tailed). This clay is a lacustrine deposit from weathered mud and siltstone;
Relationship BetweenVegetation IndicesOf Landsat-7 ETM+, MSS DATA and Some...
DOI: 10.9790/2380-08221831 www.iosrjournals.org 30 | Page
it is often colluvium, which is accumulated in shallow, closed basins. The lowest negative correlation was
found on the sand content at the 0.01 level (2-tailed) due to the occurrence of an extensive sand dune area
near the eastern side of the desert, bordering the Lower Mesopotamian Plain (Verheye, 2005). A positive correlation was found on the organic matter content at the 0.05 level (2-tailed). The organic matter content
of the soils in this area is extremely low, but there is a slight increase in the direction of the semidesert,
where a little organic matter is accumulated in the surface soil, forming a weak A-horizon (El-Kuwaz,
2007).
Table 6.Correlation coefficients between soil properties andReflective & Panchromatic Bands of
ETM+7 bands at the study area.
*. Correlation is significant at the 0.05 level;**. Correlation is significant at the 0.01 level (2-tailed).
Table 7.Correlation coefficients between soil propertiesand spectral reflectance values of the
MSS bands at the study area.
*. Correlation is significant at the 0.05 level (2-tailed).
3. There were negative correlation coefficients between CaCO3 content and the spectral reflectance values of
Landsat MSS bands 1, 2, 3 at the 0.05 level (2-tailed) as shown in Table 7. The parent material of alluvial
soils at this siteis formed by sedimentsof Tigrisriver and is generally calcareous.The lime distribution is
usually homogenous withinthe soil profile,but in recent sedimentsthe top meter has a higher lime
contentwhichincreases with depthand with the age of these sediments (Dost, 2003).
4. There was no significant correlation between electrical conductivity (ECe) and the spectral reflectance values of Landsat ETM+7, MSS bands, due to the non-saline soils, and deep groundwater table at the study
area. Irrigation water is brought in from the Diyala Weir. After the land has been irrigated, the water drains
away to the lower lying Diyala river which therefore has a higher salt content. The importance and the
effect of good soil drainage is clearly shown in this area (Buringh, 1960).
V. Conclusions Based on the results obtained from Landsat ETM+7, MSS images, we may generally conclude:
1. The spatial distribution of MSAVI2 from the Landsat ETM+7 image shows thathigher MSAVI2 value (bright area) corresponds to high dense vegetation (orchids) on the south-west part of image. It is also
observed that agricultural croplands appear in bright tone in the northern part of the image. The MSAVI2
can be said to be a more sensitive indicator of vegetation amount overthat of NDVI.
2. The relationship between chemical _textural soil properties and NDVI, MSAVI2 usingdifferent regression
types could not be established due mainly to the effect of climatic conditions and some geological and
pedological processes.
3. There was no significantPearsoncorrelation between MSAVI2 and soil physical and chemical properties of
Landsat ETM+7, MSS but a significant correlation was found between MSAVI2and CaCO3 content at the
0.05 level (2-tailed) of Landsat ETM+7. This means that, the soils of the LowerMesopotamian Plain are
extremely calcareous.
Relationship BetweenVegetation IndicesOf Landsat-7 ETM+, MSS DATA and Some...
DOI: 10.9790/2380-08221831 www.iosrjournals.org 31 | Page
4. There werestatistically significant correlation coefficients between sand, clay, andorganic matter (O.M.)
contents andpanchromatic band of Landsat ETM+7data. These results are related to the higher spatial
resolution of ETM+7 Panchromatic band in comparison to the lower spatial resolution of reflective bands. 5. There were negative correlation coefficients between CaCO3 content and the spectral reflectance values of
Landsat MSS bands 1, 2,3due tothe parent material of alluvial soils at the study area which is formed by
sedimentsof Tigrisriver and is generally calcareous.
6. There was no significant correlation between electrical conductivity (ECe) and the spectral reflectance
values of Landsat ETM+7, MSS bands, due to the non-saline soils, and deep groundwater table at the study
area.
References [1]. Alavi Panah, S. K.; and R. Goossens. 2001.Relationship Between the Landsat TM, MSS DATA and Soil Salinity. J. Agric. Sci.
Technol. 3: 21-31.
[2]. Anderson, E. 2000. The Middle East Geography and Geopolitics.New York: Routledge.
[3]. Bowman G. M.; and J. Hutka. 2002. Particle size analysis. In Soil Physical Measurement and Interpretation For Land Evaluation.
(Eds. NJ McKenzie, HP Cresswell, KJ Coughlan) pp. 224-239. (CSIRO Publishing: Collingwood, Victoria).
[4]. Buringh, P.1960. Soils and soil conditions in Iraq. Ministry of Agriculture, Baghdad, Iraq.
[5]. Chabrillat, S. 2006. Land degradationindicators: spectral indices. Annals of Arid Zone. 45(3&4): 331-354.
[6]. Demattê J.A.M.; R.C. Campos.; M.C. Alves; P.R. Fiorio; and M.R. Nanni. 2004. Visible-NIR reflectance: a new approach on soil
evaluation. Geoderma. 121: 95-112.
[7]. Dogana, H. M.; and O. M. Kılıça. 2013. Modelling and mapping some soil surface properties of Central Kelkit Basin in Turkey by
using Landsat-7 ETM+ images. International Journal of Remote Sensing. 34(15): 5623-5640.
[8]. Dost, M.2003. End of Assignment Report, FAO Iraq.
[9]. Drury, S. A. 1993. Image interpretation in geology. 2nd
ed. London: Chapman and Hall.
[10]. El-Kuwaz, S. S.2007. Rangelands Management and Development in Iraq. Proceedings of the expert consultation on range
monitoring including under forest systems in the Near East. pp.177-188. Food and Agriculture Organisation of the United Nations,
Rome.
[11]. Gupta R. Remote Sensing Geology. 2003. 2nd
ed. Berlin Heidelberg: Springer-Verlag.
[12]. Holben, B.N.; andC.O. Justice. 1981. An examinationof spectral band rationing to reduce the topographic effect on remotely sensed
data. International Journal of Remote Sensing 2: 115-121.
[13]. Hussein, H. A. 2013."Dependable Discharges of The Upper and Middle Diyala Basins". Journal of Engineering 16(2): 4960-4969.
[14]. Lagacherie P.; F. Baret; J. B. Feret; J. M. Netto ; and J. M. Robbez-Masson 2008. Estimation of soil clay and calcium carbonate
using laboratory, field and airborne hyperspectral measurements. Remote Sensing of Environment. 112: 85-95.
[15]. Liu, J. G.; and P. J. Mason. 2009. Essential Image Processing for GIS and Remote Sensing. Wiley-Blackwell. pp. 4.
[16]. Markham, B. L.;and J. L. Barker. 1986. Landsat MSS and TM post-calibration dynamicranges, exoatmospheric reflectance and at-
satellite temperatures. EOSAT Landsat TechnicalNotes. 1: 3-8.
[17]. Mulder, V.L.; S. de Bruin; M.E. Schaepman; and T.R. Mayr. 2011. The use of remote sensing in soil and terrain mapping — A
review. Geoderma. 162: 1-19.
[18]. Nanni M.R.; and J.A.M. Demattê. 2006. Spectral reflectance methodology in comparison to traditional soil analysis. Soil Sci. Soc.
Am. J. 70: 393-407.
[19]. NASA (Ed.) 2011. Landsat 7 Science Data Users Handbook Landsat Project Science Office at NASA's Goddard Space Flight
Center in Greenbelt, 186,Cited at:http://landsathandbook.gsfc.nasa.gov/pdfs/Landsat7_Handbook.pdf
[20]. Peel, M. C.;B. L. Finlayson; and T. A. McMahon. 2007. "Updated world map of the Köppen–Geiger climate classification". Hydrol.
Earth Syst. Sci. 11: 1633-1644.
[21]. Piekarczyk, J.; C. Kazmierowski; and S. Królewicz. 2012. Relationships between soil properties of the abandonedfields and spectral
data derived from aster image.Advances in Space Research. 49( 2): 280-291.
[22]. Qi, J.; A. Chehbouni; A.R. Huete; Y.H. Kerr; and S. Sorooshian. 1994. Modified Soil Adjusted Vegetation Index (MSAVI).
RemoteSensingof Environment. 48:119-126.
[23]. Raij B.; J. A. Quaggio; H. Cantarella; M. E. Ferreira; A. S. Lopes; and C. O.Bataglia. 1987. Análise Química do Solo Para Fins de
Fertilidade. Fundação Cargill: Campinas.
[24]. Rouse, J. W.; R. H. Haas; J. A. Schell; and D. W. Deering 1973. Monitoring vegetation systems in the Great Plains with ERTS,
Third ERTS Symposium, NASA SP-351 I, 309-317.
[25]. Saad, Z. J.; and J. C. Goff. 2006. Geology of Iraq. Published by Dolin, Prague and Moravian Museum, Brno.
[26]. Soil Survey Staff. 2010. Keys to soil taxonomy. 11th.ed; 2010. USDA-Natural Resources Conservation Service.
[27]. Verheye, W. 2005. Soils of arid and semi-arid areas. Land Use, Land Cover and Soil Sciences – Vol.VII.
[28]. Zhang, H.; J. L. Schroder; J. J. Pittman; J. J. Wang; and M. E. Payton. 2005. Soil salinity using saturated paste and 1:1 soil and
water extracts. Soil Sci. Soc. Am. J. 69: 1146-1151.