relationship breathing
TRANSCRIPT

THE RELATIONSHIP OF OXYGENCOSTOF BREATHINGTORESPIRATORYMECHANICALWORKAND
RESPIRATORYFORCE
By MAURICEMcGREGOR* AND MARGARETR. BECKLAKE
(From the Joint Cardio-respiratory Service of the Royal Victoria Hospital and the MontrealChildren's Hospital, Department of Medicine, McGill University, Montreal, Canada)
(Submitted for publication January 25, 1960; accepted February 16, 1961)
The oxygen cost of increased respiratory ac-tivity can be measured by subtracting the oxygenconsumption at rest from that observed duringthe increased respiratory activity. The efficiencyof the system can be assessed when the increasedrespiratory mechanical work is related to the oxy-gen cost.
Previous estimates of efficiency in man havevaried very widely, possibly because very differentforms of respiratory work have been employed.Some workers have increased the pressure com-ponent of respiratory work by additions to the ex-ternal air flow resistance, a procedure which willbe referred to hereafter as "resistance breathing."In other studies, the volume component of respira-tory work has been augmented by increasing theminute volume, without any addition of airwayresistance: this will be referred to as "hyperven-tilation." No investigator employing one experi-mental technique has studied the oxygen cost ofboth of these forms of activity.
The first objective of this study was to ascertainwhether the relationship of oxygen cost to me-chanical respiratory work is the same for hyper-ventilation as for resistance breathing in normalsubjects. The second was to test whether thesame relationships hold in the presence of dis-eases which alter the mechanical properties of thelung.
There is evidence, however, that mechanicalwork is not the most revealing parameter withwhich to compare energy consumption. For ex-ample, the support of a heavy object at a fixeddistance from the ground involves energy con-sumption but results in no measurable mechanicalwork, although it is likely that the increasedenergy consumption would relate to the weight ofthe object and the length of time it was supported.
* Research Associate of the National Research Coun-cil of Canada.
It was considered of interest to establish the rela-tionship of oxygen consumption of the respiratorymuscles to the force exerted by them on the lung.
METHOD
Five healthy volunteer sedentary workers, 5 subj ectswith obstructive respiratory disease, and 4 cardiac pa-tients were selected for study. Selection of patients wasdetermined by the presence of abnormalities of the me-chanical properties of the lungs (Table I). All the pa-tients with obstructive lung disease had moderately se-vere impairment of exercise capacity except Subject 6in whom impairment was mild. The two subjects withmitral stenosis had moderate functional disability merit-ing surgical intervention, while the patients with mitralregurgitation and atrial septal defect suffered from nomore than minimal limitation of exercise tolerance. Thephysical characteristics and results of routine lung func-tion tests are listed in Table I.
Pressure was measured in the esophagus with an esoph-ageal balloon and differential transformer manometer 1with subjects seated and leaning slightly forward (4).Although usually adjusted to record the difference be-tween esophageal and atmospheric pressure, transpul-monary pressure (differential pressure between esophagusand mouth) also could be observed (see Figure 1). Itwas assumed that the esophageal balloon recorded theinstantaneous average pressure over the outer surface ofboth lungs.
Respiratory volume was recorded with a sensitive spi-rometer 2 coupled to a potentiometer, the output of which,together with that of the esophageal pressure gauge, wasrecorded on a laboratory polygraph. The circuit (Figure1) consisted of a mouthpiece and low-resistance boxvalve (5) connected to the oxygen-filled spirometer, sothat during control observations all of the expired gaspassed through the soda-lime absorber. During hyper-ventilation an adjustment to the three-way stopcock, T1,deflected expired gas to the inspiratory line so that ex-pired gas was now partially rebreathed. By selection of adead space of appropriate size, overbreathing could beachieved without discomfort or faintness resulting fromhypocapnea. During resistance breathing the continuityof the circuit was restored, but stopcocks T1 and T2
1 No. 267B, Sanborn Company, Dover, Mass.2 Stead-Wells, Warren E. Collins, Inc., Boston, Mass.
971
MAURICEMcGREGORAND MARGARETR. BECKLAKE
TABLE I
Physical characteristics and respiratory function values *
Resistance
Subj. Sex Diagnosis Age Ht Wt MMF Mix. FRC VC Comp. In Out
yrs cm kg L/sec % L L L/cm cm H20/L/secH20
1 M Normal 39 175 73 3.84 74 4.58 4.22 0.17 1.77 2.292 M Normal 44 173 75 2.80 52 2.91 4.45 0.25 4.20 3.503 M Normal 34 178 73 3.48 77 3.35 5.30 0.28 2.97 4.204 M Normal 30 179 80 4.58 68 3.12 4.64 0.18 2.25 2.725 F Normal 28 160 53 4.70 50 2.45 2.92 0.13 0.91 0.96
6 M Emphysema 66 166 63 0.21 35 3.74 1.58 0.25 6.30 8.907 M Emphysema 49 159 47 0.15 35 5.92 1.47 0.20 11.80 19.808 M Emphysema 59 173 67 0.30 30 2.56 2.02 0.18 10.00 21.809 M Asthma 50 168 69 0.30 32 6.32 1.92 0.10 15.10 21.30
10 F Asthma 44 157 66 0.48 57 1.76 1.70 0.08 10.80 17.30
11 F MS 51 163 42 0.40 56 3.07 1.53 0.11 5.50 9.9212 F MS 31 161 67 2.60 0.05 9.18 20.1013 M MI 19 178 70 5.70 49 2.83 3.94 0.11 3.80 6.6014 F ASD 22 155 35 2.07 77 2.42 2.20 0.06 6.10 12.50
* MS = mitral stenosis;ASD = inter-atrial septal defect;Ml = mitral incompetence;MMF= maximal mid-expiratory flow (1);Mix. = mixing index (2);FRC = functional residual capacity (2); VC = vital capacity;Comp. = pulmonary compliance (3).
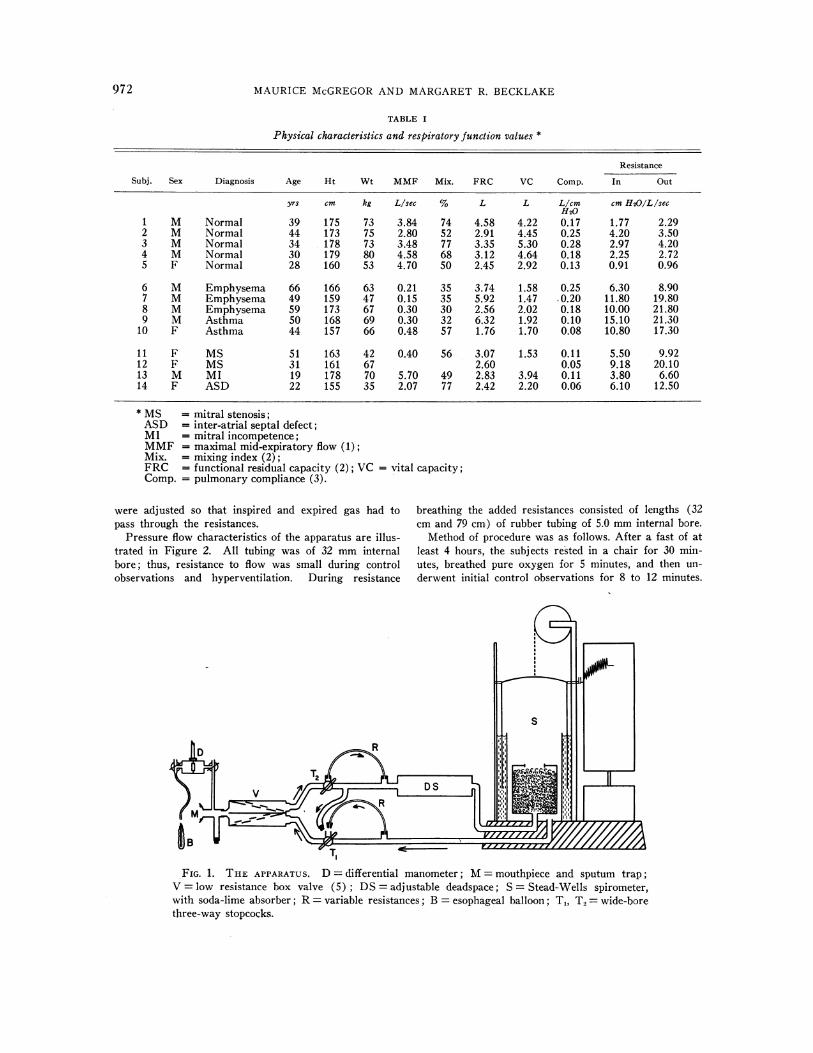
were adjusted so that inspired and expired gas had to breathing the added resistances consisted of lengths (32pass through the resistances. cm and 79 cm) of rubber tubing of 5.0 mminternal bore.
Pressure flow characteristics of the apparatus are illus- Method of procedure was as follows. After a fast of attrated in Figure 2. All tubing was of 32 mminternal least 4 hours, the subjects rested in a chair for 30 min-bore; thus, resistance to flow was small during control utes, breathed pure oxygen for 5 minutes, and then un-observations and hyperventilation. During resistance derwent initial control observations for 8 to 12 minutes.
FIG. 1. THE APPARATUS. D = differential manometer; M= mouthpiece and sputum trap;V = low resistance box valve (5); DS= adjustable deadspace; S = Stead-Wells spirometer,with soda-lime absorber; R= variable resistances; B = esophageal balloon; T1, T2 = wide-borethree-way stopcocks.
972

WORK, FORCEAND OXYGEN' COST OF RESPIRATION7
Thereafter, increased respiratory activity was initiatedin one of the two ways mentioned. For hyperventilationthe subject voluntarily increased his ventilation for 1 to3 minutes, the apparatus being adjusted for rebreathing.Continuity of the circuit was then restored and controlobservations again made for a further 8 to 12 minutes.Resistance breathing was likewise preceded and followedby periods of control observation. During the 1 to 3minutes during which the normal subj ects inspired andexpired through added resistances, they were instructedto use sufficient effort to maintain the ventilatory volumeat normal levels. Unlike the normal subjects it wasfound that none of the patients could tolerate resistancebreathing.
Oxygen consumption during control periods beforeand after the period of increased ventilatory activitywas derived from the slope of the spirometer tracing.The lines describing these slopes, although parallel, donot meet when projected through the period of increasedrespiratory work but are separated by a distance equiva-lent to the additional oxygen consumed by the increasedwork (6, 7). When the oxygen consumption of the sec-ond control period differs from the first, the lines describ-ing each are not parallel and the distance between themcan no longer be used to determine the increase of oxy-gen uptake during the period of increased respiratorywork. An arbitrary decision was made to exclude allstudies in which the control oxygen uptake values be-fore and after the period of increased respiratory ac-tivity differed by more than 20 ml per minute. Oxygenuptake values were expressed as STPD, lung volumemeasurements as APTS, and the breath volume usedfor computing the respiratory mechanical work was meas-ured at room temperature and pressure.
Mechanical respiratory work per breath was estimatedfrom the area of the loop which resulted from plotting in-stantaneous esophageal pressure and volume with the ad-dition of that portion of a triangle describing workagainst lung elastic forces which fell outside this loop.The base of the triangle describing the elastic forces wasplotted at the end-expiratory pressure level, not, as isusual, at atmospheric pressure. Because data are basedon diffcrcnces between control periods and periods of in-creased respiratory work, this method of plotting thepressure volume diagram seemed permissible and had theadvantage of avoiding the considerable error which mayresult when absolute levels of pleural pressure, as dis-tinct from respiratory fluctuation, are derived fromesophageal pressure measurements (3). The product ofthe average work for 6 to 12 breaths and the frequencygave the respiratory work expressed as kilogram-metersper minute.
The work thus measured, therefore, represents thework performed by the chest cage and diaphragm on thelung and its contents. It includes the work of the ab-dominal and other accessory muscles during increasedwork. It does not include the work of the respiratorymuscles on the chest cage itself and on the abdominalviscera.
The efficiency of this system was estimated by ex-
MHPRESSUREMOUTcm H2(
10(9(8(
t 7Tz 6(-514z 4(x 3w
-II
-21
z -40--44~-&1
a -61
I -81-91
-10(
1 2 3 4FLOW L./sec.
FIG. 2. PRESSURE FLOW RELATIONSHIPS FOR THE IN-
STRUMENTUNDER CONDITIONS OF USE. C = control ob-servations; DS= hyperventilation through deadspace;Rl, R. = resistance breathing. During expiration, Cand DS coincide.
pressing the increase in mechanical respiratory work, asdefined above, as a percentage of the energy equivalent(kilogram-meters per minute) of its increased oxygenconsumption.1
Respiratory force was defined as the force exerted, atany instant, by the chest and abdominal muscles on thelung surface, the area of which includes the diaphrag-matic and thoracic surfaces of both lungs, but not themediastinal surface. It was impossible to measure thisarea but, as a first approximation, it was assumed toequal the outer surface of a solid hemisphere equal involume to the functional residual capacity. Force perbreath was obtained by the product of the mean esopha-geal pressure per breath (as defined later) and thisarea. The resultant values depend too greatly uponapproximations to be accepted as defining with precision,in kilograms, the actual force exerted. However, in-ferences based on changes in these values rather than onthe values themselves are valid.
Esophageal pressure per breath was measured fromthe pressure curve. For this purpose it was assumed thatthe end-expiratory esophageal pressure was the result ofthe balanced elastic recoil of the chest and lung; changeof pressure from this value resulted from the application
3 A respiratory quotient of 0.8 was assumed.
0 g% IR
00-,0.10~0
O C-DS
0 D
0
.00
0-,0
OU1'R0
973

MAURICEMcGREGORAND MARGARETR. I3ECKLAKE
of force by the respiratory muscles. Change of esopha-geal pressure from this reference level (irrespective ofsign) was thus integrated against time for the wholebreath. It will be referred to subsequently as the"mean esophageal pressure" and it should be noted thatthis term does not refer to an arithmetical mean. Con-trol pressure values and work loops were derived fromthe average of 6 to 12 breaths in the two periods of rest-ing breathing before and after the period of increasedrespiratory activity. Values during increased respiratoryactivity were averaged from 6 to 12 breaths during eachof the 1 to 3 minutes of hyperventilation or resistancebreathing.
RESULTS
During resting ventilation the average respira-tory mechanical work performed by the patientswith lung disease was 2.7 times greater than thatperformed by normal subjects. The average valuefor the cardiac subjects was similar to that of thenormals. Values for respiratory force showed thesame trends with greater separation between thegroups (Table II).
During hyperventilation the normal and cardiacsubjects achieved greater increments of ventila-tion at a lower oxygen cost per liter ventilatedthan did the patients with lung disease. Averagevalues for normal and cardiac subjects were 2.23and 2.26 ml oxygen per liter ventilation, respec-
tively. The equivalent value for patients with lungdisease was 21.43 ml per L (Table III). These,with one exception, failed to double their restingventilatory level in spite of considerable effort.The oxygen cost per kilogram-meter respiratorymechanical work was, on the average, twice as
great in the patients with chest disease. Averageefficiency as defined for normal, cardiac and re-
spiratory subjects was 3.2, 3.4 and 1.6 per cent,respectively. When related to respiratory force,however, with the exception of Patient 6, the oxy-
gen cost per kilogram was similar in the threegroups.
Resistance breathing, which could only be per-
formed by the normal subjects, gave results whichwere strikingly different from those obtainedduring hyperventilation (Table IV). The oxygen
cost per kilogram-meter respiratory mechanicalwork was higher during resistance breathing(average efficiency 1 per cent). By contrast, thecost per kilogram respiratory force for this formof activity was lower.
When the data relating oxygen cost to respira-tory work for normal and cardiac subjects were
plotted (Figure 3A) it was apparent that theywere indistinguishable, falling in two distinctslopes for resistance breathing and hyperventila-
TABLE II
Average resting (control) observations *
f VT V R. force R. mech. workNo. of
Subj. Diagnosis obs. Mean SD Mean SD Mean SD Mean SD Mean SD
Llmin kg kg-m/min1 Normal 12 15.9 0.99 0.58 0.030 9.3 0.99 1.50 0.276 0.22 0.0342 Normal 12 12.5 0.42 0.95 0.246 11.6 1.92 1.76 0.667 0.54 0.2533 Normal 6 10.9 1.66 1.03 0.182 10.9 1.07 1.41 0.608 0.44 0.1234 Normal 6 14.6 0.79 0.77 0.047 11.2 1.01 1.55 0.110 0.35 0.0145 Normal 6 16.5 1.93 0.47 0.023 7.7 0.73 1.26 0.141 0.75 0.664
Mean 14.08 0.76 10.14 1.50 0.46
6 Emph. 2 20.0 0.40 8.0 5.60 0.717 Emph. 2 17.3 0.51 8.8 7.93 1.238 Emph. fib. 2 19.0 0.60 11.4 5.86 1.659 Asthma 4 16.0 0.58 0.68 0.095 12.0 1.09 10.80 0.024 1.66
10 Asthma 2 13.0 0.48 6.2 4.82 1.16
Mean 17.06 0.53 9.28 7.00 1.28
11 MS 2 14.0 0.53 7.4 3.27 0.5112 MS 2 12.0 0.60 7.2 2.94 0.4913 MI 2 24.0 0.48 11.5 1.74 0.4114 ASD 4 19.0 1.15 0.85 0.046 8.7 0.340 1.71 0.208 1.00
Mean 17.25 0.62 8.70 2.41 0.60
* f = Respiratory frequency; VT = tidal volume.
974

WORK, FORCEAND OXYGENCOST OF RESPIRATION
TABLE III
Changes in ventilation, oxygen uptake, respiratory mechanical work and respiratory force resultingfrom unobstructed hyperventilation in all subjects
Oxygen cost
A R. R. mech.Subj. Diagnosis f VT a V mech. work A R. force A Vo2 work R. force
Limin kg-mimin kg/min LImin ml 02/ ml 02/kg-m ml 02/kgL vent.
1 Normal 23 1.11 16.4 1.14 2.10 0.022 1.34 19.30 10.4821 1.59 22.3 2.77 3.68 0.035 1.57 12.64 9.5127 1.66 36.2 2.28 4.97 0.048 1.33 21.05 9.66
2 Normal 13 3.50 34.9 9.30 12.26 0.150 4.30 16.12 12.2318 2.83 36.0 21.34 17.47 0.200 5.55 9.37 11.45
120 0.70 71.6 55.96 31.00 0.313 4.40 5.59 10.10
3 Normal 14 0.52 21.6 1.61 4.34 0.047 2.18 29.19 10.8316 1.35 24.2 2.84 5.72 0.055 2.27 19.36 9.62
4 Normal 27 2.31 50.4 10.70 9.59 0.115 2.28 10.75 11.995 Normal 23 1.80 34.2 14.79 12.04 0.128 3.74 8.65 10.63
43 1.40 51.4 13.09 11.70 0.175 3.40 13.37 14.96
Mean 2.23 15.04 11.05
6 Emphysema 25 0.91 14.9 2.20 2.83 0.072 4.90 32.73 25.447 Emphysema 15 0.82 3.5 4.15 24.07 0.230 65.71 55.42 9.558 Emphysema 23 0.85 8.1 12.05 31.55 0.202 24.93 16.76 6.409 Asthma 40 0.69 16.6 4.56 13.68 0.158 9.52 34.65 11.55
42 0.57 10.0 6.63 24.58 0.197 19.70 29.71 8.0110 Asthma 25 1.00 19.0 5.82 5.27 0.073 3.84 12.54 13.85
Mean 21.43 30.47 12.47
11 MS 30 1.00 22.6 4.87 6.60 0.045 1.99 9.24 6.8212 MS 28 1.20 26.4 6.76 5.00 0.069 2.61 10.20 13.8013 MI 32 1.40 33.3 7.64 6.38 0.085 2.55 11.13 13.3214 ASD 46 1.12 43.0 3.08 6.33 0.081 1.88 26.30 12.80
Mean 2.26 14.22 11.69
TABLE IV
Changes in ventilation, oxygen uptake, respiratory mechanical work and respiratory forceresulting from resistance breathing in normal subjects
Oxygen cost
A R. mech. . R. mech.Subj. f VT A V work A R. force A V02 work R. force
L/min kg-mimin kg/min L/min ml 02/kg-m ml 02/kg1 15 0.71 2.2 2.08 13.10 0.070 33.65 5.34
17 0.80 4.4 2.43 29.03 0.131 53.90 4.5116 0.74 3.7 5.05 25.29 0.153 30.30 6.04
2 6 2.15 1.2 3.26 16.41 0.120 36.81 7.318 1.84 7.5 7.33 28.33 0.216 29.47 7.62
18 0.55 -4.1 7.89 31.80 0.304 38.53 9.56
3 10 0.80 -2.7 0.18 5.13 0.033 183.30 6.436 1.28 -4.2 1.10 10.97 0.065 59.09 5.93
4 20 0.70 3.7 6.57 26.95 0.139 21.16 5.1613 0.91 -0.2 5.21 28.68 0.150 28.79 5.23
5 12 0.66 -0.6 2.86 9.66 0.088 30.77 9.11
Mean 49.62 6.57
975

MAURICE McGREGORAND MARGARETR. BECKLAKE
0*35-
0 30-
0251
0-20-
015-
0*10-
005
R
nofIN
t ~~~~0-313 H
,U,
0/
(0
I / H
/
/
0
0 /
L/i2L/min.
0 5 10 15 2025 0 5 10 15 20 25 30 35a MECHANICALRESPIRATORY WORK A RESPIRATORY FORCE
KgM/min. Kg/min.
A B
FIG. 3. THE RELATIONSHIP OF OXYGENCOST TO RESPIRATORY MECHANICAL WORK (A) ANDTO AN INDEX OF RESPIRATORYFORCE (B). The regression equations are based on the data fornormal subjects. 0 = normal subjects during hyperventilation (H); 0 = patients with heartdisease during hyperventilation; =normal subjects during resistance breathing (R) ; * =
patients with obstructive lung disease during hyperventilation.
tion, respectively. The patients with obstructivelung disease, however, who in spite of attemptedhyperventilation could achieve little increase inventilatory volume, gave values comparable tothose of the normal subj ects performing resistancebreathing. When oxygen cost was plotted againstforce (Figure 3B) the normal and cardiac sub-jects were again comparable, although resistancebreathing was achieved at a lower cost than hyper-ventilation. The data for the patients with lungdisease were widely scattered.
DISCUSSION
A possible objection to the validity of thesemeasurements is that major changes in lung vol-ume during the period of increased respiratoryactivity would tend to alter the area of lung over
which pressure was being exerted, and henceproduce error in the computation of "force." Asjudged by shifts in the end-expiratory level ofthe spirometer tracing, however, these changeswere not great. During hyperventilation, normal
and cardiac subjects behaved similarly with an
average reduction of functional residual capacityof 260 ml (range, 100 to 500 ml). As might beexpected, the subjects with obstructive pulmonarydisease tended to trap air during hyperventilationwith an average increase of functional residualcapacity of 200 ml (range, - 100 to + 600 ml).During resistance breathing the end-expiratorylevel tended to change from breath to breath, theaverage change in functional residual capacity innormal subjects being an increase of 111 ml(range, - 400 to + 600 ml).
Previous estimations of the efficiency of respira-tion in normal subjects have shown considerablevariation, from as low as 1 per cent (6) to as
high as 25 per cent (8). Such discrepancies may
be due to differences in the methods of measure-
ment of oxygen cost and of respiratory mechani-cal work and to differences in the nature of in-creased respiratory activity.
In most previous studies the oxygen uptake hasbeen measured during prolonged periods (7 to 40minutes) of increased respiratory activity aimed
a V02L/min.
976

WORK, FORCEAND OXYGENCOST OF RESPIRATION
at achieving a steady state (8-10). Others, as inthe present study, have used short (1 to 3 min-utes) bursts of increased respiratory activity (6,7). The latter method makes possible the studyof much higher levels of respiratory work, andthere is no reason to believe the results are lessaccurate. Thus, the oxygen cost observed in thisstudy, when compared with ventilatory volume, iscomparable to the values obtained by steady statemethods for equivalent degrees of hyperventilation(9-11 ). Therefore, divergent values for efficiencyare unlikely to be due largely to differences inmeasuring the oxygen uptake-they are morelikely due to differences in the method of meas-urement of respiratory mechanical work.
The efficiency of the combined chest and lungfor external resistance work, assessed in threestudies (6, 7, 10), gave results of 1 to 10 per cent.In two studies (8, 9), respiratory mechanicalwork estimates during unobstructed hyperventila-tion were derived from the area of loops obtainedby plotting esophageal pressure against respira-tory volume, as in the present study. The valuesfor efficiency for hyperventilating normal subjectsobtained in the present study (average, 3.19 percent) agreed with those in one of these reports(9) but are well below those (19 to 25 per cent)reported in the other (8). A possible reason forthis discrepancy is the use of the supine postureby the latter workers. Mead and Gaensler (3)have reported that the esophageal pressure fluc-tuation may exceed the simultaneous pleural pres-sure by as much as 60 per cent in the supine posi-tion, an artifact which might lead to very con-siderable overestimation of the mechanical re-spiratory work.
Irrespective of the absolute values for efficiencyobtained in this study, however, it is clear thatwhen the same method is employed for estimatingefficiency during both hyperventilation and re-sistance breathing, the efficiency during the formeractivity is greater. It should be recalled, how-ever, that in the present study the efficiency of thechest as a whole has been considered. Mechanicalwork measured did not include that of moving thechest cage or the abdominal contents. For re-sistance breathing, during which resting ventila-tory levels were maintained, there would be nosignificant increase in the energy expended inmoving the chest and abdominal structures so that
the calculated efficiency would be unaffected.During hyperventilation, however, unmeasuredwork was performed on these structures, resultingin an underestimate of the efficiency of the respira-tory muscles. If this additional mechanical workcould be measured and included in the estimationof efficiency, the discrepancy between resistancebreathing and hyperventilation would be even fur-ther increased. Thus, in Figure 3A the resistanceplots would be unchanged, but those representinghyperventilation would be displaced further to theright.
Consideration of the data for respiratory force,however, is very different. This term likewisedescribed the force applied by the intact chest,diaphragm and abdominal muscles to the lung'ssurface. Force supplied by the respiratory musclesto the ribs and abdominal structures was not meas-ured. As before, this omission would not affectthe relationship of force to oxygen uptake duringresistance breathing, but would cause an under-estimate of the force exerted by the respiratorymuscles during hyperventilation.
If the force exerted by the respiratory muscleson the chest and abdominal structures could bemeasured and included, the line in Figure 3B de-scribing observations made during hyperventila-tion would be displaced to the right; that is,nearer to the line describing resistance breathing.In fact, it seemed possible that the discrepancy be-tween the regression equations describing re-sistance breathing and hyperventilation might bean index of the oxygen cost of moving the chestwall itself.
To check the validity of this hypothesis in Sub-ject 1, measurements were made of the complianceand resistance of the chest wall and lung bothseparately and together.4 From the instantaneousvolume and flow values, the pressure necessary todeflect the chest wall was computed from instantto instant and added with the appropriate sign tothe esophageal pressures recorded in the previousstudies. The resulting data for this subject areplotted in Figure 4. In Figure 4A, it can be seenagain that the oxygen cost of hyperventilation per
4 Chest wall compliance = 0.190 ml per cm H20; chestwall resistance = 0.6 cm per H2.O per L per second.Measurements were kindly made by Dr. Jere Mead atthe Harvard School of Public Health, by a techniquereported elsewhere (12).
977

MAURICEMcGREGORAND MARGARETR. BECKLAKE
A V02L/min.
S.TP ,, .10-
0 5 1O I1 20 25 30 0 5 10 15 20 25 30
A RESPIRATORY FORCE - Kg A RESPIRATORY FORCE(with correction) - Kg
BA
FIG. 4. A) THE RELATIONSHIP OF OXYGENCOST TO RESPIRATORYFORCEEXERTEDON THE LUNGIN SUBJECT 1. B) THE RELATIONSHIP OF OXYGENCOST TO RESPIRATORYFORCE EXERTEDON THELUNGWITH THE ADDITION OF THE ESTIMATED FORCEEXERTEDON THE CHEST WALL IN SUBJECT 1.0 = hyperventilation; 0 = resistance breathing.
unit force appears greater than that of resistancebreathing. With addition of the component offorce estimated to be necessary to move the chestwall, the slopes for resistance breathing and hy-perventilation cannot be distinguished (Figure4B).
This suggests that the relationship between oxy-gen cost and respiratory muscle force may be rep-resented by two slopes which will diverge accord-ing to the amount of force which is exerted againstthe chest and abdominal structures. In otherwords, the divergence between these slopes (Fig-ure 3B) may represent the additional energy costof moving the chest and abdominal structures dur-ing hyperventilation. No such explanation, how-ever, could account for the differences observed inoxygen cost per unit respiratory mechanical workfor the two forms of respiratory activity (Figure3A).
The observations made on patients with heartand lung disease are too few for any but tentativeconclusions. The oxygen cost of hyperventilationin the subjects with heart disease was indistin-guishable from that of normal subjects in spite ofthe fact that the cardiac subjects, although notseverely incapacitated, had detectable abnormali-
ties of lung mechanics (Table I). It is likely,however, that heart disease of sufficient severitymust result in a significant elevation of respiratoryoxygen cost, and Cournand and co-workers diddemonstrate this in a comparison of one normalsubject with one patient suffering from tight mitralstenosis (13). In the presence of obstructive lungdisease, however, the oxygen cost of hyperventila-tion was very high, due primarily to the highlevels of mechanical respiratory work necessaryfor the small ventilatory increase. It was also duein part to the fact that the oxygen cost per unitmechanical respiratory work was increased abovenormal. Low respiratory efficiency in emphy-sematous subjects has been reported previouslyby Cherniack (10) and is supported by the fig-ures of Fritts, Filler, Fishman and Cournand (9),although they did not consider the values to be"greatly different" from normal. There are twopossible reasons for the finding of a reduced me-chanical efficiency in these subjects. One is in-herent in the method by which mechanical workis computed, i.e., the product of esophageal pres-sure and volume of gas moved. High levels ofobstruction of the airway must result in reductionof the ratio of work measured to energy consumed.
978
I

WORK,FORCEAND OXYGENCOST OF RESPIRATION
As an extreme example, in maximal respiratoryeffort against a completely obstructed airway theoxygen consumption will be great, mechanicalwork measured nil, and efficiency, thus, zero.There is no reason, however, for the force meas-ured to fall off in this way even with complete air-way obstruction.
An alternative reason for the low mechanicalefficiency measured in the subjects with obstruc-tive lung disease is that their respiratory muscleswere acting at a mechanical disadvantage due tohyperinflation. Consideration of the force dataprovides some support for this (Figure 3B). Thesesubjects, while attempting hyperventilation, failedto increase their minute ventilation greatly in spiteof considerable effort (solid squares, Figure 3B),and were thus, in effect, performing "resistance"breathing. The oxygen cost per unit force, how-ever, was apparently higher in most instances thanthat of normal subjects breathing against increasedresistance. These findings indicate an increasedoxygen consumption per unit force developed andwould be consistent with the working of the re-spiratory muscles at mechanical disadvantage.
The present findings suggest that as a parameterfor comparison with energy consumption, force isa more meaningful expression than mechanicalwork. A similar conclusion has been reached forheart muscle. Thus, it has been shown that, al-though heart work augmented by the elevation ofarterial pressure consumes more oxygen than doeswork increased by augmenting venous return, theproduct of force developed and time appears torelate in a linear fashion to myocardial oxygenconsumption over a wide range (14-16) what-ever method is used to increase heart work.
Force may also relate more significantly thanmechanical work to other respiratory parameters.Marshall, Stone and Christie (17), comparing theonset of severe dyspnea in normal, emphysematousand mitral stenotic subjects, found that, althoughthe level of mechanical respiratory work at whichdyspnea became limiting differed greatly in thethree groups, exercise was curtailed by dyspneaat a comparable level of "respiratory force" in eachgroup. Furthermore, Mead (12) has recentlydemonstrated that respiratory depth and fre-quency vary, not according to the minimal respira-tory mechanical work necessary to secure alveolar
ventilation, but rather with the minimal respira-tory force.
Finally, it is clear that the high oxygen cost ofhyperventilation in obstructive lung disease is notonly due to increased work of breathing but alsoto an increased oxygen cost per unit work. Thisis unlikely to be an artifact in the measurement ofrespiratory work since the oxygen cost per unitforce is also high in these subjects.
SUMMARY
In five normal subjects the oxygen cost ofbreathing was measured during two forms of in-creased respiratory activity: unobstructed hyper-ventilation and breathing in the presence of a highairway resistance. Oxygen cost per unit mechani-cal respiratory work was greater for resistancebreathing than for hyperventilation. Inclusion ofthe work performed on the chest wall would haveincreased this anomaly.
By contrast, when related to an index of re-spiratory force, oxygen cost was higher for hyper-ventilation. When allowance was made for theforce necessary to deflect the chest wall in one sub-ject, the relationship between force and oxygencost was similar for both forms of respiratory ac-tivity. Thus, force appeared to be a more logicalparameter to compare with energy consumptionthan was mechanical work.
In four subjects with disturbances of respira-tory mechanics due to heart disease the oxygencost of hyperventilation was normal whether re-lated to ventilatory volume, respiratory mechani-cal work or respiratory force.
In five subjects with obstructive lung diseasethe oxygen cost of hyperventilation was high.This was due both to increased mechanical workper unit volume ventilated and to reduced effi-ciency per unit mechanical respiratory work.Since oxygen cost per unit force was also highit was likely that the low efficiency was the re-sult of the respiratory muscles' working at amechanical disadvantage.
ACKNOWLEDGMENTS
The authors gratefully acknowledge the very greattheoretical and practical assistance they have receivedduring this study in particular from Drs. Ronald V.Christie and Jere Mead. They gratefully acknowledgethe assistance of Dr. R. Kamener, Mrs. J. O'Dono-
979

MAURICEMcGREGORAND MARGARETR. BECKLAKE
van, Dr. R. Donevan, Dr. C. Varvis, Mrs. M. Pablo andMr. W. Fowler in the performance of these experimentsand of Dr. David V. Bates in the preparation of thismanuscript. Finally, the kind cooperation of their sub-jects in an uncomfortable experiment is most gratefullyacknowledged.
REFERENCES
1. Leuallen, E. C., and Fowler, W. S. Maximal mid-expiratory flow. Amer. Rev. Tuberc. 1955, 72,783.
2. Bates, D. V., and Christie, R. V. Intrapulmonarymixing of helium in health and in emphysema.Clin. Sci. 1950, 9, 17.
3. Mead, J., and Gaensler, E. A. Espohageal andpleural pressures in man, upright and supine. J.appl. Physiol. 1959, 14, 81.
4. Mead, J., and Whittenberger, J. L. Physical proper-ties of human lungs measured during spontaneousrespiration. J. appl. Physiol. 1953, 5, 779.
5. Theron, J. C., Zwi, S., and McGregor, M. A low-resistance respiratory valve. Lancet 1958, 1, 415.
6. Cain, C. C., and Otis, A. B. Some physiologicaleffects resulting from added resistance to respira-tion. J. Aviat. Med. 1949, 20, 149.
7. Bartlett, R. G., Jr., Brubach, H. F., and Specht, H.Oxygen cost of breathing. J. appl. Physiol. 1958,12, 413.
8. Milic-Emili, G., and Petit, J. M. Mechanical effi-ciency of breathing. J. appl. Physiol. 1960, 15,359.
9. Fritts, H. W., Jr., Filler, J., Fishman, A. P., andCournand, A. The efficiency of ventilation duringvoluntary hypernea: Studies in normal subjectsand in dyspneic patients with either chronic pul-monary emphysema or obesity. J. clin. Invest.1959, 38, 1339.
10. Cherniack, R. M. The oxygen consumption and effi-ciency of the respiratory muscles in health andemphysema. J. clin. Invest. 1959, 38, 494.
11. Murray, J. F. Oxygen cost of voluntary hyper-ventilation. J. appl. Physiol. 1959, 14, 187.
12. Mead, J. Control of respiratory frequency. J. appl.Physiol. 1960, 15, 325.
13. Cournand, A., Richards, D. W., Jr., Bader, R. A.,Bader, M. E., and Fishman, A. P. The oxygencost of breathing. Trans. Ass. Amer. Phycns 1954,67, 162.
14. Sarnoff, S. J., Braunwald, E., Welch, G. H., Jr.,Case, R. B., Stainsby, W. N., and Macruz, R.Hemodynamic determinants of oxygen consumptionof the heart with special reference to the tension-time index. Amer. J. Physiol. 1958, 192, 148.
15. Lendrum, B., Feinberg, H., and Katz, L. N. Iso-metric left ventricular contraction. Fed. Proc.1959, 18, 89.
16. Salisbury, P. F., and Bor, N. Hemodynamic deter-minants of cardiac energy transformation; theircorrelation with cardiac oxygen supply and withcoronary flow. Fed. Proc. 1959, 18, 134.
17. Marshall, R., Stone, R. W., and Christie, R. V. Therelationship of dyspnoea to respiratory effort innormal subjects, mitral stenosis and emphysema.Clin. Sci. 1954, 13, 625.
980