relationship of global dna methylation with cardiovascular
TRANSCRIPT

UNLV Theses, Dissertations, Professional Papers, and Capstones
8-1-2013
Relationship of Global DNA Methylation with Cardiovascular Relationship of Global DNA Methylation with Cardiovascular
Fitness and Body Composition Fitness and Body Composition
Michael Steele Jarrett University of Nevada, Las Vegas
Follow this and additional works at: https://digitalscholarship.unlv.edu/thesesdissertations
Part of the Cardiovascular Diseases Commons, Exercise Science Commons, and the Genetics
Commons
Repository Citation Repository Citation Jarrett, Michael Steele, "Relationship of Global DNA Methylation with Cardiovascular Fitness and Body Composition" (2013). UNLV Theses, Dissertations, Professional Papers, and Capstones. 1932. http://dx.doi.org/10.34917/4798003
This Thesis is protected by copyright and/or related rights. It has been brought to you by Digital Scholarship@UNLV with permission from the rights-holder(s). You are free to use this Thesis in any way that is permitted by the copyright and related rights legislation that applies to your use. For other uses you need to obtain permission from the rights-holder(s) directly, unless additional rights are indicated by a Creative Commons license in the record and/or on the work itself. This Thesis has been accepted for inclusion in UNLV Theses, Dissertations, Professional Papers, and Capstones by an authorized administrator of Digital Scholarship@UNLV. For more information, please contact [email protected].

RELATIONSHIP OF GLOBAL DNA METHYLATION WITH
CARDIOVASCULAR FITNESS AND BODY COMPOSITION
by
Michael Steele Jarrett
Bachelor of Science Lenoir-Rhyne University
2010
A thesis submitted in partial fulfillment of the requirements for the
Masters of Science - Exercise Physiology
Department of Kinesiology and Nutrition Sciences School of Allied Health Sciences
Division of Health Sciences The Graduate College
University of Nevada, Las Vegas August 2013

ii
I
THE GRADUATE COLLEGE
We recommend the thesis prepared under our supervision by
Michael Steele Jarrett
entitled
Relationship of Global DNA Methylation with Cardiovascular Fitness
and Body Composition
is approved in partial fulfillment of the requirements for the degree of
Master of Science - Exercise Physiology
Department of Kinesiology and Nutrition Sciences
James Navalta, Ph.D., Committee Chair
Richard Tandy, Ph.D., Committee Member
John Young, Ph.D., Committee Member
Daniel Young, D.P.T., Committee Member
Merrill Landers, Ph.D., Graduate College Representative
Kathryn Hausbeck Korgan, Ph.D., Interim Dean of the Graduate College
August 2013

iii
ABSTRACT
Relationship of Global DNA Methylation with Cardiovascular Fitness and
Body Composition
by
Michael Steele Jarrett
James Navalta, Examination Committee Chair Associate Professor of Kinesiology University of Nevada, Las Vegas
Background: Global DNA Methylation (GDM), an epigenomic modification has
been linked to the development of Cardiovascular Disease and its risk factors.
Purpose: The purpose of this study was to determine if there is a significant
correlation between GDM and cardiovascular fitness, as well as, measures of
body composition. Methodology: 26 apparently healthy, adults (11 males)
completed a physical activity and diet questionnaire, as well as, had a small
blood sample (600μL) collected via finger prick for the determination of GDM.
Body composition was assessed by means of a Dual-Energy X-ray
Absorptiometry (DEXA) scan, while cardiovascular fitness was evaluated by the
completion of a maximal exertion, graded exercise test (VO2max) on a treadmill.
Peasron’s “r” value was used to determine the correlation GDM and various
variables, while t-tests were used to determine if any differences between high
and low value groups for each variable existed. Results: Body Mass Index was
significantly correlated (p-value, r value; 0.031, -.556) with GDM while there was
a significant difference between high and low level folate groups (p=0.034) as
determined by the diet questionnaire. No significant correlations or differences

iv
were found in males. Conclusion: The results conclude that as BMI increases,
GDM decreases in females. In attempts to further investigate the relationships
between GDM and these variables, auxiliary research needs to be conducted
with larger subject pools containing additional sedentary participants.

v
ACKNOWLEDGEMENTS
It is with my deepest and most sincere gratitude that I thank my advisor Dr.
James Navalta for all of the guidance, advice, and assistance in the endeavor of
completing this thesis. I am a better researcher and physiologist for having had
the opportunity to work with him.
I would like to thank the participants of my study, without whom this
investigation would not have been completed. Additionally, I thank the Graduate
and Professional Student Association for their financial support and contributions.
Their support aided in the advancement of this study and was greatly
appreciated.
Let it be known that my greatest proponent and source of strength on this
journey is, and will always be, my wife, Erin Jarrett. Her willingness to not only
be my life-long companion, as well as, my co-researcher is a true testament of
her awesomeness. My love for her knows no bounds.
In closing, it is by the grace of God that I am here today and am blessed with
all of these individuals. Thank you, Lord, for your guidance and granting me the
strength, wisdom, and perseverance to complete this task. You are truly
amazing.

vi
TABLE OF CONTENTS
ABSTRACT .......................................................................................................... iii
ACKNOWLEDGEMENTS ..................................................................................... v
LIST OF TABLES ................................................................................................ vii
LIST OF FIGURES ............................................................................................. viii
CHAPTER 1 INTRODUCTION ............................................................................. 1 Purpose of the Study ................................................................................. 4 Research Hypotheses................................................................................ 4 Significance of the Study ........................................................................... 5 Definition of Terms ..................................................................................... 5
CHAPTER 2 REVIEW OF RELATED LITERATURE ............................................ 7 Epigenomic Markers .................................................................................. 7 DNA Methylation ........................................................................................ 8 Histone Modification ................................................................................ 10 Assistant Proteins .................................................................................... 11 DNA Methylation and Cardiovascular Disease ........................................ 13 DNA Methylation and Obesity .................................................................. 16 DNA Methlyation and Exercise ................................................................ 20
CHAPTER 3 METHODOLOGY .......................................................................... 24
Participant Characteristics ....................................................................... 24 Collection of the Data............................................................................... 24
Preliminary Data ............................................................................ 24 Graded Exercise Test ................................................................... 25 Blood Sample Collection ............................................................... 26 Blood Sample Analysis ................................................................. 27
Data Analysis Methods ............................................................................ 29 CHAPTER 4 RESULTS ...................................................................................... 30
Correlations ............................................................................................. 30 t-tests ....................................................................................................... 31
CHAPTER 5 SUMMARY, CONCLUSIONS, AND RECOMMENDATIONS ........ 33
Discussion of Results............................................................................... 33 Conclusions and Recommendations for Further Study ............................ 35
REFERENCES ................................................................................................... 38
VITA ................................................................................................................... 41

vii
LIST OF TABLES
Table 2.1 Summary of DNA Methylation and Disease Research ................... 16 Table 2.2 Summary of DNA Methylation and Obesity Research .................... 20 Table 2.3 Summary of DNA Methylation and Exercise Research................... 23 Table 3.1 Participant Characteristics .............................................................. 24 Table 4.1 Correlation Results ......................................................................... 31 Table 4.2 t-test Results ................................................................................... 32

viii
LIST OF FIGURES
Figure 2.1 DNA Methylation at CpG Dinucleotide ............................................. 8 Figure 2.2 CpG Methylation .............................................................................. 9 Figure 2.3 Histone Modification Causing Gene Silencing ............................... 10 Figure 2.4 Depiction of Various Assistant Proteins ......................................... 13 Figure 2.5 ATP10A Results ............................................................................ 19 Figure 2.6 CD44 Results ................................................................................ 19

1
CHAPTER 1
INTRODUCTION
The culmination of the Human Genome Project in 2003 caused a giant
expansion in the field of genomics research. It is understood that genomics is
the study of the 3 billion base pair long chain of genetic information known as the
genome. A multitude of research has investigated numerous aspects of the
genome and how it relates to the physical outcome or creation of a being.
Throughout this research, it has become apparent that other factors must interact
with or affect the genome in order to account for the mass variance in genomic
expression (Ordovas & Smith, 2010). It is this mindset that contributes to the
field of study known as epigenomics.
Epigenomics is the study of heritable alterations in gene expression potential
that are not caused by changes in the actual DNA sequence (Waterland, R. A.,
2009). These alterations to the genome result in differences to the future
outcome or expression of the genetic information, one possible reason why some
genes are recessive and others are dominant. To date, there are three main
mechanisms that are attributed to epigenomic alterations: 1) DNA methylation,
considered the primary measure, 2) histone modification, and 3) autoregulatory
proteins that add in modification (Waterland, R. A., 2009).
A plethora of research on the effects of DNA methylation on health issues and
outcomes has been conducted since the early 2000’s, with the majority of the
research focusing on links to cancer (Choi et al., 2009), (Das and Singal, 2004).

2
Nearly ten times more research has been published concerning DNA methylation
and cancer than the relationship of DNA methylation and cardiovascular disease
(31,306 articles vs 3,848 articles on PubMed respectively). More recent studies
such has the investigation conducted by Kim et al., 2010 are now turning their
attention to the connections between DNA methylation and cardiovascular
disease (CVD) with the possibility of creating a new biomarker for the detection
of CVD. Risk factors for CVD such as obesity, smoking, and nutritional status
have been investigated and were found to correlate with DNA methylation
(Ordovas and Smith, 2010). Breton et al (2009) noted that children that were
exposed to smoking prenatally, had significantly (p=0.03) lower methylation
levels at the AluYb8 gene. Similarly, Ong, Moreno, and Ross (2012) investigated
the multitude of research that examines the relationship between bioactive food
components (BFC), those components that have anticancer potential, and global
DNA methylation. A unanimous finding of global DNA hypomethylation was
noted in those that consumed the anticancer components (Ong, Moreno, and
Ross, 2012).
Not all risk factors for CVD have been investigated thoroughly however. The
amount of information concerning the relationship between physical inactivity
and/or exercise and DNA methylation is considerably less than that of other CVD
risk factors. Recent PubMed searches revealed 4,224 articles concerning “DNA
methylation and nutrition”, while only 2,764 articles were found dealing with “DNA
methylation and obesity” and a mere 1,235 articles that remotely related to “DNA

3
methylation and exercise”. With this in mind, it is imperative that research be
conducted on this relationship to determine whether it follows suit with obesity,
smoking, and nutritional status. More importantly, the results of this research
could aid in providing evidence to use DNA methylation as a biomarker for CVD
and its predecessors/risk factors.
4
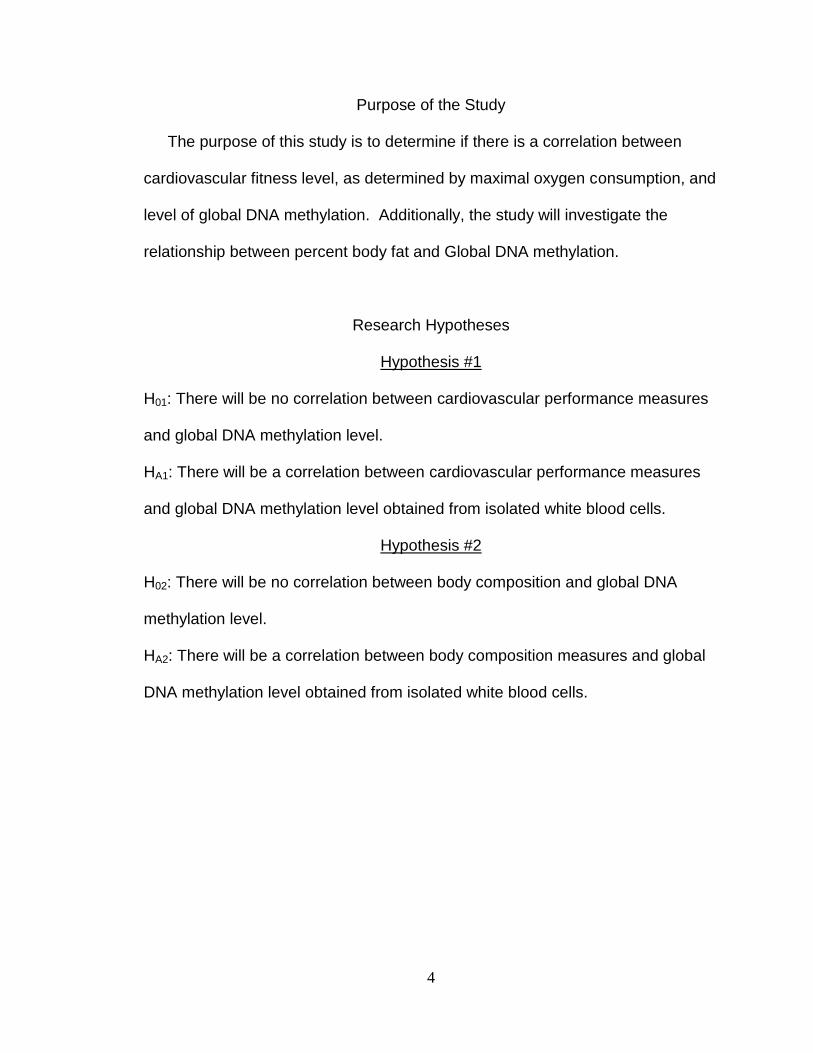
Purpose of the Study
The purpose of this study is to determine if there is a correlation between
cardiovascular fitness level, as determined by maximal oxygen consumption, and
level of global DNA methylation. Additionally, the study will investigate the
relationship between percent body fat and Global DNA methylation.
Research Hypotheses
Hypothesis #1
H01: There will be no correlation between cardiovascular performance measures
and global DNA methylation level.
HA1: There will be a correlation between cardiovascular performance measures
and global DNA methylation level obtained from isolated white blood cells.
Hypothesis #2
H02: There will be no correlation between body composition and global DNA
methylation level.
HA2: There will be a correlation between body composition measures and global
DNA methylation level obtained from isolated white blood cells.

5
Significance of the Study
The significance of this study lies in the possibility of finding a link between
cardiovascular fitness level, as well as body composition, and the biomarker
known as global DNA methylation. Finding a significant connection between
these variables will provide evidence and rational for using global DNA
methylation as a new quantitative risk factor for cardiovascular disease.
Definition of Terms
The following definitions are given for the purpose of clarification:
Cardiovascular Disease (CVD) – An umbrella term used to describe any health
issue concerning the heart, blood vessels, or cardiovascular system as a whole.
Includes but not limited to: myocardial infarction, cerebrovascular accident, and
hypertension.
CpG Island – The pairing of cytosine and guanine to form a dinucleotide. This
dinucleotide is a base pair in the formation of DNA.
DNA – Deoxyribonucleic Acid
DNA Methlyation – The addition of a methyl group to the 5 position of cytosine in
a CpG island.
Epigenome – Any factor that effects genetic expression without directly modifying
or altering the genome.
Genome – An organism’s complete set of DNA or hereditary information.
Genomics – The study of the genome as a whole.

6
Global DNA Methylation (GDM) – The amount of methylation across the entire
genome, expressed as a percentage.
VO2max – The maximal amount of oxygen that an individual and uptake and utilize
for energy production.

7
CHAPTER 2
REVIEW OF RELATED LITERATURE
As previously mentioned, the amount of published research concerning DNA
methylation and cardiovascular disease as well as its risk factors is relatively
small in size and scarce in quantity. Despite this fact, key relationships and
observations have been noted. The remainder of this review of literature will
focus on these findings including the different epigenomic markers, the
relationship between DNA methylation and cardiovascular disease, the link
between DNA methylation and obesity, and the influence of exercise on DNA
methylation.
Epigenomic Markers
There are three primary mechanisms that are responsible for epigenetic and
epigenomic modifications: 1) DNA methylation, considered the primary measure,
2) histone modification, and 3) autoregulatory proteins that add in modification
(Waterland, R. A., 2009). Most of the current literature on epigenomic
modification utilizes DNA methylation as the indictor of alteration. The rationale
for this is twofold: 1) DNA methylation is the easiest epigenomic modification to
test for on both a genetic and genomic level, 2) both histone modification and
autoregulatory proteins effect DNA methylations. This section of the literature
review will summarize how each epigenomic mechanism functions.

8
DNA Methylation
DNA methylation is the process in which a methyl group is added to a CpG
dinucleotide within the genome (see Figure 2.1).
Figure 2.1: DNA Methylation at CpG Dinucleotide (Kim et al., 2011)
This process is outlined in detail by Baccarelli & Ghosh (2012), beginning with
the actions of a cohort of enzymes known as the DNA methyl transferases
(DNMTS: DNMT1, DNMT3a, and DNMT3b). One of the DNA methyl transferase
enzymes interacts with S-adenosylethionine (SAM) and detaches a single methyl
group for it, converting SAM into S-adenosylhomocysteine (SAH) (see Figure
2.2). The free methyl group is then attached to the 5th position on a CpG
dinucleotide. This CpG dinucleotide is more commonly referred to as a CpG
island, and will be referred to as such for the remainder of this paper.

9
Figure 2.2 CpG Methylation Courtesy of Dr. Amr Sawlha, University of Michigan
Methylation can occur at any CpG island within the genome. The location of
the CpG island determines what effect the methyl group will have on the
genome. If the CpG island is located within a coding or promoter region of a
gene, then the transcription of that gene will most likely be repressed. This is
due to the fact that the methyl group interferes with the binding of transcription
factors. It should be noted that only 10% of all methylated CpG islands are
located within a coding region (Baccarelli & Ghosh, 2012)
It is unclear at this point in time why this process (methyaltion) takes place,
but studies have shown trends and relationships between methylation levels and
health complications including atherosclerosis and various forms of cancer
(Stauffer & DeSouza, 2010). Additionally, multiple stimuli (i.e. diet and habitual
activities) have been linked with abnormal (hyper or hypo) levels of methylation
(Stauffer & DeSouza, 2010). These trends and relationships will be discussed in
the latter portions of this paper.

10
Histone Modification
The second epigenomic mechanism is known as histone modification.
Histones are spool-like protein formations in which 146 base pairs of DNA are
wrapped around. There are comprised of 4 major proteins (H2A, H2B, H3, and
H4) and an unstructured N-terminal tail (Mazzio and Soliman, 2012). The main
function of a histone is to assist in packaging DNA into chromosomes by the
formation of nucleosomes (histones wrapped in DNA). Histones are modified
when one of six different actions (methylation, acetylations, phosphorylation,
ubiquitination, biotinylation, sumoylation, and proline isomerization) occurs on the
N-terminal tail. This modification to the tail is known as a histone mark. The
histone mark can cause gene repression or silencing by adjusting how “tightly”
the DNA strand is wound around the histone (see Figure 2.3).
Figure 2.3: Histone Modification Causing Gene Silencing Courtesy of the National Human Genome Research Institute

11
Assistant Proteins
The final major mechanism of epigenomics does not directly alter a genes
expression per se but does assist in the modification of that gene. There are
certain proteins that interact with the chromatins and nucleosoms, causing
structural alterations that either allow or deny further DNA methylation or histone
modification. There are three primary categories of assistant proteins: 1)
chromatin remodeling complexes, 2) effector proteins with various binding
modules for different modifications, and 3) insulator proteins (Kim,
Samaranayake, & Pradhan, 2009). The complete explanation and discussion of
the assistant protein is outside the scope of this paper. The following is a brief
explanation of the three primary types of assistant proteins and how their
functions contribute to epigenomic modification.
The primary function of chromatin remodeling complexes are to grant access
to certain regions of DNA or histones by the use of nucleosomal repositioning,
histone-DNA interactions, and histone octamer positioning (Kim, Samaranayake,
& Pradhan, 2009). Chromatin remodeling complexes are unique in that they
require ATP to accomplish their function. In the diagram below (Figure 2.4, A), a
chromatin remodeling complex is altering the position of a nucleosome through
an energy-driven reaction. The resulting repositioning allows access to a specific
DNA location that was previously hidden to epigenetic modifiers.
Effector proteins can assist chromatin remodeling complexes in the
repositioning of histones and chromatins. Additionally, effector proteins can
serve as a marker for chromatin-modifying enzymes or remodeling complexes

12
(Kim, Samaranayake, & Pradhan, 2009). Marking the histone or chromatin in
this way can cause additional modification enzymes that would normally not
affect the area, to bind to the area and cause alterations. Figure 2.4B
demonstrates this mechanism by using the example of effector protein HP1.
Normally, the enzymes DNMT and SUV39H1 would not affect the histones, but
HP1 has marked the location and is serving as an adaptor to allow DNMT and
SUV39H1 to attach. This allows DNMT and SUV39H1 to modify the histones,
increasing the amount of methylation.
Insulators are the final category of assistant proteins and are DNA elements
that serve as boundary markers on throughout the genome. These markers
segregate genes in order to prevent incorrect or unwanted repression or
activation of genes. As depicted in Figure 2.4C, the insulator (I) can act as an
enhancer blocking, preventing the activation of a promoter by the hindering the
access of an enhancer (E). Additionally, insulators (I) can block off entire
chromatins and act as a barrier that prevents methylation from neighboring
chromatins. (Kim, Samaranayake, & Pradhan, 2009)

13
Figure 2.4: Depiction of various assistant proteins. Courtesy of Kim, Samaranayake, & Pradhan (2009)
DNA Methylation and Cardiovascular Disease
With an understanding of the significance of DNA methylation in mind, it is
imperative its link with disease be both evaluated and clearly understood.
Initially, most of the research in DNA methylation patterns was geared towards
cancer and tumor development while more recent research has been focused on
DNA methylation and cardiovascular disease risk and development. As with
most research, animal models were used initially to determine if research on the
topic was necessary. Lund and associates used a rodent model in 2004 to
evaluate DNA methylation patterns in mice lacking apolipoprotein E (apoE-)
versus their control counterparts (Lund et al., 2004). The apoE– group was

14
predisposed to developing atherosclerosis while the control group consisted of
normal mice. Both groups were monitored for six months, with blood and aorta
tissue sample collected at four weeks and again at six months. All samples were
evaluated for global DNA methylation using a DNA fingerprinting technique. At
the four week time point, blood analysis did not reveal any significant difference
in DNA methylation patterns between the two groups. However, aorta tissue
sample in the apoE- mice were found to have significantly different (p<0.04)
methylation patterns compared to the control group. These patterns consisted of
both hyper and hypomethylation. Samples were taken again after 6 months of
observation. Both the blood and aorta tissue samples revealed a significant
difference (p<0.02, p<0.003 respectively) when comparing the apoE- group and
the control group. Again, the revealed patterns were of hyper and
hypomethylation levels in the apoE- group. Additionally, fibrocellular lesions were
found in the apoE- group, suggesting the development of atherosclerosis. While
the results were somewhat inconclusive in how atherosclerosis causes a
modification in global DNA methylation, they do offer the conclusion that global
DNA methylation is significantly altered with the development of atherosclerosis.
(Lund et al., 2004)
Similar, yet more conclusive findings were brought about by a study
conducted by Stenvinkel et al (2007), in a human model similar to the mouse
model used by Lund et al (2004). Stenvinkel and associates investigated the
association between DNA methylation and cardiovascular disease development
in chronic kidney disease (CKD) patients and disease-free control group. CKD

15
patients were chosen as the experimental group due to their increased risk of
developing cardiovascular disease. Both CKD (n = 155) and control (n = 36)
groups were evaluated for global DNA methylation by blood sample as well as
signs of cardiovascular disease (inflammation and oxidative stress biomarkers)
for 36 months. The global DNA methylation levels of CKD patients (n=62) that
developed chronic inflammation (determined by IL-6 and C-reactive protein
levels) were compared to those of the control group. It was found that the CKD
patients with inflammation had significantly (p<0.001) increased levels of
methylation. It is noted that the CKD patients that did not present with
inflammation had methylation levels similar to the control group. These results
indicate that those patients that were developing cardiovascular disease
presented elevated global DNA methylation levels, leading the authors to
suggest that cardiovascular disease is associated with hypermethylation at the
genomic level (Stenvinkel et al., 2007).
While the above mentioned study used a similar model with a control group,
Kim and associates published comparable results with a population based study
in 2010. Kim et al (2010) evaluated the global DNA methylation and
cardiovascular disease status of 286 males and females out of a 63,257
population based cohort in Singapore over 5 years. The subjects presented at
baseline for blood draws and cardiovascular disease and disease risk evaluation.
Out of the 286 subjects, 101 present with cardiovascular disease at baseline. All
subjects reported back for a follow-up visit 5 years later. From the remaining 185
subjects, 52 presented cardiovascular disease at the second visit. All subjects

16
with cardiovascular disease (n = 153) were compared to remaining disease-free
subjects (n = 133) on the basis of global DNA methylation levels. The results did
not show a significant difference for the population as a whole but was further
separated by gender, revealing significant results. Males that presented with
cardiovascular disease had significantly (p <0.05) elevated global DNA
methylation levels compared to their disease-free counterparts, while females
were not significantly different. These finding were in agreement with Stenvinkel
et al (2007). (Kim et al., 2010)
Table 2.1 Summary of DNA Methylation and Disease Research
Article Subjects Dependent
Variable Independent
Variable/s Results
Lund et al. (2004)
n=27 mice GDM Prevalence of
atherosclerosis ↑ GDM
Stenvinkel
et al. (2007)
n=191 males & females
GDM Inflammation measured by
IL-6 and C
↑ GDM in patients with inflammation
Kim et al. (2010)
n=286 males & females
GDM CVD ↑ GDM in CVD
patients
GDM – Global DNA Methylation, CVD – Cardiovascular Disease
DNA Methylation and Obesity
At this point in time, global DNA methylation seems to be closely correlated
obesity as calculated by body mass index (BMI) or an individual’s weight in
kilograms divided by their height in meters squared (Kim et al., 2010). Upon the
examination of 286 men and women from Singapore, it was found that those with

17
a BMI value of 24 kg/m2 or higher had significantly (p = 0.007) elevated levels of
global DNA methylation compared to those with a BMI value lower than 24 kg/m2.
These results are in agreement with data collected by both Wang et al (2010)
and Milagro et al (2012) in which the methylation status of individual genes were
examined. Wang et al (2010) found obese (BMI > 30 kg/m2) individuals
displayed significantly (p = 0.008) higher methylation levels in the Ubiquitin-
Associated and SH3 domain-containing protein A (UBASH3A) gene compared to
non obese individuals. Likewise, Milagro et al (2012) found that
overweight/obese individual had elevated methylation levels of the circadian
clock system (internal clock) gene, CLOCK 1, compared to lean individuals
(17.4% compared to 12.4% respectively).
Though evidence displayed above gives insight to the relationship between
obesity and DNA methylation levels, it does not take individual’s percentage of
fat mass into consideration. All three of the aforementioned studies used BMI as
their stratification tool for obesity, there by not actually measuring the amount of
fat mass or fat-free mass. One study conducted by Fermin et al (2011) did go a
step further than BMI and measured body composition by means of bioelectric
impedance analysis. Fermin et al (2011) set out to determine whether or not
methylation levels of nine obesity-related genes (AQP9, ATP10A, CD44, IFNG,
MEG3, NTF3, POR, TNFRS9, and WT1) could be used to predict weight loss
and body composition responses to a hypocaloric diet. The study was conducted
on twenty-five (n=25) overweight or obese (BMI M (SD): 30.5 (0.45) kg/m2)) men.
Anthropomorphic measurements (Height, weight, age, percent body fat, and

18
waist girth) and blood samples were taken prior to and following an eight week
hypocaloric diet. DNA methylation levels were measured in peripheral blood
mononuclear cells obtained by the blood samples. Two (ATP10A and CD44) out
of the nine genes studied were found to be significantly related with the loss of fat
mass, the amount of weight lost and changes in waist girth. Figure 2.5 presents
the relative data on the relationship between the methylation levels of CpG
islands within the ATP10A gene and weight loss, changes in fat mass, and
changes in waist girth. Similarly, Figure 2.6 discusses the significance changes
of the same factors in relation to methylation levels at CpG islands within the
CD44 gene. These results allude to two relative concepts: 1) DNA methylation at
a genetic level is significantly correlated with changes in fat mass, over-all
weight, and changes in waist girth 2) DNA methylation (ATP10A and CD44
genes specifically) could be used to predict an individual’s degree of response to
a hypocaloric diet.
While Fermin et al (2011) did not specifically investigate GDM alteration with
weight or fat loss, their data does coincide with the aforementioned studies (Kim
et al., (2010); Wang et al., (2010); and Milagro et al., (2012)) in that it
demonstrates a relationship between DNA methylation and obesity. Additionally,
it supports the notice of using DNA methylation as a predictor of CVD risk factors
and responses to lifestyle alterations.

19
Figure 2.5: ATP10A Results Relationships between baseline methylation levels of CpG Islands within the ATP10A gene and weight loss, fat mass change, BMI change and waist girth change. (Fermin et al., 2011)
Figure 2.6: CD44 Results Relationships between baseline methylation levels of CpG Islands within the CD44 gene and weight loss, fat mass change, BMI change and waist girth change. (Fermin et al., 2011)

20
Table 2.2 Summary of DNA Methylation and Obesity Research
Article Subjects Dependent
Variable Independent
Variable/s Results
Kim et al.
(2010)
n=286 males & females
GDM BMI ↑ GDM in obese
individuals
Wang et
al. (2010)
n=92 males & females
UBASH3A gene methylation
BMI ↑ Methylation in
obese individuals
Milagro et al.
(2012)
n=60 females
CLOCK 1Gene Methylation
BMI ↑ Methylation in
obese individuals
Fermin et al.
(2011)
n=25 males
Methylation levels of 9
obesity –related genes
BMI changes with
hypocaloric diet
CD44 and ATP10A are related with ↓ in
weight/fat mass/waist girth
BMI – Body Mass Index, GDM – Global DNA Methylation
DNA Methlyation and Exercise
The relationship between DNA methlyation and exercise has not been
examined in great detail. Recent database searches have yielded minimal
findings, resulting in only a hand full of articles pertaining to the topic.
Additionally, the available findings are contradictory with reports of both
increasing and decreasing in methylation levels.
One study conducted by Zhang et al (2011) examined the relationship
between physical activity levels of cancer-free adults (ages 45-75 years old) and

21
their global DNA methylation level. Participants gave a baseline blood sample at
the beginning of the study and wore accelerometers for 4 days (3 weekdays and
1 weekend day) to determine their level of physical activity. It was observed that
individuals that were physically active for 26-30 minutes per day had significantly
higher levels of global DNA methlyation compared to those who were active for
less than 10 minutes per day (β = 2.52, 95% CI: 0.70, 4.35). Simple linear
regression failed to be significant, negating the idea of a dose-response
relationship between the two variables. These findings suggest that individuals
that achieve the recommended amount of physical activity per day are
hypermethylated compared to sedentary individuals. (Zhang et al., 2011)
While the above mentioned study demonstrated an elevated level of
methylation on a genomic level, results from Barres and associates revealed
differences on a genomic as well as a genetic or per gene basis. Barres et al
(2012) examined the acute effects of a single bout of exercise on DNA
methylation levels in healthy, sedentary men and women (n=14). Blood samples
were taken before and after a peak pulmonary oxygen uptake rate test on a
magnetically braked cycle ergometer. The results of a paired t-test showed a
significant (p < 0.05) decrease in global DNA methylation after the exercise bout.
Additionally, individual genes associated with metabolic and structural functions
in skeletal muscles (PGC-1a, TFAM, PPAR-d, PDK4, citrate synthase [CS]) were
examined and found to have decreased methylation levels following the cycle
test. These results seem to contradict the hypermethylation findings of Zhang et
al (2011).

22
To further investigate the effects of acute exercise on DNA methylation,
Barres et al (2012) looked at a subgroup (n=8) of the original 14 participants and
had them complete two additional exercise sessions in the following days after
the VO2max tests. The additional exercise sessions were completed on separate
days with at least one week in between the trails. Each exercise session was
conducted on the same cycle ergometer and was at varying intensities (40% or
80% of aerobic capacity). Blood samples after each exercise session were
evaluated for changes in DNA methylation of the previously mentioned genes. It
was found that the low intensity (40% aerobic capacity) exercise did not alter
methylation levels compared to resting values, while high intensity (80% aerobic
capacity) exercise decreased methylation values (p < 0.05). These results are
again contradictory to Zhang et al (2011) and suggest that a dose response
relationship may exist between exercise and gene methylation levels. (Barres et
al., 2012)
Though global DNA methylation was not measured, Nakajima et al (2009)
does add to the research compendium by displaying earlier findings of exercise
inducing hypermethylation of the ASC (Apoptosis-associated Speck-like protein
containing a Caspase recruitment domain) gene in older men. The research
group set out to evaluate the effects of chronic exercise on the methylation levels
of the ASC gene that is responsible for the production of pro-inflammatory
cytokines. A total of 383 older (40-87 years of age) males were divided into
either and exercise (n = 230) or a control (n = 153) group. The exercise group
completed bouts of high-intensity interval walking (3 minutes of 40% peak

23
aerobic capacity followed immediately by 3 minutes of walking at 70% peak
aerobic capacity) every day for 6 months. Blood samples were taken at the
completion of the 6 months and tested for methylation of the ASC gene. The
exercise group had significantly (p<0.01) higher methylation values for the ASC
gene compared to the control group. This lead to the researchers to conclude
that exercise induces hypermethylation of the ASC gene in older males, thereby
decreasing the production of pro-inflammatory cytokines. (Nakajima et al., 2009)
Table 2.3 Summary of DNA Methylation and Exercise Research
Article Subjects Dependent
Variable Independent
Variable/s Results
Zhang et al (2011)
n=161 males
females GDM
4 day physical activity level
↑ GDM
Barres et al (2012)
n=14 males & females
GDM, PGC-1a, TFAM, PPAR-d,
PDK4, and citrate synthase
methylation
Exercise (peak pulmonary oxygen
uptake test)
↓Methylation of all
measurements
Barres et al (2012)
n=8 males
PGC-1a, TFAM, PPAR-d, PDK4,
and citrate synthase
methylation
Excise Intensity (40% and 70% aerobic max)
↓Methylation with ↑exercise
intensity
Nakajima
et al (2009)
n=383 males
ASC Gene Methylation
6 month walking program
↑ ASC Methylation
GDM – Global DNA Methylation

24
CHAPTER 3
METHODS
Participant characteristics
Participants were apparently healthy male and female adults between the
ages of 21-39 years old (n=26). Apparently healthy was defined as receiving a
passing score on the Modified American College of Sports Medicine
Health/Fitness Facility Pre-participation Screening Questionnaire.
Table 3.1 Participant Characteristics Males Females
N 11 15
Height (cm) 175.7 ± 7.8
163.9 ± 6.3
Weight (kg) 85.0 ± 15.4 60.0 ±
7.6
Age (years) 25.6 ± 5.2 26.8 ±
4.8
BMI 27.4 ± 3.6
22.3 ± 2.2
Body Fat (%) 20.0 ± 6.2 26.0 ±
7.5
Collection of the Data
Preliminary Data
Prior to the visit, participants were instructed to wear appropriate fitness
clothing (i.e. running shoes, lose shirt, and shorts), to be well hydrated and to not
consume any substance with calories 2 hour prior to their visit. Additionally, the

25
participants had been instructed to refrain from consuming alcohol and from
exercising for at least 6 and 24 hours prior to their test respectively.
Upon arrival to the Exercise Physiology Laboratory, the participants were fully
informed about the purpose, requirements, procedures, risks, and benefits of the
study and were asked to sign an informed consent document that had been
approved by the UNLV Institutional Review Board (Protocol #: 1209-4268). The
participants then completed the Modified American College of Sports Medicine
Health/Fitness Facility Pre-participation Screening Questionnaire. Participants
were permitted to continue the study only if they received a passing score on the
health questionnaire. Afterwards, each participant was assigned a subject
identification number and basic anthropomorphic measurements were taken
including height, weight, age, and body composition as determined by dual
energy x-ray absorptiometry. In order to control for the effects of diet and
lifestyle choices on methylation levels, each subject completed a food frequency
questionnaire dealing with folate-rich foods as well as a physical activity
questionnaire.
Graded Exercise Test
Participants completed a graded exercise test (GXT). The GXT was
conducted on a treadmill using two minute stages. The participants walked at a
self-selected speed with no incline for two minutes, followed by jogging for two
minutes at a self-selected speed with no incline. The incline of the treadmill was
increase by 2% grade every two minutes while remaining at the same jogging
speed, until volitional fatigue. Before beginning the GXT, the participants were

26
instructed on how to use the Borg Ratings of Perceived Exertion scale (RPE).
The GXT was terminated when the participant could no longer continue or if the
participants wished to stop. Heart rate and oxygen uptake were measured
continuously throughout the test by a Moxus Metabolic System (AEI
Technologies, Pittsburgh, PA). The participant’s RPE score was evaluated at the
end of every stage. Participants’ VO2max values were determined by averaging
the two highest, consecutive values in a 30 second rolling average of VO2
(ml/kg/min). The time period used for the rolling average was defined as the
period in which the participant had achieved two of the following criteria: heart
rate ≥ 90% of their age predicted max, a respiratory exchange ratio at or above
1.05, an RPE ≥ 19, or their VO2 (ml/kg/min) value had plateaued despite an
increase in exercise intensity.
Blood Sample Collection
Upon completion of the informed consent and health screening questionnaire,
a sample of blood (600 µl) was obtained from the participant via finger-stick using
antiseptic technique into an anticoagulant tube (Multivette 600 LH, Sarstedt,
Fisher Scientific, Pittsburgh, PA). The blood draw site was cleaned with an
alcohol swab prior to all blood draws. Samples were labeled with corresponding
subject identification numbers before being placed in a sealed and labeled
biohazard bag (primary container) inside of a sealed and labeled biohazard
cooler (secondary container). Samples were kept in an ice bath until they were
analyzed in accordance with the parameters described in the University of
Nevada, Las Vegas Institutional Biosafety Manual (Section VIII, page 19).

27
Standard biological personal safety barriers including latex-free gloves,
laboratory coat, and eye safety goggles were worn at all times by research team
members. All sharps and biological material were disposed of in a labeled and
sealed sharps container and decontamination was conducted in accordance with
the University of Nevada, Las Vegas Institutional Biosafety Manual (Section IX,
page 23).
Blood Sample Analysis
Each sample was transported to the Exercise Biochemistry Laboratory for
DNA isolation and storage. Whole blood (approximately 400 microliters) was
added to 1000 microliters of Cell Lysis Solution, thoroughly mixed, and incubated
for 10 minutes at room temperature. The sample was then centrifuged, and the
supernatant was discarded without disturbing the white blood cell pellet. The
cells were then re-suspended via vigorous vortexing and 400 microliters Nuclei
Lysis Solution was added and incubated at 37ºC for 15-minutes. After allowing
the sample to cool to room temperature, 110 microliters of Protein Precipitation
Solution was added, vortexed, and then centrifuged. A dark brown protein pellet
was visible at the bottom of the tube, and the remaining supernatant was
transferred to a new microcentrifuge tube containing 300 microliters isopropanol.
This tube was gently mixed and then centrifuged to pellet the DNA. The
supernatant was discarded in a biohazard waste container, and equal volume of
70% ethanol was added in a wash step before centrifugation. The tube was
inverted over absorbent paper and allowed to air-dry for 15 minutes. DNA
Rehydration Solution (20-100 L) was added to the tube and allowed to incubate

28
overnight at room temperature before being stored at 2-8 ºC for subsequent
epigenetic analysis. DNA concentration (ng/mL) was determined using an Epoch
microplate reader with the Take3 System (Biotek U.S., Winooski, VT)
Once all samples had been collected and purified using the process outlined
above, the determination of global DNA methylation was achieved by the use of
a commercially available assay kit (MethyFlash Methaylated DNA Quantification
Kit, Epigentek Group Inc., Farmingdale, NY). A binding solution, followed by the
samples was added to an antibody-infused 96 well plate. Negative and positive
controls, as well as diluted positive values were added alongside the samples
and tested in order to produce a standard curve for quantification proposes. The
samples were allowed to incubate for 90 minutes inside the wells. Afterwards,
the samples were removed, the wells were washed with a wash buffer, and a
capture antibody was added to each well. The plate then incubated again for 60
minutes, at which time the solution was removed and a washer buffer was used
again to clean the wells. Following the second washing, a detection antibody
was added and allowed to incubate for 30 minutes. A third wash step took place
after the 30 minutes. An enhancer solution was then added to each well and a
final 30 minute incubation phase was conducted. A final wash step occurred
followed by the addition of the developer solution, which turned the sample a
bluish tint depending on the methylation level. Finally, a stop solution was added
before the 96 well plate was placed in a plate reader and read at 450 nm. All
samples were processed at the same time and global DNA methylation levels

29
were expressed as an absolute percentage based on the determined standard
curve. The formulas used are given below.
S is the concentration of sample DNA used in nano grams.
Data Analysis Methods
A Pearson product-moment correlation coefficient (Pearson’s “r”) was used to
determine the correlations between body composition, fitness measurements,
and GDM percentage. A series of t-tests were further conducted to determine
any underlying differences. High and low value groups from each variable were
constructed and compared for significant differences. The groups will be
determined by whether they are higher or lower than the median for each
variable. The significance level was set at α = 0.05. All statistical analyses were
calculated using SPSS Version 20 (IBM Corporation, Armonk, NY).
30
CHAPTER 4
RESULTS
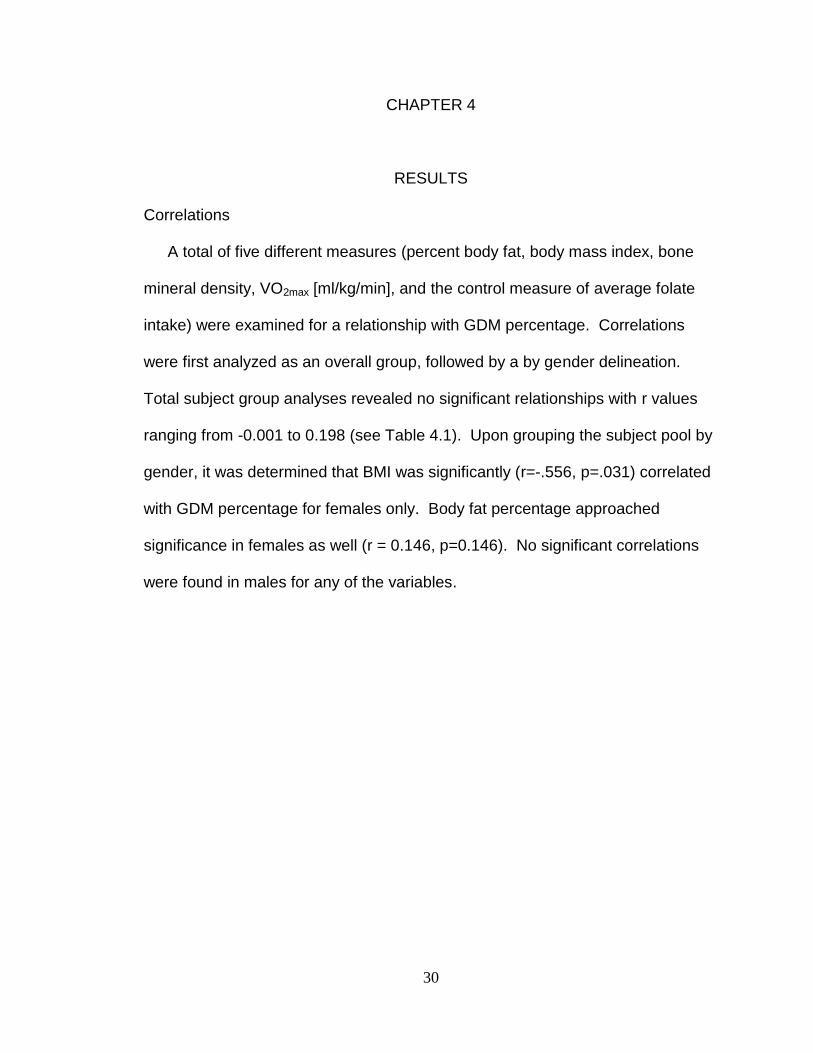
Correlations
A total of five different measures (percent body fat, body mass index, bone
mineral density, VO2max [ml/kg/min], and the control measure of average folate
intake) were examined for a relationship with GDM percentage. Correlations
were first analyzed as an overall group, followed by a by gender delineation.
Total subject group analyses revealed no significant relationships with r values
ranging from -0.001 to 0.198 (see Table 4.1). Upon grouping the subject pool by
gender, it was determined that BMI was significantly (r=-.556, p=.031) correlated
with GDM percentage for females only. Body fat percentage approached
significance in females as well (r = 0.146, p=0.146). No significant correlations
were found in males for any of the variables.

31
Table 4.1 Correlation Results
Pearson's r p-value
Total Group
Body Fat -0.173 0.397
BMI -0.198 0.332
BMD 0.0 0.874
VO2max 0.0 0.995
Folate 0.198 0.331
Males
Body Fat 0.101 0.767
BMI 0.258 0.444
BMD 0.371 0.262
VO2max -0.253 0.452
Folate 0.323 0.333
Females
Body Fat -0.394 0.146
BMI -0.556 0.031*
BMD 0.038 0.894
VO2max 0.178 0.526
Folate 0.218 0.434
*BMI was significantly correlated to GDM in Females.
t-tests
To further investigate the possibility of a relationship between GDM
percentage and the aforementioned variables, t-tests were conducted for
potential differences between high scores verses lower values for any given
variable. The median values for percentage of body fat (21.45%), body mass
index (24.02 kg/m2), bone mineral density (1.195g/cm2), VO2max (52.225
ml/kg/min), and average folate intake were determined (237.2 µg/day) and
subjects were grouped according to whether they were higher or lower than the
median value for each variable. The t-tests revealed a significant difference in
the percentage of GDM between those with higher levels of folate intake
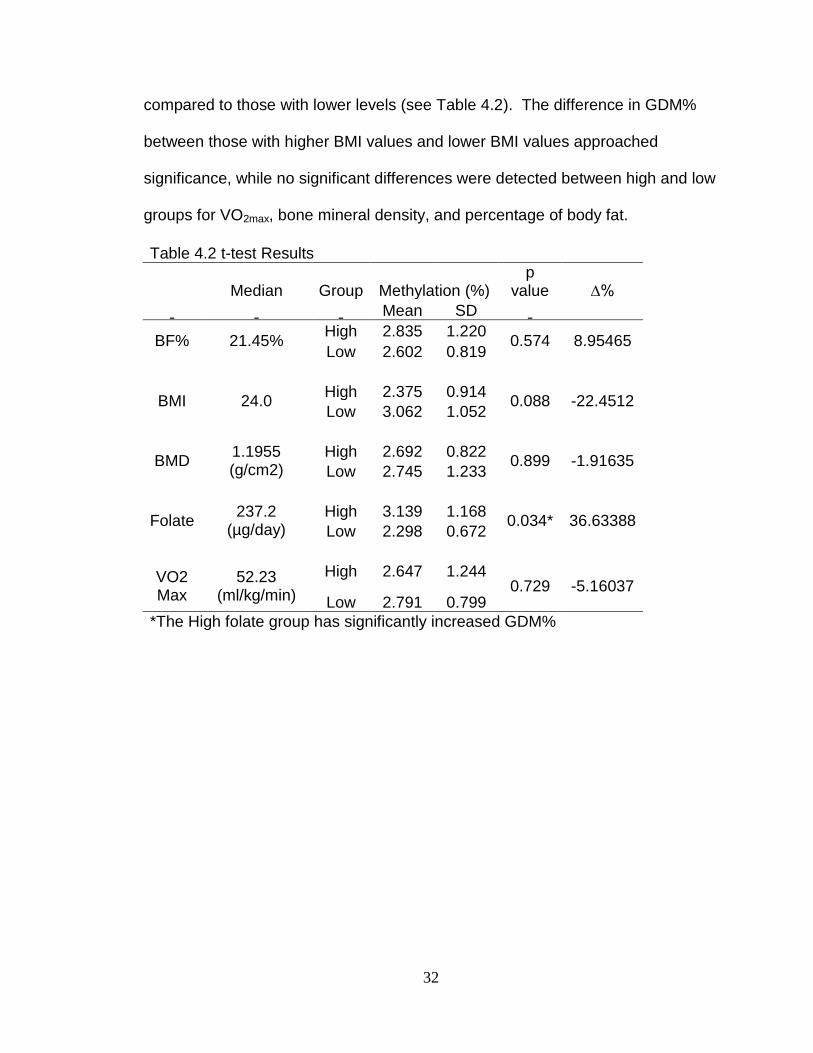
32
compared to those with lower levels (see Table 4.2). The difference in GDM%
between those with higher BMI values and lower BMI values approached
significance, while no significant differences were detected between high and low
groups for VO2max, bone mineral density, and percentage of body fat.
Table 4.2 t-test Results
Median Group Methylation (%) p
value ∆%
Mean SD
BF% 21.45% High 2.835 1.220
0.574 8.95465 Low 2.602 0.819
BMI 24.0
High 2.375 0.914 0.088 -22.4512
Low 3.062 1.052
BMD 1.1955 (g/cm2)
High 2.692 0.822 0.899 -1.91635
Low 2.745 1.233
Folate
237.2 (µg/day)
High 3.139 1.168 0.034* 36.63388
Low 2.298 0.672
VO2 Max
52.23 (ml/kg/min)
High 2.647 1.244 0.729 -5.16037
Low 2.791 0.799
*The High folate group has significantly increased GDM%

33
CHAPTER 5
SUMMARY, CONCLUSIONS,
AND RECOMMENDATIONS
Discussion of Results
The purpose of this investigation was to determine whether a relationship
exists between the percentage of global DNA methylation and measures of
aerobic fitness, as well as measures of body composition. It was hypothesized
that a significant correlation would exist between GDM% and measures of
aerobic fitness and body composition. Regarding the association between VO2max
and GDM%, we retain the null hypothesis as no significant correlation was
determined. When considering the body composition measure of Body Mass
Index, we found that a significant relationship existed with global DNA
methylation percentage in the female group only.
Upon classifying the subjects by gender, it was determined that there was a
negative correlation with BMI and GDM percentage in females. These results
disagree with the findings of Kim et al. (2010) in two ways. First, the association
found in the present study suggests that as BMI increases, GDM percentage
decreases, while Kim et al. (2010) found the opposite. Secondly, both males and
females displayed a significant correlation in the Kim et al. (2010) study while
only females did so presently. Possible rationales for these inconsistencies are
the facts that the Kim et al. (2010) study was conducted in Singapore, where the
obesity rate is much lower than in the United States (12% versus 36%

34
respectively) and the fact that the present study had a much smaller sample size
(n=26 vs n=286 comparatively). This study was also unique in that it took an
actual measurement of body composition (DEXA scan), as well as calculating
BMI values.
Additionally, Kim et al. (2010) reported that global DNA methylation was
significantly associated with an increased risk of cardiovascular disease.
Specifically, they reported that males who developed cardiovascular disease
(myocardial infarction, stroke) or its predisposing conditions (hypertension and
diabetes) over a 5 year span had significantly higher levels of GMD compared to
their disease free counterparts (p=0.03). As it is well established that physical
fitness level and aerobic capacity is inversely related with cardiovascular disease
risk (Dencker et al., 2012; Shortreed, Peeters, & Forbes, 2013), it seemed
intuitive that a measure of aerobic capacity (VO2max) would also be related to
global DNA methylation. However, we found that VO2max was not significantly (r ≤
-0.253, p>0.452) related to GDM percentage in males or females, and there was
no significant (p=0.729) difference between the high or low VO2max groups. To
our knowledge, this is the first investigation to report that there is no association
between VO2max and GDM%. As previously addressed, the low number of
subjects, specifically sedentary subjects, in the present study could be an
explanation for this lack of association. While cardiovascular disease risk is
positively impacted by one’s aerobic fitness, there are confounding factors that
may affect the cardiovascular system, including smoking, dietary habits, and

35
family history. Further research is necessary to determine whether other
measures of aerobic fitness are more sensitive correlates with DNA methylation.
Regarding dietary habits, a measure of average folate intake was estimated
in the current study participants. The results of the delineated t-tests
demonstrated that nutritional status needs to be accounted for at all times with
concerns to methylation levels. The findings are in agreement with the concepts
presented by Ong, Moreno, & Ross (2012) in that higher folate intake can
influence methylation levels. The article discusses the need for research on
using bioactive foods (including those high in folate) as a cancer prevention
method. Foods high in folate were chosen due to folate’s role in the methylation
process as a methyl group donor. The present study demonstrates that
individuals with elevated intakes of folate can have GDM percentages higher
than those with low intakes of folate by 36.6%. Though this was not the main
concern of the present study, folate’s influence on GDM levels must be
accounted for in future studies in order to limit confounding variables.
Conclusions and Recommendations for Further Study
Most methylation studies, be them GDM or individual gene methylation
studies, have subject pools numbering in the hundreds due to the innate variance
in individual genomes. As trends were evident with the small number of
subjects in the present investigation, continued studies with a more diverse
sample are warranted. Sedentary or less physically fit subjects would increase
the diversity of the study and more than likely strengthen the correlations.

36
In addition to the pervious comment, it should be noted that at present time,
there is no standard order or procedure for reporting GDM percentages. The
current study has an average GDM percentage of 2.7% which is similar to the
findings displayed by McGuinness et al. (2012). At the same time, GDM
percentages have been published ranging from 0.85% (Liu et al., 2011) to 91%
(Bromberg, Bersudsky, & Agam, 2009). This large discrepancy could be due to
the fact that various means of DNA isolation and GDM quantification were used
by the studies, which has been shown to significantly affect the GDM
percentages (Soriano-Tarraga et al., 2013). This lack of standardization does
not allow for easy comparisons between studies and can be very misleading
when examining multiple studies. Standards need to be established in order for
future research to prosper.
To our knowledge, this is the first study to correlate a direct measure of body
composition with GDM. While the small number of subjects was a serious limiting
factor, a number of interesting findings were present. It was demonstrated that
an inverse relationship between GDM and BMI appears to be present in females,
while not in males. Additionally, individuals with an increased levels of folate
consumption have elevated levels of GDM compared to those that intake
decreased amounts of folate. At this time, it does not appear that there is a
relationship between cardiovascular fitness, measured by VO2max, and GDM.
Additionally, studies with further measures of aerobic fitness and greater
numbers of subjects are needed in order to definitively say that this relationship

37
does not exist. DNA methlyation continues to be a biomarker of great
importance in terms of detecting cardiovascular disease risk and prevention.

38
REFERENCES
Baccarelli, A., Rienstra, M., & Benjamin, E. (2010). Cardiovascular epigenetics:
basic concepts and results from animal and human studies. Circulation:
Cardiovascular Genetics, 3(6), 567-573.
Barres, R., Yan, J., Egan, B., Treebak, J., Rasmussen, M., Fritz, T., Caidahl, K.,
& Krook, A. (2012). Acute exercise remodels promoter methylation in human
skeletal muscle. Cell Metabolism, 15, 405-411.
Bollati, V., & Baccarelli, A. (2010). Environmental epigenetics. Heredity, 105(1),
105-112.
Breton, C., Byun, H., Wenten, M., Pan, F., Yang, A., & Gilliland, F. (2009).
Prenatal tobacco smoke exposure affects global and gene-specific. American
Journal of Respiratory and Critical Care Medicine, 180, 462-467.
Choi, J., James, S., Link, P., McCann, S., Hong, C., Davis, W., Nesline, M., &
Ambrosone, C. (2009). Association between global dna hypomethylation in
leukocytes and risk of breast cancer. Carcinogensis, 30(11), 1889-1897.
Das, P., & Singal, R. (2004). Dna methylation and cancer. Journal of Clinical
Oncology, 22(22), 4632-4642.
Dencker, M., Thorsson, O., Karlsson, M., Linden, C., Wollmer, P., & Andersen, L.
(2012). Aerobic fitness related to cardiovascular risk factors in young children.
Eurpean Journal of Pediatrics, 171, 705-710.
Kim, G., Ryan, J., Gleen, M., & Archer, S. (2011). Epigenetic mechanisms of
pulmonary hypertension. Pulmonary Circulation, 1(3), 347-356.

39
Kim, J., Samaranayake, M., & Pradhan, S. (2008). Epigenetic mechanisms in
mammals. Cellular and Molecular Life Sciences, 66, 596-612.
Kim, M., Long, T., Arakawa, K., Wang, R., Yu, M., & Laird, P. (2010). DNA
methylation as a biomarker for cardiovascular disease risk. PLOS ONE, 5(3),
1-8.
Lundi, G., Anderson, L., Lauria, M., Lindholm, M., Fraga, M., Villar-Garson, A.,
Ballestar, E., & Esteller, M. (2004). Dna methylation polymorphisms precede
any histological sign or atherosclerosis in mice lacking apolipoprotein e. The
Journal of Biological Chemistry, 279(28), 29147-29154.
Mazzio, E., & Soliman, K. (2012). Basic concepts of epigenetics impact of
environmental signals on gene expression. Epigenetics, 7(2), 119-130.
Milagro, F., Campion, J., Cordero, P., Goyenechea, E., Gomez-Uriz, A., Abete, I.,
Zulet, M., & Martinez, A. (2011). A dual epigenomic approach for the search
of obesity biomarkers: Dna methylation in relation to diet-induced weight loss.
The Journal of the Federation of American Societies for Experimental Biology,
25, 1378-1389.
Milagro, F., Gomex-Abellan, P., Campion, J., Martinez, J., Ordovas, J., &
Garaulet, M. (2012). Clock, per2 and bmal1 dna methylation: association with
obesity and metabolic syndrome characteristics and monounsaturated fat
intake. Chronobiology International, 29(9), 1180-1194.
Nakajima, K., Takeoka, M., Mori, M., Hashimoto, S., Sakurai, A., Higuchi, K.,
Itano, N., & Shinohara, M. (2010). Exercise effects on methylation of asc
gene. International Journal of Sports Medicine, 31, 671-675.

40
Ong, T., Moreno, F., & Ross, S. (2011). Targeting the epigenome with bioactive
food components for cancer prevention. Journal of Nutrigenetics and
Nutrigenomics, 4, 275-292.
Ordovas, J., & Smith, C. (2010). Epigenetics and cardiovascular disease. Nature
Reviews of Cardiology, 7(9), 510-519.
Shortreed, S., Anna, P., & Forbes, A. (2013). Estimating the effect of long-term
physical activity on cardiovascular disease and mortality: evidence from the
framingham heart study. Heart, 99(9), 649-654.
Stauffer, B., & Christopher, D. (2010). Epigenetics: an emerging player in health
and disease. Journal of Applied Physiology, 109, 230-231.
Stenvinkel, P., Karimi, M., Johansson, S., Axelsson, J., Suliman, M., Lindholm,
B., Heimburger, O., & Barany, P. (2007). Impact of inflammation on
epigenetic dna methylation - a novel risk factor for cardiovascular disease.
Journal of Internal Medicine, 261, 488-499.
Wang, X., Zhu, H., Snieder, H., Su, S., Munn, D., Harshfield, G., Maria, B., &
Dong, Y. (2010). Obesity related methylation changes in dna of peripheral
blood leukocytes. Biomed Central Medicine, 8(87), 1-8.
Zhang, F., Cardarelli, R., Carroll, J., Zhang, S., Fulda, K., Gonzalez, K.,
Vishwanatha, J., & Morabia, A. (2011). Physical activity and global genomic
dna methylation in a cancer-free population. Epigenetics, 6(3), 293-299.

41
VITA
Graduate College University of Nevada, Las Vegas
Michael Steele Jarrett
Home Address: 8025 West Russell Rd. Apt 2143 Las Vegas, NV 89113 Degrees: Bachelors of Science, Exercise Science Lenoir-Rhyne University (Hickory, NC) Bachelors of Art, Physical Education K-12 Lenoir-Rhyne University (Hickory, NC) Thesis Title: Relationship of Global DNA Methylation with Cardiovascular Fitness and Body Composition Thesis Examination Committee:
Chair, James Navalta, Ph. D. Committee Member, John Young, Ph. D. Committee Member, Richard Tandy, Ph. D. Committee Member, Daniel Young, DPT Graduate College Representative, Merrell Landers, Ph. D., DPT