relationship of taster status to food environment on bmi power point presentation
TRANSCRIPT
Relationship of Taster Status to Food
Environment on BMI By Horacio Ruiz & Kenneth Curiel
Research Methods EXSC 364 Department of Health and Exercise
Science

Introduction
● Obesity ● 1/3 of United States adults and 17 percent of
children ages 2-19 are obese (CDC, 2014) ● Taster status awareness & food environment
identification may affect Body Mass Index levels (BMI).

Hypothesis
● We hypothesized that most people who are supertasters will have lower BMI’s than those who are non-tasters. = satisfaction research
● However, we believe environment is the other significant independent variable that also contributes to the BMI calculation results.

Group Activity
Groups of 3: discuss • Familiarity with Taster Status • Talk about your own Food Environment • (where are you from?) • How have you used BMI in your own work? • Some groups willing to volunteer by
reporting


Literature Review (Taster Status)
● Catanzaro, Chesbro and Velkey, found that approximately 25% of the human population that do not detect bitterness in the response to 6-n-Propylthiouracil (PROP) are categorized as non-tasters.
● Tasters in many studies have been shown to dislike foods that are very bitter such as black coffee, grapefruit, and certain vegetables (p. 787). – bitterness research
● In a study by Dinehart’s group the objective was to look at why people do not consume vegetables based on sweetness or bitterness of vegetables.

LR (Food Environment)
● Many factors other than biology and genetics play a role in food preference.
● Early exposures to a variety of foods, health beliefs, classically conditioned positive and negative associations, observational learning, and cognitive interpretations of sensory experiences with various flavors.
LR Continued (BMI)
● According to the Centers for Diseases Control and Prevention, body mass index is an ideal number that assesses the fatness of most people accurately (CDC, 2015).
● It is relatively inexpensive and easy to perform when working with unhealthy weight problems (CDC, 2015).

Vertex42.com BMI Graphic
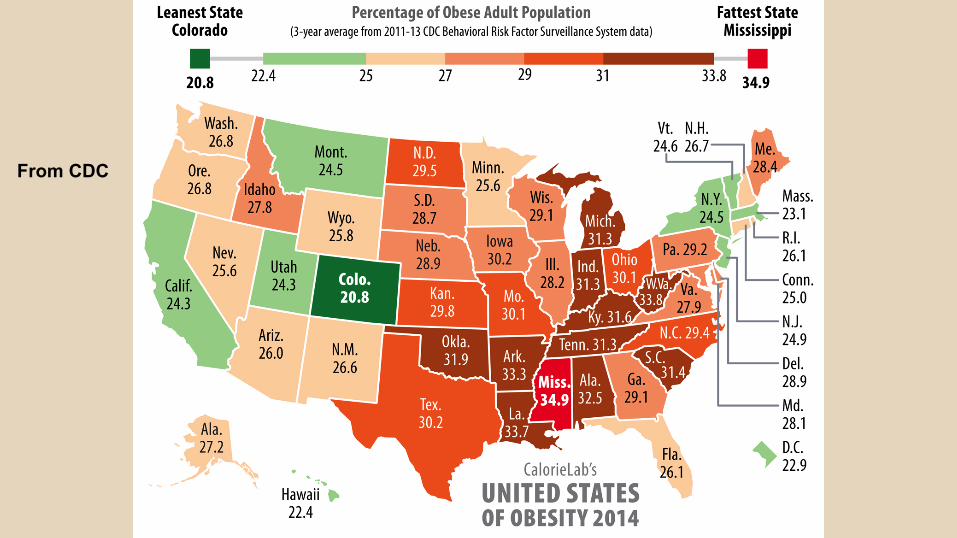
From CDC

Demonstration
Solicit 3 volunteers for taster status
Methods
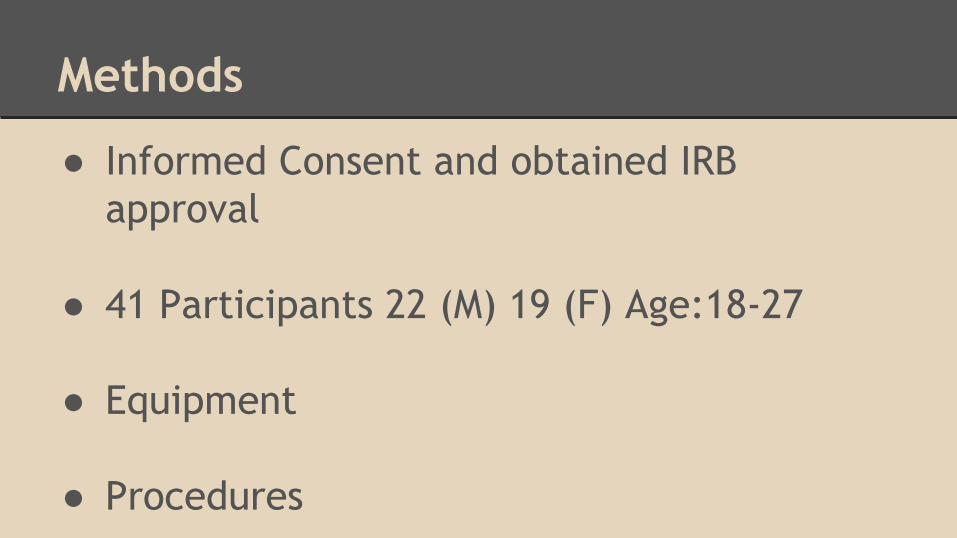
● Informed Consent and obtained IRB approval
● 41 Participants 22 (M) 19 (F) Age:18-27 ● Equipment ● Procedures


Freedman's Perceived Food Env. Qu.


Discuss in groups of 3 and Report
• What type of correlation (and how strong) do you think will there be for Survey Score on Food Environment and BMI?
• What type of correlation (and how strong) do you think will there be for Perceived Bitterness score and BMI?
• Will Food environment affect BMI? • Will Taster status affect BMI?

Results
Dependent Variable = BMI Independent Variables = Taster Status & Food Environment 2 x 3 factorial analysis of variance (ANOVA) No main effect was seen for environment status (F(1,39) = 0.01, p = .91), for taster status (F(2,38) = 1.71, p = .20), or for the interaction between them (F(2,38) = 0.09, p = .92)


Conclusions
The study showed that there was no significant difference in BMI values for taster status and environment. Taster Status Food Environment BMI

What we would do different?
● Try using bioelectrical impedance ● Suggest using Geographic Information System
instead of a questionnaire ● Include amount of sleep and exercise as
independent variables

Ref. of Photos via Google Images http://robinyap.com/wp-content/uploads/2012/01/research_word_in_dictionary_magni<ied_sepia-300x170.jpghttp://sd.keepcalm-o-matic.co.uk/i/keep-calm-and-literature-review.pnghttp://calorielab.com/news/wp-images/post-images/fattest-states-2014-big.jpghttp://www.doctordisruption.com/wp-content/uploads/2015/04/Blog3.1.jpg
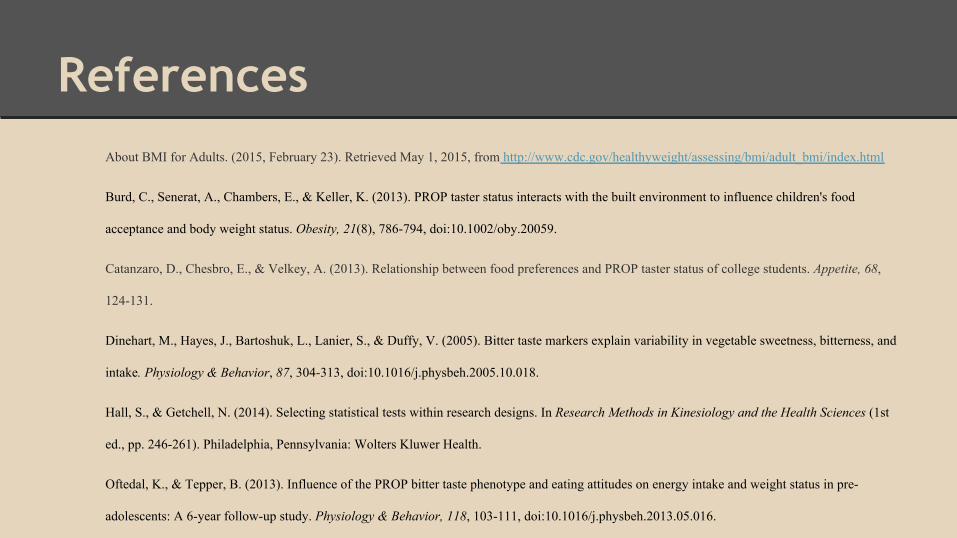
References About BMI for Adults. (2015, February 23). Retrieved May 1, 2015, from http://www.cdc.gov/healthyweight/assessing/bmi/adult_bmi/index.html
Burd, C., Senerat, A., Chambers, E., & Keller, K. (2013). PROP taster status interacts with the built environment to influence children's food
acceptance and body weight status. Obesity, 21(8), 786-794, doi:10.1002/oby.20059.
Catanzaro, D., Chesbro, E., & Velkey, A. (2013). Relationship between food preferences and PROP taster status of college students. Appetite, 68,
124-131.
Dinehart, M., Hayes, J., Bartoshuk, L., Lanier, S., & Duffy, V. (2005). Bitter taste markers explain variability in vegetable sweetness, bitterness, and
intake. Physiology & Behavior, 87, 304-313, doi:10.1016/j.physbeh.2005.10.018.
Hall, S., & Getchell, N. (2014). Selecting statistical tests within research designs. In Research Methods in Kinesiology and the Health Sciences (1st
ed., pp. 246-261). Philadelphia, Pennsylvania: Wolters Kluwer Health.
Oftedal, K., & Tepper, B. (2013). Influence of the PROP bitter taste phenotype and eating attitudes on energy intake and weight status in pre-
adolescents: A 6-year follow-up study. Physiology & Behavior, 118, 103-111, doi:10.1016/j.physbeh.2013.05.016.
Special thanks to Dr. Thomas & Dr. Martin for the help with the research process.

Correlation Between BMI & Env. Sta.

Correlation Between BMI & Per. Bit.
