relationship of two variables a correlation exists between two variables when the values of one are...
TRANSCRIPT

Relationship of two variables
A correlation exists between two variables when the values of one are somehow associated with the values of the other in some way.

Scatter Plot (or Scatter Diagram)A plot of paired (x,y) data with a horizontal x-axis and a vertical y-axis. Used to determine whether there is a relationship between the two variables

Definition of correlation
The linear correlation coefficient ρ measures the strength of the linear relationship between the paired quantitative x- and y-values in a sample.
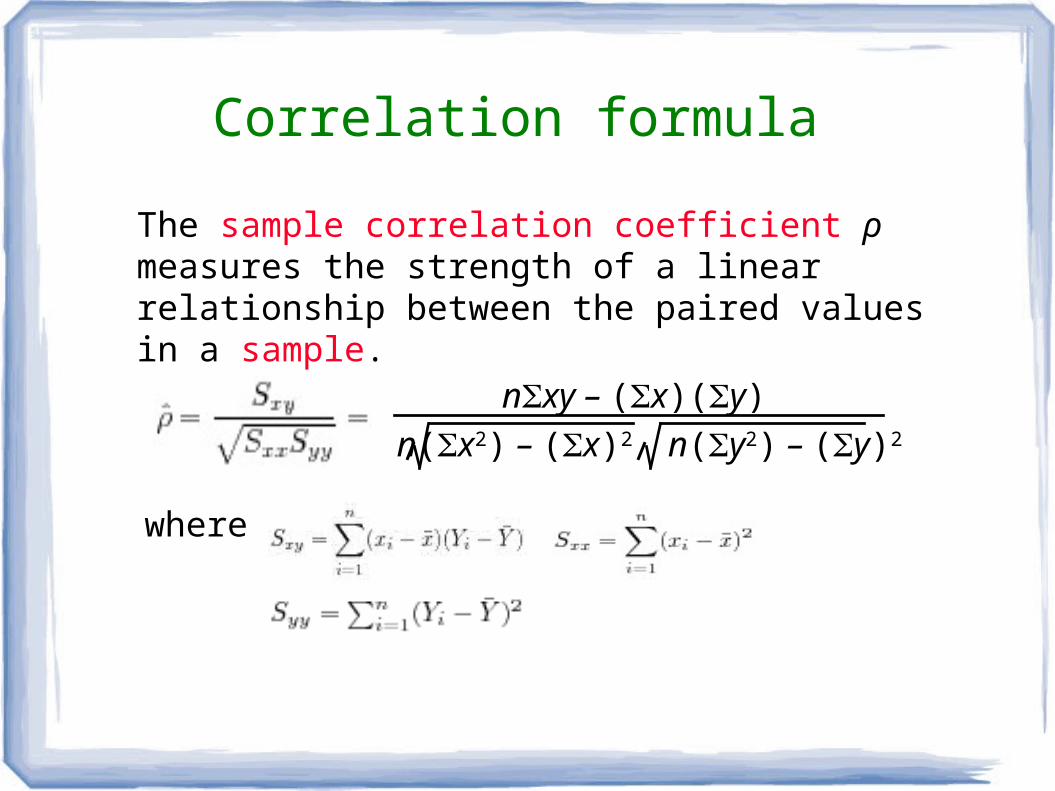
The sample correlation coefficient ρ measures the strength of a linear relationship between the paired values in a sample.
Correlation formula
nxy – (x)(y)
n(x2) – (x)2 n(y2) – (y)2
where

Correlation Coefficients and Scatter plots of Paired Data

Properties of the Linear Correlation Coefficient ρ
1. –1 ρ 1
2. if all values of either variable are converted to a different scale, the value of ρ does not change.
3. The value of ρ is not affected by the choice of x and y. Interchange all x- and y-values and the value of ρ will not change.
4. ρ measures strength of a linear relationship.
5. ρ is very sensitive to outliers, they can dramatically affect its value.
Common Errors Involving Correlation
1. Causation: It is wrong to conclude that correlation implies causality.
2. Averages: Averages suppress individual variation and may inflate the correlation coefficient.
3. Linearity: There may be some relationship between x and y even when there is no linear correlation.
Regression
The regression equation expresses a relationship between x (called the explanatory variable, predictor variable or independent variable), and y (called the response variable or dependent variable).
The typical equation of a straight line is expressed in the form
y = b0 + b1x,
where b0 is the y-intercept and b1 is the slope.

Regression Equation
Given a collection of paired data, the regression equation
y = b0 + b1x
algebraically describes the relationship between the two variables.
Regression Line
The graph of the regression equation is called the regression line (or line of best fit, or least squares line).

For a pair of sample x and y values, the residual is the difference between the observed sample value of y and the y-value that is predicted by using the regression equation. That is,
Residual
residual = observed y – predicted y
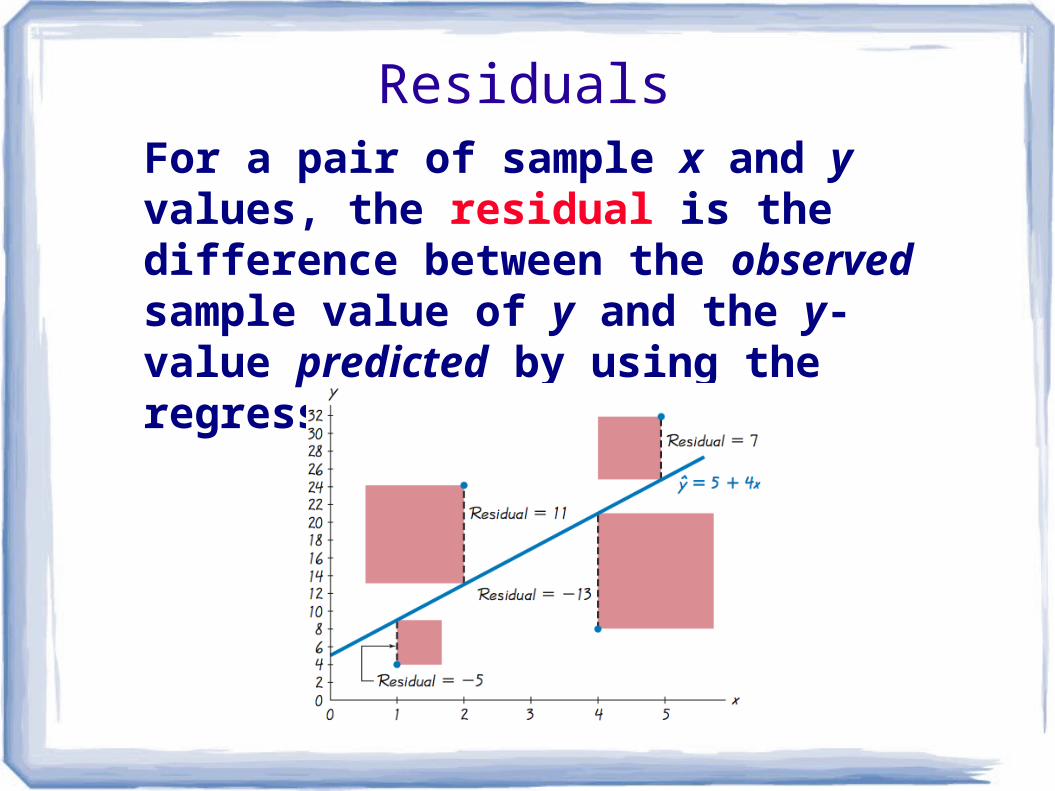
For a pair of sample x and y values, the residual is the difference between the observed sample value of y and the y-value predicted by using the regression equation.
Residuals
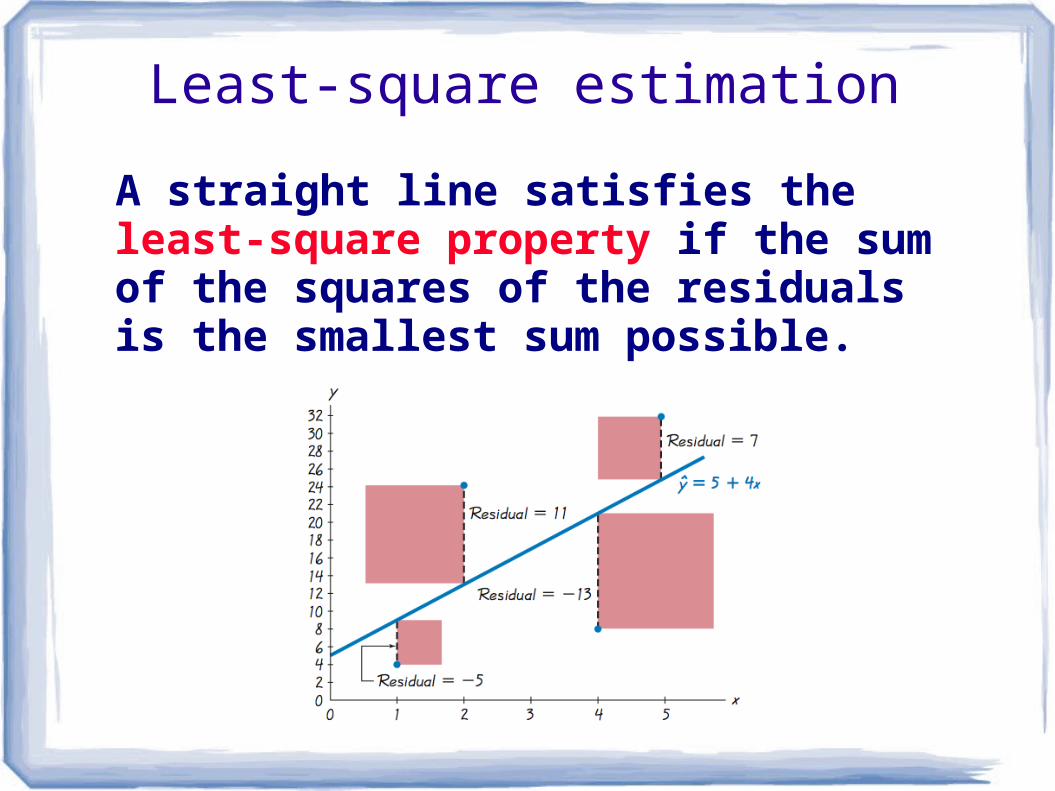
Least-square estimation
A straight line satisfies the least-square property if the sum of the squares of the residuals is the smallest sum possible.
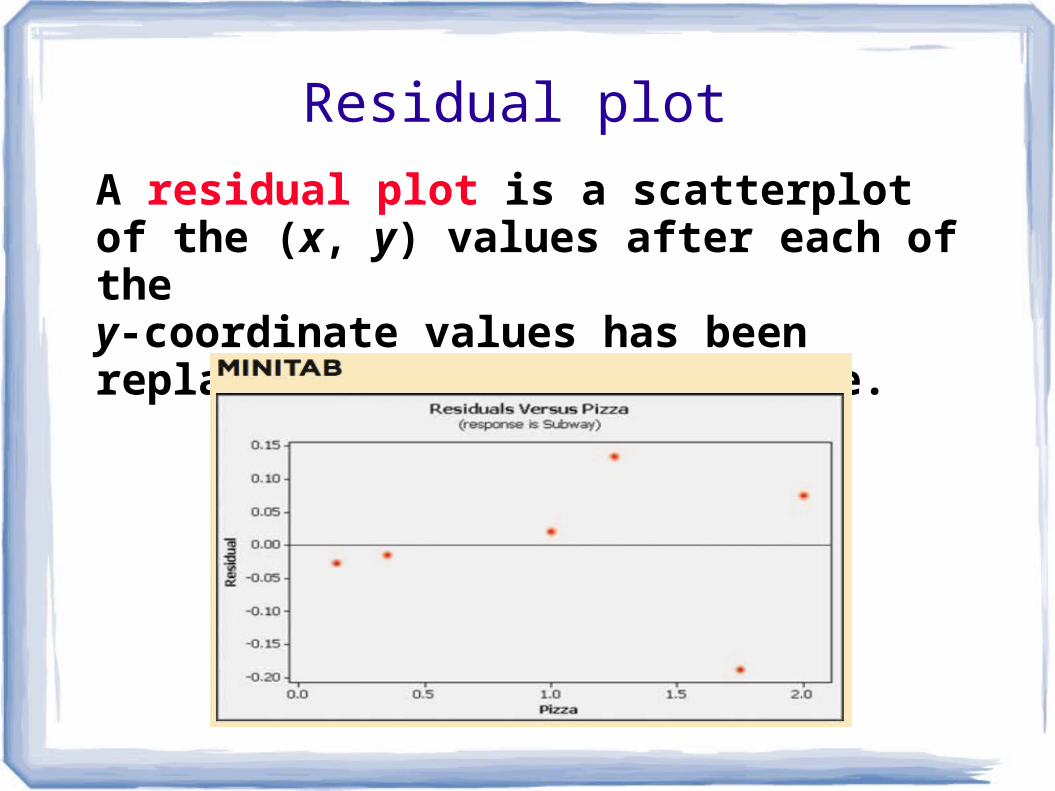
Residual plot
A residual plot is a scatterplot of the (x, y) values after each of they-coordinate values has been replaced by the residual value.
When is regression appropriate?
1. The sample of paired (x, y) data is a simple random sample of quantitative data.
2. Visual examination of the scatter plot must confirm that the points approximate a straight-line pattern.
3. The outliers must be removed if they are known to be errors. The effects of any other outliers should be considered by calculating ρ with and without the outliers included.

Outliers and influential points
In a scatterplot, an outlier is a point lying far away from the other data points.
Paired sample data may include one or more influential points, which are points that strongly affect the graph of the regression line.
Example of influential points
The scatter plot located to the left on the next slide shows the regression line. If we include this additional pair of data:
x = 2.00, y = –20.00
this additional point would be an influential point because the graph of the regression line would change considerably, as shown by the regression line located to the right.

Example of an influential point
Residual Plot Analysis
When analyzing a residual plot, look for a pattern in the way the points are configured, and use these criteria:
The residual plot should not have an obvious pattern that is not a straight-line pattern.
The residual plot should not become thicker (or thinner) when viewed from left to right.
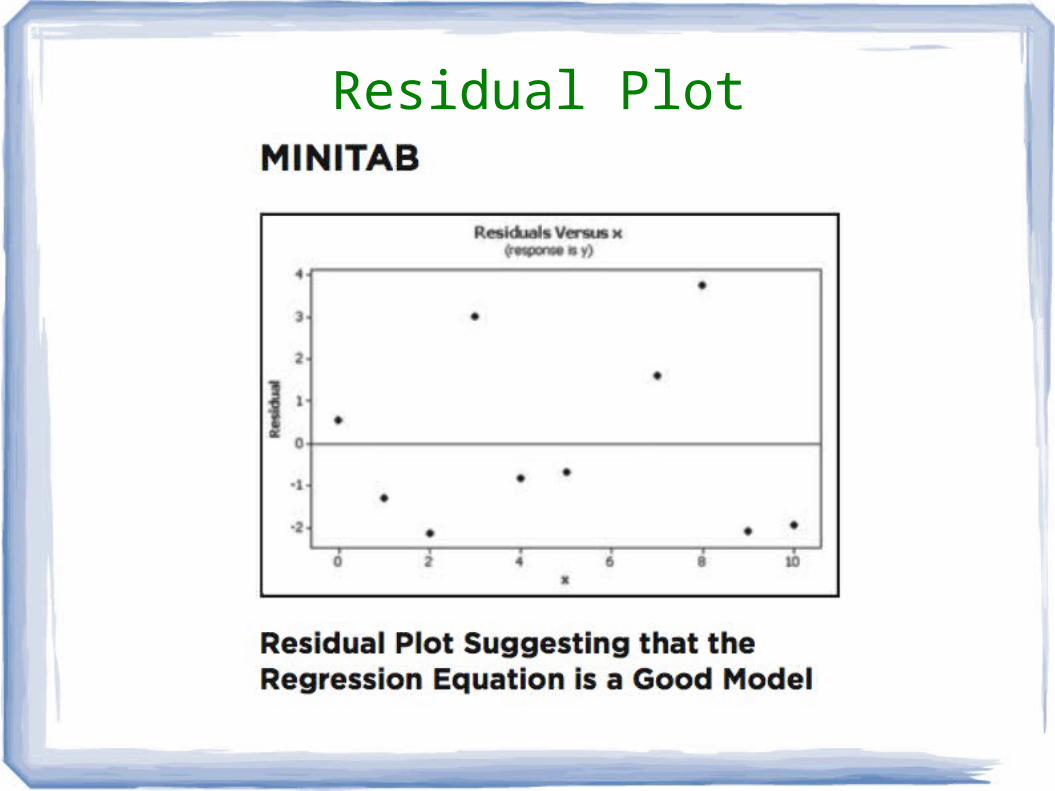
Residual Plot

Residual Plot
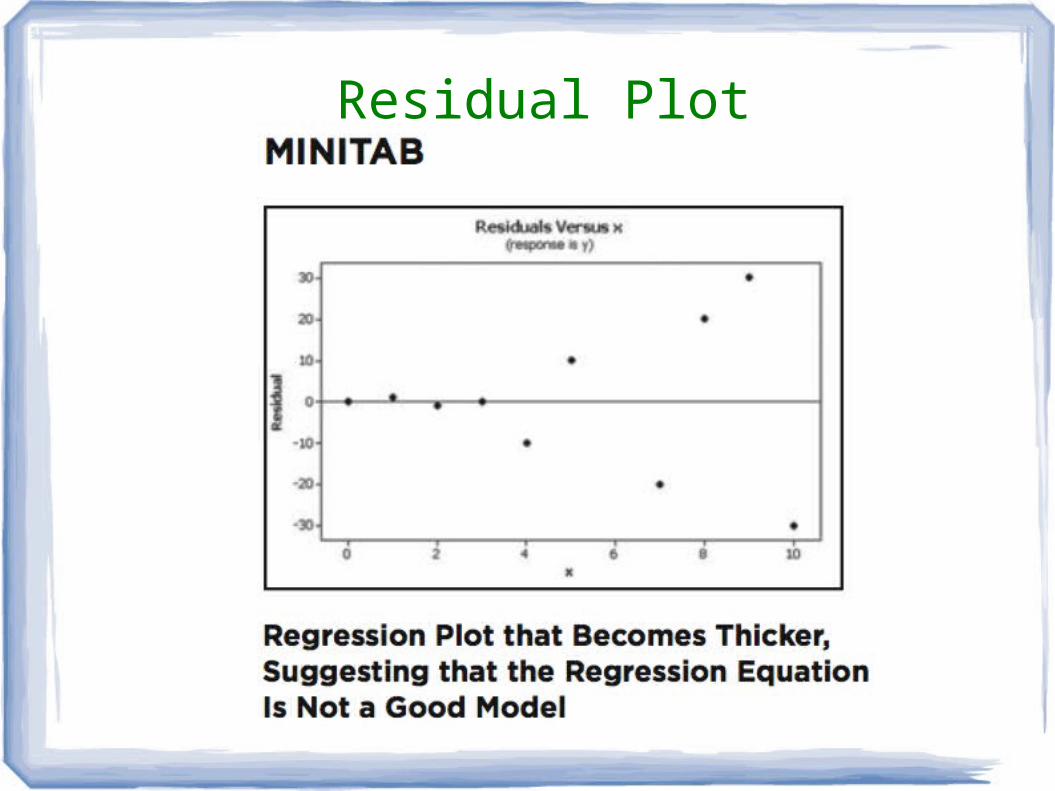
Residual Plot
Regression Analysis
1. Construct a scatter plot and verify that the pattern of the points is approximately a straight-line pattern without outliers. (If there are outliers, consider their effects by comparing results that include the outliers to results that exclude the outliers.)
2. Construct a residual plot and verify that there is no pattern (other than a straight-line pattern) and also verify that the residual plot does not become thicker (or thinner).