relationship trading in otc markets
TRANSCRIPT
Relationship Trading in OTC Markets
Terry Hendershott1 Dan Li2 Dmitry Livdan1 Norman Schurhoff3
1UC Berkeley 2Federal Reserve Board
3University of Lausanne, Swiss Finance Institute, CEPR
October 2016
Disclaimer: The views presented herein are our own and do not necessarily reflect those of the Board of Governors of the Federal Reserve System.
Terry Hendershott, Dan Li, Dmitry Livdan, Norman Schurhoff Relationship Trading in OTC Markets 1
OTC markets
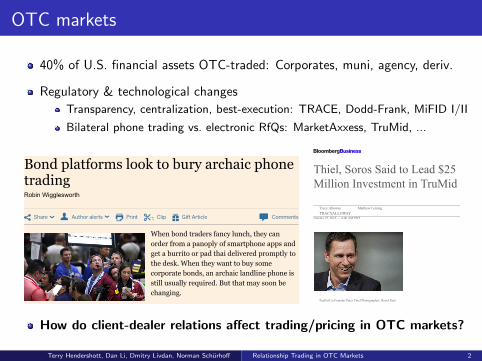
40% of U.S. financial assets OTC-traded: Corporates, muni, agency, deriv.
Regulatory & technological changes
Transparency, centralization, best-execution: TRACE, Dodd-Frank, MiFID I/II
Bilateral phone trading vs. electronic RfQs: MarketAxxess, TruMid, ...
10/28/15, 7:42 AMBond platforms look to bury archaic phone trading - FT.com
Page 1 of 6http://www.ft.com/intl/cms/s/0/89…-00144feab7de.html#axzz3ppisZEOc
Share Author alerts Print Clip Gift Article Comments
Options are more complex to trade which accounts forthe continued presence of the human trader
Last updated: May 5, 2015 12:39 pm
Robin Wigglesworth
When bond traders fancy lunch, they canorder from a panoply of smartphone apps andget a burrito or pad thai delivered promptly tothe desk. When they want to buy somecorporate bonds, an archaic landline phone isstill usually required. But that may soon bechanging.
The downturn in bond trading volumes forissued debt — so acute that even regulators,
central bankers and the International Monetary Fund are getting worried — hastriggered a Cambrian explosion in the electronic bond trading ecosystem.
About a dozen start-ups have mushroomed over the pastfew years focusing primarily on modernising and improving the old-fashioned andanaemic corporate bond trading system, where the liquidity crisis is the deepest. Thequestion, however, is whether technology can facilitate bond investors selling largeamounts of paper without generating significant market turmoil.
Bond platforms look to bury archaic phonetrading
©AP
10/28/15, 7:39 AMThiel, Soros Said to Lead $25 Million Investment in TruMid - Bloomberg Business
Page 1 of 9http://www.bloomberg.com/news/articles/2015-10-27/thiel-soros-said-to-lead-25-million-investment-in-trumid
Thiel, Soros Said to Lead $25Million Investment in TruMid
TruMid gets boost in electronic bond-trading competition
A dozen firms including TruMid seek to transform bond market
PayPal Co-Founder Peter Thiel Photographer: David PaulMorris/Bloomberg
Venture capitalist Peter Thiel and billionaire George Soros are leading a $25 millioninvestment in electronic bond-trading startup TruMid Financial LLC.
The New York-based company is among a dozen firms competing to transform the
October 27, 2015 — 4:00 AM PDT
Tracy AllowayTRACYALLOWAY
Matthew Leising
How do client-dealer relations affect trading/pricing in OTC markets?
Terry Hendershott, Dan Li, Dmitry Livdan, Norman Schurhoff Relationship Trading in OTC Markets 2

Functioning of decentralized OTC markets
No formal structure, no centralized trading, no law-of-one-price
Opacity & fragmentation impose search & matching frictions on investors
Dealers provide liquidity (matching, inventory & interdealer network)
Dealers'
C
CC
C
D
D D
D D
C C
1 How do investors trade: flip coin or build rolodex?2 Investor heterogeneity: How many dealers to trade with, why?
Tradeoff between competition & repeat relations
3 What is impact of connections on execution cost?4 Dealer heterogeneity: Which dealers to trade with, why?
Terry Hendershott, Dan Li, Dmitry Livdan, Norman Schurhoff Relationship Trading in OTC Markets 3
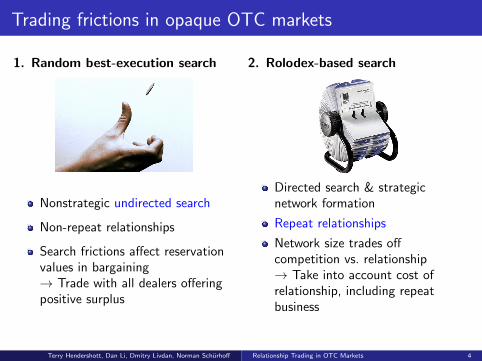
Trading frictions in opaque OTC markets
1. Random best-execution search
Nonstrategic undirected search
Non-repeat relationships
Search frictions affect reservationvalues in bargaining→ Trade with all dealers offeringpositive surplus
2. Rolodex-based search
Directed search & strategicnetwork formation
Repeat relationships
Network size trades offcompetition vs. relationship→ Take into account cost ofrelationship, including repeatbusiness
Terry Hendershott, Dan Li, Dmitry Livdan, Norman Schurhoff Relationship Trading in OTC Markets 4

Our setting: Insurer trading in corporate bonds
Our data reveals the identities of the traders on both sides (insurer & dealer)
NAIC comprehensive trades for all 4,000+ US insurers (Health, Life, P&C)
FISD corporate bond characteristics
Corporate bond market is a classic OTC market
Important source of public financing for corporations($7.8tn market cap, $1.4tn issuance, 20k+ CUSIPs)
Large and active OTC secondary market (>400 active broker-dealers)
Illiquid, fragmented & opaque (no tape until early 2000s)
Important investment vehicle for insurers
Long-term buy & hold investors (30% holding, 10% trading)
Subject to liquidity shocks, while little adverse selection risk from insurers
Heterogeneous trading needs (based on size, rating & type)
Terry Hendershott, Dan Li, Dmitry Livdan, Norman Schurhoff Relationship Trading in OTC Markets 5

Literature on OTC markets, search, matching & networks
Microstructure of OTC Financial Markets
Transaction costs and impact of transparency (Edwards, et al., 2005; Bessembinder et al.,2006; Harris & Piwowar, 2007; Green, et al., 2007; Pagano & Volpin, 2012)
OTC vs. electronic trading (Biais, 1993; Hendershott & Madhavan, 2015)
Role of interdealer market (Hollifield et al., 2015; Li & Schurhoff, 2015)
Best execution in OTC markets (O’Hara et al., 2015; Harris, 2015)
Search & Matching
Search frictions in OTC markets (Wright, many; Duffie et al., 2005/7; Weill, 2007; Lagos& Rocheteau, 2007/9; Feldhutter, 2011; Gofman, 2011; Neklyudov, 2014)
Directed search, assortative matching & heterogeneity in labor/marriages (Acemoglu &Shimer, 1999; Shimer & Smith, 2000; Shi, 2001)
Strategic Network & Relationship Formation
OTC network formation & contracting with externalities (Leitner, 2005; Gale & Kariv,2007; Afonso et al., 2011; Condorelli, 2011; Babus, 2012; Farboodi, 2014; Neklyudov &Sambalaibat, 2015; Chang & Zhang, 2015)
Repeat relations, relational contracts & loyalty (Levin, 2002; Bernhardt et al., 2004; Board,2011; Fernando et al., 2011; DiMaggio et al., 2015)
Terry Hendershott, Dan Li, Dmitry Livdan, Norman Schurhoff Relationship Trading in OTC Markets 6

Agenda
1 Data on insurers & bond trading
2 Empirical findings:
Insurer heterogeneity in trading needsDeterminants of insurers’ choice of trading network
3 Model of trading in OTC markets & testable predictions
4 Execution costs & dealer relationships
5 Structural estimation of model
6 Dealer heterogeneity, which insurers choose which dealers (not in paper)
7 Diff-in-diff analysis of Lehman collapse (not in paper)
8 Summary & conclusion
Terry Hendershott, Dan Li, Dmitry Livdan, Norman Schurhoff Relationship Trading in OTC Markets 7
Data from NAIC
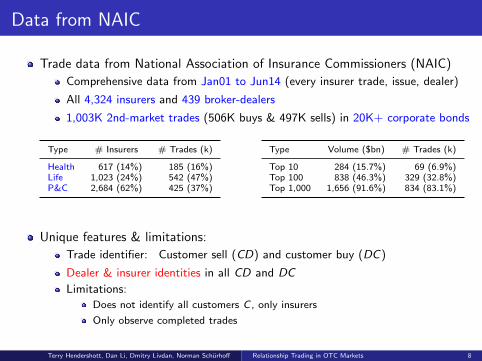
Trade data from National Association of Insurance Commissioners (NAIC)
Comprehensive data from Jan01 to Jun14 (every insurer trade, issue, dealer)
All 4,324 insurers and 439 broker-dealers
1,003K 2nd-market trades (506K buys & 497K sells) in 20K+ corporate bonds
Type # Insurers # Trades (k)
Health 617 (14%) 185 (16%)Life 1,023 (24%) 542 (47%)P&C 2,684 (62%) 425 (37%)
Type Volume ($bn) # Trades (k)
Top 10 284 (15.7%) 69 (6.9%)Top 100 838 (46.3%) 329 (32.8%)Top 1,000 1,656 (91.6%) 834 (83.1%)
Unique features & limitations:
Trade identifier: Customer sell (CD) and customer buy (DC)
Dealer & insurer identities in all CD and DC
Limitations:
Does not identify all customers C , only insurers
Only observe completed trades
Terry Hendershott, Dan Li, Dmitry Livdan, Norman Schurhoff Relationship Trading in OTC Markets 8

Insurers have heterogenous trading activity
Insurer buys per year: Insurer sells per year:
.001
.01
.1.5
1Fr
actio
n of
insu
rers
1 10 100 1000No. of trades
DataInterpolation
.001
.01
.1.5
1Fr
actio
n of
insu
rers
1 10 100 1000No. of trades
DataInterpolation
Insurers trade up to 2,200 times every year (Mean=16, median=14)
Trading correlates with insurer size, type, quality; bond types & varieties
Distribution follows a power law: p(X ) ∝ X−1.21; use later
Terry Hendershott, Dan Li, Dmitry Livdan, Norman Schurhoff Relationship Trading in OTC Markets 9
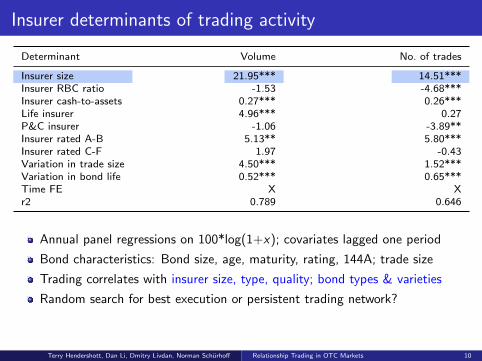
Insurer determinants of trading activity
Determinant Volume No. of trades
Insurer size 21.95*** 14.51***Insurer RBC ratio -1.53 -4.68***Insurer cash-to-assets 0.27*** 0.26***Life insurer 4.96*** 0.27P&C insurer -1.06 -3.89**Insurer rated A-B 5.13** 5.80***Insurer rated C-F 1.97 -0.43Variation in trade size 4.50*** 1.52***Variation in bond life 0.52*** 0.65***Time FE X Xr2 0.789 0.646
Annual panel regressions on 100*log(1+x); covariates lagged one period
Bond characteristics: Bond size, age, maturity, rating, 144A; trade size
Trading correlates with insurer size, type, quality; bond types & varieties
Random search for best execution or persistent trading network?
Terry Hendershott, Dan Li, Dmitry Livdan, Norman Schurhoff Relationship Trading in OTC Markets 10
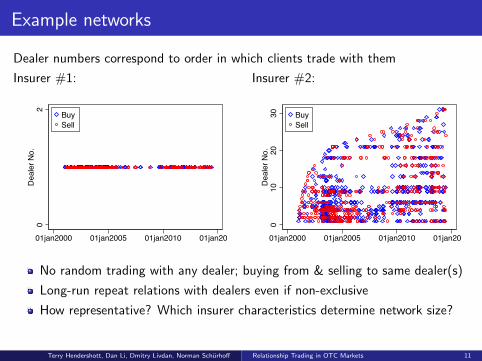
Example networks
Dealer numbers correspond to order in which clients trade with them
Insurer #1: Insurer #2:
02
Dea
ler N
o.
01jan2000 01jan2005 01jan2010 01jan2015
BuySell
010
2030
Dea
ler N
o.
01jan2000 01jan2005 01jan2010 01jan2015
BuySell
No random trading with any dealer; buying from & selling to same dealer(s)
Long-run repeat relations with dealers even if non-exclusive
How representative? Which insurer characteristics determine network size?
Terry Hendershott, Dan Li, Dmitry Livdan, Norman Schurhoff Relationship Trading in OTC Markets 11
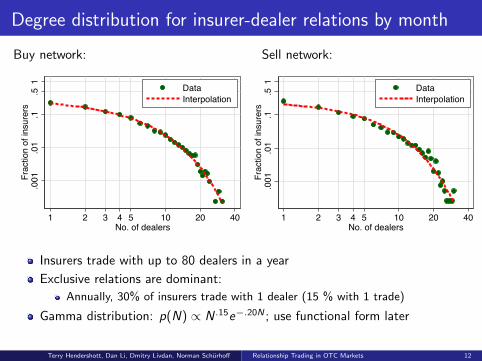
Degree distribution for insurer-dealer relations by month
Buy network: Sell network:
.001
.01
.1.5
1Fr
actio
n of
insu
rers
1 2 3 4 5 10 20 40No. of dealers
DataInterpolation
.001
.01
.1.5
1Fr
actio
n of
insu
rers
1 2 3 4 5 10 20 40No. of dealers
DataInterpolation
Insurers trade with up to 80 dealers in a year
Exclusive relations are dominant:
Annually, 30% of insurers trade with 1 dealer (15 % with 1 trade)
Gamma distribution: p(N) ∝ N .15e−.20N ; use functional form later
Terry Hendershott, Dan Li, Dmitry Livdan, Norman Schurhoff Relationship Trading in OTC Markets 12
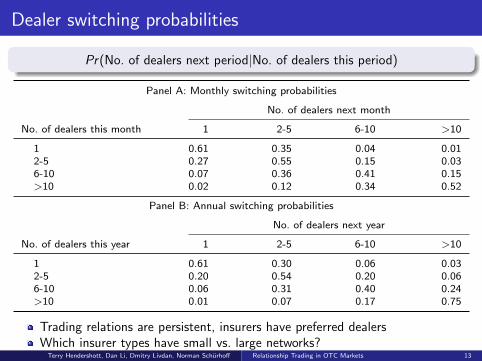
Dealer switching probabilities
Pr(No. of dealers next period|No. of dealers this period)
Panel A: Monthly switching probabilities
No. of dealers next month
No. of dealers this month 1 2-5 6-10 >10
1 0.61 0.35 0.04 0.012-5 0.27 0.55 0.15 0.036-10 0.07 0.36 0.41 0.15>10 0.02 0.12 0.34 0.52
Panel B: Annual switching probabilities
No. of dealers next year
No. of dealers this year 1 2-5 6-10 >10
1 0.61 0.30 0.06 0.032-5 0.20 0.54 0.20 0.066-10 0.06 0.31 0.40 0.24>10 0.01 0.07 0.17 0.75
Trading relations are persistent, insurers have preferred dealersWhich insurer types have small vs. large networks?
Terry Hendershott, Dan Li, Dmitry Livdan, Norman Schurhoff Relationship Trading in OTC Markets 13
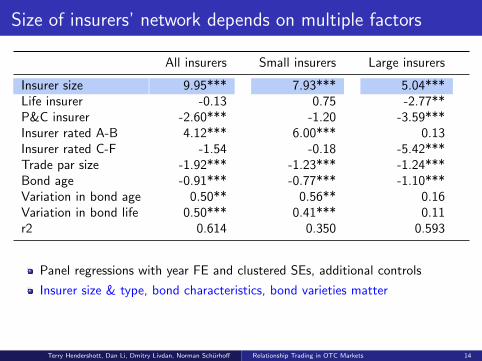
Size of insurers’ network depends on multiple factors
All insurers Small insurers Large insurers
Insurer size 9.95*** 7.93*** 5.04***Life insurer -0.13 0.75 -2.77**P&C insurer -2.60*** -1.20 -3.59***Insurer rated A-B 4.12*** 6.00*** 0.13Insurer rated C-F -1.54 -0.18 -5.42***Trade par size -1.92*** -1.23*** -1.24***Bond age -0.91*** -0.77*** -1.10***Variation in bond age 0.50** 0.56** 0.16Variation in bond life 0.50*** 0.41*** 0.11r2 0.614 0.350 0.593
Panel regressions with year FE and clustered SEs, additional controls
Insurer size & type, bond characteristics, bond varieties matter
Terry Hendershott, Dan Li, Dmitry Livdan, Norman Schurhoff Relationship Trading in OTC Markets 14

OTC model with repeat relations
DGP (2005) type setupDiscount rate r , perpetual bond with coupon flow CNon-owner receives trading shock with intensity ηOwner receives trading shock L with intensity κClient buy and sell prices, Pb&P s , set through Nash bargaining
Dealer marketAs in Lester et al. (2015) interdealer market, but with search frictions
Interdealer prices are exogenous: Mbid , Mask
Symmetric dealers search interdealer market for counterparty with intensity λClients choose N dealers to contact, dealers search simultaneously:
Effective search rate Λ = Nλ
First dealer to locate the bond ’wins’ the tradeIf bargaining fails relationship with dealer is severed, new dealer added
Dealers take into account future trading opportunities
Cost per trade per dealer is K , total cost is NK
Steady-state valuationsClients and dealers transition through states of non-owner, buyer, owner,seller, non-owner, etc.Valuations in states (V no ,V b,V o ,V s) are linked through transitionprobabilities
Terry Hendershott, Dan Li, Dmitry Livdan, Norman Schurhoff Relationship Trading in OTC Markets 15

Model cycle, including dealer valuations
Vno, Uno
Vb, Ub
Vo, Uo
Client receives liquidity shock to buy (intensity η)
Client receives liquidity shock to sell (intensity κ)
Dealers search for seller (intensity λN)
Dealers search for buyer (intensity λN)
Vs, Us
Terry Hendershott, Dan Li, Dmitry Livdan, Norman Schurhoff Relationship Trading in OTC Markets 16

OTC market model solution
Transaction prices are set by Nash bargaining:
Pb = (V o − V b)w + (Mbid−Uo)(1− w)
Ps = (V s − V no)w + (Mask+Uno)(1− w)
Model is non-linear, limiting cases and numerical solutions
For example as N →∞ prices are:
PbN→∞ = Mask +
w
1− wK ,
PsN→∞ = Mbid − w
1− wK .
w1−wK is markup to access interdealer prices
When λ→∞, N∗ = 1 and prices are:
Pbλ→∞ = Mask +
w
1− wK − Uo
λ→∞,
Psλ→∞ = Mbid − w
1− wK + Uno
λ→∞.
Uoλ→∞ and Uno
λ→∞ are discounts due to future business (relationship value)
Terry Hendershott, Dan Li, Dmitry Livdan, Norman Schurhoff Relationship Trading in OTC Markets 17
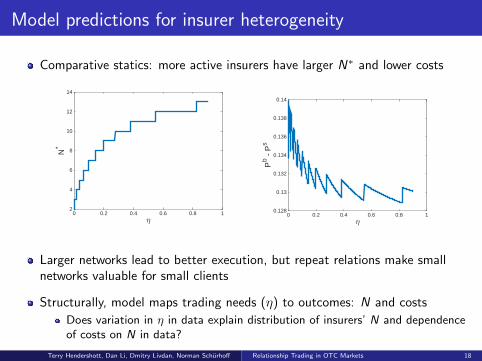
Model predictions for insurer heterogeneity
Comparative statics: more active insurers have larger N∗ and lower costs
20 0.2 0.4 0.6 0.8 1
N*
2
4
6
8
10
12
14
20 0.2 0.4 0.6 0.8 1
Pb -
Ps
0.128
0.13
0.132
0.134
0.136
0.138
0.14
Larger networks lead to better execution, but repeat relations make smallnetworks valuable for small clients
Structurally, model maps trading needs (η) to outcomes: N and costs
Does variation in η in data explain distribution of insurers’ N and dependenceof costs on N in data?
Terry Hendershott, Dan Li, Dmitry Livdan, Norman Schurhoff Relationship Trading in OTC Markets 18
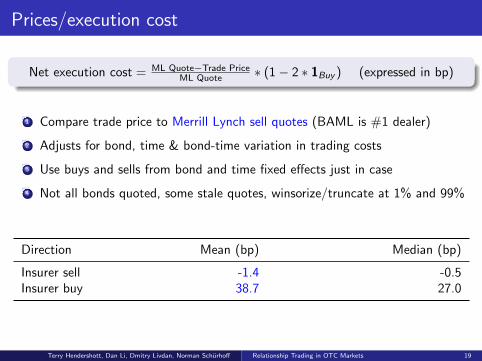
Prices/execution cost
Net execution cost = ML Quote−Trade PriceML Quote ∗ (1− 2 ∗ 1Buy ) (expressed in bp)
1 Compare trade price to Merrill Lynch sell quotes (BAML is #1 dealer)
2 Adjusts for bond, time & bond-time variation in trading costs
3 Use buys and sells from bond and time fixed effects just in case
4 Not all bonds quoted, some stale quotes, winsorize/truncate at 1% and 99%
Direction Mean (bp) Median (bp)
Insurer sell -1.4 -0.5Insurer buy 38.7 27.0
Terry Hendershott, Dan Li, Dmitry Livdan, Norman Schurhoff Relationship Trading in OTC Markets 19

Execution costs and the insurer-dealer network
Determinant (1) (2) (3) (4)
Insurer size -4.89*** -3.72*** -3.59***Insurer no. of dealers -0.37*** -0.22*** 0.32***ln(Insurer no. of dealers) -6.29***
Insurer RBC ratio -3.57*** -0.67 -3.51*** -4.19***Insurer cash-to-assets -0.04** -0.02 -0.04** -0.04**Life insurer 4.66*** 3.32*** 4.43*** 4.47***P&C insurer 2.26*** 2.10*** 1.72** 1.73**r2 0.154 0.154 0.154 0.155N 918,279 918,279 918,279 918,279
Panel regressions with dealer, bond, & day FEs and clustered SEs
Execution costs are smaller for larger insurers and larger networks
Use coefficients in (4) to assess model fit
Terry Hendershott, Dan Li, Dmitry Livdan, Norman Schurhoff Relationship Trading in OTC Markets 20
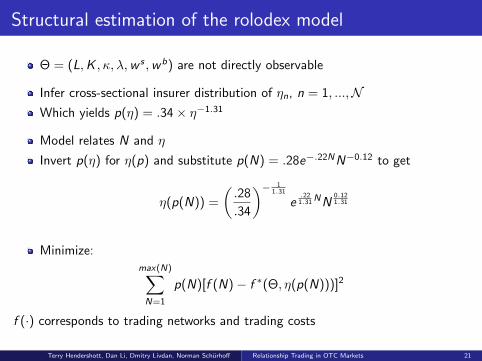
Structural estimation of the rolodex model
Θ = (L,K , κ, λ,w s ,wb) are not directly observable
Infer cross-sectional insurer distribution of ηn, n = 1, ...,NWhich yields p(η) = .34× η−1.31
Model relates N and η
Invert p(η) for η(p) and substitute p(N) = .28e−.22NN−0.12 to get
η(p(N)) =
(.28
.34
)− 11.31
e.22
1.31 NN0.121.31
Minimize:max(N)∑N=1
p(N)[f (N)− f ∗(Θ, η(p(N)))]2
f (·) corresponds to trading networks and trading costs
Terry Hendershott, Dan Li, Dmitry Livdan, Norman Schurhoff Relationship Trading in OTC Markets 21
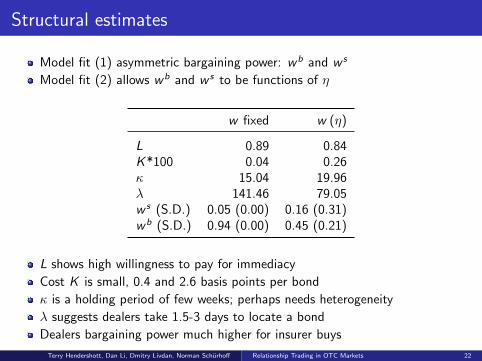
Structural estimates
Model fit (1) asymmetric bargaining power: wb and w s
Model fit (2) allows wb and w s to be functions of η
w fixed w (η)
L 0.89 0.84K*100 0.04 0.26κ 15.04 19.96λ 141.46 79.05w s (S.D.) 0.05 (0.00) 0.16 (0.31)wb (S.D.) 0.94 (0.00) 0.45 (0.21)
L shows high willingness to pay for immediacy
Cost K is small, 0.4 and 2.6 basis points per bond
κ is a holding period of few weeks; perhaps needs heterogeneity
λ suggests dealers take 1.5-3 days to locate a bond
Dealers bargaining power much higher for insurer buys
Terry Hendershott, Dan Li, Dmitry Livdan, Norman Schurhoff Relationship Trading in OTC Markets 22
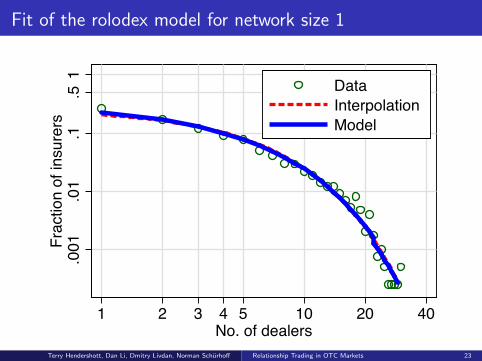
Fit of the rolodex model for network size 1
.001
.01
.1.5
1Fr
actio
n of
insu
rers
1 2 3 4 5 10 20 40No. of dealers
DataInterpolationModel
Terry Hendershott, Dan Li, Dmitry Livdan, Norman Schurhoff Relationship Trading in OTC Markets 23
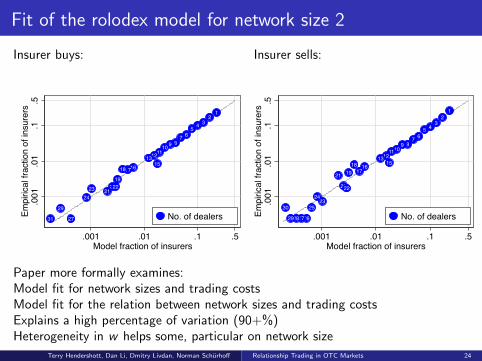
Fit of the rolodex model for network size 2
Insurer buys: Insurer sells:
12
34567
8910111213
15161718
1920
212223
24
27
29
31
.001
.01
.1.5
Empi
rical
frac
tion
of in
sure
rs
.001 .01 .1 .5Model fraction of insurers
No. of dealers
12
345
6789
10111213
1516
1718
19
20
21
22
2324
25
26272829
30
.001
.01
.1.5
Empi
rical
frac
tion
of in
sure
rs
.001 .01 .1 .5Model fraction of insurers
No. of dealers
Paper more formally examines:Model fit for network sizes and trading costsModel fit for the relation between network sizes and trading costsExplains a high percentage of variation (90+%)Heterogeneity in w helps some, particular on network size
Terry Hendershott, Dan Li, Dmitry Livdan, Norman Schurhoff Relationship Trading in OTC Markets 24
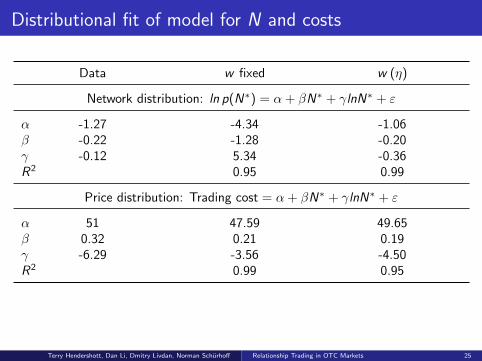
Distributional fit of model for N and costs
Data w fixed w (η)
Network distribution: ln p(N∗) = α + βN∗ + γlnN∗ + ε
α -1.27 -4.34 -1.06β -0.22 -1.28 -0.20γ -0.12 5.34 -0.36R2 0.95 0.99
Price distribution: Trading cost = α + βN∗ + γlnN∗ + ε
α 51 47.59 49.65β 0.32 0.21 0.19γ -6.29 -3.56 -4.50R2 0.99 0.95
Terry Hendershott, Dan Li, Dmitry Livdan, Norman Schurhoff Relationship Trading in OTC Markets 25
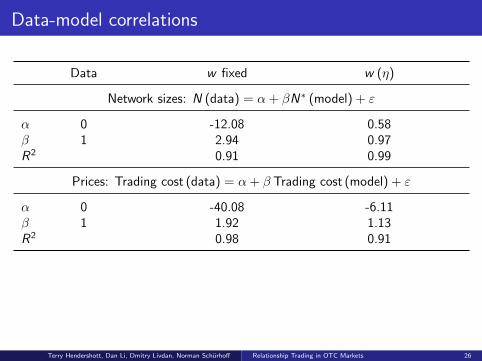
Data-model correlations
Data w fixed w (η)
Network sizes: N (data) = α + βN∗ (model) + ε
α 0 -12.08 0.58β 1 2.94 0.97R2 0.91 0.99
Prices: Trading cost (data) = α + β Trading cost (model) + ε
α 0 -40.08 -6.11β 1 1.92 1.13R2 0.98 0.91
Terry Hendershott, Dan Li, Dmitry Livdan, Norman Schurhoff Relationship Trading in OTC Markets 26

Counterfactual without repeat relations
Use estimated set of parameters, resolve model setting Uo = Uno = 0
-60
-40
-20
020
40Bi
d-as
k sp
read
1 2 3 4 5 10 20 40No. of dealers
ModelCounterfactual
Benefits largely on the sell-side for small clients
Terry Hendershott, Dan Li, Dmitry Livdan, Norman Schurhoff Relationship Trading in OTC Markets 27
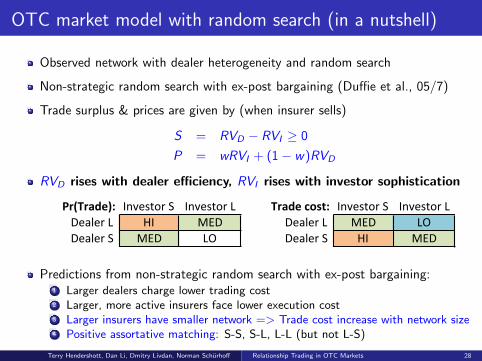
OTC market model with random search (in a nutshell)
Observed network with dealer heterogeneity and random search
Non-strategic random search with ex-post bargaining (Duffie et al., 05/7)
Trade surplus & prices are given by (when insurer sells)
S = RVD − RVI ≥ 0
P = wRVI + (1− w)RVD
RVD rises with dealer efficiency, RVI rises with investor sophistication
Pr(Trade): Investor)S Investor)L Trade*cost: Investor)S Investor)LDealer)L) HI MED Dealer)L) MED LODealer)S) MED LO Dealer)S) HI MED
Predictions from non-strategic random search with ex-post bargaining:1 Larger dealers charge lower trading cost2 Larger, more active insurers face lower execution cost3 Larger insurers have smaller network => Trade cost increase with network size4 Positive assortative matching: S-S, S-L, L-L (but not L-S)
Terry Hendershott, Dan Li, Dmitry Livdan, Norman Schurhoff Relationship Trading in OTC Markets 28

Different model predictions for trading & pricing
Predictions from non-strategic random search with ex-post bargaining:1 Larger dealers charge lower trading costs2 Larger, more active insurers face lower trading costs3 Larger insurers have smaller network => Trade cost increase with network size4 Positive assortative matching: S-S, S-L, L-L (but not L-S)
Pr(Trade): Investor)S Investor)L Trade*cost: Investor)S Investor)LDealer)L) HI MED Dealer)L) MED LODealer)S) MED LO Dealer)S) HI MED
Predictions from Rolodex model:1 Larger dealers charge lower trading costs2 Larger, more active insurers face lower trading costs3 Larger insurers have larger network => Trade cost decrease with network size4 Negative assortative matching: L-L, L-S, S-L (but not S-S)
Pr(Trade): InvestorS InvestorL Tradecost: InvestorS InvestorLDealerL MED Hi DealerL MED LODealerS LO MED DealerS HI MED
Terry Hendershott, Dan Li, Dmitry Livdan, Norman Schurhoff Relationship Trading in OTC Markets 29
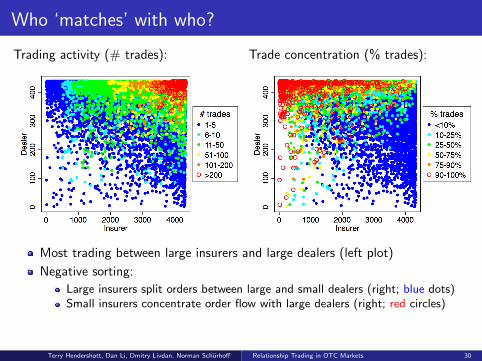
Who ‘matches’ with who?
Trading activity (# trades): Trade concentration (% trades):
Most trading between large insurers and large dealers (left plot)
Negative sorting:
Large insurers split orders between large and small dealers (right; blue dots)Small insurers concentrate order flow with large dealers (right; red circles)
Terry Hendershott, Dan Li, Dmitry Livdan, Norman Schurhoff Relationship Trading in OTC Markets 30
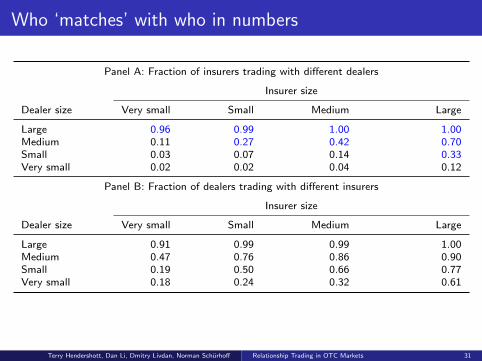
Who ‘matches’ with who in numbers
Panel A: Fraction of insurers trading with different dealers
Insurer size
Dealer size Very small Small Medium Large
Large 0.96 0.99 1.00 1.00Medium 0.11 0.27 0.42 0.70Small 0.03 0.07 0.14 0.33Very small 0.02 0.02 0.04 0.12
Panel B: Fraction of dealers trading with different insurers
Insurer size
Dealer size Very small Small Medium Large
Large 0.91 0.99 0.99 1.00Medium 0.47 0.76 0.86 0.90Small 0.19 0.50 0.66 0.77Very small 0.18 0.24 0.32 0.61
Terry Hendershott, Dan Li, Dmitry Livdan, Norman Schurhoff Relationship Trading in OTC Markets 31

Main results with insurer and dealer heterogeneity
1 Small insurers trade repeatedly with same large dealers at fair prices
2 Large insurers trade with small & large dealers at best prices
0.0
2.0
4.0
6.0
8D
ensi
ty
-25 0 25 50 75 100Net execution cost (bp)
Insurer buyInsurer sell
12
34
56
78
910
Dea
ler d
ecile
1 2 3 4 5 6 7 8 9 10Insurer decile
-10
0
10
20
30
40
50
60
70
Net
exe
cutio
n co
st (b
p)
→ Trade-off between relationship scope and dealer competition
Terry Hendershott, Dan Li, Dmitry Livdan, Norman Schurhoff Relationship Trading in OTC Markets 32
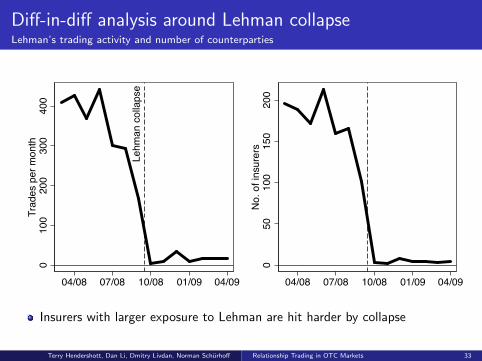
Diff-in-diff analysis around Lehman collapseLehman’s trading activity and number of counterparties
Lehm
an c
olla
pse
010
020
030
040
0Tr
ades
per
mon
th
04/08 07/08 10/08 01/09 04/090
5010
015
020
0N
o. o
f ins
urer
s
04/08 07/08 10/08 01/09 04/09
Insurers with larger exposure to Lehman are hit harder by collapse
Terry Hendershott, Dan Li, Dmitry Livdan, Norman Schurhoff Relationship Trading in OTC Markets 33

Diff-in-diff analysis around Lehman collapseAbnormal execution costs
Insurer sells Insurer buys
Month Control = All Matched All Matched
t − 3 (Jun 08) 41.18 61.74* -17.63 -19.37t − 2 (Jul 08) 51.10 66.92* -38.92 -24.63t − 1 (Aug 08) 0.00 0.00 0.00 0.00Event month t 4.42 33.01 5.10 -11.62t + 1 (Oct 08) 121.59** 126.37* 3.49 -8.61t + 2 (Nov 08) 137.53*** 141.94*** -60.20 -53.72t + 3 (Dec 08) 98.66*** 116.27*** -10.54 -15.77t + 4 (Jan 09) 47.80 73.68 103.33** 94.76*t + 5 (Feb 09) 24.42 68.83** -52.27 -58.17t + 6 (Mar 09) 11.51 13.48 18.38 0.04
Treatment sample: Insurers with large exposure to Lehman before collapse
Large exposure = Lehman share in 2007 in top 1% of all insurers (43%+)
Control sample: Insurers propensity score matched on size, risk-based capital,cash-to-assets, credit rating, insurer type (health, life, P&C), averageexecution costs & trading frequency in 2007
Terry Hendershott, Dan Li, Dmitry Livdan, Norman Schurhoff Relationship Trading in OTC Markets 34
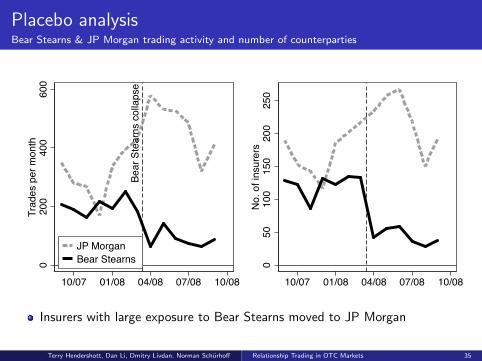
Placebo analysisBear Stearns & JP Morgan trading activity and number of counterparties
Bear
Ste
arns
col
laps
e
020
040
060
0Tr
ades
per
mon
th
10/07 01/08 04/08 07/08 10/08
JP MorganBear Stearns 0
5010
015
020
025
0N
o. o
f ins
urer
s
10/07 01/08 04/08 07/08 10/08
Insurers with large exposure to Bear Stearns moved to JP Morgan
Terry Hendershott, Dan Li, Dmitry Livdan, Norman Schurhoff Relationship Trading in OTC Markets 35
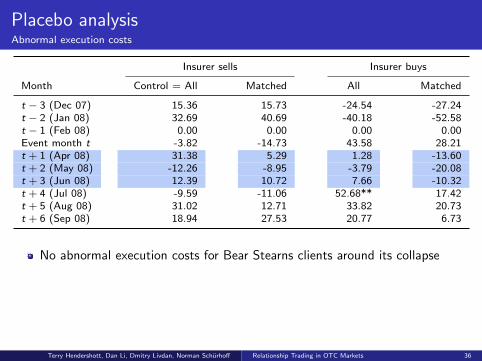
Placebo analysisAbnormal execution costs
Insurer sells Insurer buys
Month Control = All Matched All Matched
t − 3 (Dec 07) 15.36 15.73 -24.54 -27.24t − 2 (Jan 08) 32.69 40.69 -40.18 -52.58t − 1 (Feb 08) 0.00 0.00 0.00 0.00Event month t -3.82 -14.73 43.58 28.21t + 1 (Apr 08) 31.38 5.29 1.28 -13.60t + 2 (May 08) -12.26 -8.95 -3.79 -20.08t + 3 (Jun 08) 12.39 10.72 7.66 -10.32t + 4 (Jul 08) -9.59 -11.06 52.68** 17.42t + 5 (Aug 08) 31.02 12.71 33.82 20.73t + 6 (Sep 08) 18.94 27.53 20.77 6.73
No abnormal execution costs for Bear Stearns clients around its collapse
Terry Hendershott, Dan Li, Dmitry Livdan, Norman Schurhoff Relationship Trading in OTC Markets 36

Conclusions #1: Who trades with who?
.000
01.0
001
.001
.01
.1.5
1Fr
actio
n of
insu
rers
1 2 3 4 5 10 20 40No. of dealers
12
34
56
78
910
Dea
ler d
ecile
1 2 3 4 5 6 7 8 9 10Insurer decile
0.00.10.20.30.40.50.60.70.80.91.0
Pr(T
rade
)
Insurers’ Trading Network
Investors form few long-lasting dealer relationships50% of insurers trade repeatedly with 1 dealer (up to 40 dealers every month)Buy & sell from same dealer => No ‘random’ best-execution searchLarger, higher quality, more active insurers have larger dealer network
Sorting/matching: small-large, large-large & large-small, rarely small-small
Terry Hendershott, Dan Li, Dmitry Livdan, Norman Schurhoff Relationship Trading in OTC Markets 37

Conclusions #2: Relations matter for trading costs
0.0
2.0
4.0
6.0
8D
ensi
ty
-25 0 25 50 75 100Net execution cost (bp)
Insurer buyInsurer sell
12
34
56
78
910
Dea
ler d
ecile
1 2 3 4 5 6 7 8 9 10Insurer decile
-10
0
10
20
30
40
50
60
70
Net
exe
cutio
n co
st (b
p)
Insurers’ Trading Costs
Trading costs are relationship specific:Large dealers give better execution than small dealers => Dealer efficiencySmall insurers with single large dealer receive fair execution => Repeat relation effectLarge insurers with large network receive best execution => Competitive effect
Consistent with Rolodex model of OTC markets
Terry Hendershott, Dan Li, Dmitry Livdan, Norman Schurhoff Relationship Trading in OTC Markets 38

Summary & conclusions
Relationships matter for trading patterns in OTC markets
Persistence & assortative matching in insurer-dealer networksExecution costs depend on investor, dealer, network size & relations
Small insurers concentrate on a few dealers & receive decent (poor)execution from large (small) dealers
Large insurers with many connections receive best execution from all dealers
Qualitatively and quantitatively consistent with Rolodex model where insurerstrade off repeat relations with competition
Client heterogeneity is importantElements of random-search models can describe data wellAsymmetry in bargaining power, reasonable? Nash bargaining?
How would regulations affect repeat business relations?
Terry Hendershott, Dan Li, Dmitry Livdan, Norman Schurhoff Relationship Trading in OTC Markets 39