relationships among structures of different fields variance (eof… · 2015-03-23 · relationships...
TRANSCRIPT
Analysis of structure in datasets
Goal: objectively determine the structure and the relationships among structures of different fields Main tool: solve eigenvectors and eigenvalues of the variance (EOF) or covariance (MCA) matrix Methodologies: • Univariate analysis: Principle component analysis (PCA),
Empirical Orthogonal functions (EOF), rotated EOF, complex EOF, singular value decomposition (SVD),
• Multivariate analyses: Maximum covariance analysis (MCA, SVD applied to two variable fields), Canonical correlation analysis CCA), multivariate EOFs
• References: Hartmann’s notes, Wallace’s notes, ??
� Empirical Orthogonal Function (EOF): seeks structures that explain the maximum amount of variance in a two-dimensional data set. One dimension in the data set represents the dimension (e.g., spatial) in which we are seeking to find structure (EOFs), and the other dimension (e.g., time) represents the dimension in which realizations of this structure are sampled (the Principal Components or PC’s), and they are related one-to-one to the EOF’s . Both sets of structures are orthogonal in their own dimension.
� Rotated EOF: Sometimes it is helpful to use linear combination of several EOF modes to produce more compact or physically appealing structures, a process called rotation of EOF’s. This approach may produce the EOFs that no longer orthogonalities.
� Complex EOF: Complex EOF can more effectively capture the structure of non-stationary periodic variations or two orthogonal variables (e.g., zonal or merdional velocity) in a fewer modes In this case, the inputs are complex number:
x(i,j,t) = re[x(i,j,t)]+i Im[x(I,j,t)] or x(I,j,t)=u(i,j,t)+ i v (i,j,t)
The EOFs consists of real and imaginary parts.
Commonly used univariate EOF methods:
A quick review of Matrix algebra
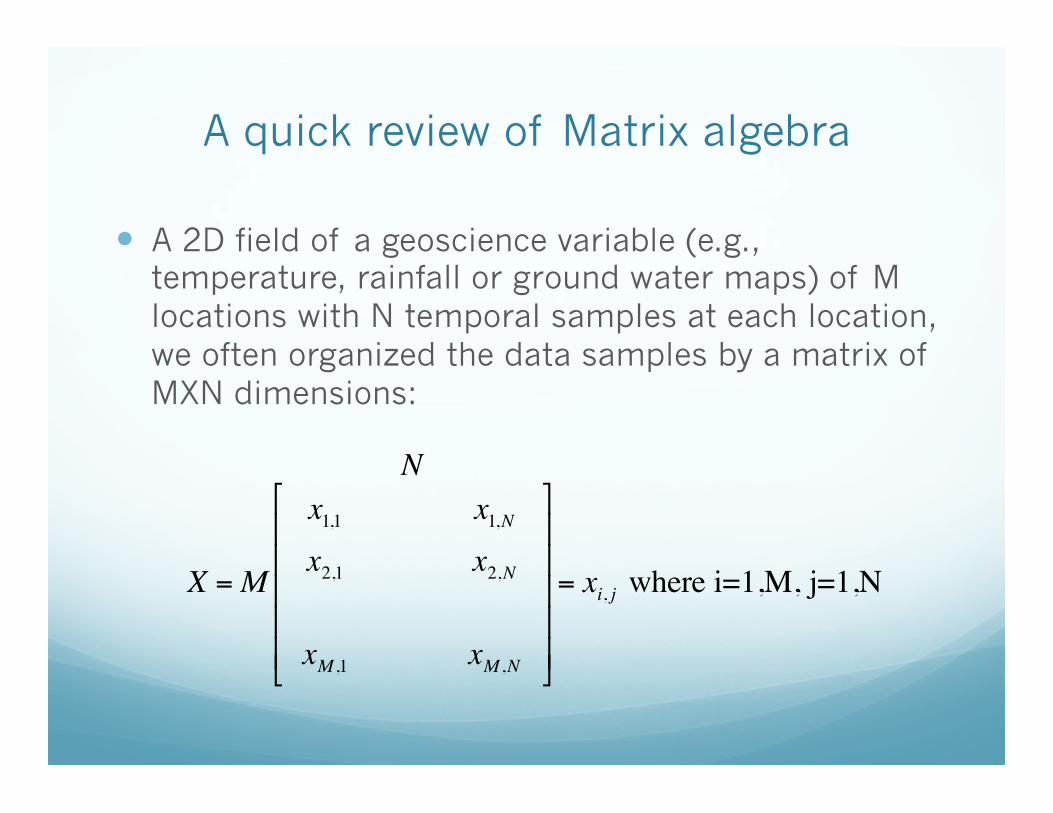
� A 2D field of a geoscience variable (e.g., temperature, rainfall or ground water maps) of M locations with N temporal samples at each location, we often organized the data samples by a matrix of MXN dimensions:
X =M
x1,1 x1,N
x2,1 x2,N
xM ,1 xM ,N
!
"
#####
$
%
&&&&&
N
= xi, j where i=1,M, j=1,N

� The transpose of [X] is
[X]T = N
x1,1 x1,M
x2,1 x2,M
xN ,1 xN ,M
!
"
#####
$
%
&&&&&
M
= x j,i where i=1,M, j=1,N
[X][X]T =M
x1,1 x1,M
x2,1 x2,M
xM ,1 xM ,M
!
"
#####
$
%
&&&&&
M
, [X]T [X]= N
x1,1 x1,N
x2,1 x2,N
xN ,1 xN ,N
!
"
#####
$
%
&&&&&
N
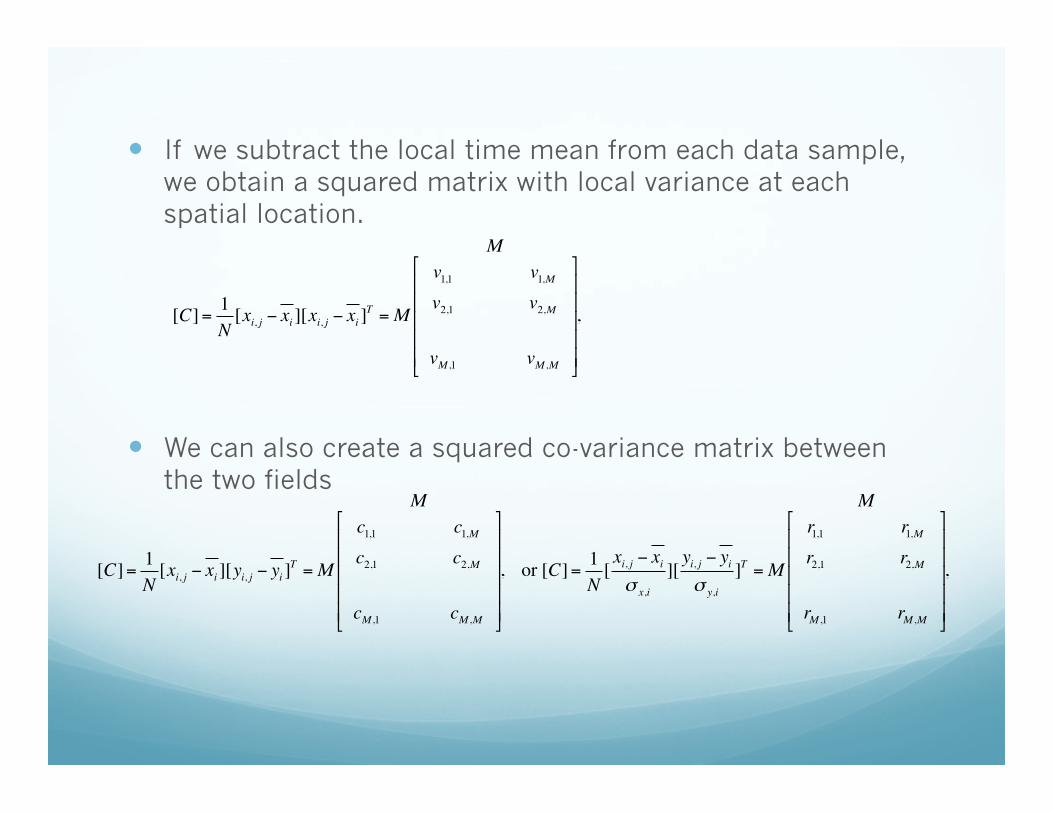
� If we subtract the local time mean from each data sample, we obtain a squared matrix with local variance at each spatial location.
� We can also create a squared co-variance matrix between the two fields
[C]= 1
N[xi, j − xi ][yi, j − yi ]
T =M
c1,1 c1,M
c2,1 c2,M
cM ,1 cM ,M
"
#
$$$$$
%
&
'''''
M
, or [C]= 1N
[xi, j − xiσ x,i
][yi, j − yiσ y,i
]T =M
r1,1 r1,M
r2,1 r2,M
rM ,1 rM ,M
"
#
$$$$$
%
&
'''''
M
,
[C]= 1N
[xi, j − xi ][xi, j − xi ]T =M
v1,1 v1,M
v2,1 v2,M
vM ,1 vM ,M
"
#
$$$$$
%
&
'''''
M
,
What is EOF analysis?
EOF is to solve the eigenvectors and eigenvalues of the variance matrix and arrange them from the highest eigenvalue to the lowest. In doing so, EOF decomposes the field of variance (e.g., spatial map of the variance) into a series modes (eigenvectors) and their projection on the sample space (e.g., time) as the principle components.
EOF does not require a priori hypothesis based on some probability distribution and, hence, no statistical test. Further, EOF analysis is not based on physical principles. Rather, a field is partitioned into mathematically orthogonal (independent) modes which sometimes may be interpreted as atmospheric and oceanographic modes ('structures').
EOF analyses:
How does it work?
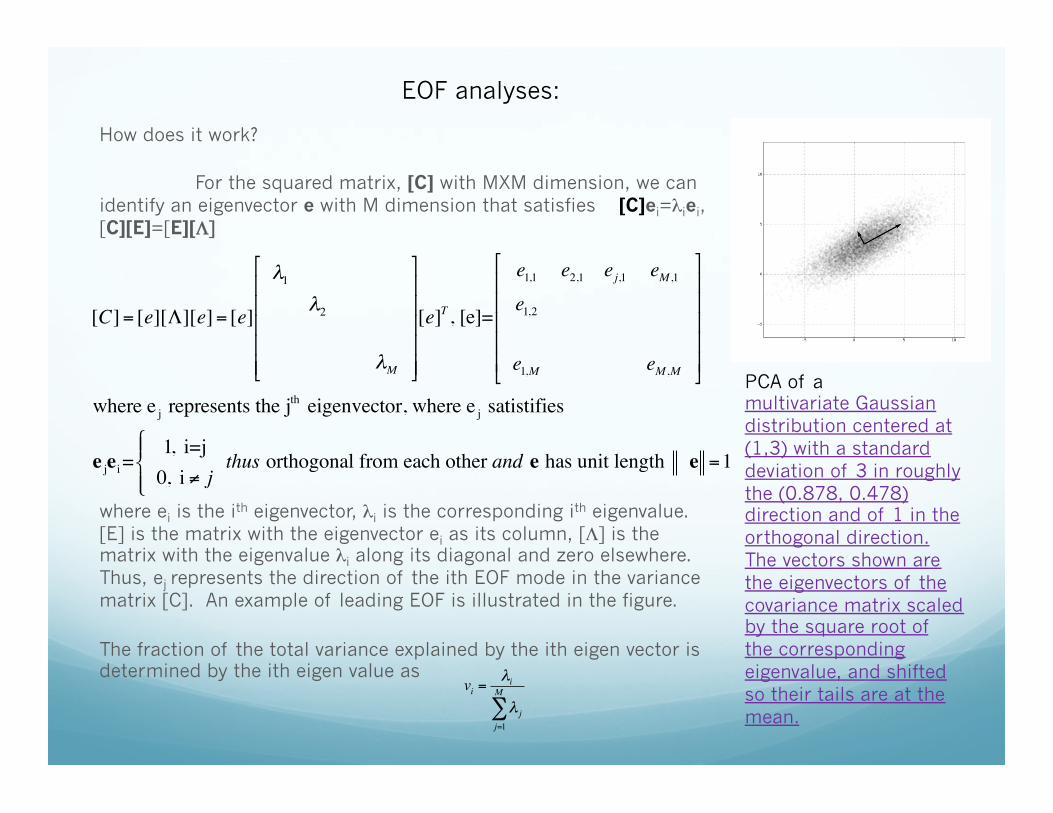
For the squared matrix, [C] with MXM dimension, we can identify an eigenvector e with M dimension that satisfies [C]ei=λiei, [C][E]=[E][Λ]
where ei is the ith eigenvector, λi is the corresponding ith eigenvalue. [E] is the matrix with the eigenvector ei as its column, [Λ] is the matrix with the eigenvalue λi along its diagonal and zero elsewhere. Thus, ej represents the direction of the ith EOF mode in the variance matrix [C]. An example of leading EOF is illustrated in the figure.
The fraction of the total variance explained by the ith eigen vector is determined by the ith eigen value as
EOF analyses:
[C]= [e][Λ][e]= [e]
λ1
λ2
λM
"
#
$$$$$
%
&
'''''
[e]T , [e]=
e1,1 e2,1 ej,1 eM ,1
e1,2
e1,M eM ,M
"
#
$$$$$
%
&
'''''
where e j represents the jth eigenvector, where e j satistifies
e jei =1, i=j
0, i ≠ j
)*+
,+thus orthogonal from each other and e has unit length e =1
PCA of a multivariate Gaussian distribution centered at (1,3) with a standard deviation of 3 in roughly the (0.878, 0.478) direction and of 1 in the orthogonal direction. The vectors shown are the eigenvectors of the covariance matrix scaled by the square root of the corresponding eigenvalue, and shifted so their tails are at the mean.
vi =λi
λ jj=1
M
∑
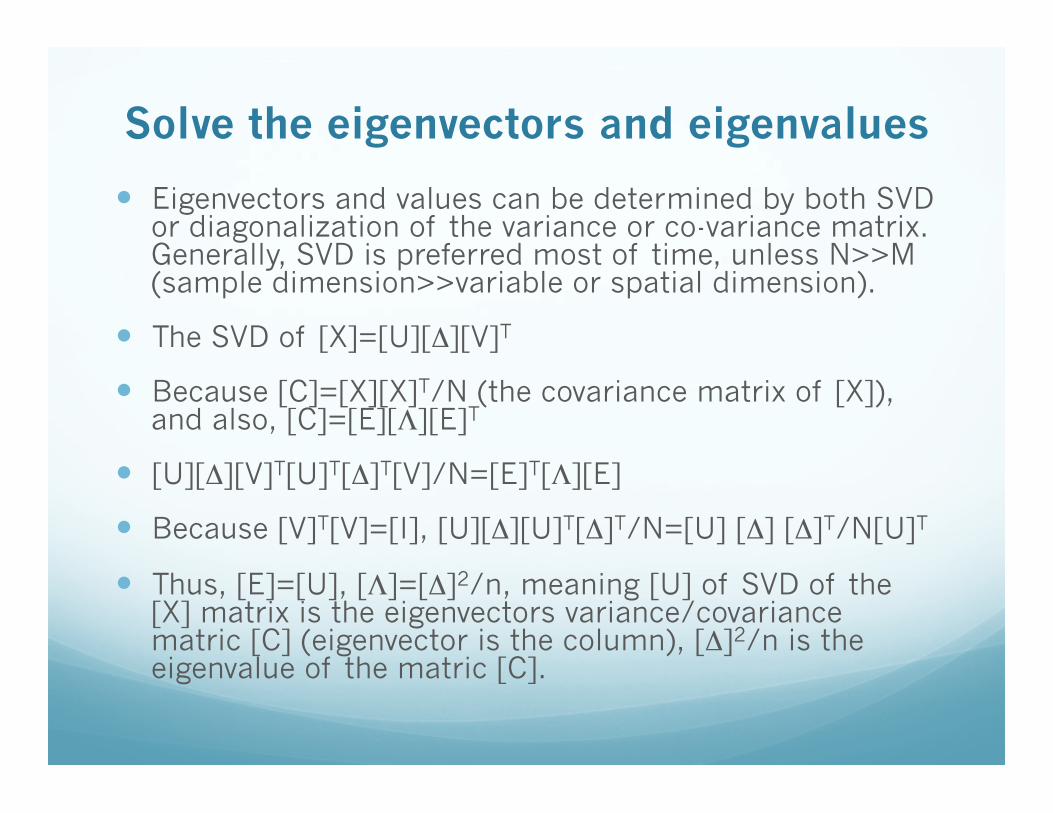
Solve the eigenvectors and eigenvalues
� Eigenvectors and values can be determined by both SVD or diagonalization of the variance or co-variance matrix. Generally, SVD is preferred most of time, unless N>>M (sample dimension>>variable or spatial dimension).
� The SVD of [X]=[U][Δ][V]T
� Because [C]=[X][X]T/N (the covariance matrix of [X]), and also, [C]=[E][Λ][E]T
� [U][Δ][V]T[U]T[Δ]T[V]/N=[E]T[Λ][E]
� Because [V]T[V]=[I], [U][Δ][U]T[Δ]T/N=[U] [Δ] [Δ]T/N[U]T
� Thus, [E]=[U], [Λ]=[Δ]2/n, meaning [U] of SVD of the [X] matrix is the eigenvectors variance/covariance matric [C] (eigenvector is the column), [Δ]2/n is the eigenvalue of the matric [C].
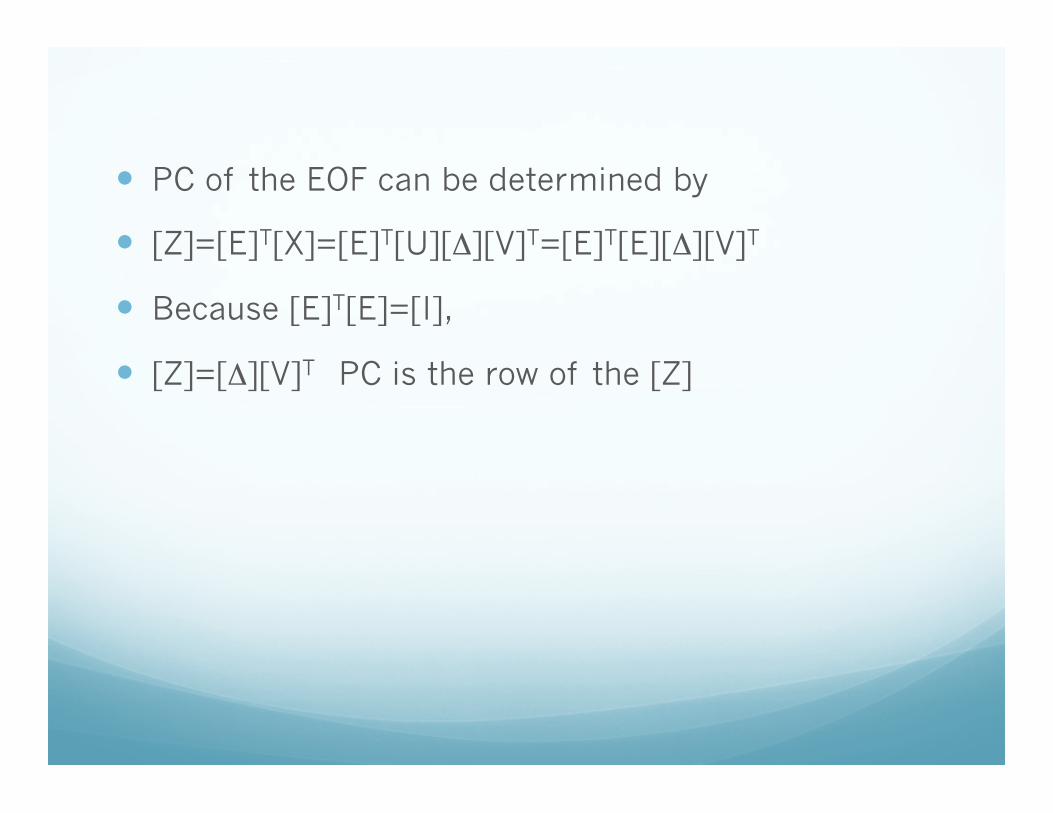
� PC of the EOF can be determined by
� [Z]=[E]T[X]=[E]T[U][Δ][V]T=[E]T[E][Δ][V]T
� Because [E]T[E]=[I],
� [Z]=[Δ][V]T PC is the row of the [Z]
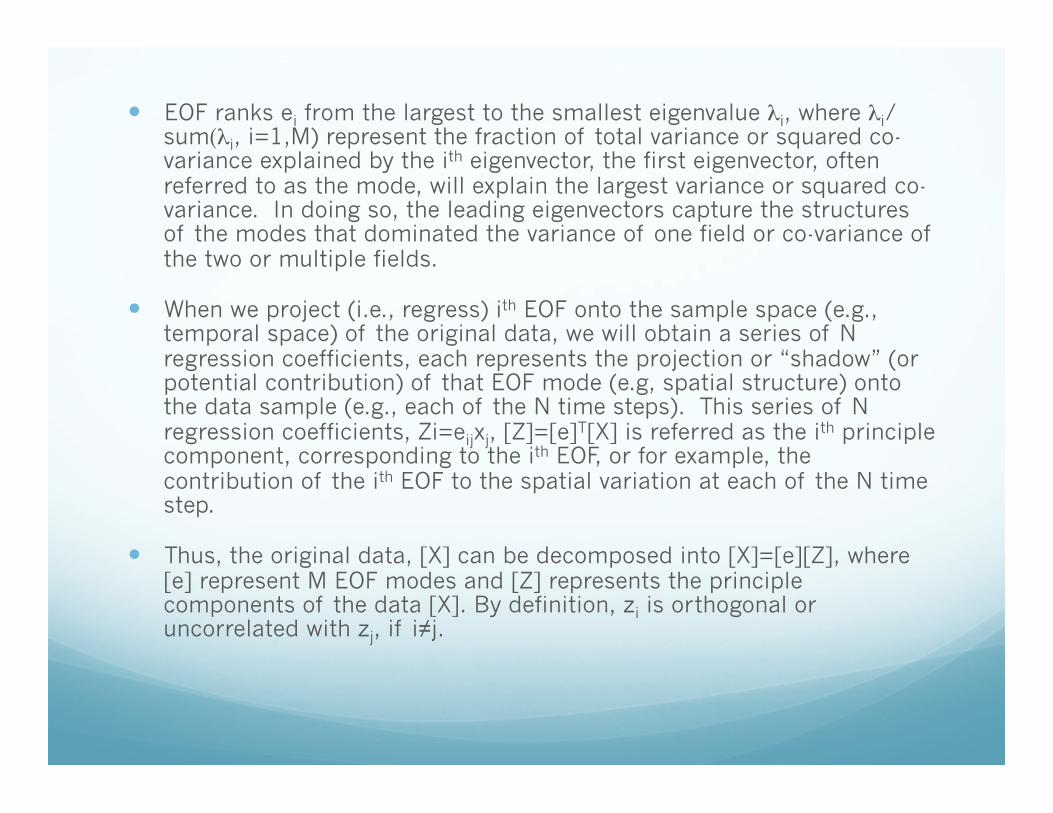
� EOF ranks ei from the largest to the smallest eigenvalue λi, where λi/sum(λi, i=1,M) represent the fraction of total variance or squared co-variance explained by the ith eigenvector, the first eigenvector, often referred to as the mode, will explain the largest variance or squared co-variance. In doing so, the leading eigenvectors capture the structures of the modes that dominated the variance of one field or co-variance of the two or multiple fields.
� When we project (i.e., regress) ith EOF onto the sample space (e.g., temporal space) of the original data, we will obtain a series of N regression coefficients, each represents the projection or “shadow” (or potential contribution) of that EOF mode (e.g, spatial structure) onto the data sample (e.g., each of the N time steps). This series of N regression coefficients, Zi=eijxj, [Z]=[e]T[X] is referred as the ith principle component, corresponding to the ith EOF, or for example, the contribution of the ith EOF to the spatial variation at each of the N time step.
� Thus, the original data, [X] can be decomposed into [X]=[e][Z], where [e] represent M EOF modes and [Z] represents the principle components of the data [X]. By definition, zi is orthogonal or uncorrelated with zj, if i≠j.
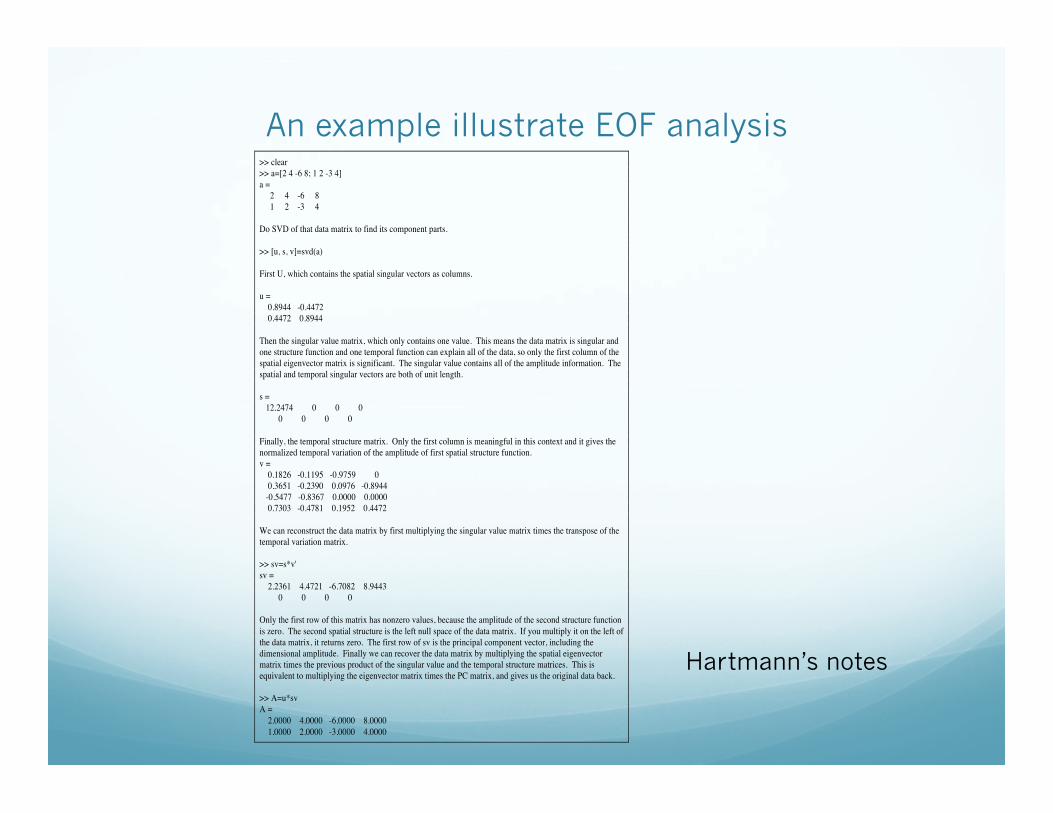
An example illustrate EOF analysis ATM 552 Notes: Matrix Methods: EOF, SVD, ETC. D.L.Hartmann Page 79
Copyright Dennis L. Hartmann 2013 1/2/13 10:35 AM 79
>> clear >> a=[2 4 -6 8; 1 2 -3 4] a = 2 4 -6 8 1 2 -3 4 Do SVD of that data matrix to find its component parts. >> [u, s, v]=svd(a) First U, which contains the spatial singular vectors as columns. u = 0.8944 -0.4472 0.4472 0.8944 Then the singular value matrix, which only contains one value. This means the data matrix is singular and one structure function and one temporal function can explain all of the data, so only the first column of the spatial eigenvector matrix is significant. The singular value contains all of the amplitude information. The spatial and temporal singular vectors are both of unit length. s = 12.2474 0 0 0 0 0 0 0 Finally, the temporal structure matrix. Only the first column is meaningful in this context and it gives the normalized temporal variation of the amplitude of first spatial structure function. v = 0.1826 -0.1195 -0.9759 0 0.3651 -0.2390 0.0976 -0.8944 -0.5477 -0.8367 0.0000 0.0000 0.7303 -0.4781 0.1952 0.4472 We can reconstruct the data matrix by first multiplying the singular value matrix times the transpose of the temporal variation matrix. >> sv=s*v' sv = 2.2361 4.4721 -6.7082 8.9443 0 0 0 0 Only the first row of this matrix has nonzero values, because the amplitude of the second structure function is zero. The second spatial structure is the left null space of the data matrix. If you multiply it on the left of the data matrix, it returns zero. The first row of sv is the principal component vector, including the dimensional amplitude. Finally we can recover the data matrix by multiplying the spatial eigenvector matrix times the previous product of the singular value and the temporal structure matrices. This is equivalent to multiplying the eigenvector matrix times the PC matrix, and gives us the original data back. >> A=u*sv A = 2.0000 4.0000 -6.0000 8.0000 1.0000 2.0000 -3.0000 4.0000
Hartmann’s notes
How to present EOFs?
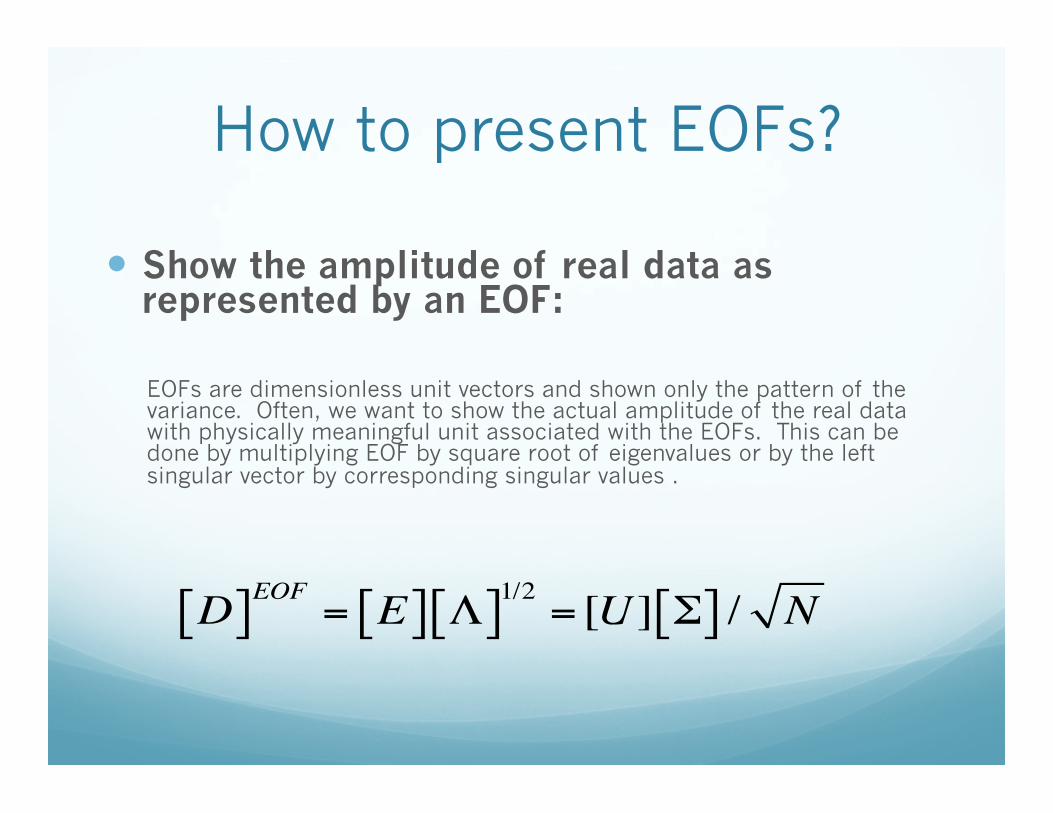
� Show the amplitude of real data as represented by an EOF:
EOFs are dimensionless unit vectors and shown only the pattern of the variance. Often, we want to show the actual amplitude of the real data with physically meaningful unit associated with the EOFs. This can be done by multiplying EOF by square root of eigenvalues or by the left singular vector by corresponding singular values .
D[ ]EOF = E[ ] Λ[ ]1/2 = [U] Σ[ ] / N
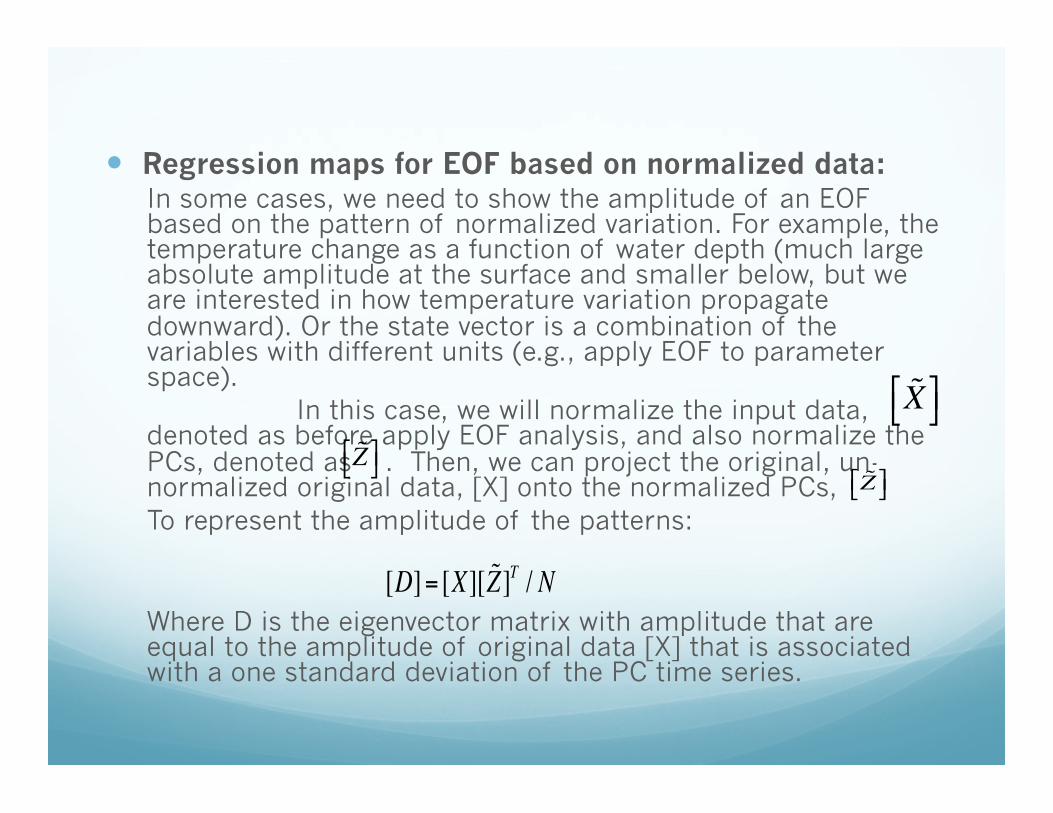
� Regression maps for EOF based on normalized data: In some cases, we need to show the amplitude of an EOF based on the pattern of normalized variation. For example, the temperature change as a function of water depth (much large absolute amplitude at the surface and smaller below, but we are interested in how temperature variation propagate downward). Or the state vector is a combination of the variables with different units (e.g., apply EOF to parameter space).
In this case, we will normalize the input data, denoted as before apply EOF analysis, and also normalize the PCs, denoted as . Then, we can project the original, un-normalized original data, [X] onto the normalized PCs, To represent the amplitude of the patterns: Where D is the eigenvector matrix with amplitude that are equal to the amplitude of original data [X] that is associated with a one standard deviation of the PC time series.
X!" #$Z!" #$ Z!" #$
[D]= [X][ !Z ]T / N
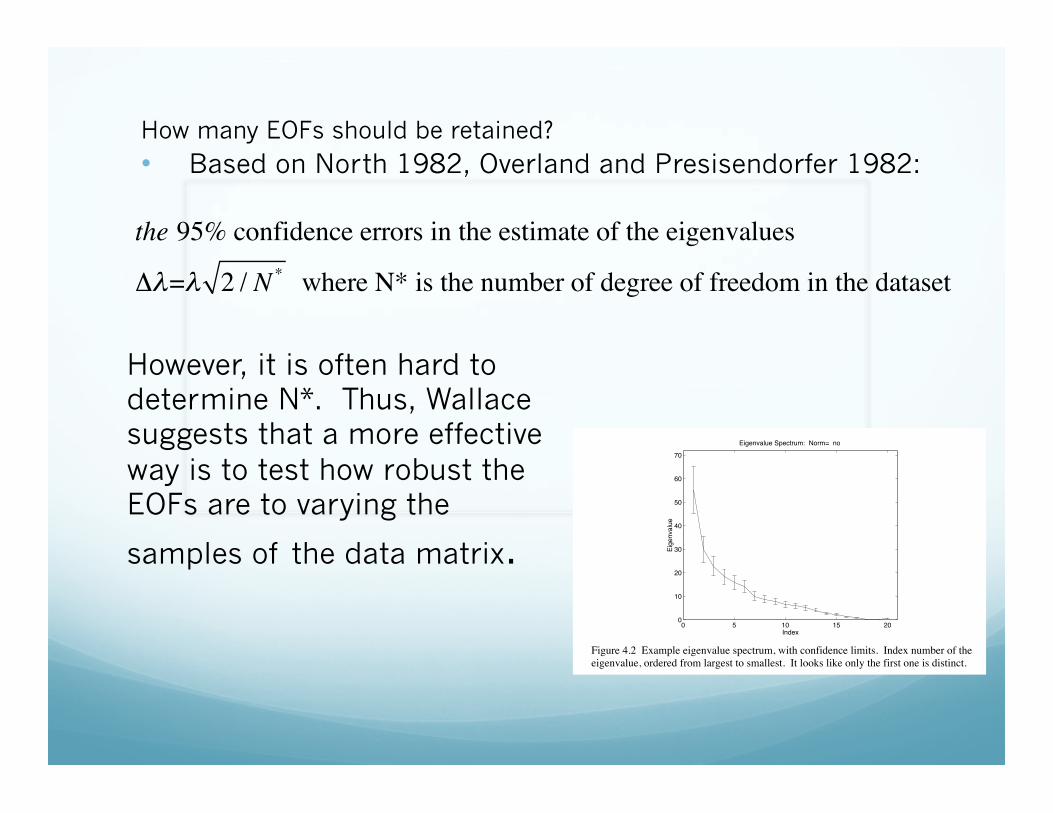
How many EOFs should be retained? • Based on North 1982, Overland and Presisendorfer 1982:
the 95% confidence errors in the estimate of the eigenvalues
Δλ=λ 2 / N * where N* is the number of degree of freedom in the dataset
However, it is often hard to determine N*. Thus, Wallace suggests that a more effective way is to test how robust the EOFs are to varying the
samples of the data matrix.
ATM 552 Notes: Matrix Methods: EOF, SVD, ETC. D.L.Hartmann Page 87
Copyright Dennis L. Hartmann 2013 1/2/13 10:35 AM 87
significant. Usually we would look for a place in the eigenvalue spectrum where it levels off so that successive eigenvalues are indistinguishable. We would not consider any eigenvectors beyond this point as being special.
0 5 10 15 200
10
20
30
40
50
60
70
Eigenvalue Spectrum: Norm= no
Index
Eige
nval
ue
Figure 4.2 Example eigenvalue spectrum, with confidence limits. Index number of the eigenvalue, ordered from largest to smallest. It looks like only the first one is distinct.
In the above example only the first eigenvalue is different from the others
according to the North et al. criterion indicated by the error bars on the eigenvalue estimates. The second and third eigenvalues are indistinguishable, so you want to think carefully about how you interpret their structures, or just don’t. Since their eigenvalues are the same to within the statistical uncertainty, any linear combination of the two eigenvectors is just as significant as the eigenvectors individually. Lag correlation analysis of the principal components will sometimes show that pairs of eigenvectors are in phase quadrature in time, which may indicate that they represent a propagating structure. 4.9 Interpretation of EOFs In interpreting EOFs one must remember exactly what they are. They are mathematical constructs that are chosen to represent the variance over the domain of interest as efficiently as possible, and also be orthogonal with each other. Sometimes these mathematical constraints will select out scientifically interesting structures in a data set, but not always. EOF analysis will always pick out some structures that represent more of the variance than the others will, and they will always tend to look wavelike, because they are constrained to be orthogonal. If you put white or slightly red noise through EOF analysis, it will produce structures that resemble the Fourier modes for the