relationships among transactional distance variables in - auspace
TRANSCRIPT
i
ATHABASCA UNIVERSITY
RELATIONSHIPS AMONG TRANSACTIONAL DISTANCE
VARIABLES IN ASYNCHRONOUS COMPUTER
CONFERENCES: A CORRELATIONAL STUDY
BY
DERRICK FORCE
A thesis submitted to the
Athabasca University Governing Council in partial fulfillment
Of the requirements for the degree of
MASTER OF DISTANCE EDUCATION
Athabasca, Alberta
July, 2004

iii
DEDICATION
This work is dedicated to my family, whose support was instrumental to the completion
of my studies.
iv
ABSTRACT
The purpose of this exploratory study with quantitative data was to examine the
relationships, in the context of computer-mediated asynchronous conferences, among
indicators for the main variables in Moore’s Theory of Transactional Distance. It also
examined the relationships between indicators for transactional distance and students’
learning success in classes that utilized the conferences. Participants in the study were
students enrolled in distance education courses at a major distance education university in
Canada in the fall term of 2002. All participants were volunteers. They completed a
questionnaire to describe their perceptions of dialogue, course structure, transactional
distance, and their autonomy in their courses. Results of this study partially supported the
predicted relationships between variables. Results inconsistent with theory were in the form
of correlations too small to be statistically significant rather than being of opposite sign.
There was a relatively high proportion of statistically significant correlations between
dialogue and transactional distance; they showed high dialogue corresponded with low
transactional distance. Structure variables separated into two groups; one appeared unrelated
to transactional distance and the other showed positive correlations with it. There were few
significant correlations between autonomy and transactional distance, autonomy and
structure, or structure and dialogue indicators. One group of dialogue indicators showed a
high proportion of significant correlations with autonomy indicators, all of which were
positive; the rest showed very few. There were no significant correlations between
transactional distance and student learning success indicators. The results of this study were
consistent with Moore’s statement that dialogue, structure, autonomy and transactional
distance refer to clusters of variables.
v
TABLE OF CONTENTS
Page
CHAPTER I – INTRODUCTION...................................................................................1
Purpose of the Study ....................................................................................................1
The Research Problem .................................................................................................1
Theoretical Basis of the Study .....................................................................................2
Significance..................................................................................................................4
Research Questions ......................................................................................................5
Limitations ...................................................................................................................6
Delimitations ................................................................................................................7
Definition of Terms......................................................................................................8
CHAPTER II - REVIEW OF RELATED LITERATURE..............................................9
Introduction ..................................................................................................................9
Literature Review.........................................................................................................9
Studies Involving Technologies Other Than Computer Conferences ................9
Studies Involving Computer Conferences ..........................................................13
Summary.............................................................................................................17
Connection of the Present Study to the Literature .......................................................18
CHAPTER III – METHODOLOGY ...............................................................................20
Participants ...................................................................................................................20
Instrument.....................................................................................................................21
Design...........................................................................................................................22
Procedure......................................................................................................................22
vi
Pilot Study ..........................................................................................................22
Research Study ...................................................................................................23
Data Analysis......................................................................................................24
CHAPTER 1V – RESULTS ............................................................................................26
Descriptive Statistics ....................................................................................................26
Dialogue Indicator Ratio Variables ....................................................................27
Dialogue Likert Scale Variables.........................................................................29
Structure Indicator Variables..............................................................................30
Transactional Distance Indicator Variables........................................................30
Student Autonomy Indicator Variables ..............................................................31
Additional Information Variables.......................................................................31
Inferential Statistics......................................................................................................33
Factor Analysis of Conference Dialogue Indicators...........................................34
Within-group Correlations..................................................................................36
Correlation of Dialogue and Structure Indicators...............................................37
Correlation of Dialogue and Transactional Distance Indicators.........................39
Correlation of Dialogue and Autonomy Indicators ............................................40
Correlation of Structure and Transactional Distance Indicators.........................43
Correlation of Structure and Autonomy Indicators ............................................44
Correlation of Transactional Distance and Autonomy Indicators ......................46
Correlation of Transactional Distance Indicators and Grade .............................47
Correlation of Theory Variable Indicators with Additional Information ...........47
vii
Chi-square Test of Independence of Theory Variable Indicators from
Additional Information .......................................................................................49
CHAPTER V - CONCLUSIONS AND RECOMMENDATIONS.................................51
Summary of Results .....................................................................................................51
Comparison to Results of Previous Studies .................................................................52
Answers to Research Questions ...................................................................................59
Significance and Implications of Results .....................................................................61
Recommendations for Further Research ......................................................................68
REFERENCES ................................................................................................................71
APPENDIX A..................................................................................................................75
Pilot Survey Recruitment Letter...................................................................................75
Survey Recruitment Letter ...........................................................................................76
Pilot Survey Cover Letter.............................................................................................77
Survey Cover Letter .....................................................................................................78
APPENDIX B ..................................................................................................................79
Questionnaire ...............................................................................................................79
APPENDIX C ..................................................................................................................83
Dialogue Indicator Variable Frequency Distributions .................................................83
Structure Indicator Variable Frequency Distributions .................................................88
Transactional Distance Indicator Variable Frequency Distributions ...........................89
Student Autonomy Indicator Variable Frequency Distributions..................................90
Additional Information Variable Frequency Distributions ..........................................92
APPENDIX D..................................................................................................................95

viii
APPENDIX E ..................................................................................................................98
APPENDIX F...................................................................................................................102
ix
LIST OF TABLES
Page
1. Dialogue Ratio Variable Means, Standard Deviations .........................................28
2. Dialogue Ordinal Variable Medians, Modes ...............................................................29
3. Structure Variable Medians, Modes ............................................................................30
4. Transactional Distance Variable Medians, Modes ......................................................30
5. Student Autonomy Variable Medians, Modes.............................................................31
6. Dialogue Correlations with Course Structure ..............................................................38
7. Dialogue Correlations with Transactional Distance ....................................................40
8. Dialogue Correlations with Independence...................................................................41
9. Dialogue Correlations with Interdependence...............................................................42
10. Structure Correlations with Transactional Distance ..................................................44
11. Structure Correlations with Independence.................................................................45
12. Structure Correlations with Interdependence.............................................................46
13. Student Autonomy Correlations with Transactional Distance...................................47
C1. Frequency Distribution of Dialogue Variable 01......................................................83
C2. Frequency Distribution of Dialogue Variable 02......................................................83
C3. Frequency Distribution of Dialogue Variable 03......................................................83
C4. Frequency Distribution of Dialogue Variable 04......................................................84
C5. Frequency Distribution of Dialogue Variable 05......................................................84
C6. Frequency Distribution of Dialogue Variable 06......................................................84
C7. Frequency Distribution of Dialogue Variable 07......................................................84
C8. Frequency Distribution of Dialogue Variable 08......................................................84
x
C9. Frequency Distribution of Dialogue Variable 9........................................................85
C10. Frequency Distribution of Dialogue Variable 10....................................................85
C11. Frequency Distribution of Dialogue Variable 11....................................................85
C12. Frequency Distribution of Dialogue Variable 12....................................................85
C13. Frequency Distribution of Dialogue Variable 13....................................................85
C14. Frequency Distribution of Dialogue Variable 14....................................................86
C15. Frequency Distribution of Dialogue Respectful and Effective Communication
Variables ..........................................................................................................................86
C16. Frequency Distribution of Dialogue Conference Technology Satisfaction
Variables ..........................................................................................................................87
C17. Frequency Distribution of Course Structure Flexibility Variables .........................88
C18. Frequency Distribution of Transactional Distance Variables .................................89
C19. Frequency Distribution of Independence Variables................................................90
C20. Frequency Distribution of Interdependence Variables............................................91
C21. Frequency Distribution of Technology Skill, Course Knowledge, Accessibility ...92
C22. Frequency Distribution of Number of Prior Courses ..............................................92
C23. Frequency Distribution of Gender...........................................................................93
C24. Frequency Distribution of Student Status ...............................................................93
C25. Frequency Distribution of Age Group ....................................................................93
C26. Frequency Distribution of Grade.............................................................................93
D1. Principal Component Extraction Initial Result .........................................................95
D2. Principal Component Three Component Result .......................................................96
D3. Rotated Component Matrix.......................................................................................96
xi
D4. Component Score Coefficient Matrix .......................................................................97
E1. Dialogue Ratio Variable Correlations .......................................................................98
E2. Dialogue Ratio and Ordinal Variable Correlations ...................................................98
E3. Dialogue Ordinal Variable Correlations....................................................................99
E4. Structure Variable Correlations.................................................................................100
E5. Interdependence Variable Correlations .....................................................................100
E6. Independence Variable Correlations .........................................................................101
E7. Independence with Interdependence Variable Correlations......................................101
F1. Theory Variable Correlations with Additional Information Variables......................102
F2. Chi-square Test Statistics for Gender ........................................................................104
F3. Chi-square Test Statistics for Student Status.............................................................106
F4. Chi-square Test Statistics for Age Group..................................................................108
1
CHAPTER I
INTRODUCTION
Purpose of the Study
This exploratory study with quantitative data examined the relationships, in the context
of computer-mediated asynchronous conferences, among indicators for the main variables in
Moore’s (1993) Theory of Transactional Distance. It also examined the relationships between
indicators for transactional distance and students’ learning success in classes that utilized the
conferences. The purpose of the study was to provide basic information that would form a
starting point for detailed studies of the variables and their interrelationships in this medium.
The Research Problem
Distance education is an expanding field involving a wide range of providers, but some
experts in the field such as Keegan (1993) and Garrison (2000) criticize its weak theoretical
base. The Theory of Transactional Distance provides, from a background of behaviorist and
humanistic pedagogical traditions (Moore, 1993), a theoretical foundation for distance
education practice. Moore presented the theory approximately 30 years ago (Moore, 1973),
when almost all interaction in distance education was between the learner and instructor or
learner and content. Since then there have been many technological developments that enable
much faster and more frequent interaction, not only between learner and instructor but also
between learners (Moore, 1994), and Moore has modified his theory to include new
technology (Moore 1993). Other authors such as Garrison and Baynton (1989) have also
written of changes that Moore acknowledged as being of interest (Moore & Kearsley, 1996).
2
There has been surprisingly little research to verify the theory. There is even less research on
transactional distance in asynchronous computer conferences, which form one facet of
computer-mediated communication (CMC). This mode of communication in distance
education is relatively new, but its use is increasing rapidly (Palloff & Pratt, 1999). The
communication medium is one of the most important elements of a distance education
learning environment (Moore, 1993); it can have a significant effect on interactions between
participants who work in that environment. The central concerns in Moore’s theory are the
learner’s interactions with his or her instructor and with other students in the context of an
educational program. Does the theory accurately predict students’ experiences as they engage
in educational programs supported by asynchronous computer conferences?
Theoretical Basis of the Study
The Theory of Transactional Distance discusses distance education in terms of the
amount and quality of interaction between the learner and instructor, the degree to which an
educational program is adaptable to students’ needs, and the degree to which the learner is
able to make decisions about goals, learning activities, and evaluation of progress. One of the
distinguishing features of distance education is the separation, in space or time or both,
between instructors and learners. This separation creates a “psychological or communication
space” (Moore, 1993) between a learner and instructor or other learner that is a potential
cause of misunderstanding between them. “It is this psychological and communications space
that is the transactional distance” (Moore, 1993). Transactional distance is affected by two
clusters of variables, designated by Moore (1973) as “dialogue” and “structure.”
Dialogue is the positive, purposeful interaction between the two people, as
distinguished from the commonly used term “interaction” which could have a negative,
3
positive, or neutral tone (Moore, 1993). Moore referred to three types of interaction: learner-
content, learner-instructor, and learner-learner (Moore, 1989). Learner-content interaction is
basic to any form of learning. Moore explained that the learner has, with the person who is
the source of the learning material, a virtual dialogue that is equivalent to Holmberg’s
“internal didactic conversation” (Moore & Kearsley, 1996). Learner-instructor interaction
provides the learner with benefits similar to those enjoyed by participants in a conventional
classroom, but in distance education the interaction is mediated by a communications
technology such as telephone or a computer network. Learner-learner interaction was not
available in most early forms of distance education. Application of relatively new
communications technology has made learner-learner interaction straightforward, adding
social learning activities to the choices available to planners. Moore (1996) considered this
development a challenge to educators and educational theorists. The learner may, then,
engage in a virtual dialogue with the source of the learning material, a real dialogue with the
instructor, or a real dialogue with other learners. Transactional distance between the
participants decreases with an increase in dialogue.
Course structure is the degree to which an educational program can be modified to
accommodate individual needs of the learner. "Structure expresses the rigidity or flexibility
of the programme's education objectives, teaching strategies, and evaluation methods”
(Moore, 1993). Transactional distance decreases with a decrease in structure, but not over the
entire range of variability of structure. If structure falls below a level that Moore does not
strictly specify, transactional distance increases. Moore (1990) cites a “wholly self-directed
programme of individual reading” with no dialogue or structure as an example of the most
distant type of program. In other words, there is a smaller psychological or communication
4
gap between learner and instructor or other learners in a program that has a moderate amount
of structure than there is in a program that has either a great deal of structure or no structure.
Learner autonomy is a second dimension in the theory. This term refers to the degree to
which, in the learner/instructor relationship, it is the learner who makes decisions about
goals, learning activities and evaluation (Moore, 1993). In this context it is a quality or
property of the relationship. Moore (1973) also discusses learner autonomy as an attribute of
the learner, which he defines as “The will and ability to exercise powers of learning, to
overcome obstacles for oneself, to try to do difficult learning tasks, and to resist coercion.”
An adult, due to her or his self-image as being a person in control of what they do, should be
an autonomous learner. Moore recognizes, however, that most adults are not completely
autonomous learners and that this influences the role of the teacher. “While only a minority
of adults might be practicing as fully autonomous learners, the obligation on teachers is to
assist them to acquire these skills” (Moore, 1993). He expresses the belief (Moore,
1973,1990) that more distant programs are better suited to more autonomous learners, and
hypothesizes (Moore, 1973, 1996) that autonomous learners would be attracted toward more
distant programs in preference to those less distant.
Significance
This study provides information about relationships between Transactional Distance
Theory variables as they interact in the context of asynchronous computer conferences. There
is a need to understand asynchronous conferences as educational tools because they are
widely used for communication between participants in distance education courses.
Information about relationships between Transactional Distance Theory variables is
significant because that theory is one of a small number of general theories of distance
5
education and is often cited; yet research to support or refute it is sparse. Other studies
involving the theory either have referred to different media or have included only a subset of
its variables. The present study includes indicators for all Transactional Distance Theory
variables.
Many more studies will be required to enrich our understanding, within the framework
of Transactional Distance Theory, of the use of asynchronous conferences for
communication in distance education courses. The results of this study may be used as
preliminary information by other researchers, to suggest directions for their inquiry.
Research Questions
1. Are there statistically significant relationships between indicators of dialogue and
course structure?
2. Are there statistically significant relationships between indicators of dialogue and
student autonomy?
3. Are there statistically significant relationships between indicators of dialogue and
transactional distance?
4. Are there statistically significant relationships between indicators of course
structure and student autonomy?
5. Are there statistically significant relationships between indicators of course
structure and transactional distance?
6. Are there statistically significant relationships between indicators of student
autonomy and transactional distance?
6
7. Are there statistically significant relationships between indicators of transactional
distance and the student learning success variable?
Limitations
The results of this study should not be generalized beyond the study population because
of the study’s limitations. Almost all members of the study population already had a
university degree, so their responses may not have been representative of other groups with
different education levels. Students in the sample were all volunteers. A volunteer group may
not have responded to the questions in the same way as would the study population even if
demographic properties of the two groups were similar.
Limitations of the study also restrict conclusions that may be drawn from the data.
Students in the sample came from more than one class, so instructors rated student success in
achieving different sets of learning outcomes. Conferences were not all managed in the same
way, so there would have been structure-imposed controls on student participation. For
example, some students may have been involved in group projects with an imminent deadline
while others may have been in a break between conference segments during part of the two
week period under study. Many students indicated zero occurrences of sending or observing
messages of various types; this made correlation of the variables less informative than would
have been the case if the data were more evenly distributed. Moore clearly explained the
theory variables, but they were not directly quantifiable. They could only be represented by
proxy or indicator variables and there is no general agreement on what these should be.
Moore (1996) also referred to the theory variables as clusters of variables, indicating their
complex nature. Different choices of indicator variables could have led to important
differences in correlations.
7
Reliability of the study’s results is limited by the sample size. Correlations found in
small samples tend to show more variability from one sample to another than do correlations
found in large samples. Greater variability leads to a greater chance of correlations in the
sample being poor estimates of correlations in the population. Confidence in any inferences
made from results of the study would be improved by use of a larger sample.
Delimitations
Delimitations on the study also constrain attempts to generalize its results beyond the
study population. The survey was restricted to use of a relatively short questionnaire
administered once, with only one pilot study. Each of the theory variables had a relatively
small number of indicator or proxy variables. If there were underlying components that
influenced these indicators, the limited number of questions makes it more difficult to clearly
identify them than would be the case with numerous questions related to each component. To
maximize the survey’s reliability and improve the validity of conclusions drawn from data it
provides (McDonald, 1985), there should be several iterations of improvement. Such a
lengthy treatment is beyond the scope of this study. Therefore, there is more uncertainty in
the results than there would be from a comprehensive study. The limited number of questions
also increased the probability that there were aspects of the theory variables that were not
represented. The use of a Likert type scale for many of the questions limited the type of
statistical analysis that is mathematically defensible, because there are procedures such as
factor analysis that assume interval or ratio scale data. The courses included were all of the
same general type, related to the theory and practice of distance education. Courses of other
types such as mathematics (Anderson, 1999), physics and chemistry may involve different
patterns of theory variable relationships.
8
Definition of terms
Transactional distance is the “psychological and communications space…of potential
misunderstanding between the inputs of the instructor and those of the learner” (Moore,
1993).
Dialogue is “an interaction or series of interactions having positive qualities…; it is
…purposeful, constructive” (Moore, 1993).
Structure is “the extent to which an education programme can accommodate or be
responsive to each learner’s individual needs” (Moore, 1993).
Learner autonomy is “the extent to which … it is the learner rather than the teacher who
determines the goals, the learning experiences, and the evaluation decisions of the learning
programme”(Moore, 1993).
Student learning success is operationally defined as the final grade earned by the
student in the course he or she was studying at the time they completed the questionnaire.
CMC is computer-mediated communication and includes asynchronous conferences, e-
mail, “chat” programs, and data storage and retrieval programs (Ferris, 1997).
9
CHAPTER II
REVIEW OF RELATED LITERATURE
Introduction
Transactional Distance Theory is a general theory of distance education, applicable to
that field in all its forms, yet it is supported by a very limited amount of research. To
aggravate the problem, distance education is more complex now than when the theory was
first introduced. Several electronic communications technologies that were not commonly
available then are now in widespread use. These technologies influence dialogue, course
structure and the degree of autonomy students may exercise. Therefore, there is a growing
need for research to examine education through different technologies in the context of
theory. The literature shows that there is some information available, but it is sparse.
Literature Review
Studies Involving Technologies Other Than Computer Conferences. Saba and Shearer
(1994) used a systems analysis approach to study the dynamic relationships between
dialogue, structure, and transactional distance. Their research involved 30 students selected
from a pool of graduate students. They were individually taught a lesson via a “desktop video
conferencing system.” The researchers recorded all instructional transactions and classified
speech into a range of categories. They concluded from their dialogue analysis and student
responses that increase in dialogue decreases transactional distance and structure, and that
increase in structure increases transactional distance and decreases dialogue, as long as
dialogue starts above a critical minimum level. Their data supported these conclusions. The
10
study was limited by the artificial nature of the learning situation, which was confined to
instructor-student dialogue for a single lesson. There was no provision for group
communication or a sequence of learning activities and they did not study learner autonomy.
Bischoff, Bisconer, Kooker, and Woods (1996) used an investigator-developed
questionnaire returned by 221 out of 322 public health and graduate nursing students to study
the relationships between transactional distance, structure, and dialogue. They also compared
traditional and interactive television formats with respect to these variables. Their article did
not report gender numbers. The Pearson correlation coefficient for structure and transactional
distance scale scores was significant and positive; those for structure and dialogue, and
dialogue and transactional distance, were significant and negative. These were consistent
with predictions of the Transactional Distance theory. Analysis of the data showed that only
13% of the variance of transactional distance was attributed to dialogue and structure. The
study was limited by the small number of questions that were related closely to the variables
under study and by the researchers’ decision not to study learner autonomy.
Brenner (1996) studied 154 Southwest Virginia Community College students out of
318 enrolled in asynchronous telecourses to learn if their cognitive styles affected their
achievement. The gender distribution of the study group was approximately 75% female,
25% male. He predicted that students with some cognitive styles were more likely to cope
with the transactional distance inherent in the course delivery. The study showed that, in the
case of this group, this prediction was incorrect. The Group Embedded Figures Test was used
to identify field independent students, and there was no significant correlation between
student success (receipt of a course grade of C or better) and their classification according to
this test. The study did not quantify transactional distance or relate it to learning style or
11
student success; the researcher inferred that a student who is more successful in his or her
course is better able to overcome transactional distance. This may not have been a correct
inference because a very capable student could have had difficulty with the transactional
distance and still have earned a higher score than a weak student who had little difficulty
with the transactional distance.
Bunker, Gayol, Nti, and Reidell (1996) conducted a quasi-experimental research project
during the audioconferencing portion of an international course Teleconferencing in Distance
Education taught by Michael G. Moore. There were approximately 100 students from nine
sites in Estonia, Finland, Mexico and the United States. In addition to audioconferencing,
print, computer text conferencing, audiographics, and videoconferencing were used in the
course. The instructor changed the level of structure imposed on communication in the
audioconferences and the researchers analyzed the resulting recorded dialogue using an
analysis tool (MACS) developed by Cookson and Chang. The authors stated a number of
limitations of the study, including little validation of the analysis tool, the “relatively
untested” nature of the supporting theory, and a list of uncontrolled variables. One recorded
conference, for example, was of a required presentation by one group and the ensuing
dialogue. The presenters’ time involved in dialogue was much higher than it might have been
on other occasions. The authors indicated that Transactional Distance Theory provides a
useful basis for conference analysis, and that this research indicated directions of further
research more than it answered questions.
Chen (1997) studied a sample from the 208 students who took teleconferencing courses
in a variety of subjects from Penn State University. Eighty-three student respondents were in
the instructor’s classroom, thirty-eight communicated via interactive television. Thirty-nine
12
students were eliminated from the study for various reasons, giving a response rate of just
over 71%. Sixty-one percent of the respondents were female. Her goal was to study factors
that affect structure, dialogue, student autonomy, and transactional distance, and to find
relationships between the variables. She identified factors that comprise dialogue, structure,
student autonomy, and transactional distance, then performed a path analysis to show
relationships among the variables. She concluded that transactional distance is not related to
either course structure or student autonomy, and that it is inversely related to instructor-
student dialogue for off-site students. She also concluded that the perceived amount of
learning is inversely related to transactional distance. The data support her conclusions, but
they are not directly transferable to asynchronous computer conferences because many of the
questions asked were specific to teleconferencing and face-to-face instruction. Chen and
Willits (1999) later published an article discussing this study.
Hopper (2000) conducted a grounded theory study of students in a Social Work
program that used two-way television as a communications medium at a small Midwestern
American university. The goal was to discover if learner characteristics and life
circumstances affected transactional distance in this setting, and if they affected learner
achievement or satisfaction. “Subjects felt that learner characteristics and life circumstances
directly affected their participation in the program, but had little direct impact upon the
formation of their perceptions of transactional distance.” “Perceived transactional distance,
no matter how great, was not seen as an impediment to learner achievement in the program
or satisfaction with the distance learning environment.” He indicated the study was limited
by the small size of the group.
13
Jung (2001) conducted a critical review of journal articles discussing Web Based
Instruction, guided by Moore’s Transactional Distance Theory, in an attempt to relate
research and practice in Internet-based instruction to distance education theory. She reviewed
58 articles taken from six refereed international journals in distance education and
educational technology. Jung found that many of the writers had limited experience in
distance education and there were few examples of rigourous, theory-based research. “Three
aspects of dialogue have been identified through the studies. Those types were: (1) academic
interaction between learners and instructors, including external experts; (2) collaborative
interaction among learners; and (3) interpersonal interaction between learners and instructors,
or among learners.” Several articles emphasized the flexibility of Web Based Instruction.
They expressed in various ways that “learners have more autonomy in making decisions
regarding their learning.” Jung suggested that the literature review raised questions to guide
further research. For example: “Does the extent of rigidity or flexibility in the structure of a
WBI course affect dialogue and transactional distance, as is the case in other distance
education modes?” Her work was a reminder of the value of theory-based research in the
development of an educational field. It also showed that a great deal of work is still to be
done in developing existing theory.
Studies Involving Computer Conferences. Burge (1994) used in-depth interviews with
21 M.Ed. students to study their perceptions of learning in courses using computer
conferences. She also studied student opinions of the important features of computer
conferencing and the effects of those features on their learning. Her article did not make
direct reference to transactional distance, but reported information that referred to dialogue,
structure, and student autonomy. Students felt that some instructor-imposed structure,
14
instructor-student dialogue, and student-student dialogue all were important to their learning.
They also felt computer conferencing had some features that promoted, and some that
inhibited, dialogue.
Fabro’s (1996) research purposes were to “examine the perceptions of students
regarding the effect of computer conferencing on the quality of communication and
determine if students view computer conferencing as a medium which facilitates higher-order
learning,” and to study social presence in the context of computer conferencing. She studied
24 students in the Master of Continuing Education program at the University of Calgary
using questionnaires, telephone interviews, conference observation and a focus group.
Twenty-three responded to the initial questionnaire and 21 to the second, two students having
withdrawn from the program.
Changes in survey results gathered before and after the program, together with
interview content, showed that students valued the conference experience more than they
expected they would. She concluded that although it presented some barriers to learning,
computer conferencing could provide quality communication and promote higher-order
learning. Students emphasized the importance of instructor involvement in the conferences;
relative to transactional distance theory, they indicated that their learning was affected by
instructor-student dialogue and instructor-controlled course structure. The study was limited
by the small sample size and the narrow definition of the population. Specifically, the
conclusions were not directly transferable to courses using different conferencing software
and having different styles of instructor participation.
Chen (2001) studied a group of students enrolled in a distance education course offered
by the National Chung Cheng University (NCCU) in Taiwan. The students were located at
15
NCCU and three other universities; they communicated via the Internet in an asynchronous
conference, teleconferencing, and in-class tutoring. Of the 82 enrolled, seventy-one students
returned the study questionnaire. The gender ratio was approximately 56% female, 44%
male.
The purposes of her study were to learn to what extent students experienced
transactional distance in the on-line course, and to find the degree to which Internet skill,
previous distance education experience, learner support and asynchronous interaction
influenced transactional distance.
Chen found that a factor analysis of her study variables indicated four components of
transactional distance. They were labelled Teacher-Learner, Learner-Learner, Learner-
Content, and Learner-Interface. There was a statistically significant correlation between each
component and the other three.
There were some significant correlations between the other variables and transactional
distance components, but not as many as the author expected. Neither previous distance
education experience nor learner support was related to any transactional distance
component. Internet skill level was negatively correlated with Learner-Content and Learner-
Interface components, and on-line asynchronous interaction was negatively correlated with
Learner-Learner and Learner-Interface components.
Chen concluded that transactional distance consisted of four components, as described
above, and that neither previous experience nor student support was related to transactional
distance. She recommended that, because of “the importance of online interaction in
decreasing transactional distance”, further research should be done to study various types of
16
interaction such as collaborative work and group discussions. The results reported support
her conclusions.
Huang (2002) conducted a survey of 37 students enrolled in three on-line courses
delivered by Seattle Pacific University during the fall 1999 and winter 2000 terms. Thirty-
one of the students responded. Survey questions used a seven level Likert type scale. Goals
of the study were to describe correlations between several student characteristics and student
perceptions of the Internet as a learning interface, and to describe correlations between
students’ perceptions of the Internet as a learning interface and interaction, course structure,
and student autonomy. Interaction was subdivided into learner-instructor, learner-content,
and learner-learner sections. Course structure was subdivided into organization and delivery,
and student autonomy into independence and interdependence. Huang found positive,
statistically significant correlations between these variable groups:
-age with interaction, course structure, and interface perceptions.
-experience with Microsoft Office and structure, autonomy, and interface perceptions.
-web browser experience and autonomy, interface perception.
-interface perception and interaction, structure, and autonomy.
The author stated that because age showed a significant correlation with several of the
study variables and that this was consistent with others’ findings, planners and instructors
should take the ages of their students into account during course preparation and delivery.
She found that when the interface perception variable was partialled out, the following
subsections of interaction, structure, and autonomy showed positive, significant correlations:
-learner-content and learner-instructor interaction
-learner-content and learner-learner interaction
17
-learner-learner interaction and interdependence
-interdependence and course organization
There was a statistically significant negative correlation between course delivery and
independence. Huang did not describe any correlations between gender and other variables.
She concluded that student perceptions of the media interface were important and that
the interface should be a fourth variable in Moore’s theory of Transactional Distance.
Summary. Some studies showed that there was a direct relationship between
transactional distance and structure, and an inverse relationship between transactional
distance and dialogue. Others showed a weak relationship between theory variables or none
at all. Chen (2001) found online interaction to be negatively correlated with two components
of transactional distance, and Huang (2002) found a relationship between learner-learner
interaction and interdependence, and between two subgroups of structure and student
autonomy.
Variable definitions were inconsistent from one study to another, and even Moore
(1973, 1993) refers to dialogue differently over time. Bischoff, et al (1996), Saba and Shearer
(1994) and Chen (1997) treated dialogue as being equivalent to communication, but Brenner
(1996) used Moore’s (1993) definition that includes qualities of “positive” and “purposive.”
Most studies that explicitly involve transactional distance refer to technologies other
than asynchronous computer conferences. Studies that do include transactional distance and
asynchronous conferences do not include all the variables used in Moore’s theory.
Studies discussed in the literature review describe several research methods and
procedures of data analysis. Shulman (1997) points out that methods are influenced in part by
the kinds of questions the researcher wants to ask and by the settings in which the studies
18
occur. Saba and Shearer (1994) used a systems analysis computer program to analyze speech
patterns observed in a lab setting; Bunker, Gayol, Nti and Reidell (1996) also performed
speech analysis, but on data from a quasi-experimental study. Hopper conducted a grounded
theory study. Burge (1994) and Fabro (1996) categorized and described their data, but did not
analyze it mathematically. Jung conducted a literature review of existing research. Brenner
(1996) and Huang (2002) both did correlation studies, while Chen (1997) and Bischoff,
Bisconer, Kooker and Woods (1996) analyzed their survey data using multiple regression.
Chen (2001), in a separate study, conducted a path analysis of her survey data. Although the
variety of methods makes direct comparison of results more difficult, students of
Transactional Distance Theory benefit from the variety of quantitative and qualitative
methods because they facilitate consideration of the theory from different viewpoints.
Connection of the Present Study to the Literature
The beginning of a description of distance education from the perspective of
Transactional Distance Theory is formed from the literature. There is some indication that
theory variables are related to each other as predicted, but there are also studies in which the
predicted relationships fail to appear. There are studies designed to look for relationships
between some of the theory variables themselves, and others that investigate the influence
upon those variables of outside factors such as age or previous experience with distance
education courses. The asynchronous computer conference is only one of several media
under study. Because of the range of media studied, the attention paid to different details
relating theory and practice, and the lack of consistency in terminology, there remain many
gaps to be filled in our understanding of Transactional Distance.
19
Inconsistency in the definition of terms could also lead to misunderstanding in
comparisons of study results, and makes design of future studies more difficult. Because
dialogue, course structure, transactional distance, and student autonomy cannot be directly
measured, researchers must select indicator variables to represent them. As long as there is
inconsistency and lack of clarity in the definition of a theory variable, there will be doubt
about whether or not a given choice of indicators is appropriate.
The choice of methods for data collection and analysis in this study was based on the
observation that predicted relationships between theory variables are at present not fully
supported by research, and the hypothesis that the relationships may differ to some degree
with changes in communication media. These suggest that, considering the small number of
studies of Transactional Distance Theory in the context of asynchronous computer
conferences, a relatively unsophisticated correlation analysis of data, from variables as they
naturally occur (Shulman, 1997), should be used to provide a basis for more advanced
studies. Simon and Burstein (1985) recommend, “The first statistics you should look at are
the correlations between variables that you think may be causally related, either directly or
indirectly.”
Theories such as Transactional Distance Theory provide a foundation for the study of
distance education. Much more work must be done to clarify the meanings of terms, the
internal structures of theory variables if such structures exist, and the relationships between
the variables. The present study was conducted to help address this problem.
20
CHAPTER III
METHODOLOGY
Participants
Participants in the study were students enrolled in distance education courses at a major
distance education university in Alberta, Canada. These courses were administered through
the Centre for Distance Education (CDE) at the university and offered during the fall term of
2002, which extended from early September to the middle of December. Some students were
part of the Master of Distance Education program, some were part of the Advanced Graduate
Diploma in Distance Education, and some were enrolled in neither program.
All participants in the study were volunteers. An e-mail message was sent via the CDE
office inviting students, excepting those who took part in the pilot, to volunteer for the study.
One hundred fourteen volunteered to take part from a total of 359 eligible students (G.
Hawryluk, CDE office, personal communication, 2003). Eighty-five of these completed and
returned their questionnaire forms. Students who did not satisfy all the criteria for the study
population completed three of the returned forms, so 82 students formed the sample
population. The return rate for students who fit the study population criteria was
approximately 73.9% of those who volunteered, or approximately 21.8% of the study
population of 376. Copies of recruitment letters and questionnaire cover letters for the pilot
and research study can be found in Appendix A. A copy of the research questionnaire can be
found in Appendix B.
21
Instrument
This study required information about students using asynchronous computer
conferences in a realistic setting so a survey was used (Simon & Burstein, 1985; Wiersma,
1986) to gather most of the data. The research instrument was an e-mailed questionnaire
containing 52 questions. The form comprised several sections containing questions related to
each of the study variables and to additional information required for the study. Some of the
questions were taken directly or adapted from the research instrument developed by Chen
(1997), who in a personal communication gave her permission to do so. All of the questions
using a Likert type scale used seven levels. The last question asked permission to contact the
student later to request his or her final grade.
The first section contained dialogue-related questions. Fourteen questions asked for the
number of times the student had either sent or observed a certain type of message in the
computer conference. The remaining seven questions used a Likert type scale, asking the
student’s perception or opinion of various aspects of communication via the computer
conference.
The second section contained 10 questions concerning course structure. All used a
Likert type scale. They asked for the student’s perception of the level of flexibility in their
class in a variety of categories related to planning, learning activities and evaluation.
Flexibility was defined to respondents as the degree to which a given aspect of the course
was adaptable to their individual learning needs.
The third section comprised two questions asking for the student’s perception of the
psychological/communication distance between him- or herself and others. Both used a
22
Likert type scale. One question concerned the distance between the student and instructor,
the other between the student and other students in the class.
The fourth section concerned student autonomy. There were 11 questions using a Likert
type scale, asking students to express their level of agreement with a series of descriptions of
themselves as learners in the class. The questions could be categorized into descriptions of
independence and interdependence, but were not so categorized on the form.
The last section contained questions in various formats, asking about some of the many
factors that may influence the study variables. Three Likert-scale questions asked about the
student’s skill with and access to computer communications technology, and prior knowledge
of course content. Other questions related to the number of distance education courses taken
previously via computer conferences, and the student’s gender, student status, and age
category.
Design
This was an exploratory study using quantitative data. Correlations were calculated
between variables or components used as indicators for the study variables but there was no
attempt to show causation. Tests were conducted to determine independence of study
variables from possible outside influences such as the student’s gender or age category.
Procedure
Pilot Study. Thirty-one students from two classes of one CDE graduate course were
invited, with permission from their instructors, to volunteer for the pilot study. This invitation
was sent by e-mail via the CDE office. Seventeen of the students volunteered. They received
by return e-mail the pilot questionnaire and cover letter. Directions in the cover letter
23
requested that they complete the form, add to it any suggestions they may have for improved
wording or form structure, and return it directly to the researcher. Thirteen students
completed and returned the forms.
The two goals for conducting the pilot study were to improve the wording of the
questions and directions in the survey instrument, and to determine if any questions should
be removed. The number of returned forms was too small to allow a statistical analysis that
possibly would suggest removal of some questions, so all were retained in the research
instrument. There were, however, several minor changes made to the wording of questions
and overall structure of the form based on the responses and on suggestions from the
respondents. Additional explanations of key terms were included to reduce the variability in
their interpretation.
Research Study. Students enrolled in CDE courses in the fall term of 2002 at Athabasca
University were sent a recruitment e-mail letter via the CDE administrative office. The letter
was sent in mid-November, just over two-thirds of the way through the term. It requested that
students who wished to volunteer for the study, other than those who took part in the pilot
study, contact the researcher directly via e-mail. Volunteers received a questionnaire and
cover letter by return e-mail. The cover letter gave suggestions for convenient ways to
complete and return the form. It also requested that if a student was enrolled in more than one
class, he or she should select one and have all their responses refer to that class. After two
weeks, volunteers who had not returned their forms were sent e-mail reminders.
Volunteers were requested to indicate on the form whether or not they were willing to
be contacted, after the term ended, to request their final grade. Those who agreed were sent
24
an e-mail request early in February 2003. If they did not respond to the initial request they
were sent a reminder two weeks later.
Data Analysis. All statistical calculations with the exception of Chi-square tests of
independence were conducted using SPSS for Windows, release 7.5.1. The Chi-square test
calculations were done on a Sharp EL-9600 calculator because many of the tests required
grouping of categories to satisfy test prerequisite conditions. Descriptive statistics were
calculated for all variables. Frequency distribution, mean and standard deviation were found
for ratio variables. Frequency distribution, median and mode were found for ordinal
variables. Frequency distributions and modes were found for nominal variables.
Factor analysis of a group of variables indicating dialogue formed part of the analysis.
It was hypothesized that dialogue within CMC is not a monolithic concept, but also that it
has a limited number of subcategories. These subcategories may be described in more than
one way, depending in part on the questions that are used to reveal them. The purpose of
factor analysis is to simplify the description of a concept like dialogue by allowing the user to
combine groups of variables as representatives of the underlying “components” rather than
using the individual variables themselves. The process is based on the assumption that the
underlying components cannot be measured directly but that they influence in an organized
way the values of the variables that can be measured, and thereby reveal their own existence
(McDonald, 1985).
A principal component analysis was done of ten of the fourteen ratio scale variables in
the dialogue section to reveal underlying organization of the computer conference messages.
Four of the variables were omitted because they referred to communications media other than
the computer conference. The procedure used the Principal Component Analysis extraction
25
method with Varimax rotation and Kaiser Normalization. It was decided to repeat the
procedure using the restriction of three components, based on selection criteria of
Eigenvalues higher than one, the Scree Test, and simple structure. Variables that had a
correlation higher than 0.400 with one of the resulting components and that did not have a
similar correlation with another component were selected to calculate component scores for
each case. Component scores were calculated by multiplying the selected variable value for
each case by the coefficient listed in the Component Score Coefficient Matrix, and then
summing the results. Component analysis was conducted again with the component scores
included to estimate correlations of calculated component scores with the underlying
components.
Spearman’s rho correlation coefficients were calculated for all pairs of indicator
components or variables for the theory variables and for indicators of transactional distance
paired with course mark. They were also calculated for skill with computer communications
technology, prior knowledge of subject matter, accessibility to communications software, and
number of courses previously taken paired with all theory variable indicators. The
Spearman’s rho coefficient was used instead of the Pearson coefficient because most
variables were ordinal.
A Chi-square test of independence was calculated for gender, program status, and age
group paired with each other and with all other variables and components. Contingency
tables were created using SPSS, regrouped when necessary, and the test calculations
performed on a Sharp EL-9600 calculator.
26
CHAPTER IV
RESULTS
Descriptive Statistics
Variables in this section are grouped to correspond to theory variables, to subgroups of
them, and to additional information about students. Student autonomy indicators are
subdivided as independence and interdependence indicators in the tables below; they were
not grouped thus on the questionnaire. Tables showing means or medians and modes appear
later in this section; tables showing frequency distributions appear in appendix C.
Dialogue variables were of two types; some showed the number of occurrences of a
type of message, others showed students’ reported perception on a Likert type scale. In many
of the ratio scale questions there was a high frequency of zero messages, but at the other
extreme one respondent posted over 100 content-related replies to other students. Most
students thought they were able to communicate ideas with others effectively via the
conference and that others showed a high level of respect for their ideas. Most were
moderately to completely satisfied with the conference technology as a communications tool.
Respondents’ perceptions of course structure were widely varied. The distribution of
levels of flexibility, for all variables, was relatively flat or uniform.
Students as a group indicated that they were either neutral in their perception of
transactional distance or perceived it as moderately close. The medians for student-instructor
and student-student transactional distance were five and four respectively on a seven point
scale.
27
Students viewed their learner independence and interdependence self-descriptions quite
differently. Most students described themselves as moderately to strongly independent, with
few choosing ratings lower than four on a seven-point scale. They had much more varied
opinions of themselves as interdependent learners. Medians for some variables were
moderately high and others neutral.
The remaining variables referred to student descriptors not included directly in theory
variable clusters. Most students rated their skill with and access to computer communications
technology to be high. There was great variation in their description of prior knowledge of
course content and the median was moderately low, three on a seven-point scale. More than
two-thirds of the students had taken five or fewer previous classes. For 27%, the current class
was their first. The female to male ratio was approximately 7:3, with over half being masters
program students and almost half being in the 41-50 year age range. The median grade was
“A” for the 66 students who agreed to communicate their final results.
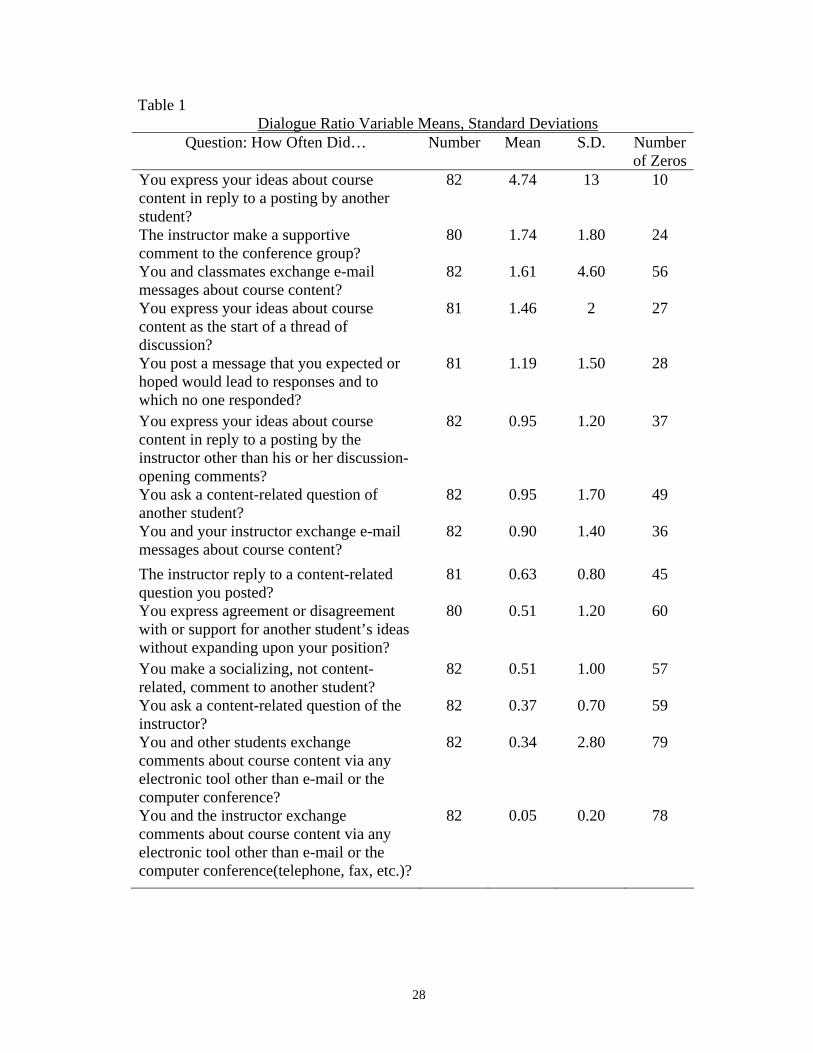
Dialogue Indicator Ratio Variables. These variables indicate students’ descriptions of
the number of times in their most recent two-week period of computer conferencing they
posted or observed a particular type of message in the conference. Questions in the table
were reworded to make their meanings clear in the absence of their introductory sentences.
Questions were ranked from high to low by the mean number of occurrences of the type of
message to which they refer. Means and standard deviations were calculated using the
number of cases shown for each variable, including those with zero occurrences of the
message type.
28
Table 1 Dialogue Ratio Variable Means, Standard Deviations
Question: How Often Did… Number Mean S.D. Number of Zeros
You express your ideas about course content in reply to a posting by another student?
82 4.74 13 10
The instructor make a supportive comment to the conference group?
80 1.74 1.80 24
You and classmates exchange e-mail messages about course content?
82 1.61 4.60 56
You express your ideas about course content as the start of a thread of discussion?
81 1.46 2 27
You post a message that you expected or hoped would lead to responses and to which no one responded?
81 1.19 1.50 28
You express your ideas about course content in reply to a posting by the instructor other than his or her discussion-opening comments?
82 0.95 1.20 37
You ask a content-related question of another student?
82 0.95 1.70 49
You and your instructor exchange e-mail messages about course content?
82 0.90 1.40 36
The instructor reply to a content-related question you posted?
81 0.63 0.80 45
You express agreement or disagreement with or support for another student’s ideas without expanding upon your position?
80 0.51 1.20 60
You make a socializing, not content-related, comment to another student?
82 0.51 1.00 57
You ask a content-related question of the instructor?
82 0.37 0.70 59
You and other students exchange comments about course content via any electronic tool other than e-mail or the computer conference?
82 0.34 2.80 79
You and the instructor exchange comments about course content via any electronic tool other than e-mail or the computer conference(telephone, fax, etc.)?
82 0.05 0.20 78
29
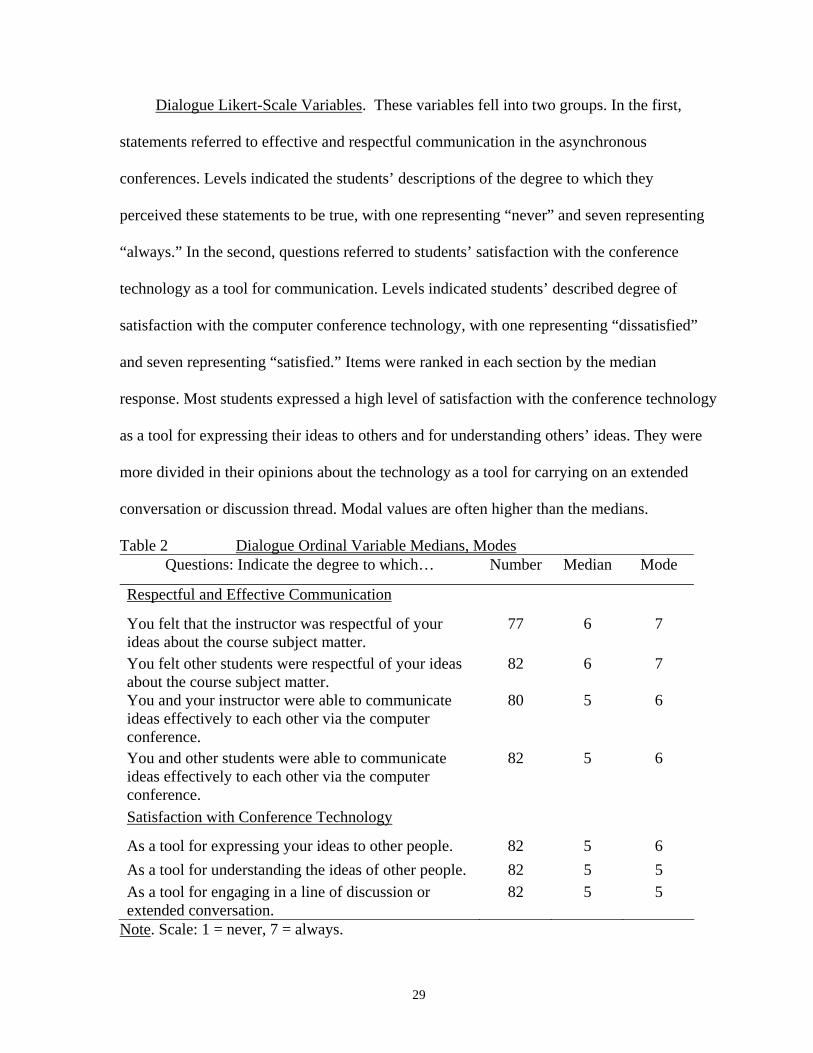
Dialogue Likert-Scale Variables. These variables fell into two groups. In the first,
statements referred to effective and respectful communication in the asynchronous
conferences. Levels indicated the students’ descriptions of the degree to which they
perceived these statements to be true, with one representing “never” and seven representing
“always.” In the second, questions referred to students’ satisfaction with the conference
technology as a tool for communication. Levels indicated students’ described degree of
satisfaction with the computer conference technology, with one representing “dissatisfied”
and seven representing “satisfied.” Items were ranked in each section by the median
response. Most students expressed a high level of satisfaction with the conference technology
as a tool for expressing their ideas to others and for understanding others’ ideas. They were
more divided in their opinions about the technology as a tool for carrying on an extended
conversation or discussion thread. Modal values are often higher than the medians.
Table 2 Dialogue Ordinal Variable Medians, Modes Questions: Indicate the degree to which… Number Median Mode
Respectful and Effective Communication
You felt that the instructor was respectful of your ideas about the course subject matter.
77 6 7
You felt other students were respectful of your ideas about the course subject matter.
82 6 7
You and your instructor were able to communicate ideas effectively to each other via the computer conference.
80 5 6
You and other students were able to communicate ideas effectively to each other via the computer conference.
82 5 6
Satisfaction with Conference Technology
As a tool for expressing your ideas to other people. 82 5 6 As a tool for understanding the ideas of other people. 82 5 5 As a tool for engaging in a line of discussion or extended conversation.
82 5 5
Note. Scale: 1 = never, 7 = always.
30
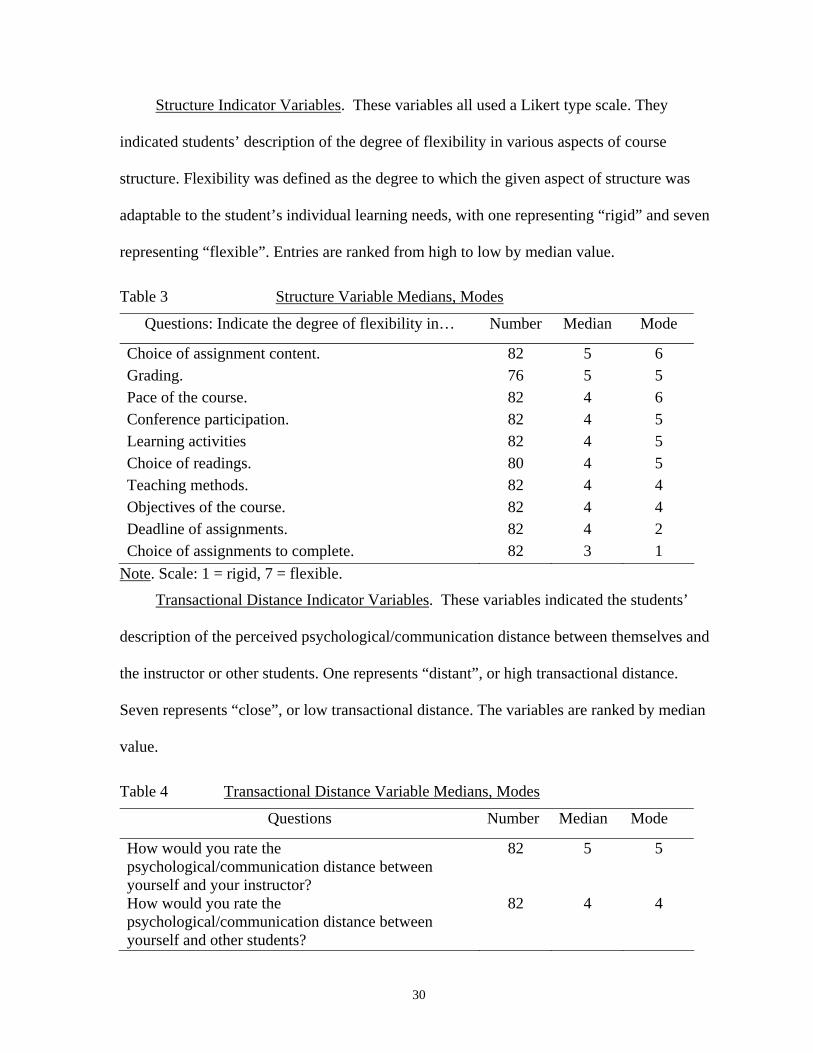
Structure Indicator Variables. These variables all used a Likert type scale. They
indicated students’ description of the degree of flexibility in various aspects of course
structure. Flexibility was defined as the degree to which the given aspect of structure was
adaptable to the student’s individual learning needs, with one representing “rigid” and seven
representing “flexible”. Entries are ranked from high to low by median value.
Table 3 Structure Variable Medians, Modes
Questions: Indicate the degree of flexibility in… Number Median Mode
Choice of assignment content. 82 5 6 Grading. 76 5 5 Pace of the course. 82 4 6 Conference participation. 82 4 5 Learning activities 82 4 5 Choice of readings. 80 4 5 Teaching methods. 82 4 4 Objectives of the course. 82 4 4 Deadline of assignments. 82 4 2 Choice of assignments to complete. 82 3 1
Note. Scale: 1 = rigid, 7 = flexible.
Transactional Distance Indicator Variables. These variables indicated the students’
description of the perceived psychological/communication distance between themselves and
the instructor or other students. One represents “distant”, or high transactional distance.
Seven represents “close”, or low transactional distance. The variables are ranked by median
value.
Table 4 Transactional Distance Variable Medians, Modes
Questions Number Median Mode
How would you rate the psychological/communication distance between yourself and your instructor?
82 5 5
How would you rate the psychological/communication distance between yourself and other students?
82 4 4
31
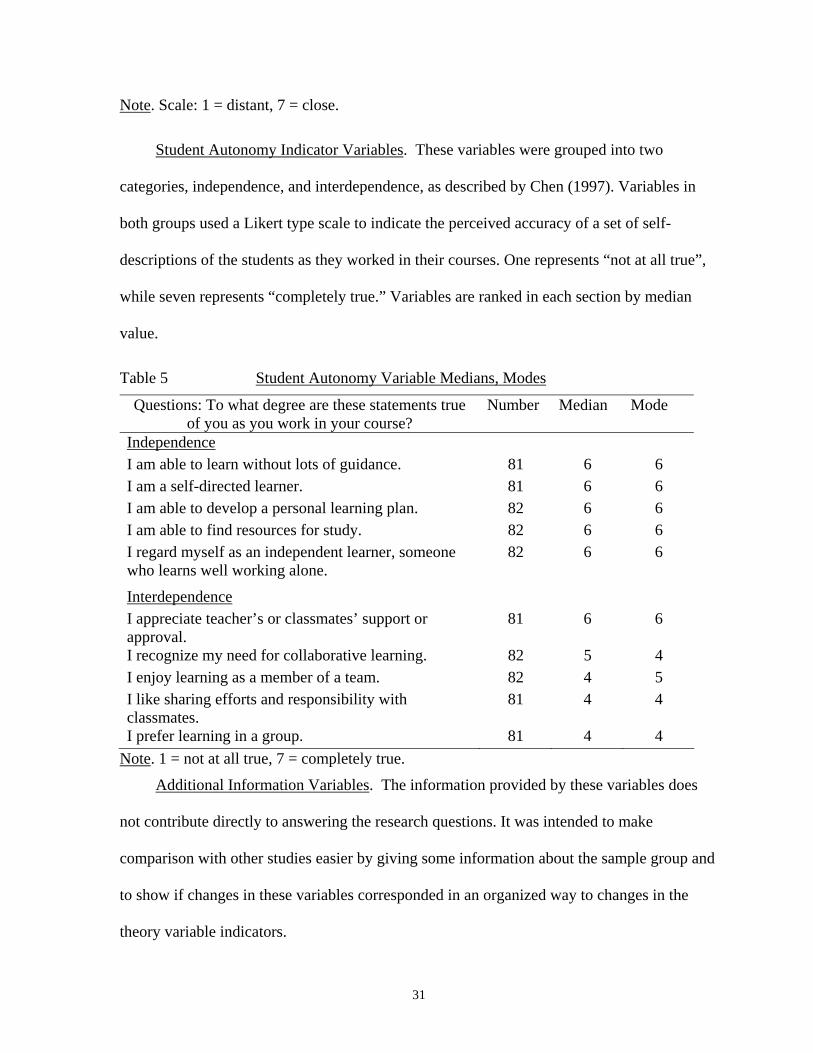
Note. Scale: 1 = distant, 7 = close.
Student Autonomy Indicator Variables. These variables were grouped into two
categories, independence, and interdependence, as described by Chen (1997). Variables in
both groups used a Likert type scale to indicate the perceived accuracy of a set of self-
descriptions of the students as they worked in their courses. One represents “not at all true”,
while seven represents “completely true.” Variables are ranked in each section by median
value.
Table 5 Student Autonomy Variable Medians, Modes
Questions: To what degree are these statements true of you as you work in your course?
Number Median Mode
Independence I am able to learn without lots of guidance. 81 6 6 I am a self-directed learner. 81 6 6 I am able to develop a personal learning plan. 82 6 6 I am able to find resources for study. 82 6 6 I regard myself as an independent learner, someone who learns well working alone.
82 6 6
Interdependence I appreciate teacher’s or classmates’ support or approval.
81 6 6
I recognize my need for collaborative learning. 82 5 4 I enjoy learning as a member of a team. 82 4 5 I like sharing efforts and responsibility with classmates.
81 4 4
I prefer learning in a group. 81 4 4 Note. 1 = not at all true, 7 = completely true.
Additional Information Variables. The information provided by these variables does
not contribute directly to answering the research questions. It was intended to make
comparison with other studies easier by giving some information about the sample group and
to show if changes in these variables corresponded in an organized way to changes in the
theory variable indicators.
32
Three variables used a Likert type scale to indicate the students’ self-rating relative to
computer technology use and course content knowledge. There were 82 responses to “How
would you rate your skill at using computer communications technology such as computer
conferencing, chat programs and e-mail?” One represented “no skill”, seven represented
“highly skilled”; the median was six and the mode seven. There were 82 responses to “How
would you rate your knowledge of this course’s subject matter before taking the course?”
One represented “no knowledge”, seven represented “thorough knowledge”; the median was
three and the mode four. There were also 82 responses to “How would you rate your
accessibility to computer communications software, including software for access to the
Internet?” One represented “poor”, seven represented “excellent”; the median and mode were
both seven.
Students were asked about the number of distance education courses, utilizing
computer conferencing, which they had previously taken through the university. They were
also asked about their current program status. Eighty students responded to the question
referring to the number of prior courses. The range was from zero to 12, with a mean of 3.86
and a standard deviation of 3.6. Eighty-one responded to the second question. Fifty-six
indicated they were in the distance education masters program, eight in the diploma program
and 17 in neither.
All 82 respondents answered both the gender and age questions. The gender
distribution was 57 female, 25 male, or approximately 69.5%/30.5%. The distribution for the
total fall enrollment was approximately 65%/35% (G. Hawryluk, CDE office, personal
communication, 2003). The median and modal age group was 41-50 years in the study group.
33
Finally, 66 of the 82 respondents communicated their final grades for the courses they
used as the basis for their questionnaire responses. The university’s grading scale includes
the following levels: A+, A, A-, B+, B, B-, C+. The median and modal grades were both A.
Inferential Statistics
Inferential statistics included Spearman’s rho correlation coefficients and Chi-square
values for tests of independence. The calculations included all non-missing values, including
zero values. Correlation coefficients were found for pairs of variables within theory variable
indicator sets and also for pairs between sets. Tests of independence were conducted for
variables representing theory variables, in relation to those involving additional information
such as student gender. Results of factor analysis calculations used to identify components
underlying data from ratio scale dialogue variables are included in this section. Tables
showing the statistics and calculation results are to be found in this section and in appendices
listed here. Answers to the research questions are found in Chapter 5 immediately after a
comparison of the results to previous studies.
A principal component analysis of dialogue variables for computer conferences resulted
in the choice of a three component solution. The components were labelled “Learner-Group
Dialogue”, “Learner-Instructor Dialogue”, and “Group Support.” Due to the small number of
questions and high frequency of zero occurrences of many message types, this solution
should be regarded as very tentative.
There was quite a high frequency of statistically significant correlations between
variables within each theory variable set. In the dialogue set there was much variation; for
example, the number of e-mail messages showed low correlation with most other dialogue
variables, but indicators of satisfaction with the computer conference technology showed
34
comparatively high, statistically significant correlations with several other dialogue variables.
Statistically significant correlations between course structure variables were common,
approximately 75%, with most being low to moderate. The correlation between the two
transactional distance variables was statistically significant. Among student autonomy
indicators, 80% of correlations between interdependence variables were statistically
significant, 100% of correlations between independence variables were statistically
significant, and 40% of correlations between the two groups were statistically significant. All
correlations between independence and interdependence in student autonomy were negative,
while all the within-group correlations were positive.
Factor Analysis of Conference Dialogue Indicators. Factor analysis of the conference
dialogue indicators was conducted using Varimax rotation with Kaiser normalization. The
goal was to establish a structure with orthogonal or mutually exclusive underlying
components clearly associated with some variables and not with others. The criterion used
for display of results was Eigenvalues higher than one. The calculation method was the
Principal Component method, which includes unique variance of the variables. Calculations
included all cases that did not have missing values, including those with the value of zero.
Missing values were eliminated pairwise. Tables displaying results of the factor analysis
process are shown in Appendix D. The process gave a four factor solution, which indicated
four components underlying the results of the dialogue questions, but observation of the
Skree Plot suggested examination of a three factor solution. That was set as a criterion for the
analysis and the calculations were re-done. The resulting three factors accounted for 24%,
18%, and 14%, respectively, of the variation of the data.
35
A rotated component matrix table was created to identify the dialogue questions that
correlated the most closely with each of the underlying components. Components were
represented by indicator variables that were correlated with them at coefficient levels of at
least 0.400. Variables having correlations that high with other components as well were not
used at all. Component one, designated Learner-Group Dialogue (LGD), was represented by
the following variables:
How many times did you express your ideas about course content as the start of a
thread of discussion?
How many times did you express your ideas about course content in reply to a posting
by another student?
How many times did you ask a content-related question of another student?
How many times did you make a socializing, not content-related, comment to another
student?
How many times did you post a message that you expected or hoped would lead to
responses and to which no one responded?
The second, designated Learner-Instructor Dialogue (LID), was represented by these
variables:
How many times did you express your ideas about course content in reply to a posting
by the instructor other than his or her discussion-opening comments?
How many times did you ask a content-related question of the instructor?
How many times did the instructor reply to a content-related question you posted?
The third, designated Group Support (GS), was represented by two variables:
36
How many times did you express agreement or disagreement with or support for
another student’s ideas without expanding upon your position?
How many times did the instructor make a supportive comment to the conference
group?
Component scores were calculated for each case. A component score coefficient matrix
was created, and then representative variable values for each case were multiplied by
coefficients taken from the component score coefficient matrix. The products were added to
give component scores (McDonald, 1985).
Factor analysis was done again, including the three component scores with the
conference dialogue indicator variables, to estimate correlations between calculated
component scores and the extracted components. The purpose was to confirm that the
calculated scores were close representations of the components. The component scores were
designated variable 66 (LGD), variable 67 (LID) and variable 68 (GS) in the table shown in
Appendix D. The nature of the originally extracted components was somewhat modified by
inclusion of the component scores, so correlations shown between variables 66 to 68 and the
new components would not be equal to their correlations with the original components.
However, the correlations would be sufficiently similar to enable one to judge the degree to
which component scores represented the components identified by the analysis. The three
component scores correlated with the underlying components with coefficients of 0.968,
0.988, and 0.949; it was concluded that component scores represented the components
acceptably well.
Within-group Correlations. Within-group correlations were found between variables
representing each of the theory variables. Dialogue indicators were divided into several
37
subgroups for this purpose, and student autonomy indicators were divided into two groups.
Spearman’s rho correlation coefficients were used in all cases. The results showed that there
were patterns within groups of indicator variables, implying that the theory variables may
have internal structures. The correlation coefficient for the two transactional distance
variables was 0.451, which was significant at the p < 0.05 level. Tables showing the
remaining within-group correlations may be found in Appendix E.
Correlation of Dialogue and Structure Indicators. These relate to the first research
question, “Are there statistically significant relationships between the indicators of dialogue
and course structure?” There were relatively few statistically significant correlations.
However, flexibility of conference participation and course objectives appeared to be related
to several dialogue variables and satisfaction with the conference as a tool for extended
conversations appeared related to several structure variables. Whether statistically significant
or not, most values seemed to show that increased flexibility of structure corresponded to
higher values for dialogue variables. Structure variables are listed horizontally on the table,
dialogue variables are listed vertically.
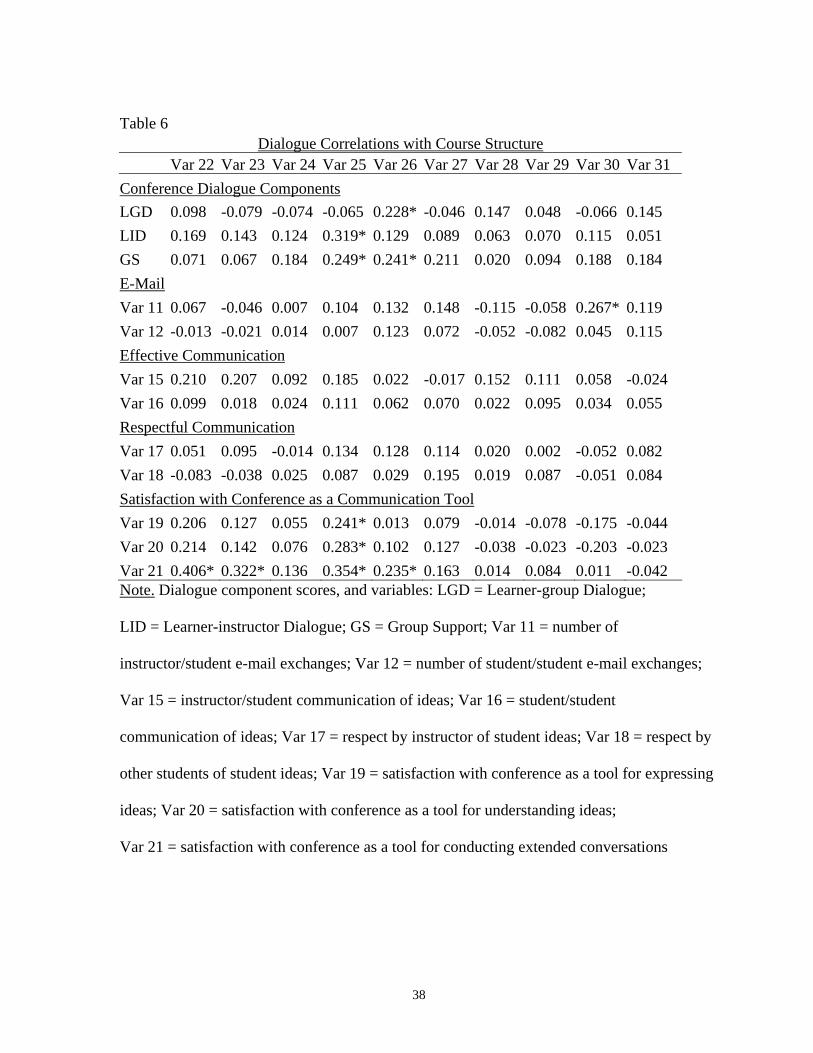
38
Table 6
Dialogue Correlations with Course Structure Var 22 Var 23 Var 24 Var 25 Var 26 Var 27 Var 28 Var 29 Var 30 Var 31
Conference Dialogue Components LGD 0.098 -0.079 -0.074 -0.065 0.228* -0.046 0.147 0.048 -0.066 0.145 LID 0.169 0.143 0.124 0.319* 0.129 0.089 0.063 0.070 0.115 0.051 GS 0.071 0.067 0.184 0.249* 0.241* 0.211 0.020 0.094 0.188 0.184 E-Mail Var 11 0.067 -0.046 0.007 0.104 0.132 0.148 -0.115 -0.058 0.267* 0.119 Var 12 -0.013 -0.021 0.014 0.007 0.123 0.072 -0.052 -0.082 0.045 0.115 Effective Communication Var 15 0.210 0.207 0.092 0.185 0.022 -0.017 0.152 0.111 0.058 -0.024 Var 16 0.099 0.018 0.024 0.111 0.062 0.070 0.022 0.095 0.034 0.055 Respectful Communication Var 17 0.051 0.095 -0.014 0.134 0.128 0.114 0.020 0.002 -0.052 0.082 Var 18 -0.083 -0.038 0.025 0.087 0.029 0.195 0.019 0.087 -0.051 0.084 Satisfaction with Conference as a Communication Tool Var 19 0.206 0.127 0.055 0.241* 0.013 0.079 -0.014 -0.078 -0.175 -0.044 Var 20 0.214 0.142 0.076 0.283* 0.102 0.127 -0.038 -0.023 -0.203 -0.023 Var 21 0.406* 0.322* 0.136 0.354* 0.235* 0.163 0.014 0.084 0.011 -0.042 Note. Dialogue component scores, and variables: LGD = Learner-group Dialogue;
LID = Learner-instructor Dialogue; GS = Group Support; Var 11 = number of
instructor/student e-mail exchanges; Var 12 = number of student/student e-mail exchanges;
Var 15 = instructor/student communication of ideas; Var 16 = student/student
communication of ideas; Var 17 = respect by instructor of student ideas; Var 18 = respect by
other students of student ideas; Var 19 = satisfaction with conference as a tool for expressing
ideas; Var 20 = satisfaction with conference as a tool for understanding ideas;
Var 21 = satisfaction with conference as a tool for conducting extended conversations
39
Structure variables, showing the perceived level of flexibility of: Var 22 = Teaching
methods; Var 23 = Learning activities; Var 24 = Pace of the course; Var 25 = Conference
participation; Var 26 = Objectives of the course; Var 27 = Choice of readings;
Var 28 = Choice of assignment content; Var 29 = Choice of assignments to complete;
Var 30 = Deadlines of assignments; Var 31 = Grading
*p<0.05
Correlation of Dialogue and Transactional Distance Indicators. These correspond to
the research question “Are there statistically significant relationships between indicators of
dialogue and transactional distance?” The theory predicts that increased dialogue will
correspond to lower transactional distance, or in other words a greater sense of
communication closeness. Sixteen of 20 correlations that involve computer conference
variables confirmed this relationship at a statistically significant level. It may be noted that
neither Learner-Group Dialogue nor learner-learner effective communication were
significantly correlated with Learner-instructor transactional distance, but Learner-Instructor
Dialogue and learner-instructor effective communication were correlated with both facets of
transactional distance.
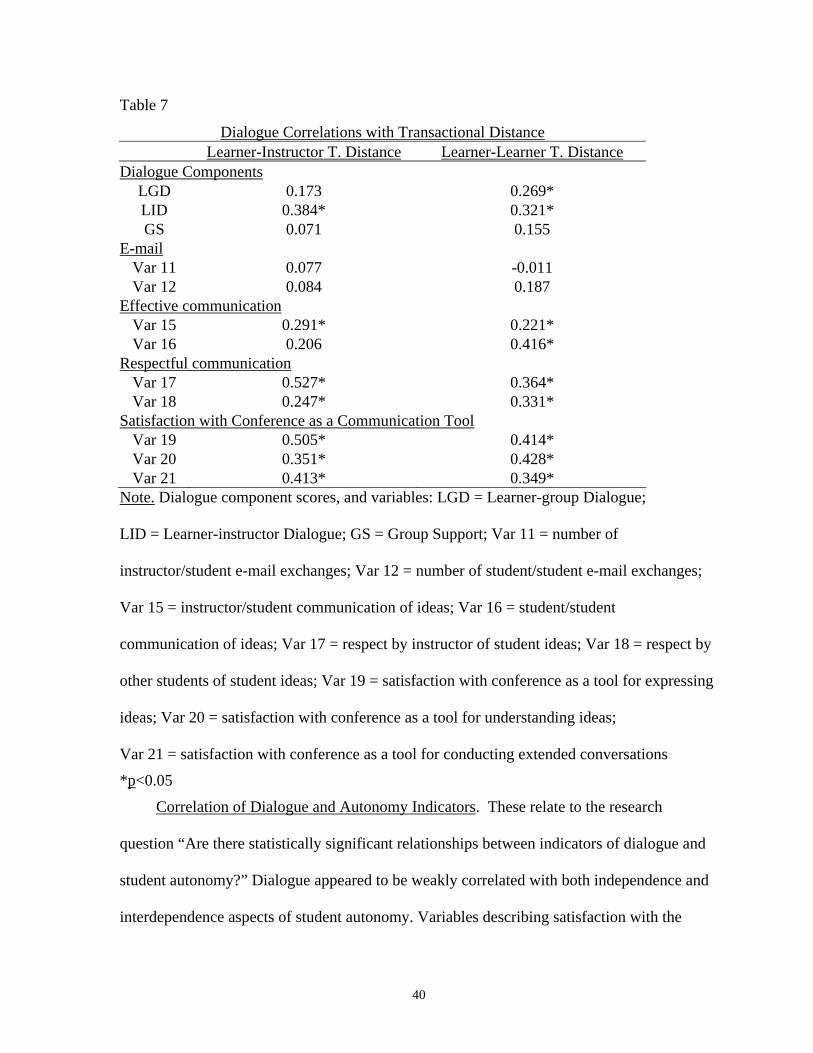
40
Table 7
Dialogue Correlations with Transactional Distance Learner-Instructor T. Distance Learner-Learner T. Distance
Dialogue Components LGD 0.173 0.269* LID 0.384* 0.321* GS 0.071 0.155
E-mail Var 11 0.077 -0.011 Var 12 0.084 0.187
Effective communication Var 15 0.291* 0.221* Var 16 0.206 0.416*
Respectful communication Var 17 0.527* 0.364* Var 18 0.247* 0.331*
Satisfaction with Conference as a Communication Tool Var 19 0.505* 0.414* Var 20 0.351* 0.428* Var 21 0.413* 0.349*
Note. Dialogue component scores, and variables: LGD = Learner-group Dialogue;
LID = Learner-instructor Dialogue; GS = Group Support; Var 11 = number of
instructor/student e-mail exchanges; Var 12 = number of student/student e-mail exchanges;
Var 15 = instructor/student communication of ideas; Var 16 = student/student
communication of ideas; Var 17 = respect by instructor of student ideas; Var 18 = respect by
other students of student ideas; Var 19 = satisfaction with conference as a tool for expressing
ideas; Var 20 = satisfaction with conference as a tool for understanding ideas;
Var 21 = satisfaction with conference as a tool for conducting extended conversations
*p<0.05
Correlation of Dialogue and Autonomy Indicators. These relate to the research
question “Are there statistically significant relationships between indicators of dialogue and
student autonomy?” Dialogue appeared to be weakly correlated with both independence and
interdependence aspects of student autonomy. Variables describing satisfaction with the
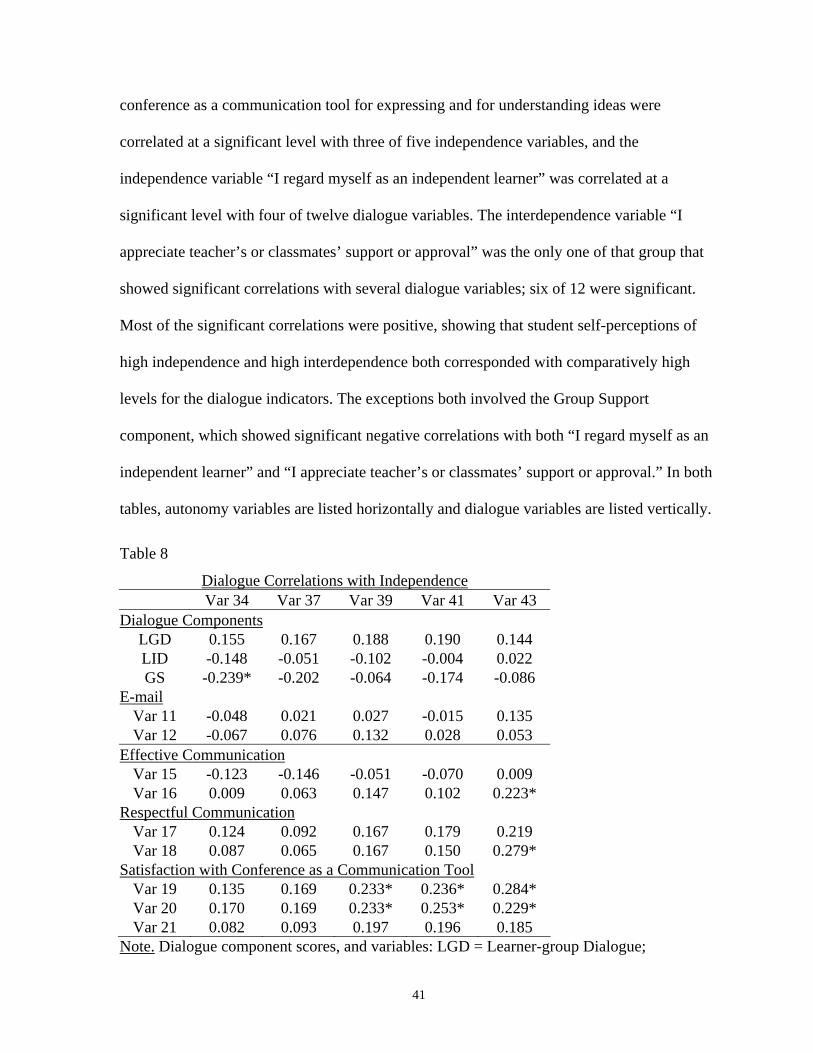
41
conference as a communication tool for expressing and for understanding ideas were
correlated at a significant level with three of five independence variables, and the
independence variable “I regard myself as an independent learner” was correlated at a
significant level with four of twelve dialogue variables. The interdependence variable “I
appreciate teacher’s or classmates’ support or approval” was the only one of that group that
showed significant correlations with several dialogue variables; six of 12 were significant.
Most of the significant correlations were positive, showing that student self-perceptions of
high independence and high interdependence both corresponded with comparatively high
levels for the dialogue indicators. The exceptions both involved the Group Support
component, which showed significant negative correlations with both “I regard myself as an
independent learner” and “I appreciate teacher’s or classmates’ support or approval.” In both
tables, autonomy variables are listed horizontally and dialogue variables are listed vertically.
Table 8
Dialogue Correlations with Independence Var 34 Var 37 Var 39 Var 41 Var 43
Dialogue Components LGD 0.155 0.167 0.188 0.190 0.144 LID -0.148 -0.051 -0.102 -0.004 0.022 GS -0.239* -0.202 -0.064 -0.174 -0.086
E-mail Var 11 -0.048 0.021 0.027 -0.015 0.135 Var 12 -0.067 0.076 0.132 0.028 0.053
Effective Communication Var 15 -0.123 -0.146 -0.051 -0.070 0.009 Var 16 0.009 0.063 0.147 0.102 0.223*
Respectful Communication Var 17 0.124 0.092 0.167 0.179 0.219 Var 18 0.087 0.065 0.167 0.150 0.279*
Satisfaction with Conference as a Communication Tool Var 19 0.135 0.169 0.233* 0.236* 0.284* Var 20 0.170 0.169 0.233* 0.253* 0.229* Var 21 0.082 0.093 0.197 0.196 0.185
Note. Dialogue component scores, and variables: LGD = Learner-group Dialogue;
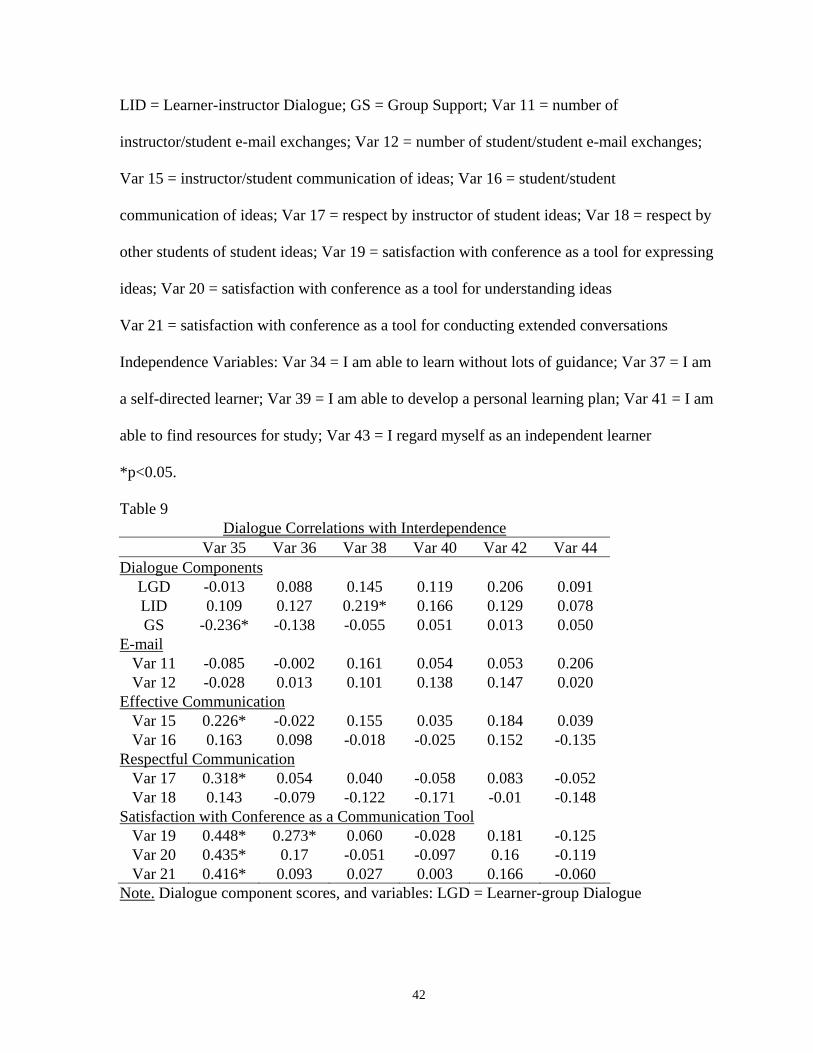
42
LID = Learner-instructor Dialogue; GS = Group Support; Var 11 = number of
instructor/student e-mail exchanges; Var 12 = number of student/student e-mail exchanges;
Var 15 = instructor/student communication of ideas; Var 16 = student/student
communication of ideas; Var 17 = respect by instructor of student ideas; Var 18 = respect by
other students of student ideas; Var 19 = satisfaction with conference as a tool for expressing
ideas; Var 20 = satisfaction with conference as a tool for understanding ideas
Var 21 = satisfaction with conference as a tool for conducting extended conversations
Independence Variables: Var 34 = I am able to learn without lots of guidance; Var 37 = I am
a self-directed learner; Var 39 = I am able to develop a personal learning plan; Var 41 = I am
able to find resources for study; Var 43 = I regard myself as an independent learner
*p<0.05.
Table 9 Dialogue Correlations with Interdependence
Var 35 Var 36 Var 38 Var 40 Var 42 Var 44 Dialogue Components
LGD -0.013 0.088 0.145 0.119 0.206 0.091 LID 0.109 0.127 0.219* 0.166 0.129 0.078 GS -0.236* -0.138 -0.055 0.051 0.013 0.050
E-mail Var 11 -0.085 -0.002 0.161 0.054 0.053 0.206 Var 12 -0.028 0.013 0.101 0.138 0.147 0.020
Effective Communication Var 15 0.226* -0.022 0.155 0.035 0.184 0.039 Var 16 0.163 0.098 -0.018 -0.025 0.152 -0.135
Respectful Communication Var 17 0.318* 0.054 0.040 -0.058 0.083 -0.052 Var 18 0.143 -0.079 -0.122 -0.171 -0.01 -0.148
Satisfaction with Conference as a Communication Tool Var 19 0.448* 0.273* 0.060 -0.028 0.181 -0.125 Var 20 0.435* 0.17 -0.051 -0.097 0.16 -0.119 Var 21 0.416* 0.093 0.027 0.003 0.166 -0.060
Note. Dialogue component scores, and variables: LGD = Learner-group Dialogue
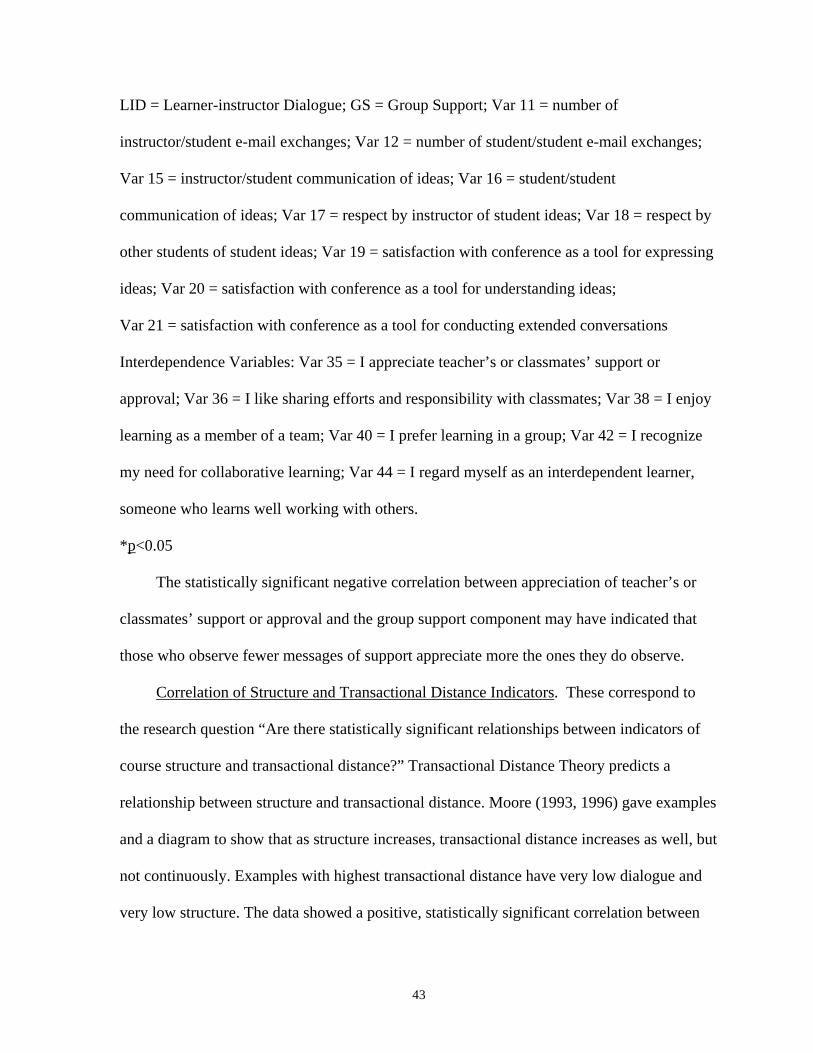
43
LID = Learner-instructor Dialogue; GS = Group Support; Var 11 = number of
instructor/student e-mail exchanges; Var 12 = number of student/student e-mail exchanges;
Var 15 = instructor/student communication of ideas; Var 16 = student/student
communication of ideas; Var 17 = respect by instructor of student ideas; Var 18 = respect by
other students of student ideas; Var 19 = satisfaction with conference as a tool for expressing
ideas; Var 20 = satisfaction with conference as a tool for understanding ideas;
Var 21 = satisfaction with conference as a tool for conducting extended conversations
Interdependence Variables: Var 35 = I appreciate teacher’s or classmates’ support or
approval; Var 36 = I like sharing efforts and responsibility with classmates; Var 38 = I enjoy
learning as a member of a team; Var 40 = I prefer learning in a group; Var 42 = I recognize
my need for collaborative learning; Var 44 = I regard myself as an interdependent learner,
someone who learns well working with others.
*p<0.05
The statistically significant negative correlation between appreciation of teacher’s or
classmates’ support or approval and the group support component may have indicated that
those who observe fewer messages of support appreciate more the ones they do observe.
Correlation of Structure and Transactional Distance Indicators. These correspond to
the research question “Are there statistically significant relationships between indicators of
course structure and transactional distance?” Transactional Distance Theory predicts a
relationship between structure and transactional distance. Moore (1993, 1996) gave examples
and a diagram to show that as structure increases, transactional distance increases as well, but
not continuously. Examples with highest transactional distance have very low dialogue and
very low structure. The data showed a positive, statistically significant correlation between
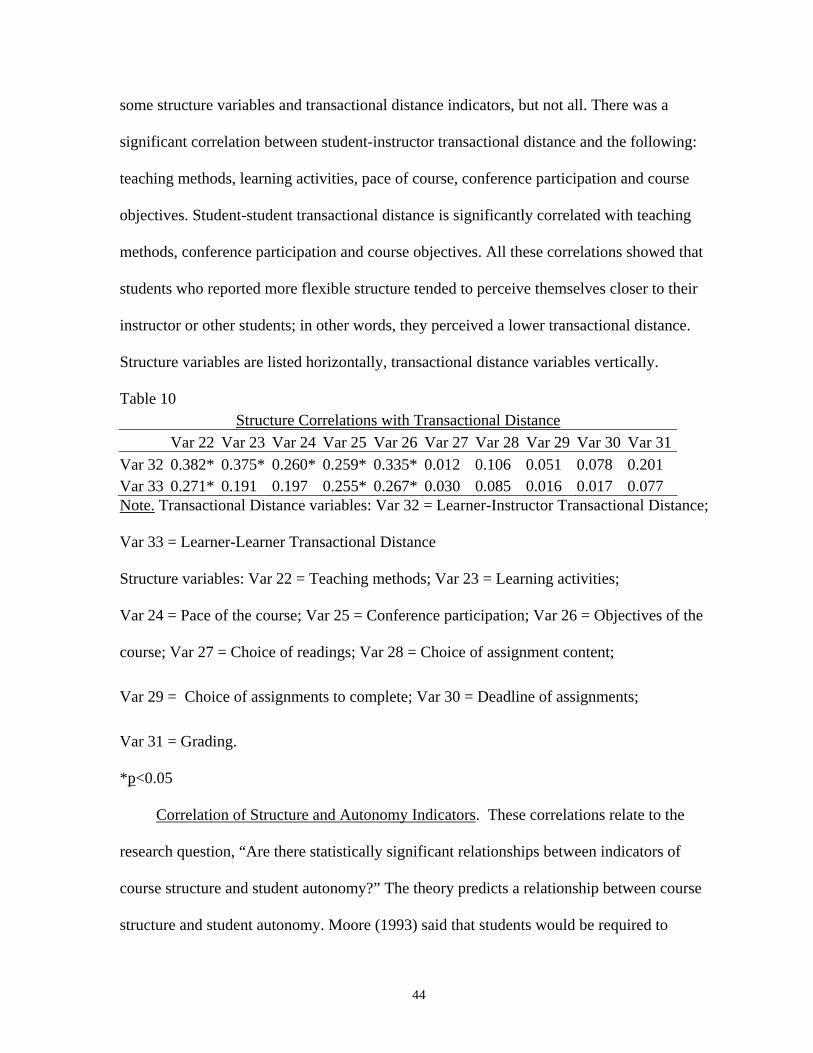
44
some structure variables and transactional distance indicators, but not all. There was a
significant correlation between student-instructor transactional distance and the following:
teaching methods, learning activities, pace of course, conference participation and course
objectives. Student-student transactional distance is significantly correlated with teaching
methods, conference participation and course objectives. All these correlations showed that
students who reported more flexible structure tended to perceive themselves closer to their
instructor or other students; in other words, they perceived a lower transactional distance.
Structure variables are listed horizontally, transactional distance variables vertically.
Table 10 Structure Correlations with Transactional Distance
Var 22 Var 23 Var 24 Var 25 Var 26 Var 27 Var 28 Var 29 Var 30 Var 31Var 32 0.382* 0.375* 0.260* 0.259* 0.335* 0.012 0.106 0.051 0.078 0.201 Var 33 0.271* 0.191 0.197 0.255* 0.267* 0.030 0.085 0.016 0.017 0.077 Note. Transactional Distance variables: Var 32 = Learner-Instructor Transactional Distance;
Var 33 = Learner-Learner Transactional Distance
Structure variables: Var 22 = Teaching methods; Var 23 = Learning activities;
Var 24 = Pace of the course; Var 25 = Conference participation; Var 26 = Objectives of the
course; Var 27 = Choice of readings; Var 28 = Choice of assignment content;
Var 29 = Choice of assignments to complete; Var 30 = Deadline of assignments;
Var 31 = Grading.
*p<0.05
Correlation of Structure and Autonomy Indicators. These correlations relate to the
research question, “Are there statistically significant relationships between indicators of
course structure and student autonomy?” The theory predicts a relationship between course
structure and student autonomy. Moore (1993) said that students would be required to
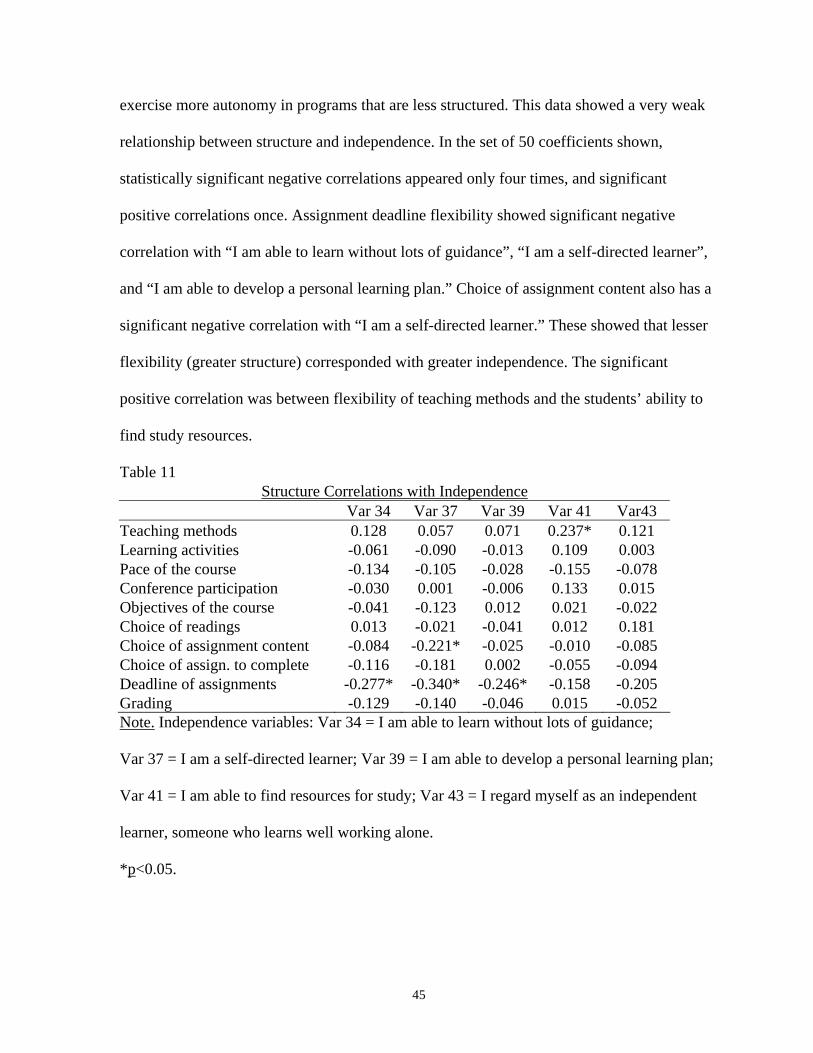
45
exercise more autonomy in programs that are less structured. This data showed a very weak
relationship between structure and independence. In the set of 50 coefficients shown,
statistically significant negative correlations appeared only four times, and significant
positive correlations once. Assignment deadline flexibility showed significant negative
correlation with “I am able to learn without lots of guidance”, “I am a self-directed learner”,
and “I am able to develop a personal learning plan.” Choice of assignment content also has a
significant negative correlation with “I am a self-directed learner.” These showed that lesser
flexibility (greater structure) corresponded with greater independence. The significant
positive correlation was between flexibility of teaching methods and the students’ ability to
find study resources.
Table 11 Structure Correlations with Independence
Var 34 Var 37 Var 39 Var 41 Var43 Teaching methods 0.128 0.057 0.071 0.237* 0.121 Learning activities -0.061 -0.090 -0.013 0.109 0.003 Pace of the course -0.134 -0.105 -0.028 -0.155 -0.078 Conference participation -0.030 0.001 -0.006 0.133 0.015 Objectives of the course -0.041 -0.123 0.012 0.021 -0.022 Choice of readings 0.013 -0.021 -0.041 0.012 0.181 Choice of assignment content -0.084 -0.221* -0.025 -0.010 -0.085 Choice of assign. to complete -0.116 -0.181 0.002 -0.055 -0.094 Deadline of assignments -0.277* -0.340* -0.246* -0.158 -0.205 Grading -0.129 -0.140 -0.046 0.015 -0.052 Note. Independence variables: Var 34 = I am able to learn without lots of guidance;
Var 37 = I am a self-directed learner; Var 39 = I am able to develop a personal learning plan;
Var 41 = I am able to find resources for study; Var 43 = I regard myself as an independent
learner, someone who learns well working alone.
*p<0.05.
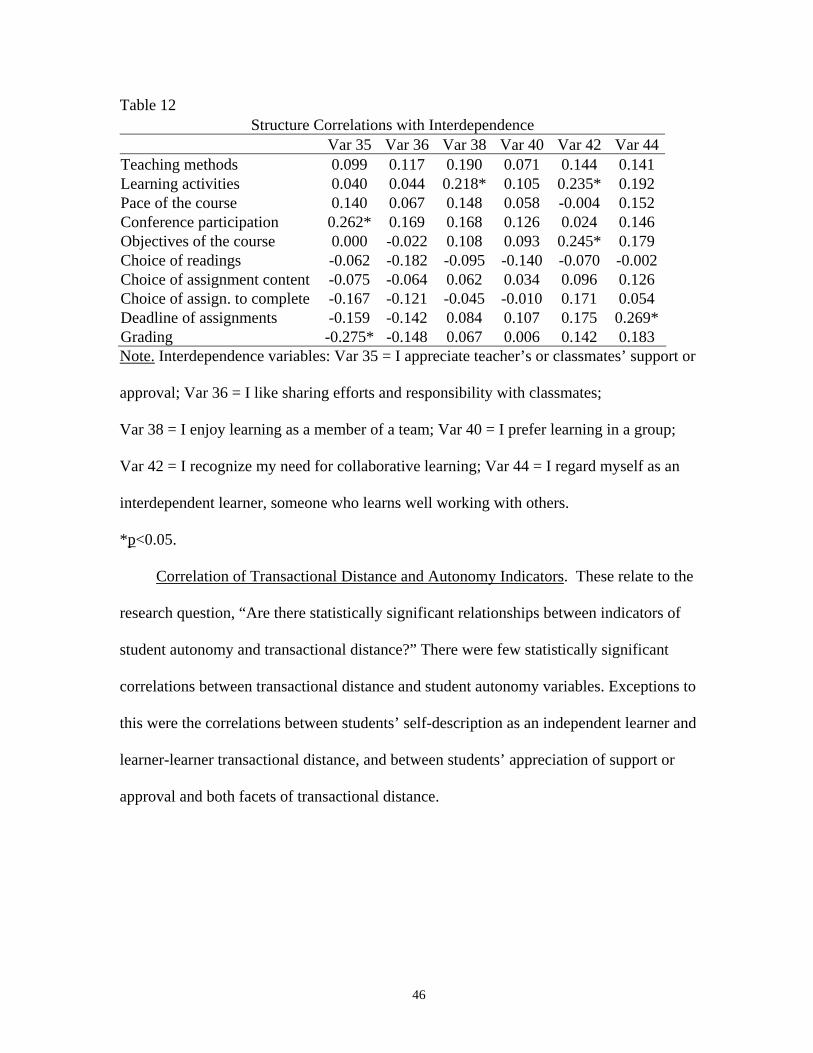
46
Table 12 Structure Correlations with Interdependence
Var 35 Var 36 Var 38 Var 40 Var 42 Var 44Teaching methods 0.099 0.117 0.190 0.071 0.144 0.141 Learning activities 0.040 0.044 0.218* 0.105 0.235* 0.192 Pace of the course 0.140 0.067 0.148 0.058 -0.004 0.152 Conference participation 0.262* 0.169 0.168 0.126 0.024 0.146 Objectives of the course 0.000 -0.022 0.108 0.093 0.245* 0.179 Choice of readings -0.062 -0.182 -0.095 -0.140 -0.070 -0.002 Choice of assignment content -0.075 -0.064 0.062 0.034 0.096 0.126 Choice of assign. to complete -0.167 -0.121 -0.045 -0.010 0.171 0.054 Deadline of assignments -0.159 -0.142 0.084 0.107 0.175 0.269*Grading -0.275* -0.148 0.067 0.006 0.142 0.183 Note. Interdependence variables: Var 35 = I appreciate teacher’s or classmates’ support or
approval; Var 36 = I like sharing efforts and responsibility with classmates;
Var 38 = I enjoy learning as a member of a team; Var 40 = I prefer learning in a group;
Var 42 = I recognize my need for collaborative learning; Var 44 = I regard myself as an
interdependent learner, someone who learns well working with others.
*p<0.05.
Correlation of Transactional Distance and Autonomy Indicators. These relate to the
research question, “Are there statistically significant relationships between indicators of
student autonomy and transactional distance?” There were few statistically significant
correlations between transactional distance and student autonomy variables. Exceptions to
this were the correlations between students’ self-description as an independent learner and
learner-learner transactional distance, and between students’ appreciation of support or
approval and both facets of transactional distance.
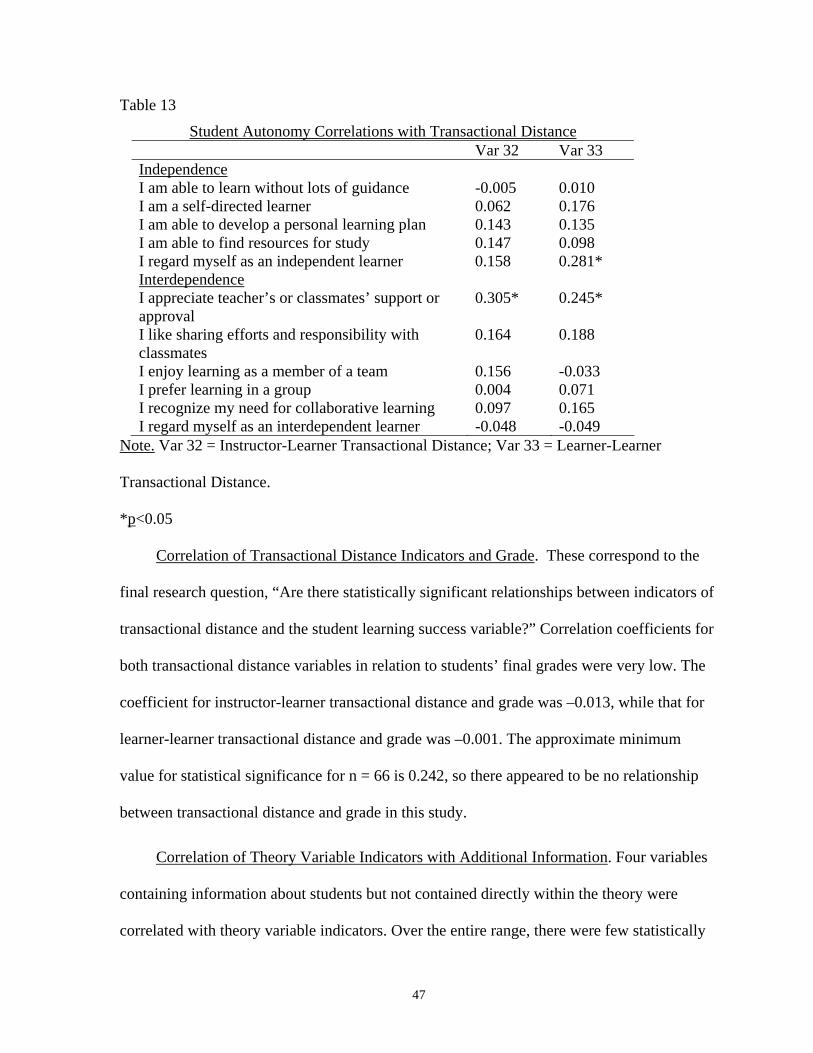
47
Table 13
Student Autonomy Correlations with Transactional Distance Var 32 Var 33 Independence I am able to learn without lots of guidance -0.005 0.010 I am a self-directed learner 0.062 0.176 I am able to develop a personal learning plan 0.143 0.135 I am able to find resources for study 0.147 0.098 I regard myself as an independent learner 0.158 0.281* Interdependence I appreciate teacher’s or classmates’ support or approval
0.305* 0.245*
I like sharing efforts and responsibility with classmates
0.164 0.188
I enjoy learning as a member of a team 0.156 -0.033 I prefer learning in a group 0.004 0.071 I recognize my need for collaborative learning 0.097 0.165 I regard myself as an interdependent learner -0.048 -0.049
Note. Var 32 = Instructor-Learner Transactional Distance; Var 33 = Learner-Learner
Transactional Distance.
*p<0.05
Correlation of Transactional Distance Indicators and Grade. These correspond to the
final research question, “Are there statistically significant relationships between indicators of
transactional distance and the student learning success variable?” Correlation coefficients for
both transactional distance variables in relation to students’ final grades were very low. The
coefficient for instructor-learner transactional distance and grade was –0.013, while that for
learner-learner transactional distance and grade was –0.001. The approximate minimum
value for statistical significance for n = 66 is 0.242, so there appeared to be no relationship
between transactional distance and grade in this study.
Correlation of Theory Variable Indicators with Additional Information. Four variables
containing information about students but not contained directly within the theory were
correlated with theory variable indicators. Over the entire range, there were few statistically
48
significant correlations. Half of them were concentrated in the independence subset of
student autonomy.
Student skill at using computer communications technology, such as computer
conferencing, chat programs and e-mail, correlated at a significant level with eight variables
in all. There were positive correlations with two dialogue and four independence variables,
and negative correlations with one structure and one transactional distance variable. Both of
the dialogue correlations involved respectful communication variables. The only indicator of
independence that was not positively correlated to skill with computer communications
technology at a significant level was the variable “I am a self-directed learner.”
Student knowledge of current course’s subject matter before taking the course was
significantly correlated with fewer variables. It showed a positive correlation with one
dialogue and three structure variables. It was the only additional information variable of the
four to show no correlations with independence variables.
Access to computer communications software, and the number of Athabasca University
CMC courses taken previously, was each correlated with only three variables at a significant
level. Access correlated positively with three independence variables. The number of
previous courses correlated negatively with one structure variable and showed two positive
correlations with independence. Access to communications software correlated positively
with ability to learn without guidance, being a self-directed learner and ability to find
learning resources. The number of Athabasca University distance education courses taken
correlated positively with being a self-directed learner and self-regard as being an
independent learner. A table showing the complete set of correlations can be found in
Appendix F.
49
Chi-square Test of Independence of Theory Variable Indicators from Additional
Information. This test of independence was used with theory variable indicators and three
categorical or nominal variables showing additional information about students. They were:
• Gender
• Student status, categorized as “non-program and non-diploma”, “diploma” and
“program”
• Age, categorized as “under 20”, “21-30”, “31-40”, “41-50”, “51-60”, “61-70”
and “over 70.”
Although the name of the test suggests identification of causality, it does not serve that
purpose. Under the assumption that the two variables are independent of each other, a Chi-
square value as high as or higher than the one resulting from the test will occur by chance
five times in 100 at the chosen probability level. The SPSS program was used to create cross-
tabulated frequency tables, or contingency tables, for pairs of variables. These tables were
modified where necessary by combining contents of adjacent cells to satisfy the test
assumption of a frequency of at least five in each cell. This normally involved combining
cells on the left or right side of the table, as frequencies in the centre tended to be highest.
The resulting table was entered into the calculator as a matrix and the Chi-Square Test
function executed. The output from the function included the Chi-Square value, its p-value,
and the number of degrees of freedom. Several test tables were used to compare the
calculator test function with a statistics computer program (Doan, 1988) and an online Chi-
square test program (Arsham, 1994). Modified contingency tables were re-checked with the
originals to ensure accurate frequency entry. There were eight variable-variable comparisons
from a total of 120 that did not meet the Chi-square test assumption of at least five
50
occurrences in each contingency table cell; each of the eight had a low of four occurrences.
The test indicated that few of the theory variable indicators were associated with any of the
three additional information variables. Two indicators were associated with gender. They
were the degree to which students felt the instructor showed respect for their ideas about the
course subject matter, and students perception of the degree of flexibility of assignment
content. None of the indicators were associated with students’ program status. The only
indicator associated with student age was the degree to which students felt that other students
were respectful of their ideas. Tables showing the results of the test calculations may be
found in Appendix F.
51
Chapter V
CONCLUSIONS AND RECOMMENDATIONS
Summary of Results
Transactional Distance Theory predicts certain relationships between dialogue, course
structure, transactional distance, and student autonomy. However, Moore (1993; Moore &
Kearsley, 1996) refers to these as clusters or sets of variables, which leaves the possibility
that relationships between elements of the sets may be more complex than the generalized
relationships between the sets themselves. This study partially supports the predicted
relationships; qualified rather than full support may follow from the complexity of the theory
variable sets.
Confirmation of predicted relationships is described as partial because many of the
correlation coefficients were too low to be statistically significant at the chosen level. There
were few significant correlations between dialogue and course structure, but those that did
exist showed that lower structure corresponded with greater dialogue. There were few
significant correlations between dialogue and student autonomy, as well. Greater autonomy
appeared to correspond to greater dialogue. There was a clearly evident negative relationship
between dialogue and transactional distance, with a large proportion of the correlations being
significant. They showed that high dialogue corresponded to low transactional distance. The
proportion of significant correlations between structure and autonomy was very low. The
majority of significant correlations between structure and independence were negative, while
the majority of those between structure and interdependence were positive. With respect to
their correlations with transactional distance, structure indicators separated distinctly into two
52
groups. One group showed no significant correlations at all, the other a very high proportion
of them. Those indicated that less structure corresponded with lower transactional distance.
There was a very low percentage of significant correlations between autonomy and
transactional distance, with the few that did occur showing that greater autonomy
corresponded with lesser transactional distance. Neither correlation between transactional
distance and student grade was close to being significant.
Other variables, not grouped within the theory variable clusters but potentially having
some influence on the respondents’ distance studies, were statistically related to a few of the
theory variable indicators.
Comparison to Results of Previous Studies
Saba and Shearer (1994) found that there were dynamic relationships between dialogue,
structure, and transactional distance. In their study, an increase in dialogue reduced structure
and an increase in structure reduced dialogue. The present study does not attempt to show
causal relationships, but those correlations that are statistically significant between dialogue
and structure are consistent with their findings. The number of significant correlations is
small, however, eleven of 120 possible.
Saba and Shearer also found that an increase in dialogue reduced transactional distance.
All the significant correlations between dialogue and transactional distance in the present
study are consistent with this finding. Sixteen of 24 correlations are statistically significant,
so there is stronger confirmation of this relationship than that between dialogue and structure.
Their study showed that an increase in structure led to an increase in transactional
distance. Again, the statistically significant correlations between structure and transactional
distance in this study were consistent with this relationship. Of the ten correlations between
53
the last five structure indicators and those of transactional distance, none were significant; of
the ten between the first five structure indicators and transactional distance, eight were
significant. These were:
• Learner-instructor transactional distance with flexibility of teaching methods,
learning activities, pace of course, conference participation, and course
objectives.
• Learner-learner transactional distance with teaching methods, conference
participation, and course objectives.
Learner-learner transactional distance correlations with learning activities and pace of course
were consistent with the pattern just described, but were below the level of significance.
Bischoff, Bisconer, Kooker and Woods (1996) found three relationships that were
consistent with those found in the Saba and Shearer (1994) study. First, there was a negative
correlation between dialogue and structure. Second, there was a positive correlation between
structure and transactional distance. Finally, there was a negative correlation between
dialogue and transactional distance. Because these findings are consistent with those of Saba
and Shearer, the relationships found in the present study support them to the same degree.
Brenner (1996) inferred in his study of the relationship between cognitive style and
achievement in a distance education course that students who earned higher grades were
better able to cope with the transactional distance between themselves and their instructors.
Data from the present study does not support this inference. There was no relationship found
between students’ final course marks and the transactional distance they reported, relative to
either their instructors or other students.
54
There were too many confounding variables in Bunker, Gayol, Nti, and Reidell’s
(1996) research to draw any conclusions about consistency or lack thereof with the present
study. They found that in sessions having different degrees of structure there were different
amounts of dialogue, but it was not possible to determine causes of the variation.
Chen’s (1997) study partially supported Moore’s theory, but there were predicted
relationships that did not appear. She concluded, for example, that transactional distance was
not related to course structure. Correlations between five structure indicators and the two
transactional distance indicators in the present study support this conclusion. However, there
were statistically significant correlations between learner-instructor transactional distance
and all five of the other structure indicators, and between learner-learner transactional
distance and three of the five. All the correlations that were significant are consistent with
Moore’s theory.
Chen also concluded that transactional distance was not related to student autonomy.
Students’ self-description as an independent learner was significantly correlated with learner-
learner transactional distance in the present study, and students’ appreciation of the support
or approval of instructor and other students was significantly correlated with both forms of
transactional distance, but the other 19 possible correlation coefficients in this study were too
small to be significant. These results therefore supported Chen’s conclusion.
Transactional distance for off-site students was negatively correlated with instructor-
student dialogue in Chen’s study, supporting Moore’s theory. Although there were some
dialogue indicators in the present study that did not correlate at a significant level with
transactional distance indicators, many did, and the correlations were consistent with Chen’s
results.
55
Finally, Chen concluded that students’ perceived learning was negatively correlated
with transactional distance. In the present study, no significant correlation was found
between student marks and transactional distance. These results may be but are not
necessarily inconsistent, because of the difference between students’ perceived learning and
assigned grades.
Hopper (2000) found that the students in his study did not consider transactional
distance to be an impediment to achievement or to their satisfaction with a program. There
was no significant correlation found between transactional distance and student marks in the
present study, which is consistent with Hopper’s findings.
Jung (2001), in a critical literature review, identified three types of dialogue. They
were: “1) academic interaction between learners and instructors, including external experts;
2) collaborative interaction among learners; 3) interpersonal interaction between learners and
instructors, or among learners.” Although they were based on a small number of variables
and should be considered tentative descriptions, the “Learner-Instructor Dialogue, Learner-
Group Dialogue, and Group Support” components described in the present study are quite
similar to Jung’s reported types.
Burge (1994) found that students considered student-teacher dialogue to be important to
their learning. There are no questions in the present study directly asking students to evaluate
their learning, but there are some that could be considered to be related. The Learner-
Instructor Dialogue component was significantly correlated with effective communication
with the instructor and other learners, as well as satisfaction with the conference technology
as a tool for expressing ideas to others, understanding the ideas of others, and conducting an
extended dialogue. Students in Burge’s study also reported that student-student dialogue was
56
important to their learning. In this study, Learner-Group Dialogue had a significant
correlation with effective communication with other students and with satisfaction with
conference technology as a tool for expression of ideas. To the extent that this study’s
variables relate to student evaluation of learning, the results of the two studies are consistent.
Students in Fabro’s (1996) study reported that their learning was affected by instructor-
student dialogue and by instructor-controlled structure. They considered it important for the
instructor to be an active participant in their conference, which is similar to the position
expressed by students in Burge’s (1994) study, and is supported by the present study as
described above. In the present study, neither effective nor respectful communication related
to any structure indicator. All three aspects of satisfaction with the conference technology are
related to conference participation (one part of instructor-controlled structure). Satisfaction
with conference technology as a tool for extended discussion is related to teaching methods,
learning activities, and course objectives as well. All would likely be seen by students as
teacher-controlled aspects of structure.
Chen (2001) reported that there were four components of transactional distance found
in her study. They were learner-instructor, learner-learner, learner-content, and learner-
interface transactional distance. She expected to find that previous distance education
experience and student support would be significantly related to transactional distance, but
they were not. She found that student skill with the Internet was negatively correlated with
learner-content and learner-interface components, and that on-line interaction was negatively
correlated with learner-learner and learner-interface components. The present study was not
designed to investigate learner-content or learner-interface transactional distance, but the
study did give the same negative result as Chen’s with respect to previous distance education
57
experience, and both learner-instructor and learner-learner transactional distance. This
study’s variable “skill with computer communications technology” is very similar to Chen’s
“Skill level in using the Internet” and was also found to be negatively correlated with learner-
learner transactional distance. Most, but not all, dialogue indicators that referred specifically
to the asynchronous conference in this study correlated with learner-learner transactional
distance negatively, as did her on-line interaction and learner-learner transactional distance
components. The one that did not was the Group Support component. Although “interaction”
and “dialogue” differ according to the definition used in the present study, these results are
comparable. Chen did not find a significant correlation between on-line interaction and
teacher-learner transactional distance. In contrast, only the Learner-Group Dialogue and
Group Support components and the variable indicating ability to communicate effectively
with other students via the conference, of the variables referring to the conference, did not
have a significant negative correlation with learner-instructor transactional distance in this
study. These results are, therefore, inconsistent with those of Chen’s study.
Huang (2002) studied the relationships between several variables and students’
perception of the communication interface. She found that there was a significant correlation
between student age and interaction, course structure, and perception of the communication
interface. In the present study, only one dialogue indicator was not independent of age; all
structure indicators were independent of age, as were the dialogue indicators that included
satisfaction with the conference technology in their question wording. Huang reported a
significant correlation between experience with a Web browser and both student autonomy
and interface perception. The present study contained one similar variable referring to skill
with computer communications software. There was no significant correlation between it and
58
the dialogue indicators referring to satisfaction with conference technology. It correlated at a
significant level with four of five independence variables and none of the interdependence
variables.
She concluded that perception of the interface should be incorporated into the
Transactional Distance theory, having found that it was closely related to interaction,
structure, and autonomy. Only the three dialogue indicators that make reference to
satisfaction with the conference technology are similar to her “perception of interface”
variable. The present study showed a significant correlation between each of the three and
the Learner-Instructor Dialogue component, between one of the three and Learner-Group
Dialogue, and none with Group Support. It also showed significant correlations between all
three dialogue indicators referring to conference satisfaction and both indicators of respectful
communication, as well as both indicators of effective communication. Therefore, although
the variables referred to are indicators of dialogue in this study, there is a parallel with the
results of Huang’s study.
Huang found student interdependence to be related to student-student interaction and to
course organization. The interdependence indicator “I appreciate teacher’s or students’
support or approval” correlated with the Group Support component and all three dialogue
indicators making reference to satisfaction with the conference technology as a
communication tool, and there is a significant correlation between “I like sharing efforts and
responsibility with classmates” and satisfaction with the conference technology as a tool for
expressing ideas to others. With these exceptions, correlations between student
interdependence and learner-learner interaction are not significant and so do not confirm
Huang’s findings. Only six of 60 correlations between student interdependence and course
59
structure are statistically significant in this study and there is no obvious pattern to those that
are significant, so confirmation of the relationship between these variable groups is very
weak at best.
Answers to Research Questions
1) Are there statistically significant relationships between the indicators of dialogue and
course structure?
There are statistically significant relationships, but they are not common. Only 11 of
120 correlations are high enough in value to be significant. Two of the ten structure
indicators, flexibility of conference participation and flexibility of course objectives, account
for eight of the 11 significant correlations. The dialogue indicator referring to satisfaction
with the conference technology as a tool for extended discussions is correlated at a
significant level with four structure indicators, including conference participation.
2) Are there statistically significant relationships between indicators of dialogue and student
autonomy?
There are 17 significant correlations of a possible 132. Appreciation of approval or
support from the instructor or other students correlates at a significant level with six of the 12
dialogue indicators, and student self-description as an independent learner correlates at a
significant level with four. The dialogue indicators referring to satisfaction with the
conference technology as a tool for expressing ideas and understanding the ideas of others
correlate at a significant level with five and four autonomy indicators, respectively, including
the two mentioned above.
3) Are there statistically significant relationships between indicators of dialogue and
transactional distance?
60
There are significant correlations between most of the dialogue indicators and those of
transactional distance. The Group Support component and both indicators referring to e-mail
show significant correlations with neither transactional distance indicator, and the Learner-
Group Dialogue component and the dialogue indicator referring to effective communication
with other students correlate at a significant level with the learner-learner transactional
distance only. The other seven dialogue indicators correlate at a significant level with both
transactional distance indicators.
4) Are there statistically significant relationships between indicators of course structure and
student autonomy?
There are few statistically significant correlations between structure and autonomy,
eleven of one hundred ten. The structure indicator that correlated at a significant level with
the largest number of autonomy indicators was flexibility of assignment deadlines, which
was related to three indicators of independence and one of interdependence.
5) Are there statistically significant relationships between indicators of course structure and
transactional distance?
Course structure indicators separate into two groups. One contains five indicators that
show no significant correlation with either transactional distance indicator, and the other
contains five indicators that correlate at a significant level with the transactional distance
indicators in eight of 10 possible cases. All of the former could be considered aspects of
course structure involving individual action such as choice of readings and choice of
assignments. The latter may be described as aspects involving the whole learning group, such
as teaching methods and the pace of the course.
61
6) Are there statistically significant relationships between indicators of student autonomy and
transactional distance?
There was one statistically significant correlation out of ten between transactional
distance and independence indicators. Students’ self-description as an independent learner
was related to transactional distance between the respondent and other students. Two
correlations of 12 between transactional distance and interdependence indicators were
statistically significant. Students’ appreciation of the approval or support of the instructor or
other students was related to both transactional distance indicators.
7) Are there statistically significant relationships between indicators of transactional distance
and the student learning success variable?
There was no significant correlation between either of the transactional distance
indicators and students’ final grades.
Significance and Implications of Results
Moore (1993) stated that ”The whole point and purpose of distance education theory is
to summarize the different relationships and strength of relationship among and between
these variables that make up transactional distance, especially the behaviours of teachers and
learners.” He recognized that these variables, course structure and dialogue together with
student autonomy, were best considered clusters of variables. He wrote in “Distance
Education: A Systems View” (Moore & Kearsley, 1996), “There is, however, need for much
more research of an empirical nature to identify the many variables that lie within structure,
dialog, and autonomy, and to explore them more thoroughly. It is essential that we
empirically test specific variables that comprise these broad dimensions, and the relationships
62
among them.” This study gives preliminary information that can be used to design those
empirical tests in the context of computer-based asynchronous conferences.
Some relationships predicted by Transactional Distance Theory were supported by the
results of this study, but not all. The predicted correlations between dialogue, course
structure, and transactional distance appeared in the data, especially if non-significant
correlations were included. If more autonomous students tend to select courses with higher
transactional distance, then the indicators in this study should show negative autonomy
correlations with dialogue, structure, and transactional distance. This relationship did appear
between independence indicators of autonomy and structure, but not in any of the other
cases, whether non-significant correlations were considered or not.
There are several possible reasons for these findings. It may be that perfect data from
this population would support the theory fully, but that the indicators chosen may not
represent the theory variables accurately and therefore gave misleading data. Participation in
the conferences varies over time, so surveys taken at other times during the courses may give
different results. The study is also limited in several other ways described previously; these
limitations may skew the results so as to reduce the level of support for the theory.
Conversely, the results may adequately represent the actual relationships between theory
variables in this context. The relationships between variable clusters are, in that case, more
complex than those described in the original theory.
The correlation between transactional distance and student grades was not statistically
significant. That may be because most students described themselves as very independent,
and that for such learners transactional distance is not a significant factor in their learning
success. Although Moore (1993) stated that autonomous learners would be comfortable in
63
situations of higher transactional distance, this does not imply they would do poorly in
courses where they found the transactional distance to be low. Course content has an
influence on the degree to which the instructor and other students will act as information
sources. If this role is minor, transactional distance may have a limited influence on student
achievement. There are also factors such as motivation that influence student grades; these
may have a greater influence than does transactional distance and mask its effects.
There were few significant correlations between structure and autonomy indicators.
Student autonomy may be considered from two different viewpoints. From one, it is part of
the nature of the relationship between instructors and students. From the other, it is the result
of a set of personal attributes of students. The autonomy variable questions asked about
personal characteristics that students considered themselves to have and that related to their
course work. The structure variables chosen may not be directly related to these variables,
but to others that describe a range of behaviors that students feel they are given the freedom
to exhibit. Three independence variables correlated with the flexibility of assignment
deadlines structure variable in a manner that indicated more independent students found the
deadlines less flexible. This may simply indicate that their sense of independence led them to
prefer more flexibility than was available for assignment deadlines.
There were, as well, few significant correlations between dialogue and autonomy
indicators, but some patterns could be seen. Dialogue indicators relating to satisfaction with
the conference technology were more closely related than any others to autonomy indicators.
However, indicators of satisfaction with the conference technology as a tool for expressing
ideas and for understanding ideas were not related to autonomy indicators in the same way as
the indicator satisfaction with the technology as a tool for engaging in a line of discussion.
64
The first two were related to three of five independence indicators, while the latter was
related to none of them. Satisfaction with the technology as a tool for expression of ideas was
the only one of the three related to an interdependence indicator other than that of the
appreciation of approval or support. Appreciation of the approval or support of the instructor
or classmates was related to the level of effective communication with the instructor, the
instructor’s respect for the student’s ideas and all three indicators of satisfaction with the
conference technology. This was a stronger relationship with dialogue than there was for any
other autonomy indicator. Although the students were enrolled in graduate-level classes,
described themselves as very independent learners, and might be considered indifferent to its
effects, their appreciation for approval or support was still related to their level of dialogue.
The relationship between dialogue and structure in this study was weak, although there
were exceptions. Flexibility in conference participation and in course objectives, more than
in any of the other structure indicators, was closely related to dialogue. All the correlations
were positive, so more flexibility corresponded to higher dialogue variable levels. Flexibility
in all other structure variables, including teaching methods, learning activities, and pace of
the course was related to dialogue either very little or not at all. If this is accurate, teaching
methods and learning activities used by instructors are less important than their support or
approval of students in influencing most dialogue indicator levels. Satisfaction with the
technology as a tool for extended discussion was related to four structure indicators, which
were flexibility in teaching methods, learning activities, conference participation, and course
objectives. If teaching methods’ and learning activities’ flexibility are related to satisfaction
with the conference technology as a communication tool, they may have more influence on
extended conversations than on individual students expressing their ideas or understanding
65
the ideas of others. This may be related to the tendency in some conferences for submissions
to be more a series of isolated declarations than part of an on-going dialogue. Students can
make themselves understood in declarative postings and can understand what others have
written regardless of instructor behaviors, but appropriate teaching methods and learning
activities could lead students into a more dialogic mode of communication.
Moore (Moore & Kearsley, 1996) stated that “The more highly autonomous the
learners, the greater the distance they can feel comfortable with,” and hypothesized that more
autonomous learners would gravitate toward educational programs characterized by higher
transactional distance. There was little relationship between the autonomy indicators used
and those of transactional distance in this study. That may be because there are other factors
more influential than their expected comfort level in a student’s choice to enroll in a course.
For example, students may enroll in courses offered for professional certification whether or
not they anticipate a high comfort level in the courses. From another perspective, both
transactional distance indicators were related to the student’s appreciation of instructor or
peer approval or support, so there may be other autonomy indicators, not used in this study,
that are closely related to transactional distance.
The strength of relationship between structure and transactional distance indicators
seemed to depend on whether the structure indicator referred to something that primarily
affected only the individual or whether it affected the whole learning group in some way. For
example, flexibility in choice of readings did not have a significant level of correlation with
either form of transactional distance, but flexibility in learning activities was correlated at a
significant level with both. This distinction is not perfect, however, because some students
may have had a choice of doing individual assignments that would have affected no-one else,
66
or doing collaborative assignments that would have affected others, yet flexibility in choice
of assignments is not significantly correlated with transactional distance. Increased flexibility
in aspects of structure that affect the whole or most of the group may be perceived by
students as removing some of the barriers interfering with development of a closer working
relationship with instructors and other students. Students apparently did not consider any lack
of flexibility in aspects of structure, such as grading or assignment deadlines, to be the fault
of instructors. If they did, that did not interfere with their sense of transactional distance
between themselves and their instructor.
Dialogue showed a more evident relationship with transactional distance than did any
of the other variable sets. This observation does not, however, include either the Group
Support component described in this study or e-mail communications. It may be that if the
Group Support component was composed of different variables, or more of them, its
relationship to transactional distance would be stronger. E-mail communications, in the
experience of this writer, are not part of a formal communication structure in Athabasca
University CDE courses other than for submission and return of assignments. If e-mail were
to be an integral part of course communications it might be related more closely to
transactional distance in this setting.
The two dialogue components other than Group Support were both correlated with
transactional distance at a significant level. Learner-Instructor Dialogue showed a significant
correlation with both facets of transactional distance, while Learner-Group Dialogue was
significantly correlated with learner-learner transactional distance only. The variables
relating to expressing ideas in reply to another student’s posting and to asking a content-
related question of another student were the greatest contributors to the Learner-Group
67
Dialogue scores, and as neither of these are directly related to the instructor this may explain
the low correlation with learner-instructor transactional distance. Student replies to
instructors’ questions make an important contribution to Learner-Instructor Dialogue, and
this component is correlated at a significant level with learner-learner transactional distance.
This apparently confusing result might be explained by the discussion management technique
of instructors asking open-ended questions. Students may respond to these questions in the
knowledge that they are really expressing their ideas to the whole group rather than directing
their replies only to the instructor.
A similar pattern could be seen in the correlations between effective communication
and transactional distance. Effective communication with the instructor via the conference
was correlated at a significant level with both facets of transactional distance, while effective
communication with other students was significantly correlated only with learner-learner
transactional distance. This may suggest an alternative explanation for both the dialogue
component and effective communication indicator patterns, that students feel their
competence to be evaluated by their peers based on conference messages. A higher level of
dialogue and greater sense of effective communication may correspond to a greater sense of
comfort with or closeness to the learning group, whether communication is with the
instructor or other students.
Respondents’ perceptions that their ideas were respected by their instructor and other
students was related to both aspects of transactional distance. That a student would feel
closer to someone who respects his or her ideas is predictable. Reasons for significant
correlations between respect from the instructor and learner-learner transactional distance,
and between respect from students and learner-instructor transactional distance, are not as
68
obvious. Again, this may be explained by the perception that the respect is being shown in
front of the whole group, making the recipient feel closer to all members of the group.
Satisfaction with the conference technology as a tool for expressing ideas to others,
understanding the ideas of others and engaging in a line of discussion were correlated at a
significant level with both facets of transactional distance. Because the bulk of
communication with the learning group was through the asynchronous conference, it is
reasonable that there would be no differentiation between the two aspects of transactional
distance with respect to satisfaction with the technology. This study used satisfaction with the
technology as a communication tool as an indicator of dialogue, because dialogue as
“purposive, constructive” (Moore, 1993) interaction must take place via the conference
technology. Although they were not asked to evaluate the technology on other scales such as
ease of use, students must become comfortable enough with it to make the dialogue the focus
of their attention.
The primary significance of this study is that it provides some new information for
other researchers interested in studying the relationship of Moore’s Transactional Distance
Theory to asynchronous computer conferences in distance education programs.
Recommendations for Further Research
It is recommended that further correlational studies be done with larger sample sizes to
add more reliable basic information about variable relationships. However, striving for
continually larger sample size alone would not, in the opinion of this writer, be the most
effective way to improve our understanding of Transactional Distance Theory. Improvement
in reliability is not linear with sample size, and in many cases there are practical problems
associated with acquiring very large samples. As well as additional broad studies involving a
69
wide range of theory variable clusters, there is a need for more focused studies with the goal
of providing detailed information about selected indicators.
One of the most urgent tasks to be completed in the study of Transactional Distance is
clarification of elements of the theory variable sets. There has been so little research of
Transactional Distance Theory in asynchronous conferences that there is no consensus on
what indicators to use for the theory variable clusters. The results of this and previous studies
suggest the existence of underlying components of the variables. Part of the selection process
for indicator variables could be preference for ones that would help clarify a meaningful set
of components, if they exist. This determination of effective indicators of theory variables
would make subsequent study of the structure of interrelationships between theory variable
clusters more organized.
Identification of variables that are elements of the theory variable clusters and
identification of good indicators of those variables would have a significant impact on our
understanding of the theory. Use of interval or ratio scale variables would permit analysis
that could lead to more detailed information than can be gained from ordinal scale variables.
Also, use of other research methods such as those that involve personal interviews or
discourse analysis of conference logs could give different perspectives of the concepts that
the theory variables represent.
Students rated the degree of flexibility in several aspects of course structure to be only
moderate, yet they perceived the transactional distance between themselves and their
instructors to be quite low. Further studies may reveal why this is so, given that in this study
greater flexibility corresponded to lower transactional distance.
70
Research should be done to examine how various types of message influence
transactional distance between the student and other conference participants. In this study,
perception of respect from and effective dialogue with other students appeared related to
instructor-learner transactional distance, and respect from and effective dialogue with the
instructor appeared related to learner-learner transactional distance.
It is also important to know the relationships between theory variables and student
success and satisfaction. Chen’s (1997) study showed a negative correlation between
transactional distance and students’ perceived learning; the present study showed no
statistically significant correlation between transactional distance and students’ marks. It is
assumed, perhaps, that students who experience a lesser transactional distance will
communicate more effectively with their instructors and fellow students and therefore learn
more and be more satisfied with their courses. So far these relationships and others between
theory variables and student success and satisfaction are not well supported by research.
The results of this and previous studies show that there are interesting relationships
between indicators of dialogue, course structure, transactional distance and student
autonomy. They also show that there is a great deal of work to be done before it could be said
that those relationships are well understood.
71
References
Anderson, D. (1999). Mathematics and distance education on the Internet: An
investigation based on transactional distance education theory (Michael G. Moore).
Dissertation Abstracts International A 60-5, p. 1488, Nov. 1999.
Arsham, H. (1994). Measuring Dependency of Two Variables from Categorized Data
[On-line]. Available: http://home.ubalt.edu/ntsbarsh/Business-stat/otherapplets/
Catego.htm.
Bischoff, W., Bisconer, S., Kooker, B., & Woods, L. (1996). Transactional distance and
interactive television in the distance education of health professionals. The American
Journal of Distance Education, 1 (3).
Brenner, R. J. (1996). An analysis of the transactional distance in asynchronous
telecourses at a community college using the group embedded figures test.
Dissertation Abstracts International, AAT 9726814.
Bunker, E., Gayol, Y., Nti, N., & Reidell, P. (1996). A study of transactional distance in
an international audioconferencing course. Technology and Teacher Educational
Annual, 1996. Association for the Advancement of Computing in Education.
Burge, E. (1994). Learning in computer conferenced contexts: The learners’ perspective.
Journal of Distance Education/Revue de l'enseignement à distance 9 (1). [Online].
Available: http://cade.icaap.org/vol9.1/burge.html
Chen, Y.J. (1997). The implications of Moore’s Theory of Transactional Distance in a
videoconferencing learning environment. Digital Dissertation Abstracts,
AAT9802605.
72
Chen, Y.J.& Willits, F.K.(1999). Dimensions of educational transactions in a
videoconferencing learning environment. American Journal of Distance Education,
13 (1).
Doane, D.P. (1988). Exploring Statistics with the IBM PC. Reading, MA: Addison-
Wesley.
Fabro, K. (1996). Computer Conferencing in Higher Education: An Exploration of
Communication and Cognitive Development Issues. Masters Thesis, University of
Calgary, Calgary, Canada.
Ferris, P. (1997) What is CMC? An overview of scholarly definitions. Computer-
Mediated Communication Magazine, 4 (1) (January 1997). [Online]. Available:
http://www.december.com/cmc/mag/1997/jan/toc.html.
Garrison, R. (2000). Theoretical challenges for distance education in the 21st century: A
shift from structural to transactional issues. International Review of Research in Open
and Distance Learning, 1 (1) (June 2000). [Online]. Available:
http://cde.athabascau.ca.
Garrison, R.& Baynton, M.(1989). Beyond independence in distance education: the
concept of control. In M.G. Moore & G.C. Clark (Eds.) Readings in Principles of
Distance Education. The Pennsylvania State University.
Hopper, D. (2000). Learner characteristics, life circumstances, and transactional distance
in a distance education setting. (Doctoral dissertation, Wayne State University, 2000).
Dissertation Abstracts International, A 61/10, p. 3962, Apr 2001.
73
Huang, H. M. (2002). Student perceptions in an online mediated environment.
International Journal of Instructional Media, 29 (4), 405-422.
Jung, I. (2001). Building a theoretical framework of web-based instruction in the context
of distance education. British Journal of Educational Technology, 32 (5).
Keegan, D.(Ed.) (1993). Theoretical Principles of Distance Education. New York:
Routledge.
McDonald, R. P. (1985). Factor Analysis and Related Methods. Hillsdale, NJ: Lawrence
Erlbaum Associates.
Moore, M. G. (1973). Toward a theory of independent learning and teaching. Journal of
Higher Education, 44 (12).
Moore, M. G. (1989). Three types of interaction. In M.G. Moore & G.C. Clark (Eds.)
Readings in Principles of Distance Education. The Pennsylvania State University.
Moore, M. G. (1990). Recent contributions to the theory of distance education. Open
Learning, 5 (3).
Moore, M. G. (1993). Theory of transactional distance. In D. Keegan (Ed.) Theoretical
Principles of Distance Education. New York: Routledge.
Moore, M. G.(1994). Autonomy and interdependence. American Journal of
Distance Education, 8 (2), 1-5.
Moore, M. G. & Kearsley, G. (1996). Distance Education: A Systems View.
Belmont, CA: Wadsworth.
Palloff, R. & Pratt, K. (1999). Building Learning Communities in Cyberspace: Effective
Strategies for the Online Classroom. San Francisco: Jossey-Bass.
74
Saba, F.& Shearer, R. (1994). Verifying key theoretical concepts in a dynamic model of
distance education. The American Journal of Distance Education, 8 (1).
Shulman, L. S. (1997). Disciplines of Inquiry in Education: An overview. In R. M.
Jaeger (Ed.) Complementary Methods for Research in Education (2nd ed.).
Washington, D.C.: American Educational Research Association.
Simon, J. L. & Burstein, P. (1985). Basic Research Methods in Social Science (3rd ed.).
New York: McGraw-Hill.
Wiersma, W. (1986). Research Methods in Education: An Introduction (4th ed.).
Newton, MA: Allyn and Bacon.
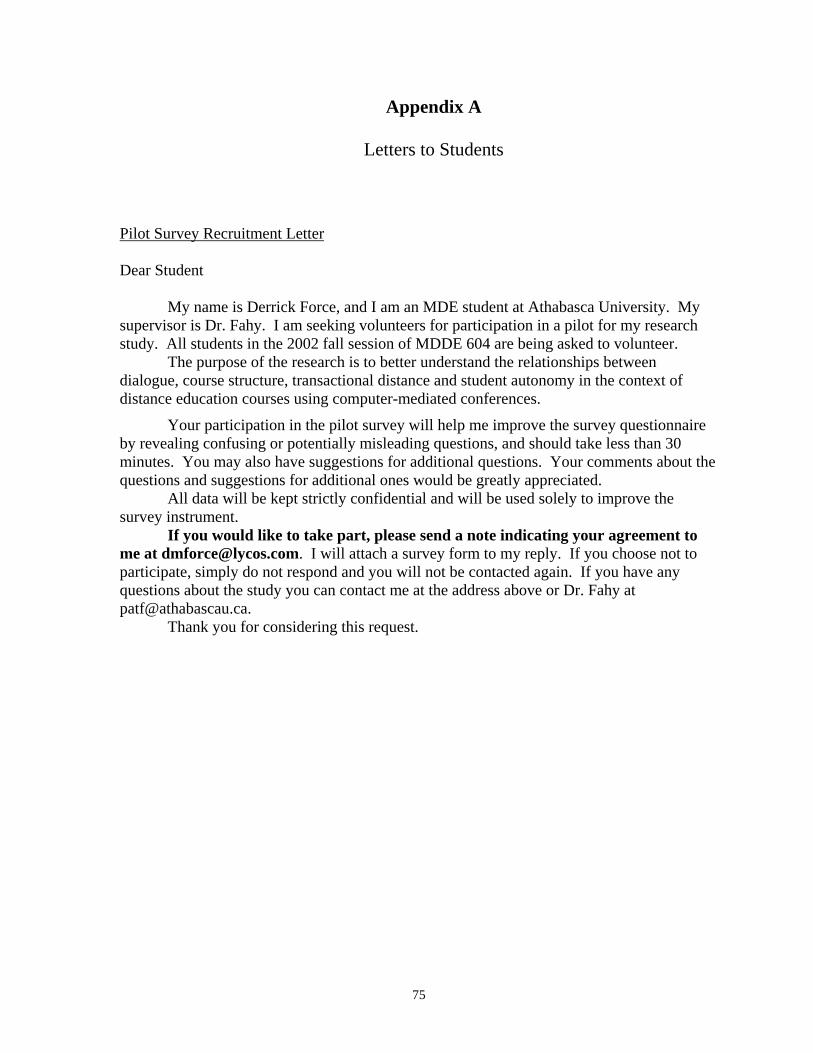
75
Appendix A
Letters to Students
Pilot Survey Recruitment Letter
Dear Student My name is Derrick Force, and I am an MDE student at Athabasca University. My supervisor is Dr. Fahy. I am seeking volunteers for participation in a pilot for my research study. All students in the 2002 fall session of MDDE 604 are being asked to volunteer. The purpose of the research is to better understand the relationships between dialogue, course structure, transactional distance and student autonomy in the context of distance education courses using computer-mediated conferences.
Your participation in the pilot survey will help me improve the survey questionnaire by revealing confusing or potentially misleading questions, and should take less than 30 minutes. You may also have suggestions for additional questions. Your comments about the questions and suggestions for additional ones would be greatly appreciated. All data will be kept strictly confidential and will be used solely to improve the survey instrument. If you would like to take part, please send a note indicating your agreement to me at [email protected]. I will attach a survey form to my reply. If you choose not to participate, simply do not respond and you will not be contacted again. If you have any questions about the study you can contact me at the address above or Dr. Fahy at [email protected]. Thank you for considering this request.
76
Survey Recruitment Letter
Dear Student My name is Derrick Force, and I am an MDE student at Athabasca University. My supervisor is Dr. Fahy. I am seeking volunteers for participation in my research study. All distance education students enrolled in 2002 fall term classes at Athabasca University are being asked to participate, except those who took part in the pilot study. The purpose of the research is to better understand the relationships between dialogue, course structure, transactional distance and student autonomy in the context of distance education courses using computer-mediated conferences. The validity of any conclusions drawn from data gathered in the study depends on the participation rate, so your participation would be greatly appreciated. It would involve completion of a questionnaire which would be e-mailed to you. Completion should take no more than 20 minutes.
All data will be kept strictly confidential. It will be reported in group form only; no attempt will be made to associate data with individuals, and no individuals will be identifiable in the resulting statistics. If you would like to take part, please send a note indicating your agreement to me at [email protected]. I will attach a survey form to my reply. If you choose not to participate simply do not send a message to me, and you will not be contacted again. If you have any questions about the study you can contact me at the address above or Dr. Fahy at [email protected]. Thank you for considering this request.
77
Pilot Survey Cover Letter
Dear Student, The purpose of this pilot survey is to improve a research instrument to be used in a study of computer-mediated conferences. This study is being conducted by Derrick Force, an MDDE student at Athabasca University, supervised by Dr. Fahy ([email protected]). The purpose of the study is to better understand how Moore’s theory of transactional distance relates to courses using computer-mediated conferences.
Please complete the survey and return it to [email protected], together with any suggestions you may have to improve the survey form. It is a Word 2000 document. I suggest you change Insert to Overstrike on your keyboard, then type the number of your choice on a line provided or type an “X” over the numbered choice you select. Save the completed form and then attach it to an e-mail to me. Respondents will have the opportunity to receive feedback regarding the study results. If you would like to receive this feedback, please indicate that in your return e-mail.
Thank you for your assistance with this study; your help at the developmental stage is greatly appreciated.
78
Survey Cover Letter
Dear Student, This study is being conducted by Derrick Force, an MDDE student at Athabasca University, supervised by Dr. Fahy ([email protected]). The purpose of the study is to better understand how Moore’s theory of transactional distance relates to courses using computer-mediated conferences. Although the theory is well-known in the field of distance education, there is little research directly related to it. All distance education students at Athabasca University, except those who took part in the pilot study, are being asked to participate. Since the validity of conclusions drawn from the study depends upon a high response rate, your participation is very important. The survey should take no longer than 20 minutes to complete. Your return of the completed survey indicates your consent to participate in the study. You may choose not to respond to individual questions if you wish. If you consent to having your final grade used as part of the data, indicate on the survey form that I am permitted to contact you at the end of the term. Those who agree will receive a grade request message, and may decline to provide their grade at that time. Please be assured that your privacy will be protected by holding your responses in the strictest confidence. Survey forms will be given coded labels upon receipt. All reported information will refer to group data only; no information will be associated with individuals and there will be no way to extract information about individuals from the study. To complete the form, I suggest you change INSERT to OVERSTRIKE on your keyboard and then type the number of your choice to fill in a blank or type an X over the numbered selection you choose. If you are enrolled in more than one class, please select one and base your answers on it. Respondents will have the opportunity to receive feedback regarding the study results. If you would like to receive this feedback, please indicate that in the e-mail you use to return the completed form. Please return the completed form to [email protected] as an attachment to an e-mail message. Thank you for your assistance with this study.
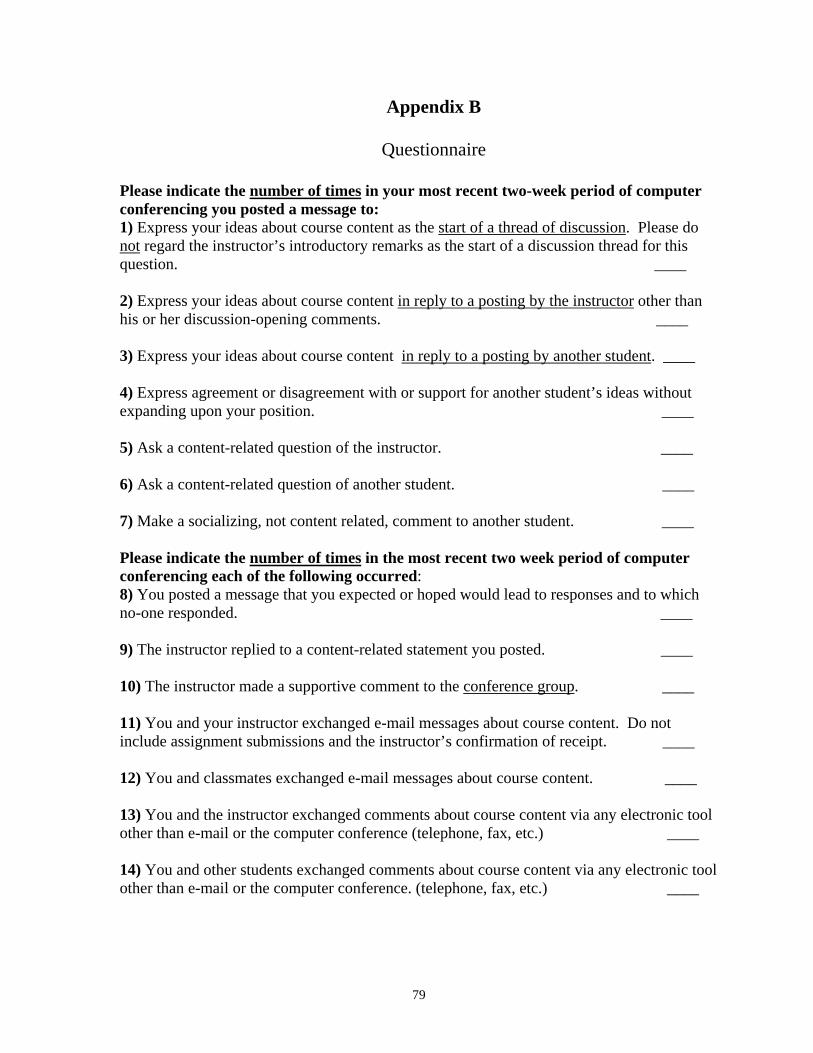
79
Appendix B
Questionnaire
Please indicate the number of times in your most recent two-week period of computer conferencing you posted a message to: 1) Express your ideas about course content as the start of a thread of discussion. Please do not regard the instructor’s introductory remarks as the start of a discussion thread for this question. ____ 2) Express your ideas about course content in reply to a posting by the instructor other than his or her discussion-opening comments. ____ 3) Express your ideas about course content in reply to a posting by another student. ____ 4) Express agreement or disagreement with or support for another student’s ideas without expanding upon your position. ____ 5) Ask a content-related question of the instructor. ____ 6) Ask a content-related question of another student. ____ 7) Make a socializing, not content related, comment to another student. ____ Please indicate the number of times in the most recent two week period of computer conferencing each of the following occurred: 8) You posted a message that you expected or hoped would lead to responses and to which no-one responded. ____ 9) The instructor replied to a content-related statement you posted. ____ 10) The instructor made a supportive comment to the conference group. ____ 11) You and your instructor exchanged e-mail messages about course content. Do not include assignment submissions and the instructor’s confirmation of receipt. ____ 12) You and classmates exchanged e-mail messages about course content. ____ 13) You and the instructor exchanged comments about course content via any electronic tool other than e-mail or the computer conference (telephone, fax, etc.) ____ 14) You and other students exchanged comments about course content via any electronic tool other than e-mail or the computer conference. (telephone, fax, etc.) ____
80
Please indicate the level to which each of these occurred: 15) You and your instructor were able to communicate ideas effectively to each other via the computer conference. 1 2 3 4 5 6 7 never always 16) You and other students were able to communicate ideas effectively to each other via the computer conference. 1 2 3 4 5 6 7 never always 17) You felt that the instructor was respectful of your ideas about the course subject matter. 1 2 3 4 5 6 7 never always 18) You felt other students were respectful of your ideas about the course subject matter. 1 2 3 4 5 6 7 never always Please rate your satisfaction with the computer conference technology: 19) As a tool for expressing your ideas to other people. 1 2 3 4 5 6 7 dissatisfied satisfied 20) As a tool for understanding the ideas of other people. 1 2 3 4 5 6 7 dissatisfied satisfied 21) As a tool for engaging in a line of discussion or extended conversation. 1 2 3 4 5 6 7 dissatisfied satisfied Please indicate the level of flexibility in this class in regard to the items in questions 22-31, using the following scale: 1 2 3 4 5 6 7 rigid flexible Flexibility is the degree to which these are adaptable to your individual learning needs. 22) Teaching methods. 1 2 3 4 5 6 7 23) Learning activities. 1 2 3 4 5 6 7 24) Pace of the course. 1 2 3 4 5 6 7 25) Conference participation. 1 2 3 4 5 6 7 26) Objectives of the course. 1 2 3 4 5 6 7 27) Choice of readings. 1 2 3 4 5 6 7 28) Choice of assignment content 1 2 3 4 5 6 7 29) Choice of assignments to complete 1 2 3 4 5 6 7 30) Deadline of assignments. 1 2 3 4 5 6 7
81
31) Grading. 1 2 3 4 5 6 7 The psychological / communication distance between communicating people can be a source of miscommunication or misunderstanding. 32) How would you rate the psychological / communication distance between yourself and your instructor?
1 2 3 4 5 6 7 distant close 33) How would you rate the psychological / communication distance between yourself and other students? 1 2 3 4 5 6 7 distant close Please indicate the extent to which each of the following statements is true of yourself as a learner in your class, using the following scale:
1 2 3 4 5 6 7 not at all true completely true 34) I am able to learn without lots of guidance 1 2 3 4 5 6 7 35) I appreciate teacher’s or classmates’ support or approval. 1 2 3 4 5 6 7 36) I like sharing efforts and responsibility with classmates. 1 2 3 4 5 6 7 37) I am a self-directed learner. 1 2 3 4 5 6 7 38) I enjoy learning as a member of a team. 1 2 3 4 5 6 7 39) I am able to develop a personal learning plan. 1 2 3 4 5 6 7 40) I prefer learning in a group. 1 2 3 4 5 6 7 41) I am able to find resources for study. 1 2 3 4 5 6 7 42) I recognize my need for collaborative learning. 1 2 3 4 5 6 7 43) I regard myself as an independent learner, someone who learns well working alone.
1 2 3 4 5 6 7 44) I regard myself as an interdependent learner, someone who learns well working with others. 1 2 3 4 5 6 7
Additional information
45) How would you rate your skill at using computer communications technology such as computer conferencing, chat programs and e-mail?
1 2 3 4 5 6 7 no skill highly skilled 46) How would you rate your knowledge of this course’s subject matter before taking the course? 1 2 3 4 5 6 7 no knowledge thorough knowledge
82
47) How would you rate your accessibility to computer communications software, including software for access to the Internet? 1 2 3 4 5 6 7 poor excellent 48) Please indicate the number of Athabasca University distance education courses you have taken previously that use computer conferencing as a communication method. ____ Please mark the numbers that indicate which of the following characteristics apply to you. 49) Gender
1. Female 2 . Male
50) Student status 1. Non-program and non-diploma 2. Diploma 3. Program
51) Age 1. under 20 2. 21-30 3. 31-40 4. 41-50 5. 51-60 6. 61-70 7. over70
Do you agree to having me approach you at the end of the course to request that your grade be included as part of the study data? Yes __ No__
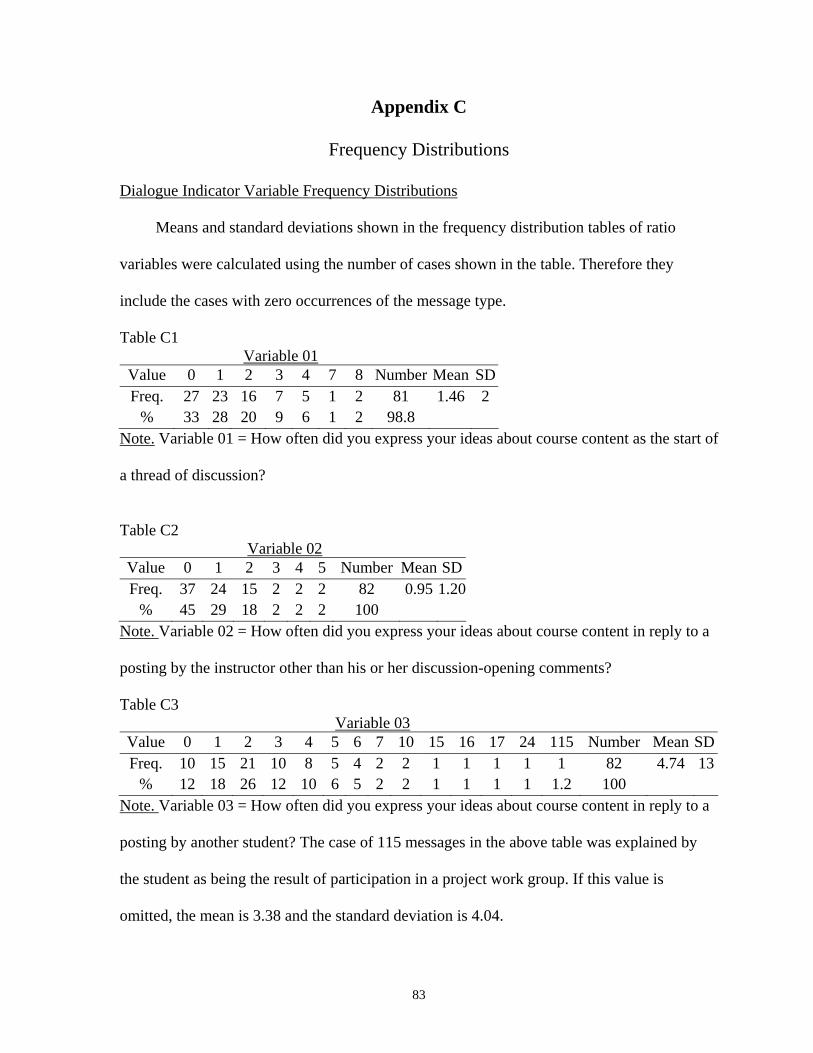
83
Appendix C
Frequency Distributions
Dialogue Indicator Variable Frequency Distributions
Means and standard deviations shown in the frequency distribution tables of ratio
variables were calculated using the number of cases shown in the table. Therefore they
include the cases with zero occurrences of the message type.
Table C1 Variable 01
Value 0 1 2 3 4 7 8 Number Mean SDFreq. 27 23 16 7 5 1 2 81 1.46 2
% 33 28 20 9 6 1 2 98.8 Note. Variable 01 = How often did you express your ideas about course content as the start of
a thread of discussion?
Table C2 Variable 02 Value 0 1 2 3 4 5 Number Mean SDFreq. 37 24 15 2 2 2 82 0.95 1.20
% 45 29 18 2 2 2 100 Note. Variable 02 = How often did you express your ideas about course content in reply to a
posting by the instructor other than his or her discussion-opening comments?
Table C3 Variable 03 Value 0 1 2 3 4 5 6 7 10 15 16 17 24 115 Number Mean SDFreq. 10 15 21 10 8 5 4 2 2 1 1 1 1 1 82 4.74 13
% 12 18 26 12 10 6 5 2 2 1 1 1 1 1.2 100 Note. Variable 03 = How often did you express your ideas about course content in reply to a
posting by another student? The case of 115 messages in the above table was explained by
the student as being the result of participation in a project work group. If this value is
omitted, the mean is 3.38 and the standard deviation is 4.04.
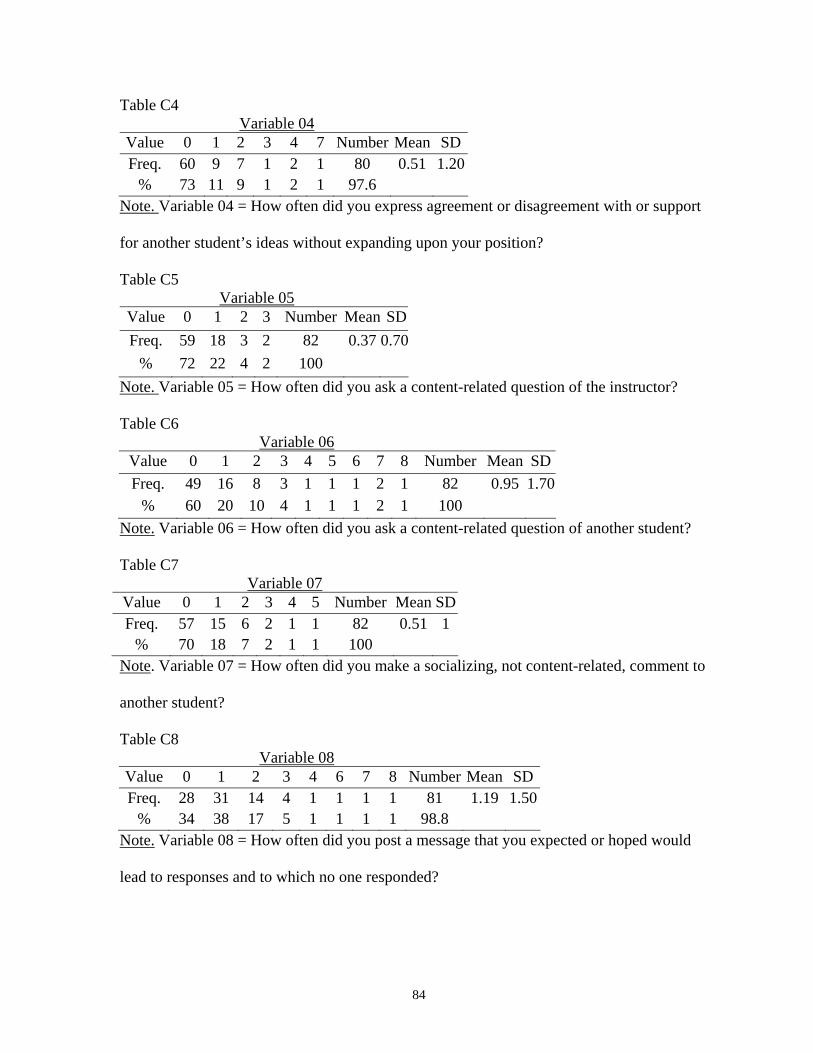
84
Table C4 Variable 04 Value 0 1 2 3 4 7 Number Mean SDFreq. 60 9 7 1 2 1 80 0.51 1.20
% 73 11 9 1 2 1 97.6 Note. Variable 04 = How often did you express agreement or disagreement with or support
for another student’s ideas without expanding upon your position?
Table C5 Variable 05 Value 0 1 2 3 Number Mean SD Freq. 59 18 3 2 82 0.37 0.70
% 72 22 4 2 100 Note. Variable 05 = How often did you ask a content-related question of the instructor?
Table C6 Variable 06
Value 0 1 2 3 4 5 6 7 8 Number Mean SDFreq. 49 16 8 3 1 1 1 2 1 82 0.95 1.70
% 60 20 10 4 1 1 1 2 1 100 Note. Variable 06 = How often did you ask a content-related question of another student?
Table C7 Variable 07 Value 0 1 2 3 4 5 Number Mean SDFreq. 57 15 6 2 1 1 82 0.51 1
% 70 18 7 2 1 1 100 Note. Variable 07 = How often did you make a socializing, not content-related, comment to
another student?
Table C8 Variable 08 Value 0 1 2 3 4 6 7 8 Number Mean SDFreq. 28 31 14 4 1 1 1 1 81 1.19 1.50
% 34 38 17 5 1 1 1 1 98.8 Note. Variable 08 = How often did you post a message that you expected or hoped would
lead to responses and to which no one responded?
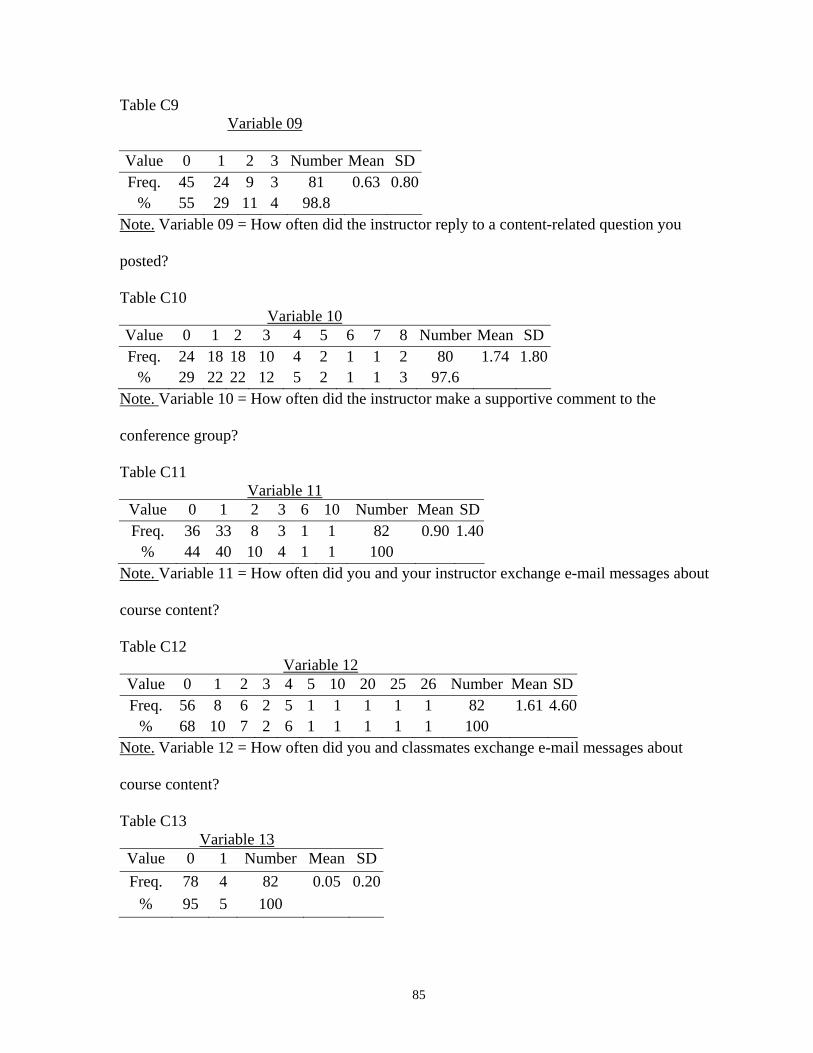
85
Table C9 Variable 09
Value 0 1 2 3 Number Mean SDFreq. 45 24 9 3 81 0.63 0.80
% 55 29 11 4 98.8 Note. Variable 09 = How often did the instructor reply to a content-related question you
posted?
Table C10 Variable 10 Value 0 1 2 3 4 5 6 7 8 Number Mean SDFreq. 24 18 18 10 4 2 1 1 2 80 1.74 1.80
% 29 22 22 12 5 2 1 1 3 97.6 Note. Variable 10 = How often did the instructor make a supportive comment to the
conference group?
Table C11 Variable 11
Value 0 1 2 3 6 10 Number Mean SDFreq. 36 33 8 3 1 1 82 0.90 1.40
% 44 40 10 4 1 1 100 Note. Variable 11 = How often did you and your instructor exchange e-mail messages about
course content?
Table C12 Variable 12 Value 0 1 2 3 4 5 10 20 25 26 Number Mean SD Freq. 56 8 6 2 5 1 1 1 1 1 82 1.61 4.60
% 68 10 7 2 6 1 1 1 1 1 100 Note. Variable 12 = How often did you and classmates exchange e-mail messages about
course content?
Table C13 Variable 13 Value 0 1 Number Mean SDFreq. 78 4 82 0.05 0.20
% 95 5 100
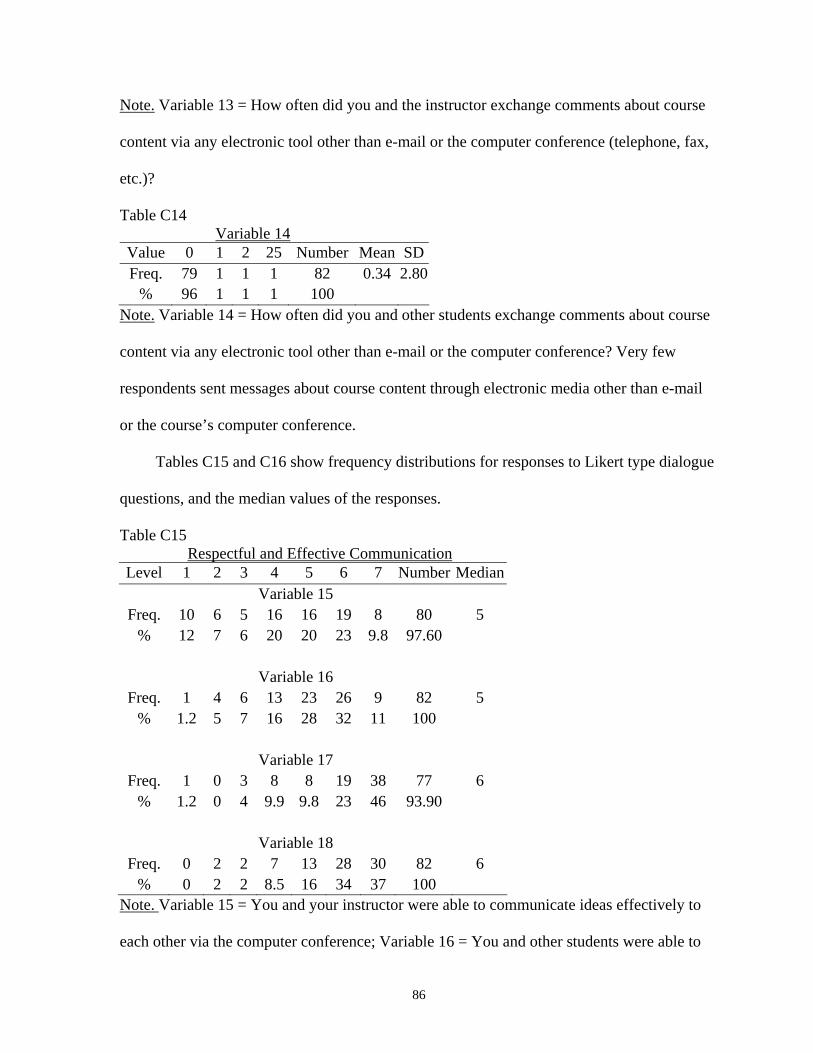
86
Note. Variable 13 = How often did you and the instructor exchange comments about course
content via any electronic tool other than e-mail or the computer conference (telephone, fax,
etc.)?
Table C14 Variable 14 Value 0 1 2 25 Number Mean SDFreq. 79 1 1 1 82 0.34 2.80
% 96 1 1 1 100 Note. Variable 14 = How often did you and other students exchange comments about course
content via any electronic tool other than e-mail or the computer conference? Very few
respondents sent messages about course content through electronic media other than e-mail
or the course’s computer conference.
Tables C15 and C16 show frequency distributions for responses to Likert type dialogue
questions, and the median values of the responses.
Table C15 Respectful and Effective Communication Level 1 2 3 4 5 6 7 Number Median
Variable 15 Freq. 10 6 5 16 16 19 8 80 5
% 12 7 6 20 20 23 9.8 97.60 Variable 16
Freq. 1 4 6 13 23 26 9 82 5 % 1.2 5 7 16 28 32 11 100 Variable 17
Freq. 1 0 3 8 8 19 38 77 6 % 1.2 0 4 9.9 9.8 23 46 93.90 Variable 18
Freq. 0 2 2 7 13 28 30 82 6 % 0 2 2 8.5 16 34 37 100
Note. Variable 15 = You and your instructor were able to communicate ideas effectively to
each other via the computer conference; Variable 16 = You and other students were able to
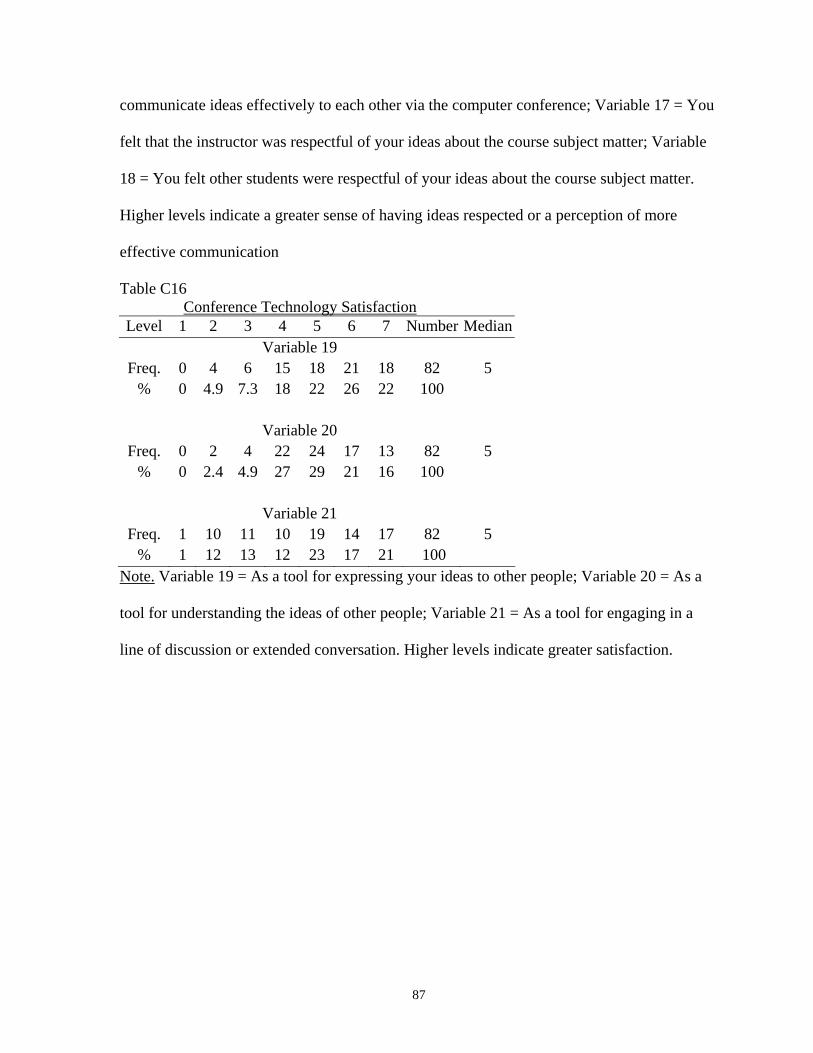
87
communicate ideas effectively to each other via the computer conference; Variable 17 = You
felt that the instructor was respectful of your ideas about the course subject matter; Variable
18 = You felt other students were respectful of your ideas about the course subject matter.
Higher levels indicate a greater sense of having ideas respected or a perception of more
effective communication
Table C16 Conference Technology Satisfaction Level 1 2 3 4 5 6 7 Number Median
Variable 19 Freq. 0 4 6 15 18 21 18 82 5
% 0 4.9 7.3 18 22 26 22 100 Variable 20
Freq. 0 2 4 22 24 17 13 82 5 % 0 2.4 4.9 27 29 21 16 100 Variable 21
Freq. 1 10 11 10 19 14 17 82 5 % 1 12 13 12 23 17 21 100
Note. Variable 19 = As a tool for expressing your ideas to other people; Variable 20 = As a
tool for understanding the ideas of other people; Variable 21 = As a tool for engaging in a
line of discussion or extended conversation. Higher levels indicate greater satisfaction.
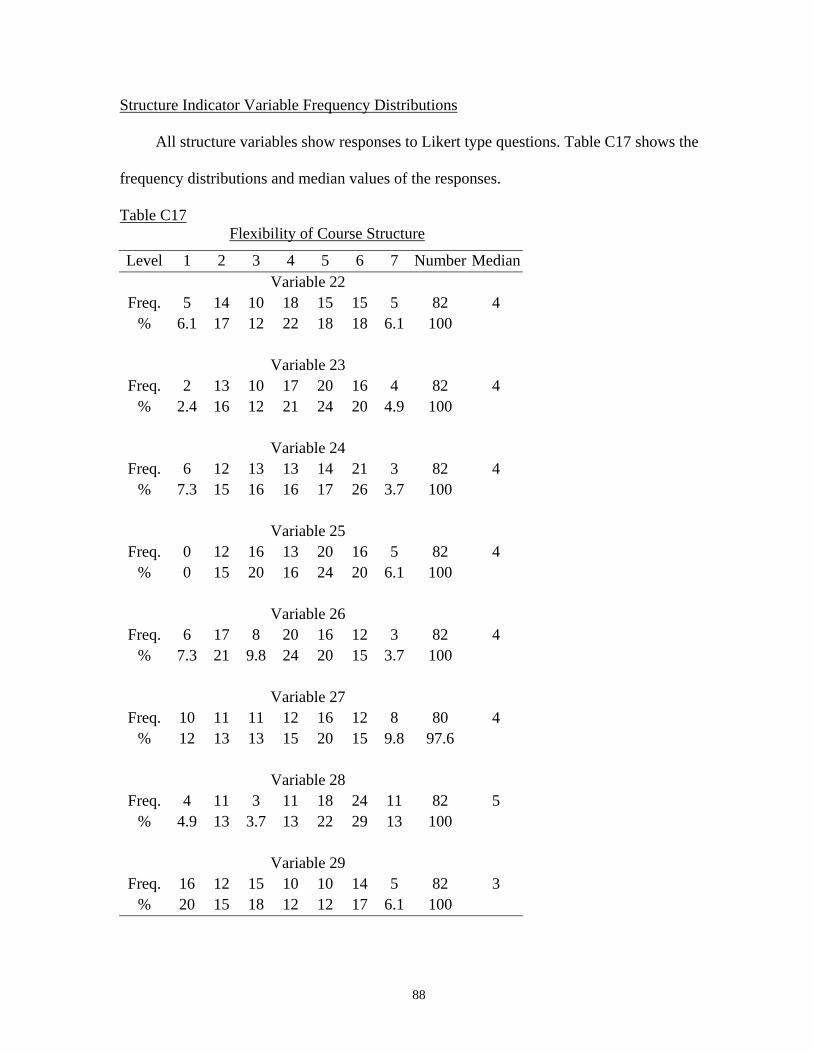
88
Structure Indicator Variable Frequency Distributions
All structure variables show responses to Likert type questions. Table C17 shows the
frequency distributions and median values of the responses.
Table C17 Flexibility of Course Structure
Level 1 2 3 4 5 6 7 Number Median Variable 22
Freq. 5 14 10 18 15 15 5 82 4 % 6.1 17 12 22 18 18 6.1 100 Variable 23
Freq. 2 13 10 17 20 16 4 82 4 % 2.4 16 12 21 24 20 4.9 100 Variable 24
Freq. 6 12 13 13 14 21 3 82 4 % 7.3 15 16 16 17 26 3.7 100 Variable 25
Freq. 0 12 16 13 20 16 5 82 4 % 0 15 20 16 24 20 6.1 100 Variable 26
Freq. 6 17 8 20 16 12 3 82 4 % 7.3 21 9.8 24 20 15 3.7 100 Variable 27
Freq. 10 11 11 12 16 12 8 80 4 % 12 13 13 15 20 15 9.8 97.6 Variable 28
Freq. 4 11 3 11 18 24 11 82 5 % 4.9 13 3.7 13 22 29 13 100 Variable 29
Freq. 16 12 15 10 10 14 5 82 3 % 20 15 18 12 12 17 6.1 100
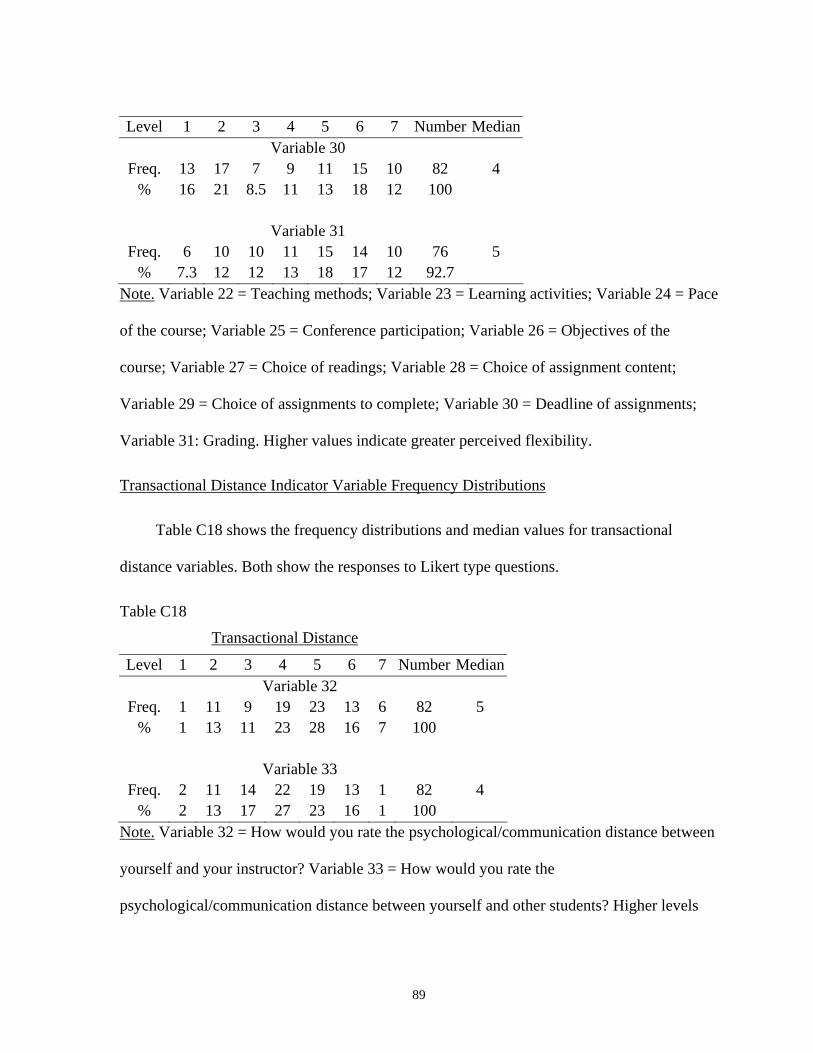
89
Level 1 2 3 4 5 6 7 Number Median
Variable 30 Freq. 13 17 7 9 11 15 10 82 4
% 16 21 8.5 11 13 18 12 100 Variable 31
Freq. 6 10 10 11 15 14 10 76 5 % 7.3 12 12 13 18 17 12 92.7
Note. Variable 22 = Teaching methods; Variable 23 = Learning activities; Variable 24 = Pace
of the course; Variable 25 = Conference participation; Variable 26 = Objectives of the
course; Variable 27 = Choice of readings; Variable 28 = Choice of assignment content;
Variable 29 = Choice of assignments to complete; Variable 30 = Deadline of assignments;
Variable 31: Grading. Higher values indicate greater perceived flexibility.
Transactional Distance Indicator Variable Frequency Distributions
Table C18 shows the frequency distributions and median values for transactional
distance variables. Both show the responses to Likert type questions.
Table C18
Transactional Distance
Level 1 2 3 4 5 6 7 Number Median Variable 32
Freq. 1 11 9 19 23 13 6 82 5 % 1 13 11 23 28 16 7 100 Variable 33
Freq. 2 11 14 22 19 13 1 82 4 % 2 13 17 27 23 16 1 100
Note. Variable 32 = How would you rate the psychological/communication distance between
yourself and your instructor? Variable 33 = How would you rate the
psychological/communication distance between yourself and other students? Higher levels
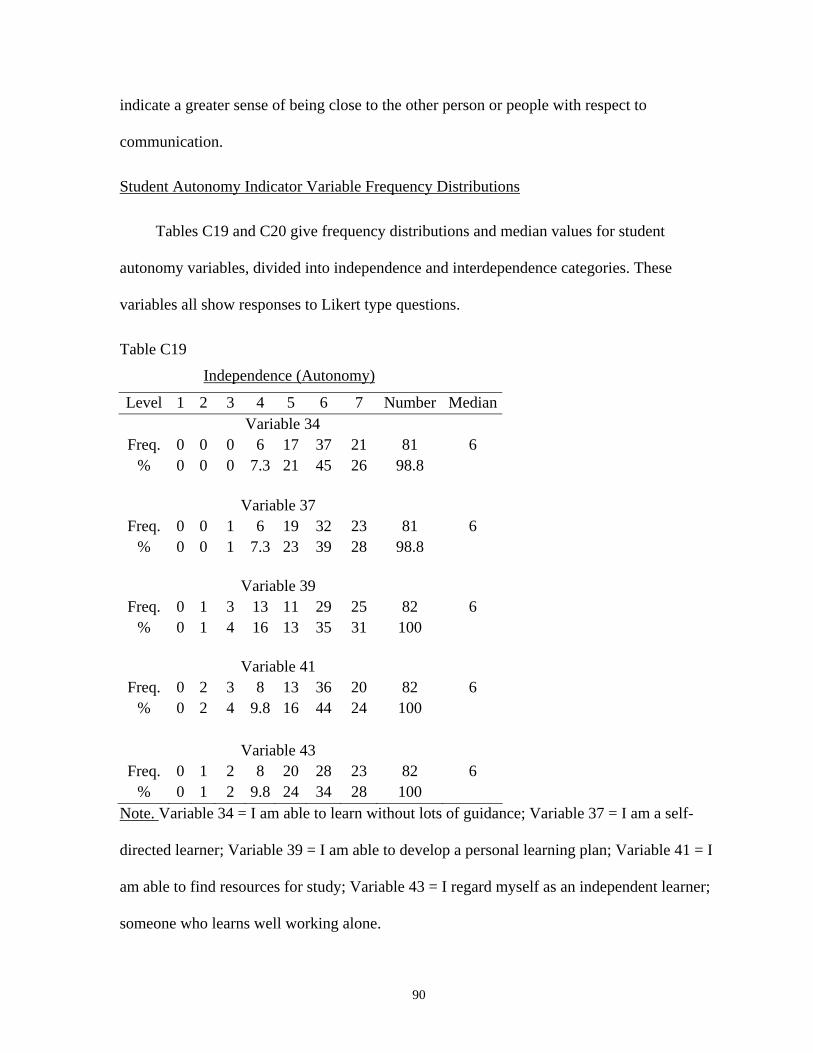
90
indicate a greater sense of being close to the other person or people with respect to
communication.
Student Autonomy Indicator Variable Frequency Distributions
Tables C19 and C20 give frequency distributions and median values for student
autonomy variables, divided into independence and interdependence categories. These
variables all show responses to Likert type questions.
Table C19
Independence (Autonomy)
Level 1 2 3 4 5 6 7 Number Median Variable 34
Freq. 0 0 0 6 17 37 21 81 6 % 0 0 0 7.3 21 45 26 98.8 Variable 37
Freq. 0 0 1 6 19 32 23 81 6 % 0 0 1 7.3 23 39 28 98.8 Variable 39
Freq. 0 1 3 13 11 29 25 82 6 % 0 1 4 16 13 35 31 100 Variable 41
Freq. 0 2 3 8 13 36 20 82 6 % 0 2 4 9.8 16 44 24 100 Variable 43
Freq. 0 1 2 8 20 28 23 82 6 % 0 1 2 9.8 24 34 28 100
Note. Variable 34 = I am able to learn without lots of guidance; Variable 37 = I am a self-
directed learner; Variable 39 = I am able to develop a personal learning plan; Variable 41 = I
am able to find resources for study; Variable 43 = I regard myself as an independent learner;
someone who learns well working alone.
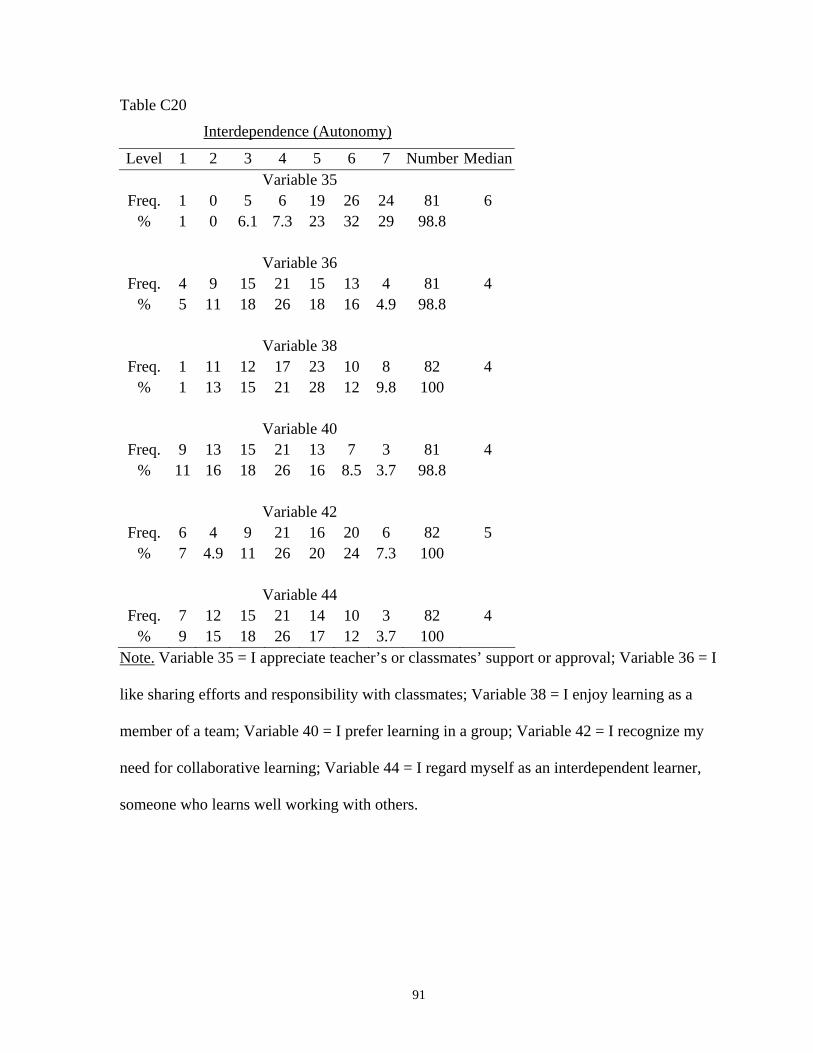
91
Table C20
Interdependence (Autonomy)
Level 1 2 3 4 5 6 7 Number Median Variable 35
Freq. 1 0 5 6 19 26 24 81 6 % 1 0 6.1 7.3 23 32 29 98.8 Variable 36
Freq. 4 9 15 21 15 13 4 81 4 % 5 11 18 26 18 16 4.9 98.8 Variable 38
Freq. 1 11 12 17 23 10 8 82 4 % 1 13 15 21 28 12 9.8 100 Variable 40
Freq. 9 13 15 21 13 7 3 81 4 % 11 16 18 26 16 8.5 3.7 98.8 Variable 42
Freq. 6 4 9 21 16 20 6 82 5 % 7 4.9 11 26 20 24 7.3 100 Variable 44
Freq. 7 12 15 21 14 10 3 82 4 % 9 15 18 26 17 12 3.7 100
Note. Variable 35 = I appreciate teacher’s or classmates’ support or approval; Variable 36 = I
like sharing efforts and responsibility with classmates; Variable 38 = I enjoy learning as a
member of a team; Variable 40 = I prefer learning in a group; Variable 42 = I recognize my
need for collaborative learning; Variable 44 = I regard myself as an interdependent learner,
someone who learns well working with others.
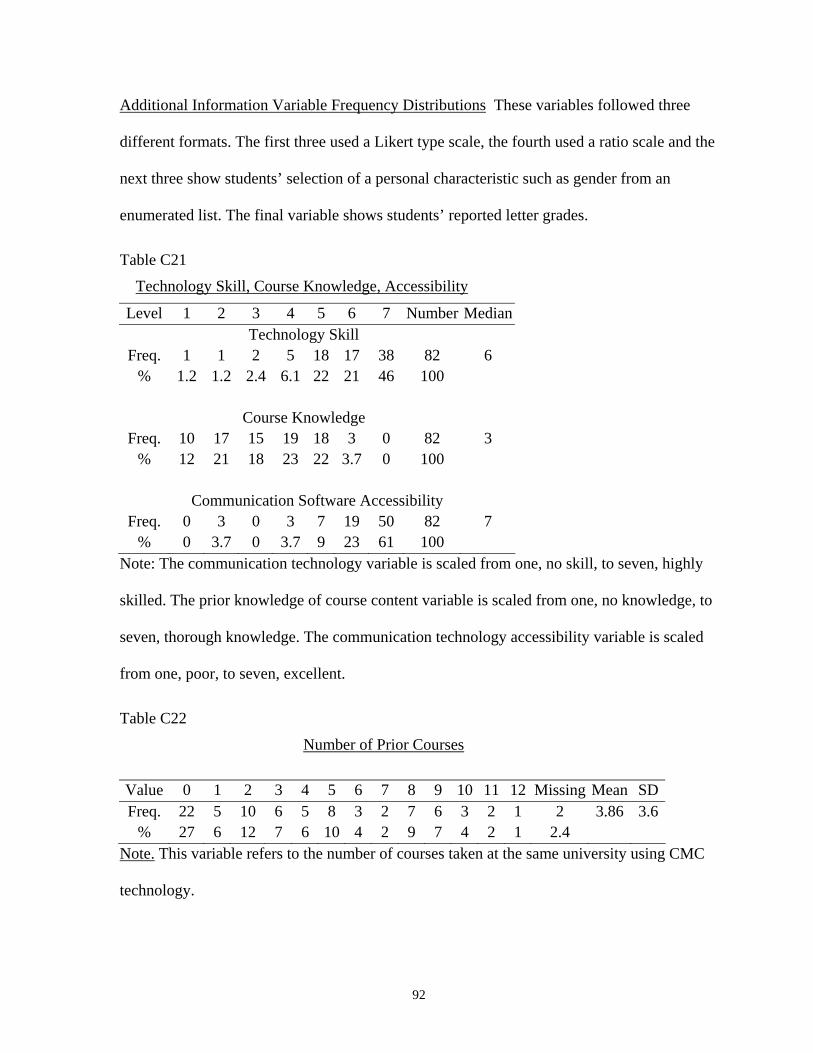
92
Additional Information Variable Frequency Distributions These variables followed three
different formats. The first three used a Likert type scale, the fourth used a ratio scale and the
next three show students’ selection of a personal characteristic such as gender from an
enumerated list. The final variable shows students’ reported letter grades.
Table C21
Technology Skill, Course Knowledge, Accessibility
Level 1 2 3 4 5 6 7 Number Median Technology Skill
Freq. 1 1 2 5 18 17 38 82 6 % 1.2 1.2 2.4 6.1 22 21 46 100 Course Knowledge
Freq. 10 17 15 19 18 3 0 82 3 % 12 21 18 23 22 3.7 0 100
Communication Software Accessibility Freq. 0 3 0 3 7 19 50 82 7
% 0 3.7 0 3.7 9 23 61 100 Note: The communication technology variable is scaled from one, no skill, to seven, highly
skilled. The prior knowledge of course content variable is scaled from one, no knowledge, to
seven, thorough knowledge. The communication technology accessibility variable is scaled
from one, poor, to seven, excellent.
Table C22
Number of Prior Courses
Value 0 1 2 3 4 5 6 7 8 9 10 11 12 Missing Mean SDFreq. 22 5 10 6 5 8 3 2 7 6 3 2 1 2 3.86 3.6
% 27 6 12 7 6 10 4 2 9 7 4 2 1 2.4 Note. This variable refers to the number of courses taken at the same university using CMC
technology.
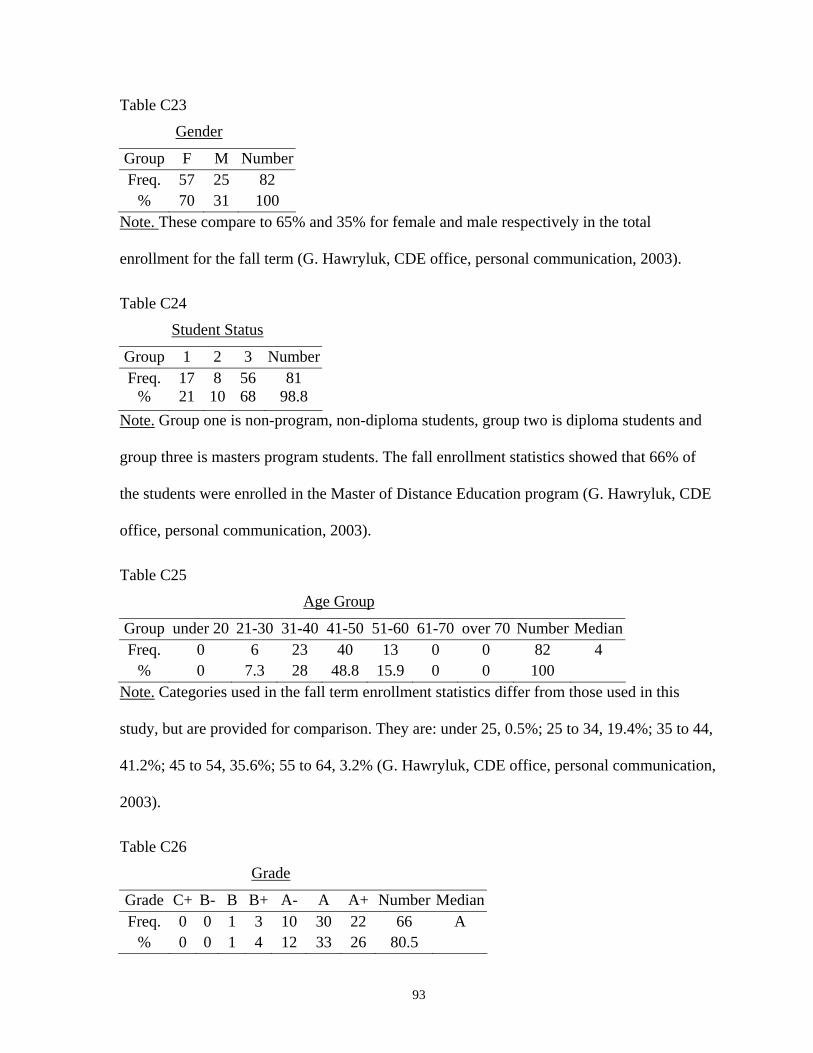
93
Table C23
Gender
Group F M Number Freq. 57 25 82
% 70 31 100 Note. These compare to 65% and 35% for female and male respectively in the total
enrollment for the fall term (G. Hawryluk, CDE office, personal communication, 2003).
Table C24
Student Status
Group 1 2 3 Number Freq.
% 17 21
8 10
56 68
81 98.8
Note. Group one is non-program, non-diploma students, group two is diploma students and
group three is masters program students. The fall enrollment statistics showed that 66% of
the students were enrolled in the Master of Distance Education program (G. Hawryluk, CDE
office, personal communication, 2003).
Table C25
Age Group
Group under 20 21-30 31-40 41-50 51-60 61-70 over 70 Number Median Freq. 0 6 23 40 13 0 0 82 4
% 0 7.3 28 48.8 15.9 0 0 100 Note. Categories used in the fall term enrollment statistics differ from those used in this
study, but are provided for comparison. They are: under 25, 0.5%; 25 to 34, 19.4%; 35 to 44,
41.2%; 45 to 54, 35.6%; 55 to 64, 3.2% (G. Hawryluk, CDE office, personal communication,
2003).
Table C26
Grade
Grade C+ B- B B+ A- A A+ Number MedianFreq. 0 0 1 3 10 30 22 66 A
% 0 0 1 4 12 33 26 80.5

94
Note. The university’s grading scale is: A+ 90-100%, A 85-89%, A- 80-84%, B+ 77-79%,
B 74-76%, B- 70-73%, C+ 67-69%, C 64-66%, C- 60-63%, F 0-59%.
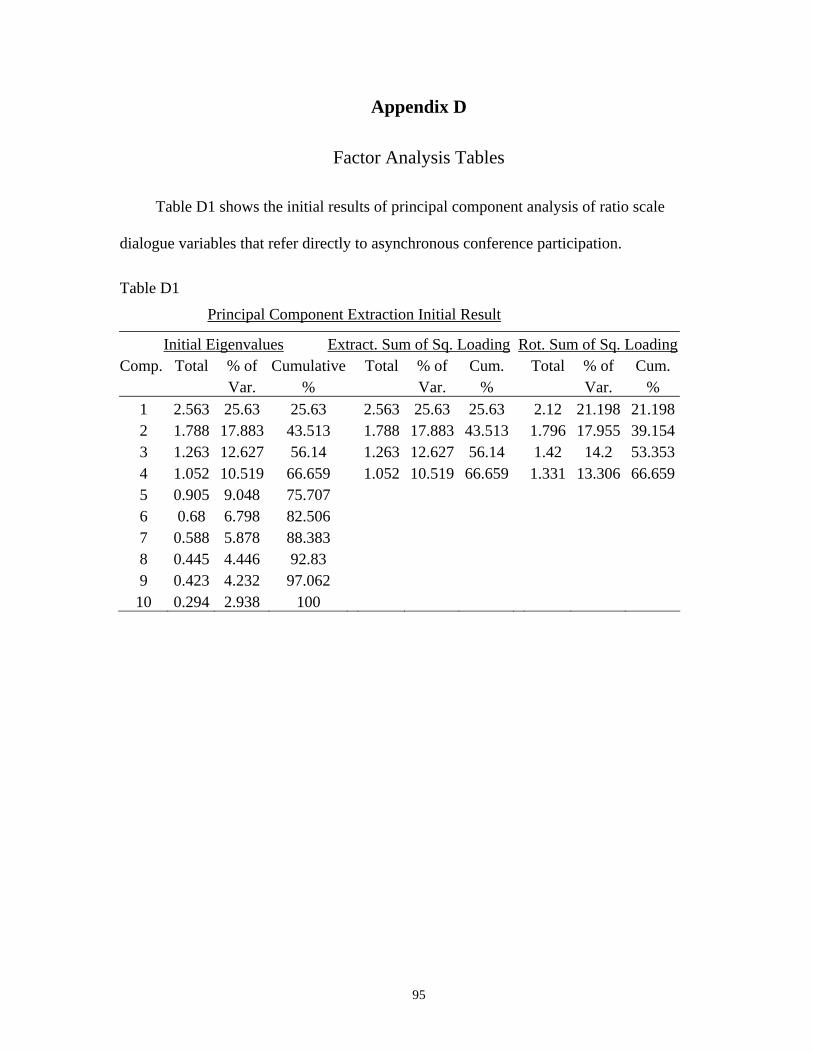
95
Appendix D
Factor Analysis Tables
Table D1 shows the initial results of principal component analysis of ratio scale
dialogue variables that refer directly to asynchronous conference participation.
Table D1
Principal Component Extraction Initial Result
Initial Eigenvalues Extract. Sum of Sq. Loading Rot. Sum of Sq. LoadingComp. Total % of Cumulative Total % of Cum. Total % of Cum.
Var. % Var. % Var. % 1 2.563 25.63 25.63 2.563 25.63 25.63 2.12 21.198 21.1982 1.788 17.883 43.513 1.788 17.883 43.513 1.796 17.955 39.1543 1.263 12.627 56.14 1.263 12.627 56.14 1.42 14.2 53.3534 1.052 10.519 66.659 1.052 10.519 66.659 1.331 13.306 66.6595 0.905 9.048 75.707 6 0.68 6.798 82.506 7 0.588 5.878 88.383 8 0.445 4.446 92.83 9 0.423 4.232 97.062 10 0.294 2.938 100
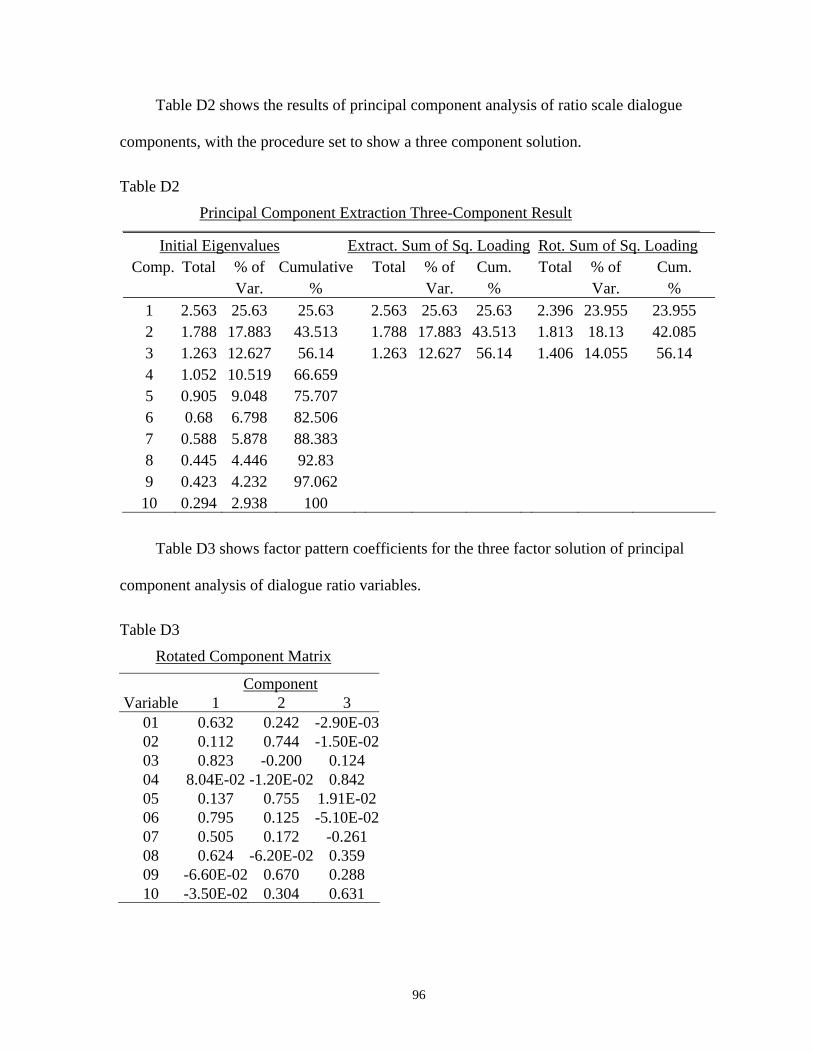
96
Table D2 shows the results of principal component analysis of ratio scale dialogue
components, with the procedure set to show a three component solution.
Table D2
Principal Component Extraction Three-Component Result
Initial Eigenvalues Extract. Sum of Sq. Loading Rot. Sum of Sq. Loading Comp. Total % of Cumulative Total % of Cum. Total % of Cum.
Var. % Var. % Var. % 1 2.563 25.63 25.63 2.563 25.63 25.63 2.396 23.955 23.955 2 1.788 17.883 43.513 1.788 17.883 43.513 1.813 18.13 42.085 3 1.263 12.627 56.14 1.263 12.627 56.14 1.406 14.055 56.14 4 1.052 10.519 66.659 5 0.905 9.048 75.707 6 0.68 6.798 82.506 7 0.588 5.878 88.383 8 0.445 4.446 92.83 9 0.423 4.232 97.062 10 0.294 2.938 100
Table D3 shows factor pattern coefficients for the three factor solution of principal
component analysis of dialogue ratio variables.
Table D3
Rotated Component Matrix
Component Variable 1 2 3
01 0.632 0.242 -2.90E-0302 0.112 0.744 -1.50E-0203 0.823 -0.200 0.124 04 8.04E-02 -1.20E-02 0.842 05 0.137 0.755 1.91E-0206 0.795 0.125 -5.10E-0207 0.505 0.172 -0.261 08 0.624 -6.20E-02 0.359 09 -6.60E-02 0.670 0.288 10 -3.50E-02 0.304 0.631
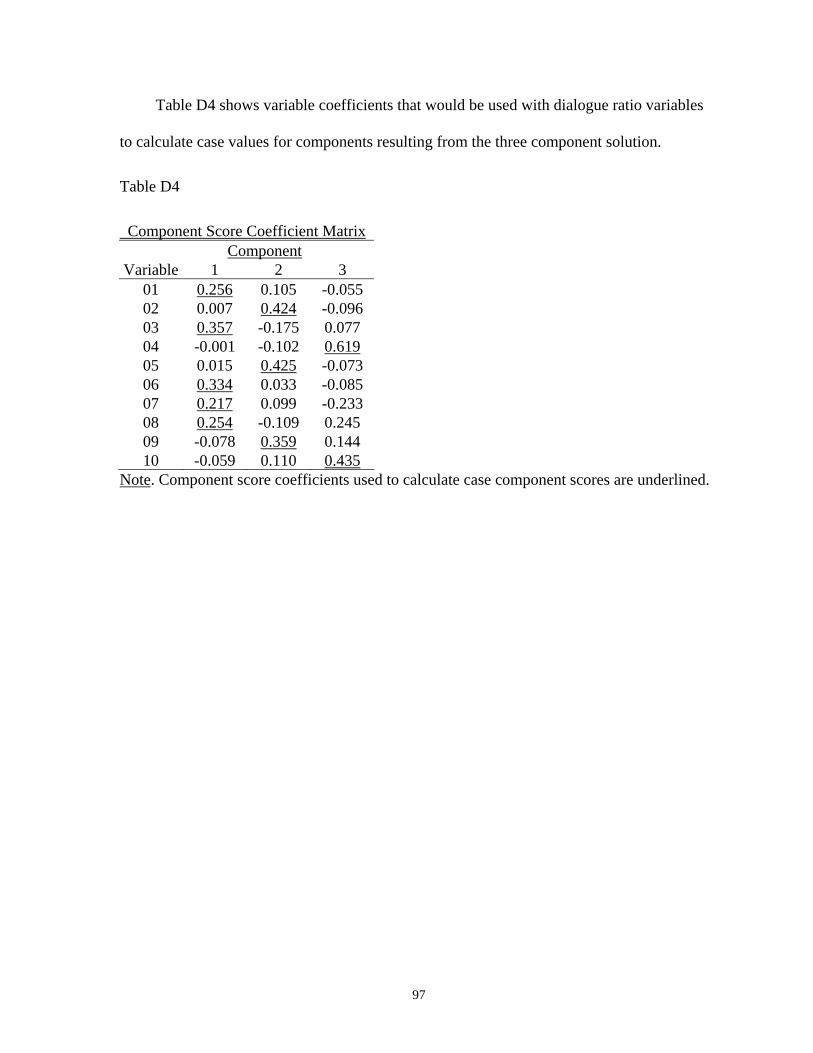
97
Table D4 shows variable coefficients that would be used with dialogue ratio variables
to calculate case values for components resulting from the three component solution.
Table D4
Component Score Coefficient Matrix Component Variable 1 2 3
01 0.256 0.105 -0.055 02 0.007 0.424 -0.096 03 0.357 -0.175 0.077 04 -0.001 -0.102 0.619 05 0.015 0.425 -0.073 06 0.334 0.033 -0.085 07 0.217 0.099 -0.233 08 0.254 -0.109 0.245 09 -0.078 0.359 0.144 10 -0.059 0.110 0.435
Note. Component score coefficients used to calculate case component scores are underlined.
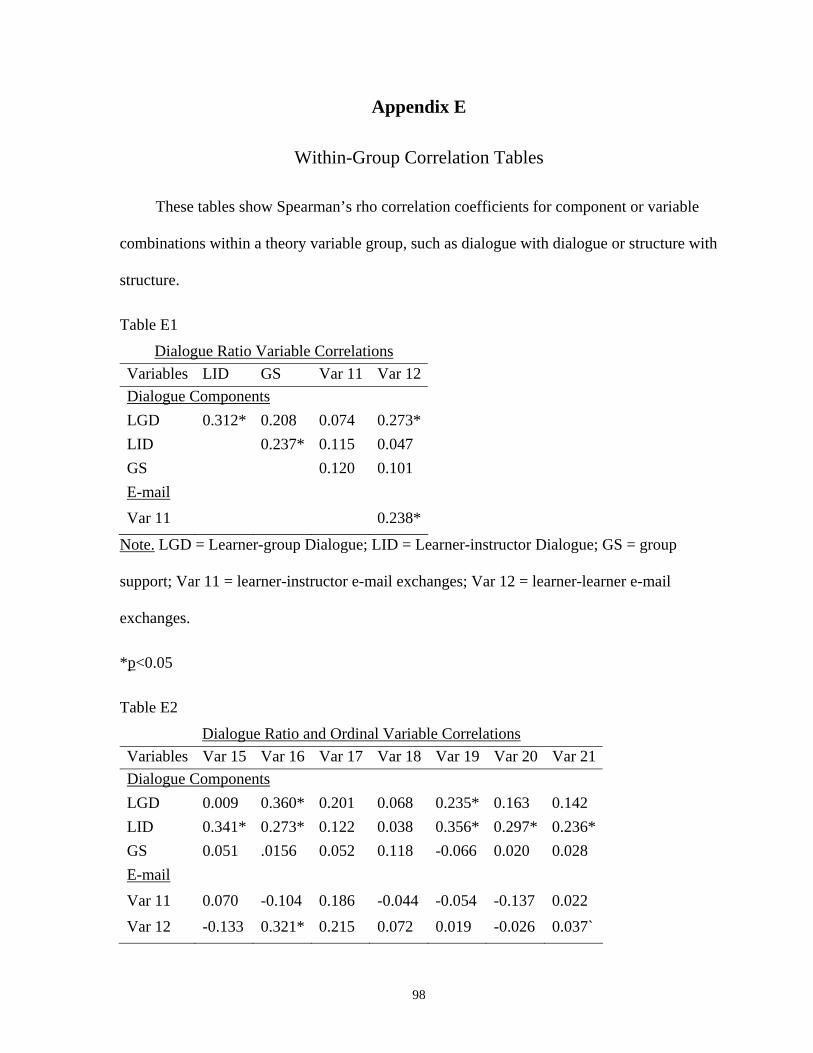
98
Appendix E
Within-Group Correlation Tables
These tables show Spearman’s rho correlation coefficients for component or variable
combinations within a theory variable group, such as dialogue with dialogue or structure with
structure.
Table E1
Dialogue Ratio Variable Correlations Variables LID GS Var 11 Var 12Dialogue Components LGD 0.312* 0.208 0.074 0.273*LID 0.237* 0.115 0.047 GS 0.120 0.101 E-mail Var 11 0.238*
Note. LGD = Learner-group Dialogue; LID = Learner-instructor Dialogue; GS = group
support; Var 11 = learner-instructor e-mail exchanges; Var 12 = learner-learner e-mail
exchanges.
*p<0.05
Table E2
Dialogue Ratio and Ordinal Variable Correlations Variables Var 15 Var 16 Var 17 Var 18 Var 19 Var 20 Var 21 Dialogue Components LGD 0.009 0.360* 0.201 0.068 0.235* 0.163 0.142 LID 0.341* 0.273* 0.122 0.038 0.356* 0.297* 0.236* GS 0.051 .0156 0.052 0.118 -0.066 0.020 0.028 E-mail Var 11 0.070 -0.104 0.186 -0.044 -0.054 -0.137 0.022 Var 12 -0.133 0.321* 0.215 0.072 0.019 -0.026 0.037`
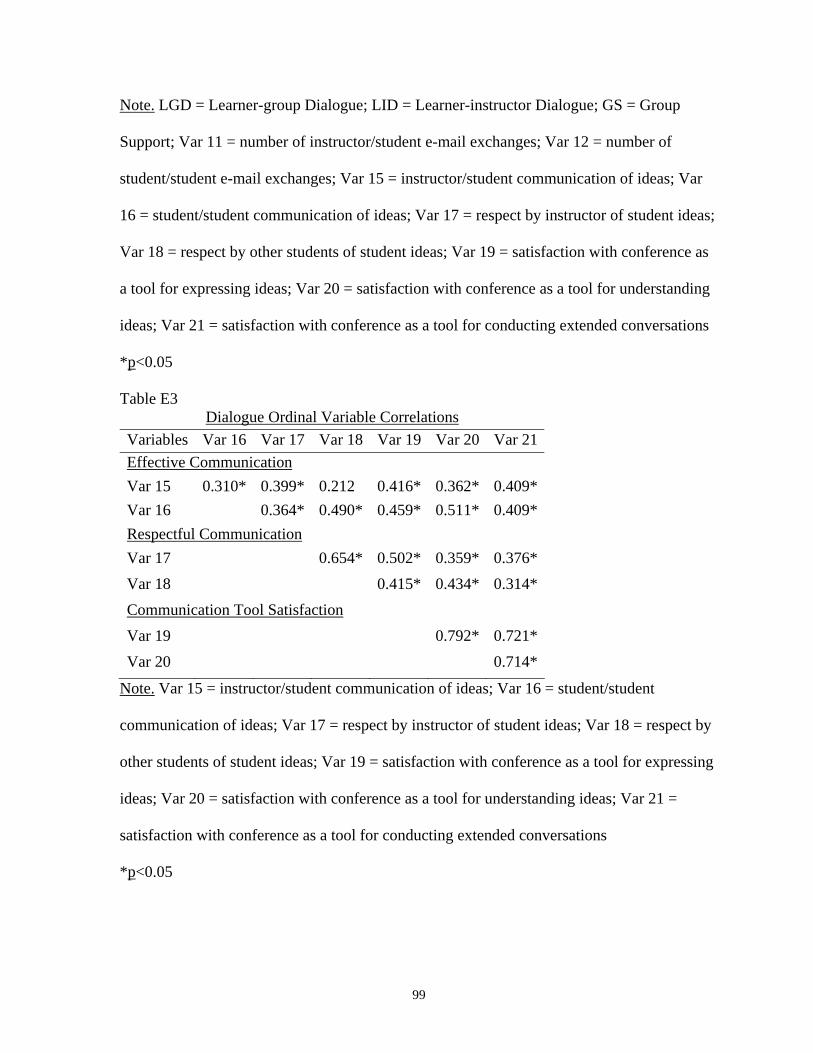
99
Note. LGD = Learner-group Dialogue; LID = Learner-instructor Dialogue; GS = Group
Support; Var 11 = number of instructor/student e-mail exchanges; Var 12 = number of
student/student e-mail exchanges; Var 15 = instructor/student communication of ideas; Var
16 = student/student communication of ideas; Var 17 = respect by instructor of student ideas;
Var 18 = respect by other students of student ideas; Var 19 = satisfaction with conference as
a tool for expressing ideas; Var 20 = satisfaction with conference as a tool for understanding
ideas; Var 21 = satisfaction with conference as a tool for conducting extended conversations
*p<0.05
Table E3 Dialogue Ordinal Variable Correlations
Variables Var 16 Var 17 Var 18 Var 19 Var 20 Var 21Effective Communication Var 15 0.310* 0.399* 0.212 0.416* 0.362* 0.409*Var 16 0.364* 0.490* 0.459* 0.511* 0.409*Respectful Communication Var 17 0.654* 0.502* 0.359* 0.376*Var 18 0.415* 0.434* 0.314*Communication Tool Satisfaction Var 19 0.792* 0.721*Var 20 0.714*
Note. Var 15 = instructor/student communication of ideas; Var 16 = student/student
communication of ideas; Var 17 = respect by instructor of student ideas; Var 18 = respect by
other students of student ideas; Var 19 = satisfaction with conference as a tool for expressing
ideas; Var 20 = satisfaction with conference as a tool for understanding ideas; Var 21 =
satisfaction with conference as a tool for conducting extended conversations
*p<0.05
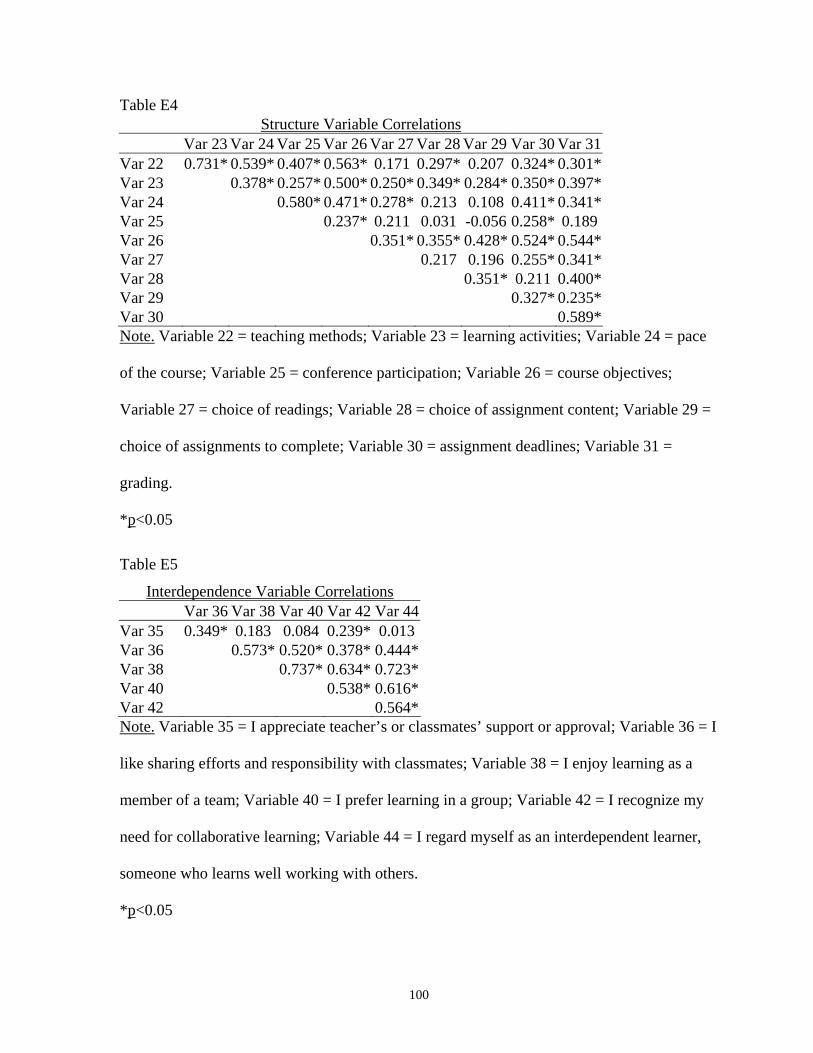
100
Table E4 Structure Variable Correlations
Var 23 Var 24 Var 25 Var 26 Var 27 Var 28 Var 29 Var 30 Var 31 Var 22 0.731* 0.539* 0.407* 0.563* 0.171 0.297* 0.207 0.324* 0.301* Var 23 0.378* 0.257* 0.500* 0.250* 0.349* 0.284* 0.350* 0.397* Var 24 0.580* 0.471* 0.278* 0.213 0.108 0.411* 0.341* Var 25 0.237* 0.211 0.031 -0.056 0.258* 0.189 Var 26 0.351* 0.355* 0.428* 0.524* 0.544* Var 27 0.217 0.196 0.255* 0.341* Var 28 0.351* 0.211 0.400* Var 29 0.327* 0.235* Var 30 0.589* Note. Variable 22 = teaching methods; Variable 23 = learning activities; Variable 24 = pace
of the course; Variable 25 = conference participation; Variable 26 = course objectives;
Variable 27 = choice of readings; Variable 28 = choice of assignment content; Variable 29 =
choice of assignments to complete; Variable 30 = assignment deadlines; Variable 31 =
grading.
*p<0.05
Table E5
Interdependence Variable Correlations Var 36 Var 38 Var 40 Var 42 Var 44Var 35 0.349* 0.183 0.084 0.239* 0.013Var 36 0.573* 0.520* 0.378* 0.444*Var 38 0.737* 0.634* 0.723*Var 40 0.538* 0.616*Var 42 0.564*Note. Variable 35 = I appreciate teacher’s or classmates’ support or approval; Variable 36 = I
like sharing efforts and responsibility with classmates; Variable 38 = I enjoy learning as a
member of a team; Variable 40 = I prefer learning in a group; Variable 42 = I recognize my
need for collaborative learning; Variable 44 = I regard myself as an interdependent learner,
someone who learns well working with others.
*p<0.05
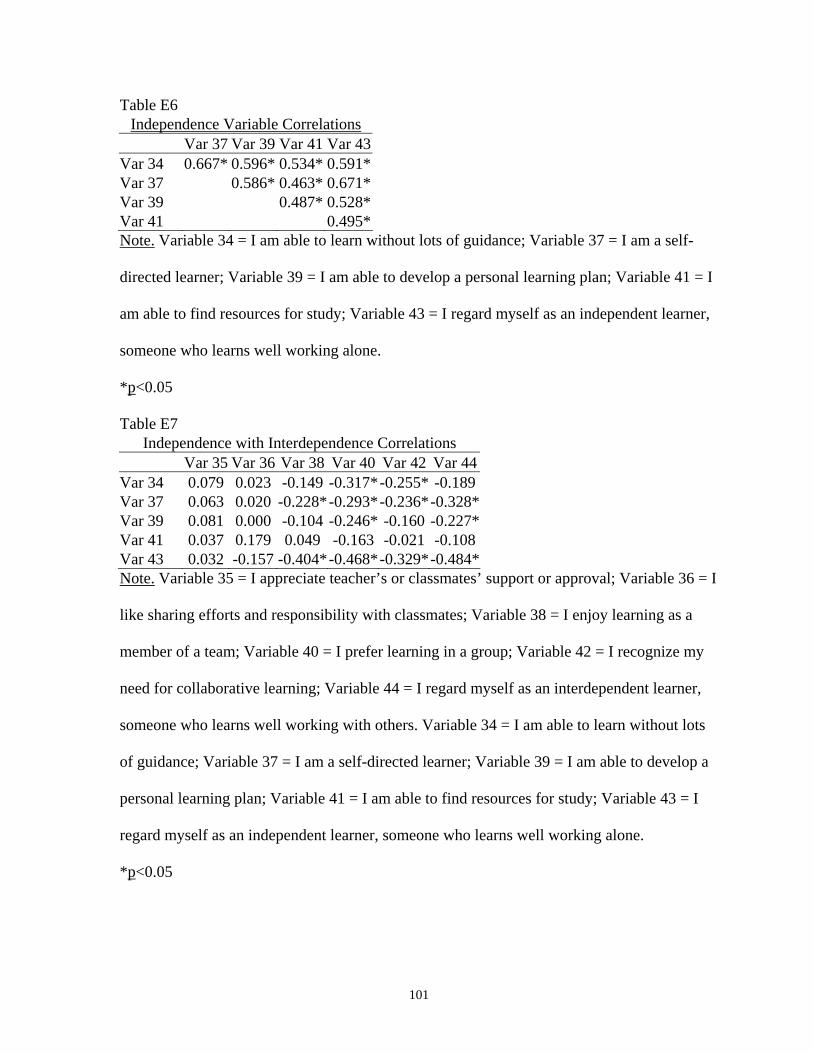
101
Table E6 Independence Variable Correlations
Var 37 Var 39 Var 41 Var 43Var 34 0.667* 0.596* 0.534* 0.591*Var 37 0.586* 0.463* 0.671*Var 39 0.487* 0.528*Var 41 0.495*Note. Variable 34 = I am able to learn without lots of guidance; Variable 37 = I am a self-
directed learner; Variable 39 = I am able to develop a personal learning plan; Variable 41 = I
am able to find resources for study; Variable 43 = I regard myself as an independent learner,
someone who learns well working alone.
*p<0.05
Table E7 Independence with Interdependence Correlations
Var 35 Var 36 Var 38 Var 40 Var 42 Var 44Var 34 0.079 0.023 -0.149 -0.317*-0.255* -0.189Var 37 0.063 0.020 -0.228*-0.293*-0.236*-0.328*Var 39 0.081 0.000 -0.104 -0.246* -0.160 -0.227*Var 41 0.037 0.179 0.049 -0.163 -0.021 -0.108Var 43 0.032 -0.157 -0.404*-0.468*-0.329*-0.484*Note. Variable 35 = I appreciate teacher’s or classmates’ support or approval; Variable 36 = I
like sharing efforts and responsibility with classmates; Variable 38 = I enjoy learning as a
member of a team; Variable 40 = I prefer learning in a group; Variable 42 = I recognize my
need for collaborative learning; Variable 44 = I regard myself as an interdependent learner,
someone who learns well working with others. Variable 34 = I am able to learn without lots
of guidance; Variable 37 = I am a self-directed learner; Variable 39 = I am able to develop a
personal learning plan; Variable 41 = I am able to find resources for study; Variable 43 = I
regard myself as an independent learner, someone who learns well working alone.
*p<0.05
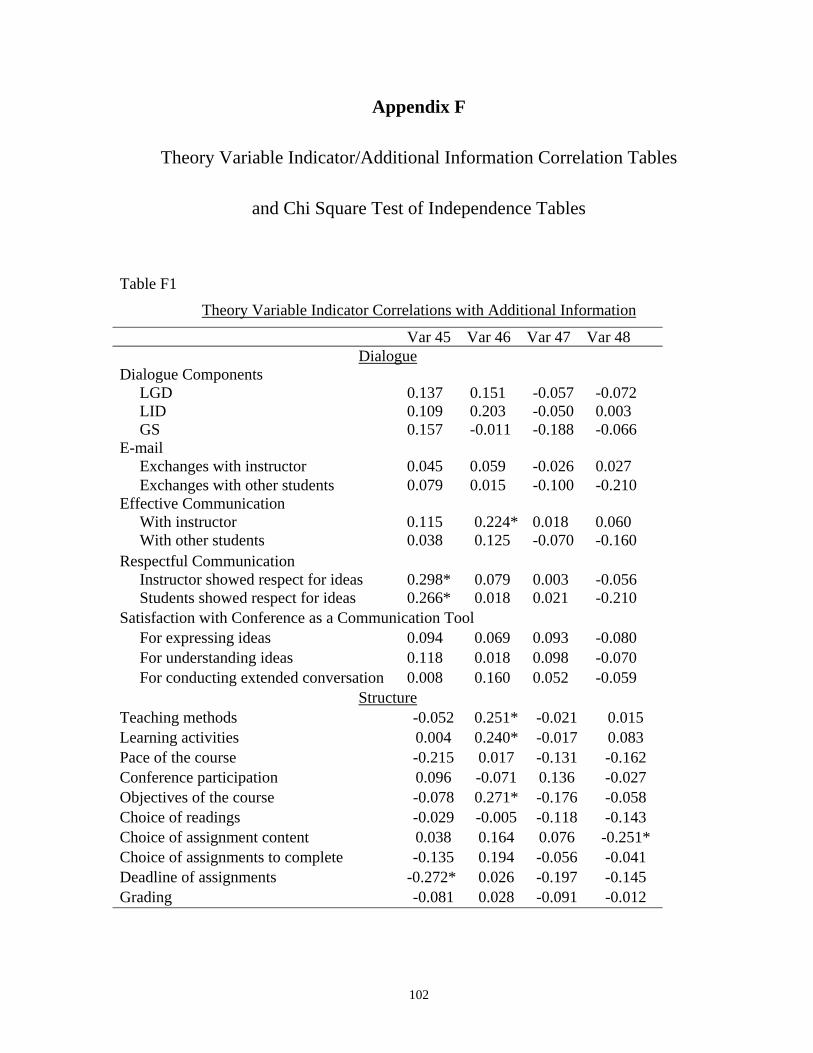
102
Appendix F
Theory Variable Indicator/Additional Information Correlation Tables
and Chi Square Test of Independence Tables
Table F1
Theory Variable Indicator Correlations with Additional Information
Var 45 Var 46 Var 47 Var 48 Dialogue
Dialogue Components LGD 0.137 0.151 -0.057 -0.072 LID 0.109 0.203 -0.050 0.003 GS 0.157 -0.011 -0.188 -0.066 E-mail Exchanges with instructor 0.045 0.059 -0.026 0.027 Exchanges with other students 0.079 0.015 -0.100 -0.210 Effective Communication With instructor 0.115 0.224* 0.018 0.060 With other students 0.038 0.125 -0.070 -0.160 Respectful Communication Instructor showed respect for ideas 0.298* 0.079 0.003 -0.056 Students showed respect for ideas 0.266* 0.018 0.021 -0.210 Satisfaction with Conference as a Communication Tool For expressing ideas 0.094 0.069 0.093 -0.080 For understanding ideas 0.118 0.018 0.098 -0.070 For conducting extended conversation 0.008 0.160 0.052 -0.059
Structure Teaching methods -0.052 0.251* -0.021 0.015 Learning activities 0.004 0.240* -0.017 0.083 Pace of the course -0.215 0.017 -0.131 -0.162 Conference participation 0.096 -0.071 0.136 -0.027 Objectives of the course -0.078 0.271* -0.176 -0.058 Choice of readings -0.029 -0.005 -0.118 -0.143 Choice of assignment content 0.038 0.164 0.076 -0.251* Choice of assignments to complete -0.135 0.194 -0.056 -0.041 Deadline of assignments -0.272* 0.026 -0.197 -0.145 Grading -0.081 0.028 -0.091 -0.012
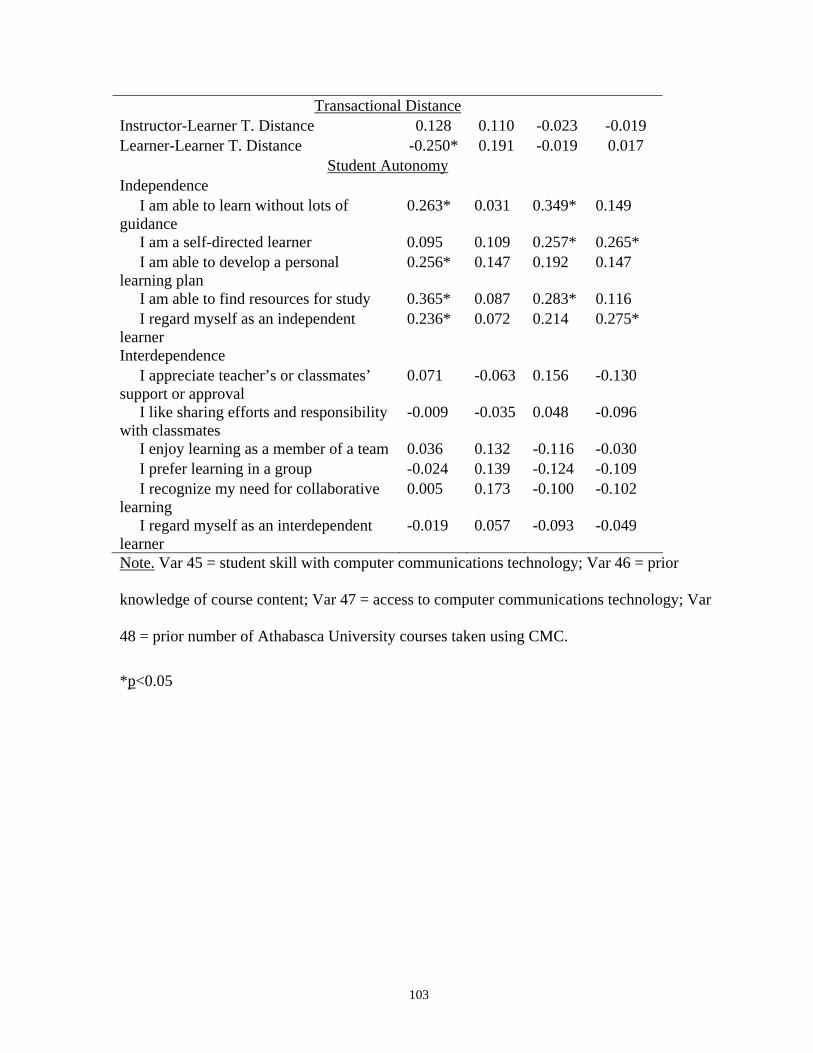
103
Transactional Distance Instructor-Learner T. Distance 0.128 0.110 -0.023 -0.019 Learner-Learner T. Distance -0.250* 0.191 -0.019 0.017
Student Autonomy Independence I am able to learn without lots of guidance
0.263* 0.031 0.349* 0.149
I am a self-directed learner 0.095 0.109 0.257* 0.265* I am able to develop a personal learning plan
0.256* 0.147 0.192 0.147
I am able to find resources for study 0.365* 0.087 0.283* 0.116 I regard myself as an independent learner
0.236* 0.072 0.214 0.275*
Interdependence I appreciate teacher’s or classmates’ support or approval
0.071 -0.063 0.156 -0.130
I like sharing efforts and responsibility with classmates
-0.009 -0.035 0.048 -0.096
I enjoy learning as a member of a team 0.036 0.132 -0.116 -0.030 I prefer learning in a group -0.024 0.139 -0.124 -0.109 I recognize my need for collaborative learning
0.005 0.173 -0.100 -0.102
I regard myself as an interdependent learner
-0.019 0.057 -0.093 -0.049
Note. Var 45 = student skill with computer communications technology; Var 46 = prior
knowledge of course content; Var 47 = access to computer communications technology; Var
48 = prior number of Athabasca University courses taken using CMC.
*p<0.05
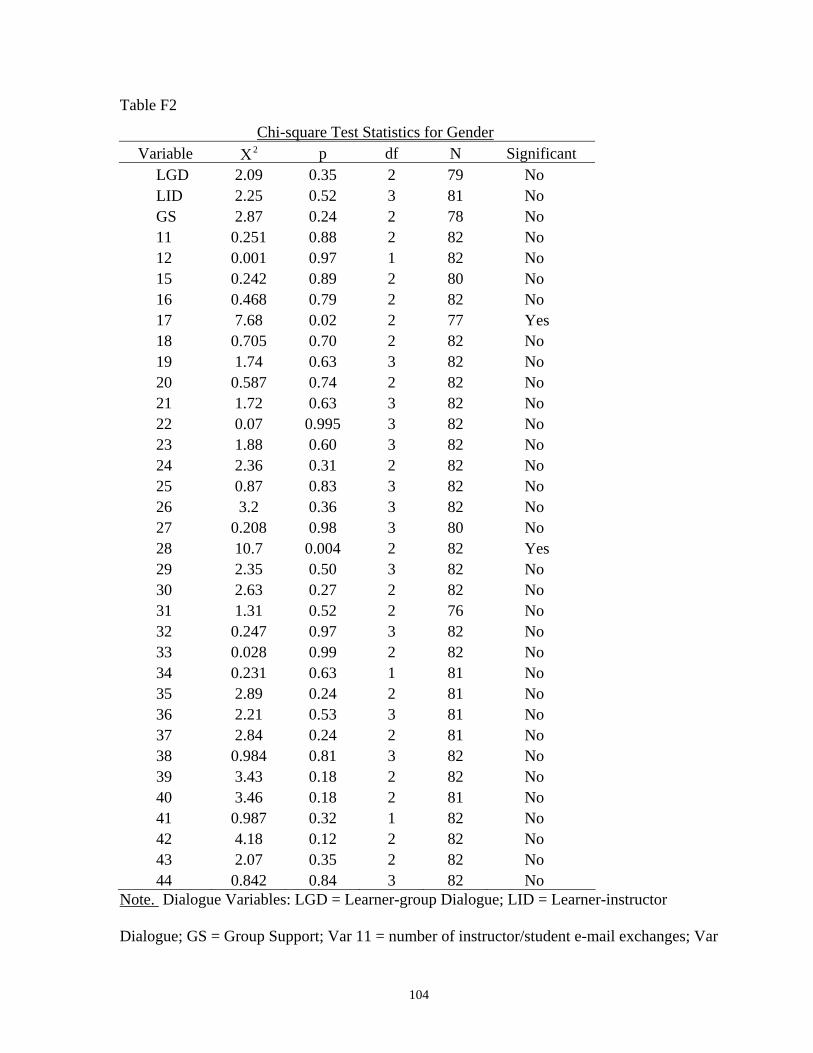
104
Table F2
Chi-square Test Statistics for Gender Variable Χ2 p df N Significant
LGD 2.09 0.35 2 79 No LID 2.25 0.52 3 81 No GS 2.87 0.24 2 78 No 11 0.251 0.88 2 82 No 12 0.001 0.97 1 82 No 15 0.242 0.89 2 80 No 16 0.468 0.79 2 82 No 17 7.68 0.02 2 77 Yes 18 0.705 0.70 2 82 No 19 1.74 0.63 3 82 No 20 0.587 0.74 2 82 No 21 1.72 0.63 3 82 No 22 0.07 0.995 3 82 No 23 1.88 0.60 3 82 No 24 2.36 0.31 2 82 No 25 0.87 0.83 3 82 No 26 3.2 0.36 3 82 No 27 0.208 0.98 3 80 No 28 10.7 0.004 2 82 Yes 29 2.35 0.50 3 82 No 30 2.63 0.27 2 82 No 31 1.31 0.52 2 76 No 32 0.247 0.97 3 82 No 33 0.028 0.99 2 82 No 34 0.231 0.63 1 81 No 35 2.89 0.24 2 81 No 36 2.21 0.53 3 81 No 37 2.84 0.24 2 81 No 38 0.984 0.81 3 82 No 39 3.43 0.18 2 82 No 40 3.46 0.18 2 81 No 41 0.987 0.32 1 82 No 42 4.18 0.12 2 82 No 43 2.07 0.35 2 82 No 44 0.842 0.84 3 82 No
Note. Dialogue Variables: LGD = Learner-group Dialogue; LID = Learner-instructor
Dialogue; GS = Group Support; Var 11 = number of instructor/student e-mail exchanges; Var
105
12 = number of student/student e-mail exchanges; Var 15 = instructor/student
communication of ideas; Var 16 = student/student communication of ideas; Var 17 = respect
by instructor of student ideas; Var 18 = respect by other students of student ideas; Var 19 =
satisfaction with conference as a tool for expressing ideas; Var 20 = satisfaction with
conference as a tool for understanding ideas; Var 21 = satisfaction with conference as a tool
for conducting extended conversations; Structure Variables: Variable 22 = teaching methods;
Variable 23 = learning activities; Variable 24 = pace of the course; Variable 25 = conference
participation; Variable 26 = course objectives; Variable 27 = choice of readings; Variable 28
= choice of assignment content; Variable 29 = choice of assignments to complete; Variable
30 = assignment deadlines; Variable 31 = grading; Autonomy Variables: Variable 35 = I
appreciate teacher’s or classmates’ support or approval; Variable 36 = I like sharing efforts
and responsibility with classmates; Variable 38 = I enjoy learning as a member of a team;
Variable 40 = I prefer learning in a group; Variable 42 = I recognize my need for
collaborative learning; Variable 44 = I regard myself as an interdependent learner, someone
who learns well working with others. Variable 34 = I am able to learn without lots of
guidance; Variable 37 = I am a self-directed learner; Variable 39 = I am able to develop a
personal learning plan; Variable 41 = I am able to find resources for study; Variable 43 = I
regard myself as an independent learner, someone who learns well working alone.
*p<0.05
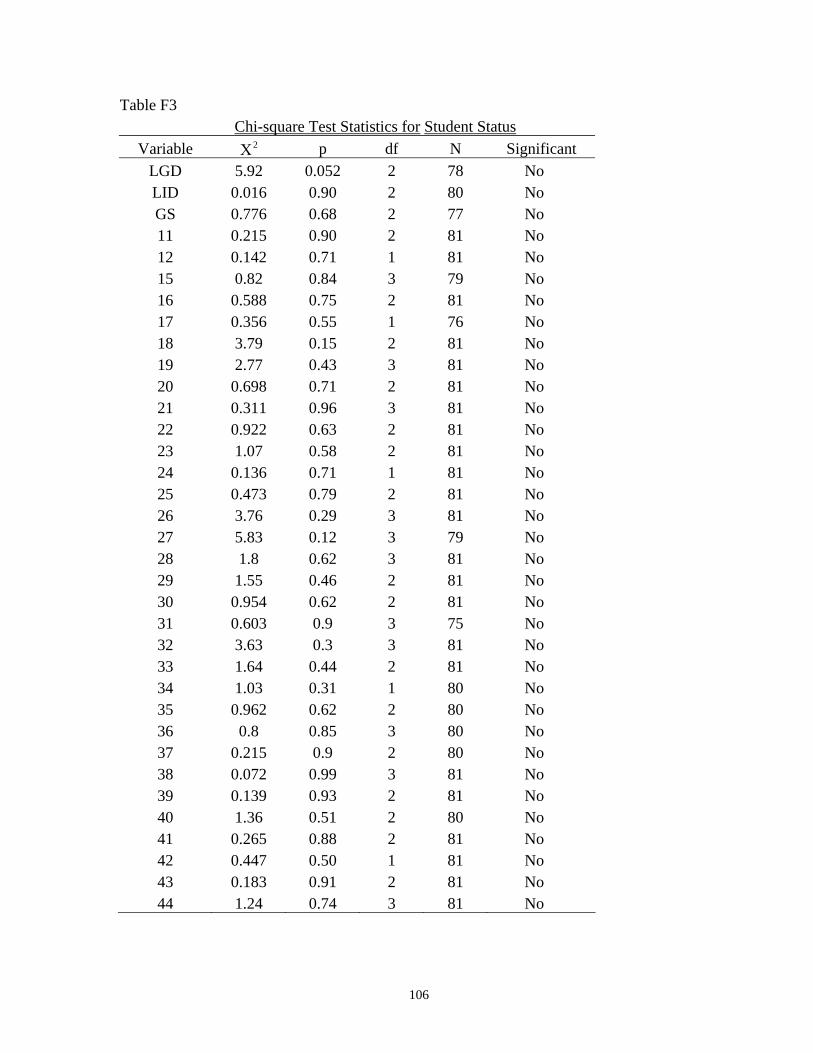
106
Table F3 Chi-square Test Statistics for Student Status
Variable Χ2 p df N Significant LGD 5.92 0.052 2 78 No LID 0.016 0.90 2 80 No GS 0.776 0.68 2 77 No 11 0.215 0.90 2 81 No 12 0.142 0.71 1 81 No 15 0.82 0.84 3 79 No 16 0.588 0.75 2 81 No 17 0.356 0.55 1 76 No 18 3.79 0.15 2 81 No 19 2.77 0.43 3 81 No 20 0.698 0.71 2 81 No 21 0.311 0.96 3 81 No 22 0.922 0.63 2 81 No 23 1.07 0.58 2 81 No 24 0.136 0.71 1 81 No 25 0.473 0.79 2 81 No 26 3.76 0.29 3 81 No 27 5.83 0.12 3 79 No 28 1.8 0.62 3 81 No 29 1.55 0.46 2 81 No 30 0.954 0.62 2 81 No 31 0.603 0.9 3 75 No 32 3.63 0.3 3 81 No 33 1.64 0.44 2 81 No 34 1.03 0.31 1 80 No 35 0.962 0.62 2 80 No 36 0.8 0.85 3 80 No 37 0.215 0.9 2 80 No 38 0.072 0.99 3 81 No 39 0.139 0.93 2 81 No 40 1.36 0.51 2 80 No 41 0.265 0.88 2 81 No 42 0.447 0.50 1 81 No 43 0.183 0.91 2 81 No 44 1.24 0.74 3 81 No
107
Note. Dialogue Variables: LGD = Learner-group Dialogue; LID = Learner-instructor
Dialogue; GS = Group Support; Var 11 = number of instructor/student e-mail exchanges; Var
12 = number of student/student e-mail exchanges; Var 15 = instructor/student
communication of ideas; Var 16 = student/student communication of ideas; Var 17 = respect
by instructor of student ideas; Var 18 = respect by other students of student ideas; Var 19 =
satisfaction with conference as a tool for expressing ideas; Var 20 = satisfaction with
conference as a tool for understanding ideas; Var 21 = satisfaction with conference as a tool
for conducting extended conversations; Structure Variables: Variable 22 = teaching methods;
Variable 23 = learning activities; Variable 24 = pace of the course; Variable 25 = conference
participation; Variable 26 = course objectives; Variable 27 = choice of readings; Variable 28
= choice of assignment content; Variable 29 = choice of assignments to complete; Variable
30 = assignment deadlines; Variable 31 = grading; Autonomy Variables: Variable 35 = I
appreciate teacher’s or classmates’ support or approval; Variable 36 = I like sharing efforts
and responsibility with classmates; Variable 38 = I enjoy learning as a member of a team;
Variable 40 = I prefer learning in a group; Variable 42 = I recognize my need for
collaborative learning; Variable 44 = I regard myself as an interdependent learner, someone
who learns well working with others. Variable 34 = I am able to learn without lots of
guidance; Variable 37 = I am a self-directed learner; Variable 39 = I am able to develop a
personal learning plan; Variable 41 = I am able to find resources for study; Variable 43 = I
regard myself as an independent learner, someone who learns well working alone.
*p<0.05
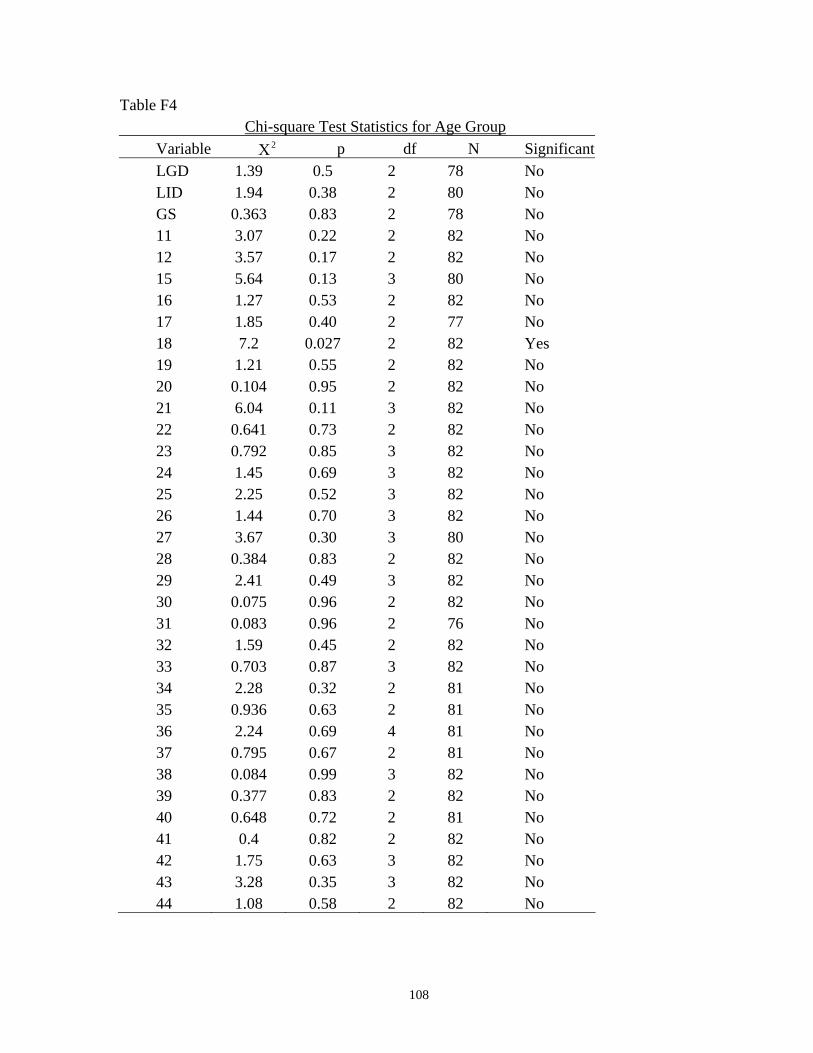
108
Table F4 Chi-square Test Statistics for Age Group
Variable Χ2 p df N Significant LGD 1.39 0.5 2 78 No LID 1.94 0.38 2 80 No GS 0.363 0.83 2 78 No 11 3.07 0.22 2 82 No 12 3.57 0.17 2 82 No 15 5.64 0.13 3 80 No 16 1.27 0.53 2 82 No 17 1.85 0.40 2 77 No 18 7.2 0.027 2 82 Yes 19 1.21 0.55 2 82 No 20 0.104 0.95 2 82 No 21 6.04 0.11 3 82 No 22 0.641 0.73 2 82 No 23 0.792 0.85 3 82 No 24 1.45 0.69 3 82 No 25 2.25 0.52 3 82 No 26 1.44 0.70 3 82 No 27 3.67 0.30 3 80 No 28 0.384 0.83 2 82 No 29 2.41 0.49 3 82 No 30 0.075 0.96 2 82 No 31 0.083 0.96 2 76 No 32 1.59 0.45 2 82 No 33 0.703 0.87 3 82 No 34 2.28 0.32 2 81 No 35 0.936 0.63 2 81 No 36 2.24 0.69 4 81 No 37 0.795 0.67 2 81 No 38 0.084 0.99 3 82 No 39 0.377 0.83 2 82 No 40 0.648 0.72 2 81 No 41 0.4 0.82 2 82 No 42 1.75 0.63 3 82 No 43 3.28 0.35 3 82 No 44 1.08 0.58 2 82 No
109
Note. Dialogue Variables: LGD = Learner-group Dialogue; LID = Learner-instructor
Dialogue; GS = Group Support; Var 11 = number of instructor/student e-mail exchanges; Var
12 = number of student/student e-mail exchanges; Var 15 = instructor/student
communication of ideas; Var 16 = student/student communication of ideas; Var 17 = respect
by instructor of student ideas; Var 18 = respect by other students of student ideas; Var 19 =
satisfaction with conference as a tool for expressing ideas; Var 20 = satisfaction with
conference as a tool for understanding ideas; Var 21 = satisfaction with conference as a tool
for conducting extended conversations; Structure Variables: Variable 22 = teaching methods;
Variable 23 = learning activities; Variable 24 = pace of the course; Variable 25 = conference
participation; Variable 26 = course objectives; Variable 27 = choice of readings; Variable 28
= choice of assignment content; Variable 29 = choice of assignments to complete; Variable
30 = assignment deadlines; Variable 31 = grading; Autonomy Variables: Variable 35 = I
appreciate teacher’s or classmates’ support or approval; Variable 36 = I like sharing efforts
and responsibility with classmates; Variable 38 = I enjoy learning as a member of a team;
Variable 40 = I prefer learning in a group; Variable 42 = I recognize my need for
collaborative learning; Variable 44 = I regard myself as an interdependent learner, someone
who learns well working with others. Variable 34 = I am able to learn without lots of
guidance; Variable 37 = I am a self-directed learner; Variable 39 = I am able to develop a
personal learning plan; Variable 41 = I am able to find resources for study; Variable 43 = I
regard myself as an independent learner, someone who learns well working alone.
*p<0.05