relationships between environmental factors and ... · relationships between environmental factors...
TRANSCRIPT
Relationships between environmental factors and participationin adults with traumatic brain injury, stroke, and spinal cordinjury: a cross-sectional multi-center study
Alex W. K. Wong1,2 • Sheryl Ng2,3 • Jessica Dashner1 • M. Carolyn Baum4•
Joy Hammel5 • Susan Magasi6 • Jin-Shei Lai7 • Noelle E. Carlozzi8 •
David S. Tulsky9 • Ana Miskovic10 • Arielle Goldsmith10 • Allen W. Heinemann10,11
Accepted: 21 April 2017
� Springer International Publishing Switzerland 2017
Abstract
Purpose To develop and evaluate a model of environ-
mental factors-participation relationships for persons with
traumatic brain injury (TBI), stroke, and spinal cord injury
(SCI), and test whether this model differed across three
diagnostic groups, as well as other demographic and clin-
ical characteristics.
Methods A cross-sectional observational study included
545 community-dwelling adults with neurological disor-
ders (TBI = 166; stroke = 189; SCI = 190) recruited at
three academic medical centers. Participants completed
patient-reported measures of environmental factors and
participation.
Results The final structural equation model had accept-
able fit to the data (CFI = 0.923; TLI = 0.898;
RMSEA = 0.085; SRMR = 0.053), explaining 63% of the
variance in participation in social roles and activities.
Systems, services, and policies had an indirect influence on
participation and this relation was mediated by social
attitudes and the built and natural environment. Access to
information and technology was associated with the built
and natural environment which in turn influence on par-
ticipation (ps\ 0.001). The model was consistent acrossElectronic supplementary material The online version of thisarticle (doi:10.1007/s11136-017-1586-5) contains supplementarymaterial, which is available to authorized users.
& Alex W. K. Wong
Sheryl Ng
Jessica Dashner
M. Carolyn Baum
Joy Hammel
Susan Magasi
Jin-Shei Lai
Noelle E. Carlozzi
David S. Tulsky
Ana Miskovic
Arielle Goldsmith
Allen W. Heinemann
1 Program in Occupational Therapy and Department of
Neurology, Washington University School of Medicine,
St. Louis, MO, USA
2 Program in Occupational Therapy, Washington University
School of Medicine, 4444 Forest Park Ave, Campus
Box 8505, St. Louis, MO 63108, USA
3 Saw Swee Hock School of Public Health, National University
of Singapore, Singapore, Singapore
4 Program in Occupational Therapy, Department of Neurology
and George Warren Brown School of Social Work,
Washington University, St. Louis, MO, USA
5 Departments of Occupational Therapy and Disability and
Human Development, University of Illinois at Chicago,
Chicago, IL, USA
6 Department of Occupational Therapy, University of Illinois
at Chicago, Chicago, IL, USA
123
Qual Life Res
DOI 10.1007/s11136-017-1586-5
sex, diagnosis, severity/type of injury, education, race, age,
marital status, years since injury, wheelchairs use, insur-
ance coverage, personal or household income, and crys-
tallized cognition.
Conclusions Social and physical environments appear to
mediate the influence of systems, services, and policies
on participation after acquired neurological disorders.
These relations are stable across three diagnostic groups
and many personal and clinical factors. Our findings
inform health and disability policy, and provide guidance
for implementing the initiatives in Healthy People 2020
in particular for people with acquired neurological
disorders.
Keywords Environment � Participation � Stroke � Spinalcord injury � Traumatic brain injury
Abbreviations
ADA Americans with Disabilities Act
AIT Access to information and technology
BNE Built and natural environment
CFA Confirmatory factor analysis
CFI Comparative Fit Index
CPI Community Participation Indicators
EFIB Environmental Factors Item Banks
GCS Glasgow Coma Scale
ICF International Classification of Functioning,
Disability and Health
PROM Patient-Reported Outcomes Measures
PROMIS Patient-Reported Outcomes Measurement
Information System
QOL Quality of life
RMSEA Root mean square error of approximation
SCI Spinal cord injury
SEM Structural equation modeling
SRA Social roles and activities
SRMR Standardized Root Mean Square Residual
SSP Systems, Services and Policies
TBI Traumatic brain injury
TLI Tucker-Lewis index
WHO World Health Organization
Introduction
Over 50 million adults in the United States, or 1 in 5, report
a disability [1]. Neurological disorders are the most com-
mon cause of serious disability and one of the greatest
threats to public health [2]. In the US, there are 6.5 million
adults who ever had a stroke [3] and 2.8 million people
who sustain a Traumatic Brain Injury (TBI) annually [4].
Approximately 282,000 individuals with spinal cord injury
(SCI) are alive in the US [5]. Healthy People 2020, a
template to guide public health action, includes goals to
promote the health and well-being of people with disabil-
ities including those with acquired neurological disorders
[6]. The document highlights several areas for action to
enhance the health of people who experience disabilities by
removal of physical and policy barriers, increasing social
participation, and increasing access to technology and
assistive supports. The twenty-fifth anniversary of the
passage of the Americans with Disabilities Act (ADA) in
2015 provided an opportunity to reflect on the achieve-
ments of the ADA in terms of improved quality of life
(QOL) for individuals with disabilities [7]; however, the
ADA has not eliminated all social and physical barriers that
limit participation, posing a challenge to the fulfillment of
the Healthy People 2020 goals [8]. The World Health
Organization’s (WHO) International Classification of
Functioning, Disability and Health (ICF) defines partici-
pation as an involvement in life situations including
domestic life, interpersonal relationships, work, education,
and community, social, and civic life [9]. Participation is
beneficial to well-being and health-related QOL [10].
Institute of Medicine [11] highlights the role that envi-
ronmental factors have on the health and participation of
groups identified at risk for health disparities, including
people with disabilities [12, 13]. Unfortunately, among all
individuals with disabilities, the extent of participation of
those with acquired neurological disorders, including TBI,
stroke, and SCI, are largely influenced by environmental
factors [14]. Following the onset of an acquired neuro-
logical disorder, individuals are more susceptible to expe-
rience a mismatch between their personal factors/
capabilities and the demands of their environments. Stines
et al. [15] indicated that optimal participation in life after
SCI is primarily determined by the environment. Access to
participation opportunities and having control over partic-
ipation in the community are often restricted by physical,
social, and system environmental barriers following stroke
[16]. An earlier study reported that environmental barriers
have a negative effect on participation outcomes following
7 Departments of Medical Social Science and Pediatric,
Northwestern University Feinberg School of Medicine,
Chicago, IL, USA
8 Department of Physical Medicine and Rehabilitation,
University of Michigan Medical School, Ann Arbor, MI,
USA
9 Department of Physical Therapy, University of Delaware,
Newark, DE, USA
10 Center for Rehabilitation Outcomes Research, Rehabilitation
Institute of Chicago, Chicago, IL, USA
11 Department of Physical Medicine and Rehabilitation,
Northwestern University Feinberg School of Medicine,
Chicago, IL, USA
Qual Life Res
123
a TBI [17]. The environment can influence participation
following TBI, stroke, or SCI. Less is known about the
relationship between specific aspects of the environment
and their influence on the lives of people in these
populations.
Bronfenbrenner [18] and others exploring the social
determinants of health [19] recognize the interaction within
and between ecological units and emphasize that the health
outcomes of individuals, communities, and social groups
are influenced by physical, social, and policy factors in
micro-to-macro-environments. Using mixed-methods
research designs, our team [12] recently developed a
transactional model describing how environmental factors
influence everyday participation at the micro (immediate),
mesa (community), and macro (societal) levels. These
levels radiate out from an individual and represent distinct
but related environments from immediate to distal influ-
ences. Table 1 describes environmental factors that we
have studied at each of these levels. Closest to the indi-
vidual, the micro (immediate)-environment (e.g., built
environment and social attitudes) has more proximal
influences to participation, followed by the mesa (com-
munity)-environment (e.g., information about community
resources and technological access). Finally, the macro
(societal)-environment or the larger societal and cultural
context (e.g., systems & political influence) distally influ-
ence participation through the provision, choice, and
availability of opportunities and resources for people with
disabilities in micro (immediate)- or mesa (community)-
environments. Barriers resulting from environmental fac-
tors can thus be addressed at a micro, mesa, or macro level
to influence transactively participation, community
engagement, and societal enfranchisement. We proposed a
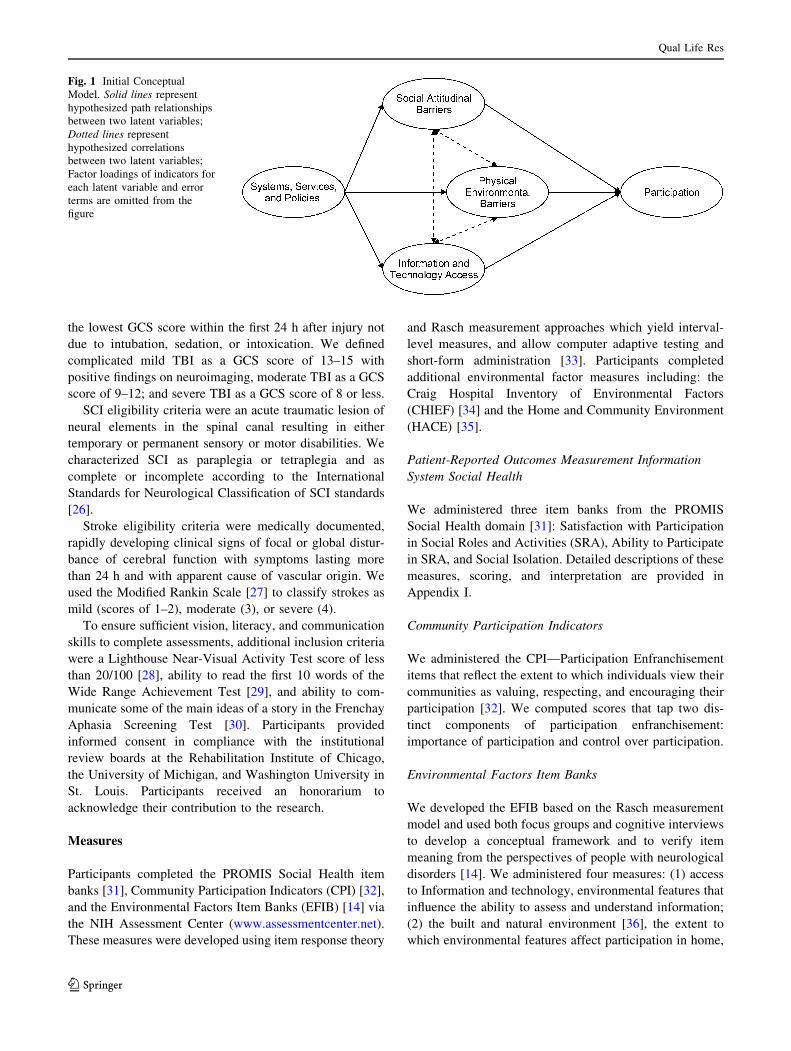
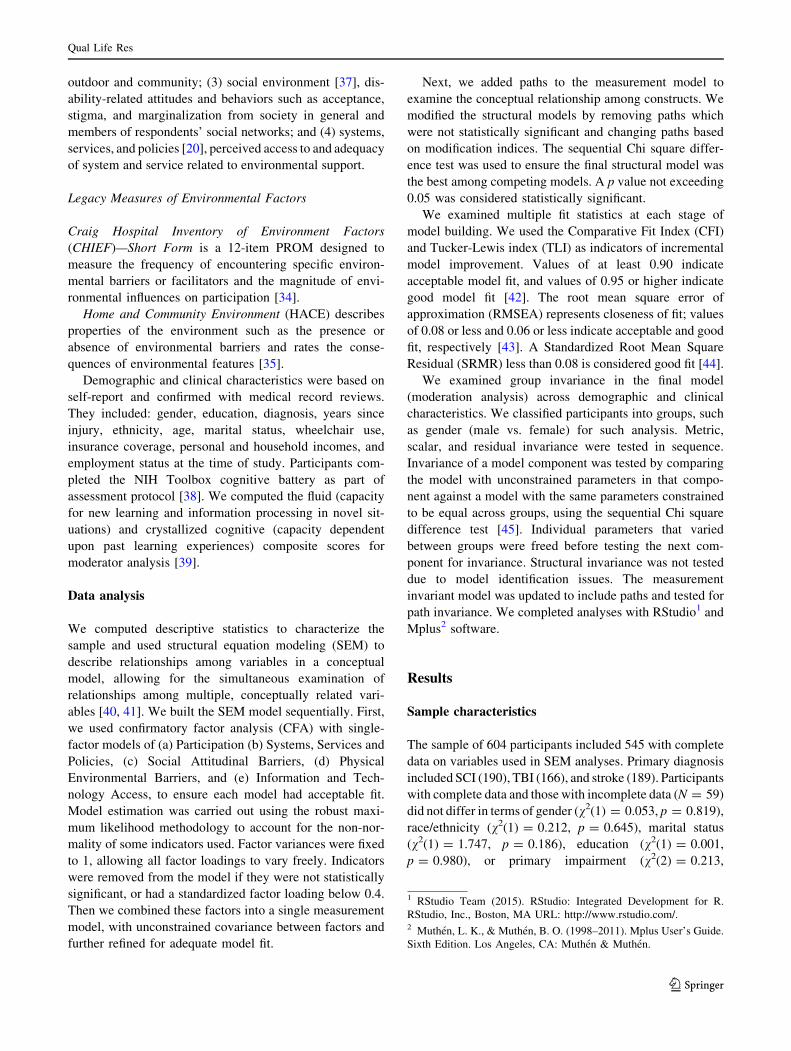
conceptual model for this study (Fig. 1). We hypothesized
that social support and political influences (macro-envi-
ronment) have distal influence on participation [20] and
that this relationship is mediated by social attitudes,
physical environmental barriers, and access and usability of
information and technology [21]. For example, we expect
that the ADA is a macro-level facilitator that influences
mesa-level community changes to promote accessibility
and increase participation opportunities for people with
disabilities. When businesses fail to comply with ADA
regulations, attitudinal and physical barriers persist that
may limit participation. We expect that these mediating
factors co-exist and are associated with other barriers to
community living [12].
Additional studies support the pressing need to refine the
theoretical and measurement foundation of environmental
factors-participation relationships [13, 22]. Recently
developed measures provide improved representation of
environmental factors and participation for people with
acquired neurological disorders [14] and are supported by
work that operationalizes the ICF categories [23]. There-
fore, the goal of this study was to examine relationships
between environmental factors and participation constructs
as represented by patient-reported outcome measures
(PROM) among individuals with TBI, stroke and SCI.
Methods
Participants and procedures
As part of a larger study, community-dwelling adults with
TBI, stroke, or SCI were invited to participate in a com-
prehensive, 2-day assessment at three Midwestern medical
centers. We recruited participants through patient reg-
istries, outpatient clinics, newsletters, flyers, and affiliated
hospital referrals. Inclusion criteria required participants to
be at least 18 years of age, willing and able to participate in
two days of testing, at least one year post-injury, and fluent
in English at a fifth grade or higher level. We reviewed
medical records enrollment to verify eligibility.
TBI eligibility criteria included a diagnosis of compli-
cated mild [24], moderate [25], or severe TBI [25]. We
used emergency department Glasgow Coma Scale (GCS)
scores to categorize TBI severity; we defined severity as
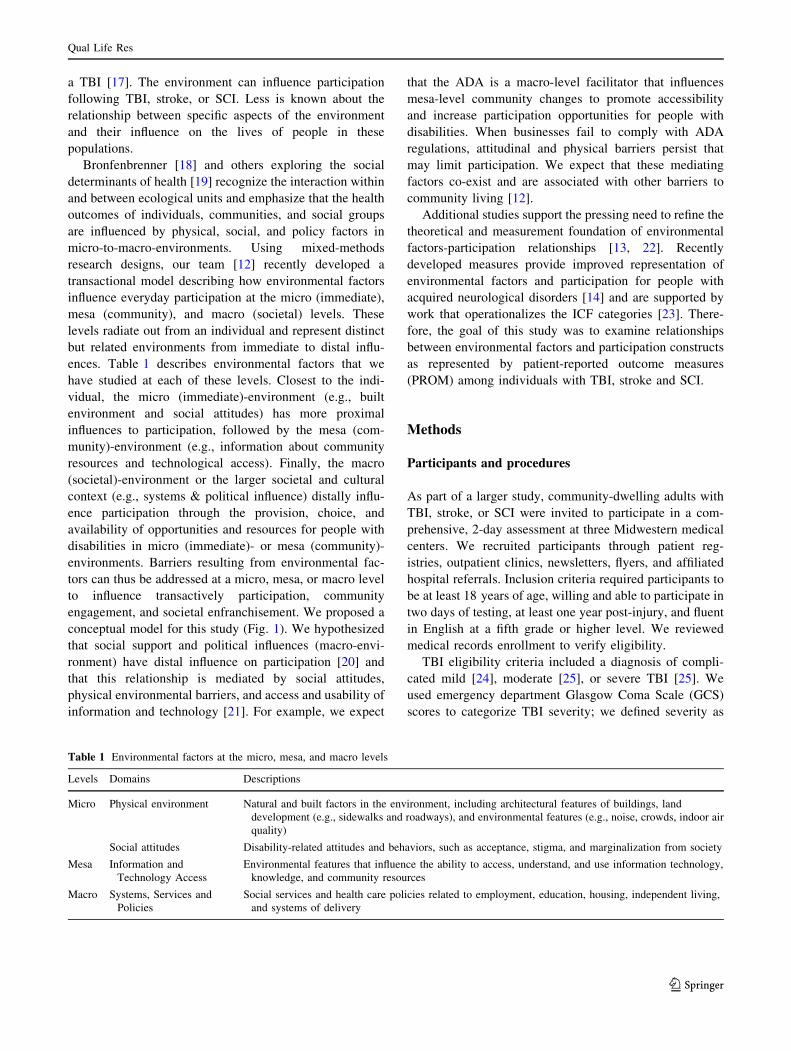
Table 1 Environmental factors at the micro, mesa, and macro levels
Levels Domains Descriptions
Micro Physical environment Natural and built factors in the environment, including architectural features of buildings, land
development (e.g., sidewalks and roadways), and environmental features (e.g., noise, crowds, indoor air
quality)
Social attitudes Disability-related attitudes and behaviors, such as acceptance, stigma, and marginalization from society
Mesa Information and
Technology Access
Environmental features that influence the ability to access, understand, and use information technology,
knowledge, and community resources
Macro Systems, Services and
Policies
Social services and health care policies related to employment, education, housing, independent living,
and systems of delivery
Qual Life Res
123
the lowest GCS score within the first 24 h after injury not
due to intubation, sedation, or intoxication. We defined
complicated mild TBI as a GCS score of 13–15 with
positive findings on neuroimaging, moderate TBI as a GCS
score of 9–12; and severe TBI as a GCS score of 8 or less.
SCI eligibility criteria were an acute traumatic lesion of
neural elements in the spinal canal resulting in either
temporary or permanent sensory or motor disabilities. We
characterized SCI as paraplegia or tetraplegia and as
complete or incomplete according to the International
Standards for Neurological Classification of SCI standards
[26].
Stroke eligibility criteria were medically documented,
rapidly developing clinical signs of focal or global distur-
bance of cerebral function with symptoms lasting more
than 24 h and with apparent cause of vascular origin. We
used the Modified Rankin Scale [27] to classify strokes as
mild (scores of 1–2), moderate (3), or severe (4).
To ensure sufficient vision, literacy, and communication
skills to complete assessments, additional inclusion criteria
were a Lighthouse Near-Visual Activity Test score of less
than 20/100 [28], ability to read the first 10 words of the
Wide Range Achievement Test [29], and ability to com-
municate some of the main ideas of a story in the Frenchay
Aphasia Screening Test [30]. Participants provided
informed consent in compliance with the institutional
review boards at the Rehabilitation Institute of Chicago,
the University of Michigan, and Washington University in
St. Louis. Participants received an honorarium to
acknowledge their contribution to the research.
Measures
Participants completed the PROMIS Social Health item
banks [31], Community Participation Indicators (CPI) [32],
and the Environmental Factors Item Banks (EFIB) [14] via
the NIH Assessment Center (www.assessmentcenter.net).
These measures were developed using item response theory
and Rasch measurement approaches which yield interval-
level measures, and allow computer adaptive testing and
short-form administration [33]. Participants completed
additional environmental factor measures including: the
Craig Hospital Inventory of Environmental Factors
(CHIEF) [34] and the Home and Community Environment
(HACE) [35].
Patient-Reported Outcomes Measurement Information
System Social Health
We administered three item banks from the PROMIS
Social Health domain [31]: Satisfaction with Participation
in Social Roles and Activities (SRA), Ability to Participate
in SRA, and Social Isolation. Detailed descriptions of these
measures, scoring, and interpretation are provided in
Appendix I.
Community Participation Indicators
We administered the CPI—Participation Enfranchisement
items that reflect the extent to which individuals view their
communities as valuing, respecting, and encouraging their
participation [32]. We computed scores that tap two dis-
tinct components of participation enfranchisement:
importance of participation and control over participation.
Environmental Factors Item Banks
We developed the EFIB based on the Rasch measurement
model and used both focus groups and cognitive interviews
to develop a conceptual framework and to verify item
meaning from the perspectives of people with neurological
disorders [14]. We administered four measures: (1) access
to Information and technology, environmental features that
influence the ability to assess and understand information;
(2) the built and natural environment [36], the extent to
which environmental features affect participation in home,
Fig. 1 Initial Conceptual
Model. Solid lines represent
hypothesized path relationships
between two latent variables;
Dotted lines represent
hypothesized correlations
between two latent variables;
Factor loadings of indicators for
each latent variable and error
terms are omitted from the
figure
Qual Life Res
123
outdoor and community; (3) social environment [37], dis-
ability-related attitudes and behaviors such as acceptance,
stigma, and marginalization from society in general and
members of respondents’ social networks; and (4) systems,
services, and policies [20], perceived access to and adequacy
of system and service related to environmental support.
Legacy Measures of Environmental Factors
Craig Hospital Inventory of Environment Factors
(CHIEF)—Short Form is a 12-item PROM designed to
measure the frequency of encountering specific environ-
mental barriers or facilitators and the magnitude of envi-
ronmental influences on participation [34].
Home and Community Environment (HACE) describes
properties of the environment such as the presence or
absence of environmental barriers and rates the conse-
quences of environmental features [35].
Demographic and clinical characteristics were based on
self-report and confirmed with medical record reviews.
They included: gender, education, diagnosis, years since
injury, ethnicity, age, marital status, wheelchair use,
insurance coverage, personal and household incomes, and
employment status at the time of study. Participants com-
pleted the NIH Toolbox cognitive battery as part of
assessment protocol [38]. We computed the fluid (capacity
for new learning and information processing in novel sit-
uations) and crystallized cognitive (capacity dependent
upon past learning experiences) composite scores for
moderator analysis [39].
Data analysis
We computed descriptive statistics to characterize the
sample and used structural equation modeling (SEM) to
describe relationships among variables in a conceptual
model, allowing for the simultaneous examination of
relationships among multiple, conceptually related vari-
ables [40, 41]. We built the SEM model sequentially. First,
we used confirmatory factor analysis (CFA) with single-
factor models of (a) Participation (b) Systems, Services and
Policies, (c) Social Attitudinal Barriers, (d) Physical
Environmental Barriers, and (e) Information and Tech-
nology Access, to ensure each model had acceptable fit.
Model estimation was carried out using the robust maxi-
mum likelihood methodology to account for the non-nor-
mality of some indicators used. Factor variances were fixed
to 1, allowing all factor loadings to vary freely. Indicators
were removed from the model if they were not statistically
significant, or had a standardized factor loading below 0.4.
Then we combined these factors into a single measurement
model, with unconstrained covariance between factors and
further refined for adequate model fit.
Next, we added paths to the measurement model to
examine the conceptual relationship among constructs. We
modified the structural models by removing paths which
were not statistically significant and changing paths based
on modification indices. The sequential Chi square differ-
ence test was used to ensure the final structural model was
the best among competing models. A p value not exceeding
0.05 was considered statistically significant.
We examined multiple fit statistics at each stage of
model building. We used the Comparative Fit Index (CFI)
and Tucker-Lewis index (TLI) as indicators of incremental
model improvement. Values of at least 0.90 indicate
acceptable model fit, and values of 0.95 or higher indicate
good model fit [42]. The root mean square error of
approximation (RMSEA) represents closeness of fit; values
of 0.08 or less and 0.06 or less indicate acceptable and good
fit, respectively [43]. A Standardized Root Mean Square
Residual (SRMR) less than 0.08 is considered good fit [44].
We examined group invariance in the final model
(moderation analysis) across demographic and clinical
characteristics. We classified participants into groups, such
as gender (male vs. female) for such analysis. Metric,
scalar, and residual invariance were tested in sequence.
Invariance of a model component was tested by comparing
the model with unconstrained parameters in that compo-
nent against a model with the same parameters constrained
to be equal across groups, using the sequential Chi square
difference test [45]. Individual parameters that varied
between groups were freed before testing the next com-
ponent for invariance. Structural invariance was not tested
due to model identification issues. The measurement
invariant model was updated to include paths and tested for
path invariance. We completed analyses with RStudio1 and
Mplus2 software.
Results
Sample characteristics
The sample of 604 participants included 545 with complete
data on variables used in SEM analyses. Primary diagnosis
included SCI (190), TBI (166), and stroke (189). Participants
with complete data and those with incomplete data (N = 59)
did not differ in terms of gender (v2(1) = 0.053, p = 0.819),
race/ethnicity (v2(1) = 0.212, p = 0.645), marital status
(v2(1) = 1.747, p = 0.186), education (v2(1) = 0.001,
p = 0.980), or primary impairment (v2(2) = 0.213,
1 RStudio Team (2015). RStudio: Integrated Development for R.
RStudio, Inc., Boston, MA URL: http://www.rstudio.com/.2 Muthen, L. K., & Muthen, B. O. (1998–2011). Mplus User’s Guide.
Sixth Edition. Los Angeles, CA: Muthen & Muthen.
Qual Life Res
123
p = 0.899). However, participants with complete data were
younger (mean age = 46.8 ± 16.0 years vs. 52.8 ± 18.2;
t(602) = -2.736, p = 0.006) than those with missing data.
Table 2 provides details about the sample.
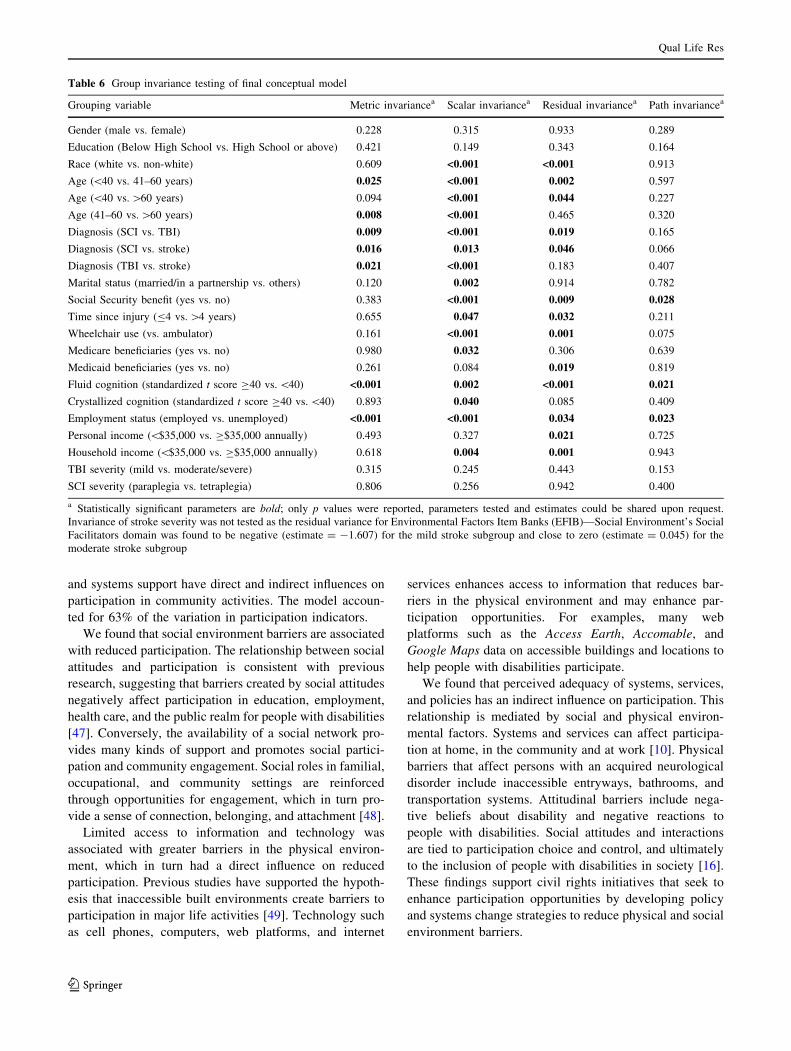
Measurement models
Indicators entered into each of the five single-factor models
are summarized in Table 3. The initial measurement model
did not provide a good fit to the data. Table 4 shows fit
indices for various models. Over the model building process,
we removed Importance of Participation from the CPI;
Service and Policy domains of CHIEF; Home Mobility,
Community Mobility, Attitudes, Mobility Device, Commu-
nication Device, and Transportation domains of HACE due
to small factor loadings. Access to Information and Tech-
nology had only a single indicator after model refinement
[41]; thus, we corrected the measurement error in this
indicator using sample variance and instrument reliability
estimates from an earlier study [46]. The final measurement
model exhibited marginal good fit (CFI = 0.923,
TLI = 0.893, RMSEA = 0.087, SRMR = 0.052). Stan-
dardized factor loadings of all variables on the construct
were C0.4. We used the final measurement model as the
comparison for construction of the initial conceptual model.
Relationship between environmental factors
and participation
Starting with the initial model (Fig. 1), we constructed
paths from Social Attitudinal Barriers, Physical Environ-
mental Barriers, and Information and Technology Access
to Participation, as well as from Systems, Services, and
Policies to Social Attitudinal Barriers, Physical Environ-
mental Barriers, and Information and Technology Access.
Covariance paths were included between Social Attitudinal
Barriers and Physical Environmental Barriers, Social
Attitudinal Barriers and Information and Technology
Access, as well as Physical Environmental Barriers and
Information and Technology Access. Although the initial
model exhibited marginal good fit (CFI = 0.922,
TLI = 0.893, RMSEA = 0.087, SRMR = 0.052), a Chi
square difference between the initial conceptual and final
measurement models was statistically significant
(Dv2 = 4.104, p = 0.047) indicating that the initial con-
ceptual model did not provide a good fit with the data. We
made post hoc model modifications, and the final concep-
tual model is shown in Fig. 2.
Table 4 shows the fit indices and Table 5 shows the
standardized factor loadings of indicator variables in the
final model. We made two revisions to improve model fit:
(1) removing a direct path from Information and Tech-
nology Access to Participation, and (2) removing the
covariance path between Social Attitudinal Barriers and
Information and Technology Access due to lack of statis-
tical significance of the parameters. The RMSEA value of
0.085 closely approached the acceptable threshold, and the
CFI (0.923), TLI (0.898), and SRMR (0.053) were within
acceptable limits. Coefficients of all paths were C0.4 and
statistically significant (p\ 0.001); modification indices
did not suggest further changes. The R2 values showed that
63% of the variance in participation, 51% of Social Atti-
tudinal Barriers, 27% of Physical Environmental Barriers,
and 62% of Access to Information and Technology were
explained by the final model.
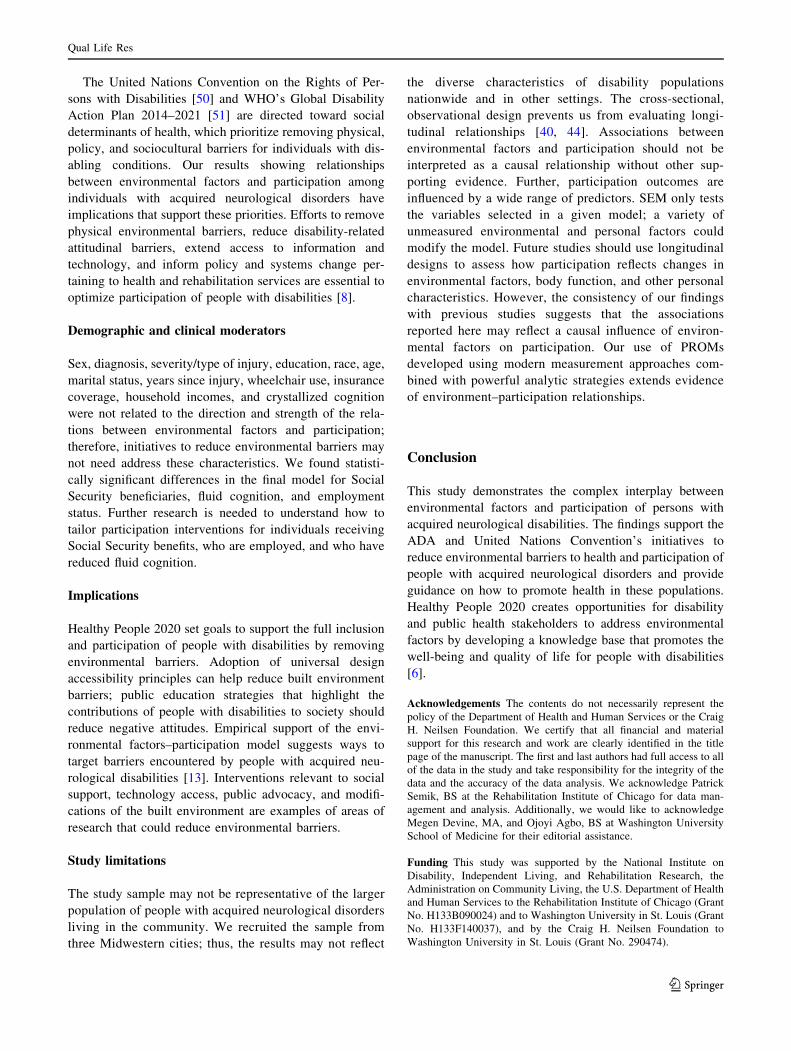
Testing demographic and clinical moderators
The final model was invariant across gender and educa-
tion, suggesting that the final model is valid for women
and men, and people with high and low education
(Table 6). Measurement and path models were invariant
across TBI severity (mild vs. moderate/severe) and SCI
type (tetraplegia vs. hemiplegia). Measurement model
structure differed by diagnosis, time since injury, eth-
nicity, age, marital status, wheelchair use, insurance
coverage, personal and household incomes, and crystal-
lized cognition. After accounting for the measurement
model variation, the path structure did not differ, indi-
cating that the path relationships between environmental
factors and participation in the final model are valid
regardless of primary disability (stroke, TBI and SCI);
time since injury (B4 vs.[4 years); race (white vs. non-
white participants); age (\40, 41–60, and[60 years);
marital status (married vs. not married); wheelchair use
(vs. ambulator); insurance coverage (Medicare and Med-
icaid beneficiaries vs. non-beneficiaries); personal income
(\$35,000 vs. C$35,000 annually); household income
(\$35,000 vs. C$35,000 annually); and crystallized cog-
nition (standardized t score C40 vs.\40).
Measurement and path structures differed by Social
Security beneficiary and current employment status. After
accounting for the measurement model variation, we
observed a weaker relationship between Systems, Services,
and Policies and Social Attitudinal Barriers for those
receiving Social Security benefits (-0.676) compared with
those not receiving benefits (-0.797). The relationship
between Social Attitudinal Barriers and Participation was
slightly stronger for those who were unemployed (-0.457)
than those who were employed (-0.403). There was no
relationship between Physical Environmental Barriers and
Information and Technology Access for those who were
employed (p = 0.577). Finally, there was no relationship
between Physical Environmental Barriers and Participation
for people with fluid cognition scores below a T score of 40
(p = 0.976).
Qual Life Res
123
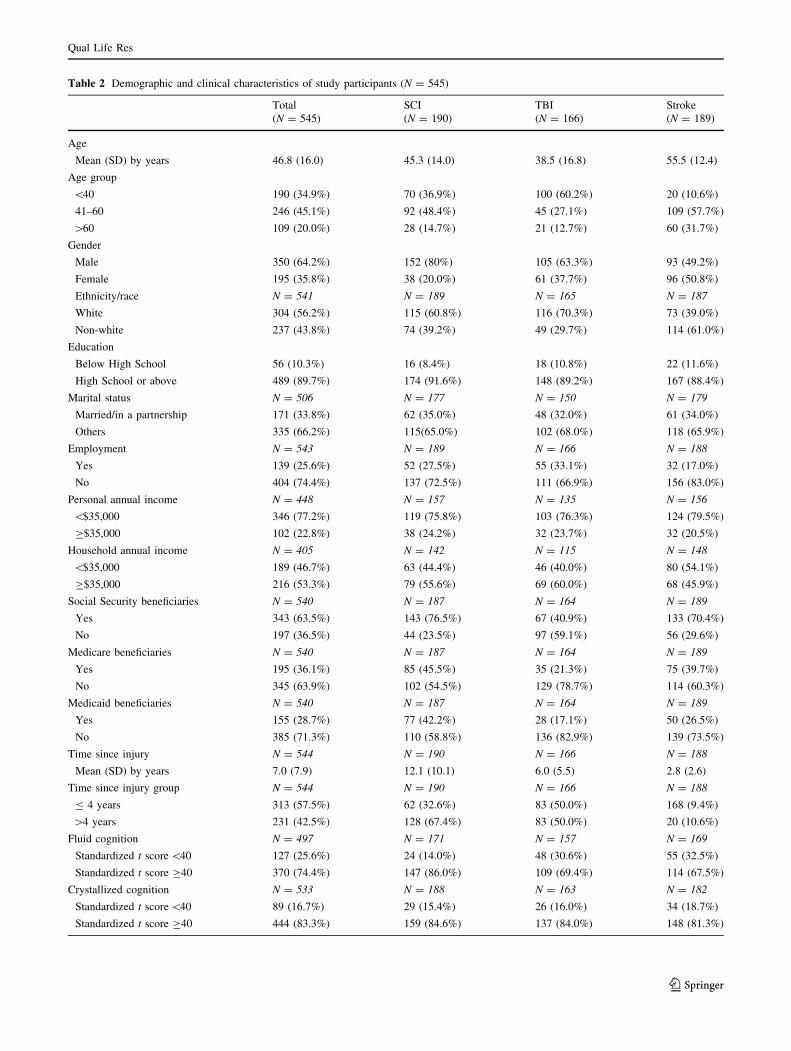
Table 2 Demographic and clinical characteristics of study participants (N = 545)
Total SCI TBI Stroke
(N = 545) (N = 190) (N = 166) (N = 189)
Age
Mean (SD) by years 46.8 (16.0) 45.3 (14.0) 38.5 (16.8) 55.5 (12.4)
Age group
\40 190 (34.9%) 70 (36.9%) 100 (60.2%) 20 (10.6%)
41–60 246 (45.1%) 92 (48.4%) 45 (27.1%) 109 (57.7%)
[60 109 (20.0%) 28 (14.7%) 21 (12.7%) 60 (31.7%)
Gender
Male 350 (64.2%) 152 (80%) 105 (63.3%) 93 (49.2%)
Female 195 (35.8%) 38 (20.0%) 61 (37.7%) 96 (50.8%)
Ethnicity/race N = 541 N = 189 N = 165 N = 187
White 304 (56.2%) 115 (60.8%) 116 (70.3%) 73 (39.0%)
Non-white 237 (43.8%) 74 (39.2%) 49 (29.7%) 114 (61.0%)
Education
Below High School 56 (10.3%) 16 (8.4%) 18 (10.8%) 22 (11.6%)
High School or above 489 (89.7%) 174 (91.6%) 148 (89.2%) 167 (88.4%)
Marital status N = 506 N = 177 N = 150 N = 179
Married/in a partnership 171 (33.8%) 62 (35.0%) 48 (32.0%) 61 (34.0%)
Others 335 (66.2%) 115(65.0%) 102 (68.0%) 118 (65.9%)
Employment N = 543 N = 189 N = 166 N = 188
Yes 139 (25.6%) 52 (27.5%) 55 (33.1%) 32 (17.0%)
No 404 (74.4%) 137 (72.5%) 111 (66.9%) 156 (83.0%)
Personal annual income N = 448 N = 157 N = 135 N = 156
\$35,000 346 (77.2%) 119 (75.8%) 103 (76.3%) 124 (79.5%)
C$35,000 102 (22.8%) 38 (24.2%) 32 (23.7%) 32 (20.5%)
Household annual income N = 405 N = 142 N = 115 N = 148
\$35,000 189 (46.7%) 63 (44.4%) 46 (40.0%) 80 (54.1%)
C$35,000 216 (53.3%) 79 (55.6%) 69 (60.0%) 68 (45.9%)
Social Security beneficiaries N = 540 N = 187 N = 164 N = 189
Yes 343 (63.5%) 143 (76.5%) 67 (40.9%) 133 (70.4%)
No 197 (36.5%) 44 (23.5%) 97 (59.1%) 56 (29.6%)
Medicare beneficiaries N = 540 N = 187 N = 164 N = 189
Yes 195 (36.1%) 85 (45.5%) 35 (21.3%) 75 (39.7%)
No 345 (63.9%) 102 (54.5%) 129 (78.7%) 114 (60.3%)
Medicaid beneficiaries N = 540 N = 187 N = 164 N = 189
Yes 155 (28.7%) 77 (42.2%) 28 (17.1%) 50 (26.5%)
No 385 (71.3%) 110 (58.8%) 136 (82.9%) 139 (73.5%)
Time since injury N = 544 N = 190 N = 166 N = 188
Mean (SD) by years 7.0 (7.9) 12.1 (10.1) 6.0 (5.5) 2.8 (2.6)
Time since injury group N = 544 N = 190 N = 166 N = 188
B 4 years 313 (57.5%) 62 (32.6%) 83 (50.0%) 168 (9.4%)
[4 years 231 (42.5%) 128 (67.4%) 83 (50.0%) 20 (10.6%)
Fluid cognition N = 497 N = 171 N = 157 N = 169
Standardized t score\40 127 (25.6%) 24 (14.0%) 48 (30.6%) 55 (32.5%)
Standardized t score C40 370 (74.4%) 147 (86.0%) 109 (69.4%) 114 (67.5%)
Crystallized cognition N = 533 N = 188 N = 163 N = 182
Standardized t score\40 89 (16.7%) 29 (15.4%) 26 (16.0%) 34 (18.7%)
Standardized t score C40 444 (83.3%) 159 (84.6%) 137 (84.0%) 148 (81.3%)
Qual Life Res
123
Discussion
Relationships between environmental factors
and participation
We developed and tested models to describe relationships
between environmental factors and participation for com-
munity-dwelling adults with TBI, stroke, and SCI. The
final model demonstrates adequate fit statistics and a
parsimonious solution. It extends our understanding of the
relationship between environmental factors and participa-
tion in adults with mobility impairments [22]. Our results
provide support for social disability model [18] and social
determinants of health [19] which describe participation
and health outcomes as being influenced by physical,
social, and policy factors in the micro-to-macro-environ-
ments. Specifically, we found that Information and Tech-
nology Access, the physical environment, social attitudes,
Table 2 continued
Total SCI TBI Stroke
(N = 545) (N = 190) (N = 166) (N = 189)
Wheelchair usage N = 543 N = 190 N = 166 N = 187
Wheelchair user 235 (43.3%) 166 (87.4%) 16 (9.6%) 53 (28.3%)
Ambulator 308 (56.7%) 24 (12.6%) 150 (90.4%) 134 (71.7%)
Table 3 Indicators in the initial and final measurement models
Measurement model Initial indicators Final indicators
Participation CPI—Control over Participation CPI—Control over Participation
CPI—Importance of Participation PROMIS—Satisfaction with Participation in SRA
PROMIS—Satisfaction with Participation in SRA PROMIS—Ability to Participate in SRA
PROMIS—Ability to Participate in SRA PROMIS—Social Isolation
PROMIS—Social Isolation
Systems, Services, and Policies EFIB—Systems, Services and Policies’ Health
domain
EFIB—Systems, Services and Policies’ Health
domain
EFIB—Systems, Services and Policies’ Living
domain
EFIB—Systems, Services and Policies’ Living
domain
EFIB—Systems, Services and Policies’ Community
domain
EFIB—Systems, Services and Policies’ Community
domain
CHIEF—Services domain
CHIEF—Policies domain
Social Attitudinal Barriers EFIB—Social Environment’s Social Facilitators
domain
EFIB—Social Environment’s Social Facilitators
domain
EFIB—Social Environment’s Social Barriers domain EFIB—Social Environment’s Social Barriers domain
CHIEF—Attitudes domain CHIEF—Attitudes domain
HACE—Attitudes domain
Physical Environmental
Barriers
EFIB—Build and Natural Environment EFIB—Build and Natural Environment
CHIEF—Physical domain CHIEF—Physical domain
HACE—Home mobility domain
HACE—Community mobility domain
Information and Technology
Access
EFIB—Access to Information and Technology EFIB—Access to Information and Technology
HACE—Transportation domain
HACE—Mobility Devices domain
HACE—Communication Devices domain
CPI Community Participation Indicators; EFIB Environmental Factors Item Banks; PROMIS Patient-Reported Outcomes Measurement Infor-
mation System; CHIEF Craig Hospital Inventory of Environmental Factors; HACE Home and Community Environment: SRA Social Roles and
Activities
Qual Life Res
123
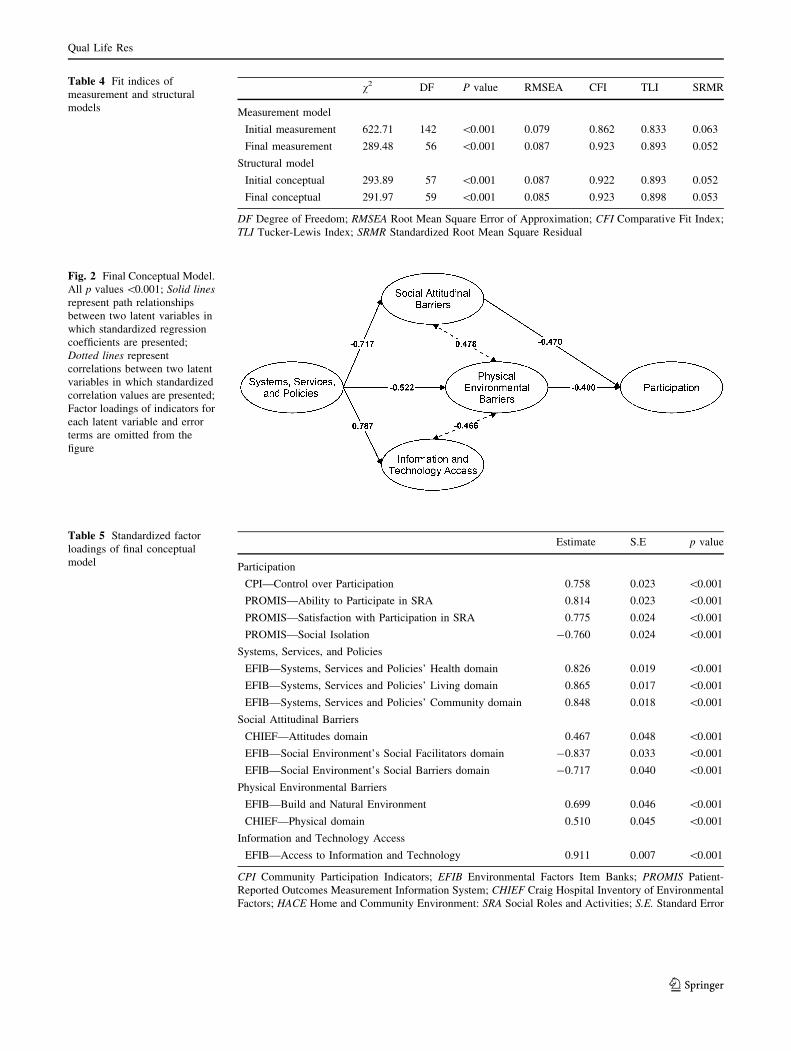
Table 4 Fit indices of
measurement and structural
models
v2 DF P value RMSEA CFI TLI SRMR
Measurement model
Initial measurement 622.71 142 \0.001 0.079 0.862 0.833 0.063
Final measurement 289.48 56 \0.001 0.087 0.923 0.893 0.052
Structural model
Initial conceptual 293.89 57 \0.001 0.087 0.922 0.893 0.052
Final conceptual 291.97 59 \0.001 0.085 0.923 0.898 0.053
DF Degree of Freedom; RMSEA Root Mean Square Error of Approximation; CFI Comparative Fit Index;
TLI Tucker-Lewis Index; SRMR Standardized Root Mean Square Residual
Fig. 2 Final Conceptual Model.
All p values\0.001; Solid lines
represent path relationships
between two latent variables in
which standardized regression
coefficients are presented;
Dotted lines represent
correlations between two latent
variables in which standardized
correlation values are presented;
Factor loadings of indicators for
each latent variable and error
terms are omitted from the
figure
Table 5 Standardized factor
loadings of final conceptual
model
Estimate S.E p value
Participation
CPI—Control over Participation 0.758 0.023 \0.001
PROMIS—Ability to Participate in SRA 0.814 0.023 \0.001
PROMIS—Satisfaction with Participation in SRA 0.775 0.024 \0.001
PROMIS—Social Isolation -0.760 0.024 \0.001
Systems, Services, and Policies
EFIB—Systems, Services and Policies’ Health domain 0.826 0.019 \0.001
EFIB—Systems, Services and Policies’ Living domain 0.865 0.017 \0.001
EFIB—Systems, Services and Policies’ Community domain 0.848 0.018 \0.001
Social Attitudinal Barriers
CHIEF—Attitudes domain 0.467 0.048 \0.001
EFIB—Social Environment’s Social Facilitators domain -0.837 0.033 \0.001
EFIB—Social Environment’s Social Barriers domain -0.717 0.040 \0.001
Physical Environmental Barriers
EFIB—Build and Natural Environment 0.699 0.046 \0.001
CHIEF—Physical domain 0.510 0.045 \0.001
Information and Technology Access
EFIB—Access to Information and Technology 0.911 0.007 \0.001
CPI Community Participation Indicators; EFIB Environmental Factors Item Banks; PROMIS Patient-
Reported Outcomes Measurement Information System; CHIEF Craig Hospital Inventory of Environmental
Factors; HACE Home and Community Environment: SRA Social Roles and Activities; S.E. Standard Error
Qual Life Res
123
and systems support have direct and indirect influences on
participation in community activities. The model accoun-
ted for 63% of the variation in participation indicators.
We found that social environment barriers are associated
with reduced participation. The relationship between social
attitudes and participation is consistent with previous
research, suggesting that barriers created by social attitudes
negatively affect participation in education, employment,
health care, and the public realm for people with disabilities
[47]. Conversely, the availability of a social network pro-
vides many kinds of support and promotes social partici-
pation and community engagement. Social roles in familial,
occupational, and community settings are reinforced
through opportunities for engagement, which in turn pro-
vide a sense of connection, belonging, and attachment [48].
Limited access to information and technology was
associated with greater barriers in the physical environ-
ment, which in turn had a direct influence on reduced
participation. Previous studies have supported the hypoth-
esis that inaccessible built environments create barriers to
participation in major life activities [49]. Technology such
as cell phones, computers, web platforms, and internet
services enhances access to information that reduces bar-
riers in the physical environment and may enhance par-
ticipation opportunities. For examples, many web
platforms such as the Access Earth, Accomable, and
Google Maps data on accessible buildings and locations to
help people with disabilities participate.
We found that perceived adequacy of systems, services,
and policies has an indirect influence on participation. This
relationship is mediated by social and physical environ-
mental factors. Systems and services can affect participa-
tion at home, in the community and at work [10]. Physical
barriers that affect persons with an acquired neurological
disorder include inaccessible entryways, bathrooms, and
transportation systems. Attitudinal barriers include nega-
tive beliefs about disability and negative reactions to
people with disabilities. Social attitudes and interactions
are tied to participation choice and control, and ultimately
to the inclusion of people with disabilities in society [16].
These findings support civil rights initiatives that seek to
enhance participation opportunities by developing policy
and systems change strategies to reduce physical and social
environment barriers.
Table 6 Group invariance testing of final conceptual model
Grouping variable Metric invariancea Scalar invariancea Residual invariancea Path invariancea
Gender (male vs. female) 0.228 0.315 0.933 0.289
Education (Below High School vs. High School or above) 0.421 0.149 0.343 0.164
Race (white vs. non-white) 0.609 <0.001 <0.001 0.913
Age (\40 vs. 41–60 years) 0.025 <0.001 0.002 0.597
Age (\40 vs.[60 years) 0.094 <0.001 0.044 0.227
Age (41–60 vs.[60 years) 0.008 <0.001 0.465 0.320
Diagnosis (SCI vs. TBI) 0.009 <0.001 0.019 0.165
Diagnosis (SCI vs. stroke) 0.016 0.013 0.046 0.066
Diagnosis (TBI vs. stroke) 0.021 <0.001 0.183 0.407
Marital status (married/in a partnership vs. others) 0.120 0.002 0.914 0.782
Social Security benefit (yes vs. no) 0.383 <0.001 0.009 0.028
Time since injury (B4 vs.[4 years) 0.655 0.047 0.032 0.211
Wheelchair use (vs. ambulator) 0.161 <0.001 0.001 0.075
Medicare beneficiaries (yes vs. no) 0.980 0.032 0.306 0.639
Medicaid beneficiaries (yes vs. no) 0.261 0.084 0.019 0.819
Fluid cognition (standardized t score C40 vs.\40) <0.001 0.002 <0.001 0.021
Crystallized cognition (standardized t score C40 vs.\40) 0.893 0.040 0.085 0.409
Employment status (employed vs. unemployed) <0.001 <0.001 0.034 0.023
Personal income (\$35,000 vs. C$35,000 annually) 0.493 0.327 0.021 0.725
Household income (\$35,000 vs. C$35,000 annually) 0.618 0.004 0.001 0.943
TBI severity (mild vs. moderate/severe) 0.315 0.245 0.443 0.153
SCI severity (paraplegia vs. tetraplegia) 0.806 0.256 0.942 0.400
a Statistically significant parameters are bold; only p values were reported, parameters tested and estimates could be shared upon request.
Invariance of stroke severity was not tested as the residual variance for Environmental Factors Item Banks (EFIB)—Social Environment’s Social
Facilitators domain was found to be negative (estimate = -1.607) for the mild stroke subgroup and close to zero (estimate = 0.045) for the
moderate stroke subgroup
Qual Life Res
123
The United Nations Convention on the Rights of Per-
sons with Disabilities [50] and WHO’s Global Disability
Action Plan 2014–2021 [51] are directed toward social
determinants of health, which prioritize removing physical,
policy, and sociocultural barriers for individuals with dis-
abling conditions. Our results showing relationships
between environmental factors and participation among
individuals with acquired neurological disorders have
implications that support these priorities. Efforts to remove
physical environmental barriers, reduce disability-related
attitudinal barriers, extend access to information and
technology, and inform policy and systems change per-
taining to health and rehabilitation services are essential to
optimize participation of people with disabilities [8].
Demographic and clinical moderators
Sex, diagnosis, severity/type of injury, education, race, age,
marital status, years since injury, wheelchair use, insurance
coverage, household incomes, and crystallized cognition
were not related to the direction and strength of the rela-
tions between environmental factors and participation;
therefore, initiatives to reduce environmental barriers may
not need address these characteristics. We found statisti-
cally significant differences in the final model for Social
Security beneficiaries, fluid cognition, and employment
status. Further research is needed to understand how to
tailor participation interventions for individuals receiving
Social Security benefits, who are employed, and who have
reduced fluid cognition.
Implications
Healthy People 2020 set goals to support the full inclusion
and participation of people with disabilities by removing
environmental barriers. Adoption of universal design
accessibility principles can help reduce built environment
barriers; public education strategies that highlight the
contributions of people with disabilities to society should
reduce negative attitudes. Empirical support of the envi-
ronmental factors–participation model suggests ways to
target barriers encountered by people with acquired neu-
rological disabilities [13]. Interventions relevant to social
support, technology access, public advocacy, and modifi-
cations of the built environment are examples of areas of
research that could reduce environmental barriers.
Study limitations
The study sample may not be representative of the larger
population of people with acquired neurological disorders
living in the community. We recruited the sample from
three Midwestern cities; thus, the results may not reflect
the diverse characteristics of disability populations
nationwide and in other settings. The cross-sectional,
observational design prevents us from evaluating longi-
tudinal relationships [40, 44]. Associations between
environmental factors and participation should not be
interpreted as a causal relationship without other sup-
porting evidence. Further, participation outcomes are
influenced by a wide range of predictors. SEM only tests
the variables selected in a given model; a variety of
unmeasured environmental and personal factors could
modify the model. Future studies should use longitudinal
designs to assess how participation reflects changes in
environmental factors, body function, and other personal
characteristics. However, the consistency of our findings
with previous studies suggests that the associations
reported here may reflect a causal influence of environ-
mental factors on participation. Our use of PROMs
developed using modern measurement approaches com-
bined with powerful analytic strategies extends evidence
of environment–participation relationships.
Conclusion
This study demonstrates the complex interplay between
environmental factors and participation of persons with
acquired neurological disabilities. The findings support the
ADA and United Nations Convention’s initiatives to
reduce environmental barriers to health and participation of
people with acquired neurological disorders and provide
guidance on how to promote health in these populations.
Healthy People 2020 creates opportunities for disability
and public health stakeholders to address environmental
factors by developing a knowledge base that promotes the
well-being and quality of life for people with disabilities
[6].
Acknowledgements The contents do not necessarily represent the
policy of the Department of Health and Human Services or the Craig
H. Neilsen Foundation. We certify that all financial and material
support for this research and work are clearly identified in the title
page of the manuscript. The first and last authors had full access to all
of the data in the study and take responsibility for the integrity of the
data and the accuracy of the data analysis. We acknowledge Patrick
Semik, BS at the Rehabilitation Institute of Chicago for data man-
agement and analysis. Additionally, we would like to acknowledge
Megen Devine, MA, and Ojoyi Agbo, BS at Washington University
School of Medicine for their editorial assistance.
Funding This study was supported by the National Institute on
Disability, Independent Living, and Rehabilitation Research, the
Administration on Community Living, the U.S. Department of Health
and Human Services to the Rehabilitation Institute of Chicago (Grant
No. H133B090024) and to Washington University in St. Louis (Grant
No. H133F140037), and by the Craig H. Neilsen Foundation to
Washington University in St. Louis (Grant No. 290474).
Qual Life Res
123
Compliance with ethical standards
Conflict of Interest All authors declare that they have no conflict of
interest.
Ethical approval All procedures performed in studies involving
human participants were in accordance with the ethical standards of
the institutional and/or national research committee and with the 1964
Helsinki declaration and its later amendments or comparable ethical
standards.
Informed consent Informed consent was obtained from all individ-
ual participants included in the study.
References
1. Courtney-Long, E. A., Carroll, D. D., Zhang, Q. C., Stevens, A.
C., Griffin-Blake, S., Armour, B. S., et al. (2015). Prevalence of
disability and disability type among adults—United States, 2013.
Morbidity and Mortality Weekly Report (MMWR), 64(29),
777–783.
2. World Health Organization (2006). Neurological disorders:
public health challenges. http://www.who.int/mental_health/neu
rology/neurological_disorders_report_web.pdf. Accessed April 8
2017.
3. Centers for Disease Control and Prevention (2017). National
Center for Health Statistics. https://www.cdc.gov/nchs/fastats/
stroke.htm. Accessed April 8 2017.
4. Taylor, C. A., Bell, J. M., Breidling, M. J., & Xu, L. (2017).
Traumatic Brain Injury-Related Emergency Department Visits,
Hospitalizations, and Deaths—United States, 2007 and 2013.
MMWR Surveillance Summaries, 66, 1–16.
5. National Spinal Cord Injury Statistical Center (2016). Facts and
figures at a glance. https://www.nscisc.uab.edu/Public/Facts%
202016.pdf. Accessed April 8 2017.
6. Office of Disease Prevention and Health Promotion (2014).
Healthy People 2020. https://www.healthypeople.gov/2020/
topics-objectives/topic/disability-and-health. Accessed December
30 2015.
7. National Council on Disability (2015). As the U.S. Celebrates
25th Anniversary of the Americans with Disabilities Act,
National Council on Disability Issues Annual Progress Report.
https://www.ncd.gov/newsroom/us-celebrates-25th-anniversary-
americans-disabilities-act-national-council-disability. Accessed
January 18 2015.
8. Gostin, L. O. (2015). The Americans with Disabilities Act at 25:
The highest expression of American values. JAMA, 313(22),
2231–2235.
9. World Health Organization. (2001). International Classification
of Functioning, Disability and Health-ICF. Geneva: World
Health Organization.
10. Hammel, J., Magasi, S., Heinemann, A., Whiteneck, G., Bogner,
J., & Rodriguez, E. (2008). What does participation mean? An
insider perspective from people with disabilities. Disability and
Rehabilitation, 30(19), 1445–1460.
11. Field, M. J., & Jette, A. (2007). The future of disability in
America. Washington, DC: National Academies Press.
12. Hammel, J., Magasi, S., Heinemann, A., Gray, D. B., Stark, S.,
Kisala, P., et al. (2015). Environmental barriers and supports to
everyday participation: a qualitative insider perspective from
people with disabilities. Archives of Physical Medicine and
Rehabilitation, 96(4), 578–588.
13. Magasi, S., Wong, A., Gray, D. B., Hammel, J., Baum, C., Wang,
C.-C., et al. (2015). Theoretical foundations for the measurement
of environmental factors and their impact on participation among
people with disabilities. Archives of Physical Medicine and
Rehabilitation, 96(4), 569–577.
14. Heinemann, A. W., Magasi, S., Hammel, J., Carlozzi, N. E.,
Garcia, S. F., Hahn, E. A., et al. (2015). Environmental factors
item development for persons with stroke, traumatic brain injury
and spinal cord injury. Archives of Physical Medicine and
Rehabilitation, 96(4), 589–595.
15. Stiens, S. A., Kirshblum, S. C., Groah, S. L., McKinley, W. O., &
Gittler, M. S. (2002). 4. Optimal participation in life after spinal
cord injury: Physical, psychosocial, and economic reintegration
into the environment. Archives of Physical Medicine and Reha-
bilitation, 83, S72–S81.
16. Hammel, J., Jones, R., Gossett, A., & Morgan, E. (2006).
Examining barriers and supports to community living and par-
ticipation after a stroke from a participatory action research
approach. Topics in Stroke Rehabilitation, 13(3), 43–58.
17. Whiteneck, G. G., Gerhart, K. A., & Cusick, C. P. (2004).
Identifying environmental factors that influence the outcomes of
people with traumatic brain injury. The Journal of head trauma
rehabilitation, 19(3), 191–204.
18. Bronfenbrenner, U. (1999). Environments in developmental
perspective: Theoretical and operational models. In S. L. Fried-
man & T. D. Wachs (Eds.), Measuring environment across the
life span: Emerging methods and concepts (pp. 3–28). Wash-
ington, DC: American Psychology Association Press.
19. Schulz, A., & Northridge, M. E. (2004). Social determinants of
health: implications for environmental health promotion. Health
Education & Behavior, 31(4), 455–471.
20. Lai, J.-S., Hammel, J., Jerousek, S., Goldsmith, A., Miskovic, A.,
Baum, C., et al. (2016). An Item Bank to Measure Systems,
Services, and Policies: Environmental Factors Affecting People
with Disabilities. Archives of Physical Medicine and Rehabili-
tation, 97, 2102–2112.
21. Bricout, J. C., & Gray, D. B. (2006). Community receptivity: The
ecology of disabled persons’ participation in the physical, polit-
ical and social environments. Scandinavian Journal of Disability
Research, 8(1), 1–21.
22. Hollingsworth, H., & Gray, D. B. (2010). Structural equation
modeling of the relationships between participation in leisure
activities and community environments by people with mobility
impairments. Archives of Physical Medicine and Rehabilitation,
91(8), 1174–1181.
23. Heinemann, A. W., Miskovic, A., Semik, P., Wong, A., Dashner,
J., Baum, C., et al. (2016). Measuring environmental factors:
Unique and overlapping International Classification Functioning,
Disability and Health coverage of 5 instruments. Archives of
Physical Medicine and Rehabilitation, 97(12), 2113–2122.
24. Williams, D. H., Levin, H. S., & Eisenberg, H. M. (1990). Mild
head injury classification. Neurosurgery, 27(3), 422–428.
25. Traumatic Brain Injury Model Systems National Data Center
(2006). Traumatic Brain Injury Model Systems National Data
Base Inclusion Criteria.
26. Kirshblum, S. C., Burns, S. P., Biering-Sorensen, F., Donovan,
W., Graves, D. E., Jha, A., et al. (2011). International standards
for neurological classification of spinal cord injury (revised
2011). The Journal of Spinal Cord Medicine, 34(6), 535–546.
27. Van Swieten, J., Koudstaal, P., Visser, M., Schouten, H., & Van
Gijn, J. (1988). Interobserver agreement for the assessment of
handicap in stroke patients. Stroke, 19(5), 604–607.
28. Bailey, I. L., & Lovie, J. E. (1976). New design principles for
visual acuity letter charts. American journal of optometry and
physiological optics, 53(11), 740–745.
Qual Life Res
123
29. Wilkinson, G. S., & Robertson, G. (2006). Wide Range
Achievement Test (WRAT4). Lutz, FL: Psychological Assessment
Resources.
30. Enderby, P. M., Wood, V. A., Wade, D. T., & Hewer, R. L.
(1986). The Frenchay Aphasia Screening Test: a short, simple test
for aphasia appropriate for non-specialists. Disability and Reha-
bilitation, 8(4), 166–170.
31. Hahn, E. A., DeVellis, R. F., Bode, R. K., Garcia, S. F., Castel, L.
D., Eisen, S. V., et al. (2010). Measuring social health in the
patient-reported outcomes measurement information system
(PROMIS): item bank development and testing. Quality of Life
Research, 19(7), 1035–1044.
32. Heinemann, A. W., Magasi, S., Bode, R. K., Hammel, J.,
Whiteneck, G. G., Bogner, J., et al. (2013). Measuring enfran-
chisement: Importance of and control over participation by peo-
ple with disabilities. Archives of Physical Medicine and
Rehabilitation, 94(11), 2157–2165.
33. Hobart, J. C., Cano, S. J., Zajicek, J. P., & Thompson, A. J.
(2007). Rating scales as outcome measures for clinical trials in
neurology: problems, solutions, and recommendations. The
Lancet Neurology, 6(12), 1094–1105.
34. Whiteneck, G. G., Harrison-Felix, C. L., Mellick, D. C., Brooks,
C., Charlifue, S. B., & Gerhart, K. A. (2004). Quantifying envi-
ronmental factors: a measure of physical, attitudinal, service,
productivity, and policy barriers. Archives of Physical Medicine
and Rehabilitation, 85(8), 1324–1335.
35. Keysor, J., Jette, A., & Haley, S. (2005). Development of the
home and community environment (HACE) instrument. Journal
of Rehabilitation Medicine, 37(1), 37–44.
36. Heinemann, A. W., Lai, J.-S., Wong, A., Dashner, J., Magasi, S.,
Hahn, E. A., et al. (2016). Using the ICF’s environmental factors
framework to develop an item bank measuring built and natural
environmental features affecting persons with disabilities. Qual-
ity of Life Research. doi:10.1007/s11136-016-1314-6.
37. Garcia, S. F., Hahn, E. A., Magasi, S., Lai, J.-S., Semik, P.,
Hammel, J., et al. (2014). Development of self-report measures of
social attitudes that act as environmental barriers and facilitators
for people with disabilities. Archives of Physical Medicine and
Rehabilitation, 96(4), 596–603.
38. Weintraub, S., Dikmen, S. S., Heaton, R. K., Tulsky, D. S.,
Zelazo, P. D., Bauer, P. J., et al. (2013). Cognition assessment
using the NIH Toolbox. Neurology, 80(11 Supplement 3), S54–
S64.
39. Casaletto, K. B., Umlauf, A., Beaumont, J., Gershon, R., Slotkin,
J., Akshoomoff, N., et al. (2015). Demographically corrected
normative standards for the English version of the NIH Toolbox
Cognition Battery. Journal of the International Neuropsycho-
logical Society, 21(05), 378–391.
40. Kline, R. B. (2005). Principles and practice of structural equa-
tion modeling. New York: Guilford Press.
41. Wang, J., & Wang, X. (2012). Structural equation modeling:
Applications using Mplus. West Sussex: Wiley.
42. Browne, M. W., & Cudeck, R. (1993). Alternative ways of
assessing model fit. In K. A. Bollen & J. A. Long (Eds.), Testing
Structural Equation Models (pp. 136–162). Thousand Oaks: Sage
Publications.
43. Hu, L., & Bentler, P. M. (1999). Cutoff criteria for fit indexes in
covariance structure analysis: Conventional criteria versus new
alternatives. Structural Equation Modeling, 6(1), 1–55. doi:10.
1080/10705519909540118.
44. Weston, R., Gore, P. A., Jr., Chan, F., & Catalano, D. (2008). An
introduction to using structural equation models in rehabilitation
psychology. Rehabilitation Psychology, 53(3), 340–356.
45. Anderson, J. C., & Gerbing, D. W. (1988). Structural equation
modeling in practice: A review and recommended two-step
approach. Psychological Bulletin, 103(3), 411–423.
46. Hahn, E. A., Garcia, S. F., Lai, J.-S., Miskovic, A., Jerousek, S.,
Semik, P., et al. (2016). Measuring Access to Information and
Technology: Environmental Factors Affecting Persons With
Neurologic Disorders. Archives of Physical Medicine and Reha-
bilitation, 97(8), 1284–1294.
47. Iezzoni, L. I., & Freedman, V. A. (2008). Turning the disability
tide: the importance of definitions. JAMA, 299(3), 332–334.
48. Berkman, L. F., & Glass, T. (2000). Social integration, social
networks, social support, and health. In L. F. Berkman & I.
Kawachi (Eds.), Social epidemiology (Vol. 1, pp. 137–173). New
York: Oxford University Press.
49. Gray, J. A., Zimmerman, J. L., & Rimmer, J. H. (2012). Built
environment instruments for walkability, bikeability, and recre-
ation: Disability and universal design relevant? Disability and
Health Journal, 5(2), 87–101.
50. Lawson, A. (2006). United Nations Convention on the Rights of
Persons with Disabilities: New Era or False Dawn? Syracuse
Journal of International Law and Commerce, 34, 563–619.
51. World Health Organization. (2014). WHO global disability action
plan 2014–2021: better health for all people with disability.
Geneva: World Health Organization.
Qual Life Res
123