relationships between lexical processing speed, language
TRANSCRIPT

Relationships between Lexical Processing Speed, Language Skills, and Autistic Traits in Children
A Thesis
Submitted to the Faculty
of
Drexel University
by
Erin Abrigo
in partial fulfillment of the
requirements for the degree
of
Doctor of Philosophy
February 2012

ii
Table of Contents
List of Tables ..................................................................................................................... iiiList of Figures .................................................................................................................... ivAbstract ............................................................................................................................... vChapter 1: Introduction ....................................................................................................... 1Chapter 2: Background ....................................................................................................... 5
2.1 Spoken Word Recognition........................................................................................ 52.2 Speech Perception in Noise ...................................................................................... 82.3 Eye Tracking Methodology ...................................................................................... 92.4 Autism and the Broader Autism Phenotype............................................................ 112.5 Language Functioning in Autism............................................................................ 112.6 Social Interest in Speech and Voice perception in Autism..................................... 13
Chapter 3: Statement Of Problem and Current Project..................................................... 16Chapter 4: The Spoken Lexical Processing Assessment ................................................. 18
4.1 Assessment Procedure ............................................................................................ 184.2 Assessment Experimental Design.......................................................................... 194.3 Assessment Creation............................................................................................... 20
Chapter 5: Methods........................................................................................................... 255.1 Participants.............................................................................................................. 255.2 Measures ................................................................................................................. 265.3 Procedure ................................................................................................................ 30
Chapter 6. Results: Young Adults ................................................................................... 316.1 Description of Sample............................................................................................. 316.2 Data Analysis .......................................................................................................... 32
Chapter 7. Results: Children ............................................................................................. 367.1 Description of Sample............................................................................................. 367.2 Data Analysis .......................................................................................................... 37
Chapter 8: Discussion ....................................................................................................... 428.1 Review of Results and Limitations ......................................................................... 428.2 Conclusions, Implications, and Future Directions.................................................. 53
References......................................................................................................................... 63Appendix A: Linear Mixed Models in Young Adults .................................................... 100Appendix B: Linear Mixed Models in Children ............................................................. 103
Vita.................................................................................................................................. 105

iii
List of Tables 1. Summary Scores for Intelligence and Language Measures in Young Adults ............. 722. Reaction Time Results for the Lexical Processing Assessment in Young Adults....... 733. Intercorrelations Between Intelligence and Language Variables in Young Adults..... 744. Summary Scores for Intelligence, Language and Social Skills Data in Children ....... 755. Reaction Time Results for the Lexical Processing Assessment in Children ............... 766. Intercorrelations Between Intelligence and Language Variables in Children ............. 777. Intercorrelations Between Social Responsivenes Scale Variables in Children ........... 78

iv
List of Figures
Figure 1. Representation of Assessment Interface.......................................................... 79Figure 2. Assessment Design Schematic ........................................................................ 80Figure 3. Selection of Noun Stimuli ................................................................................ 81Figure 4. LPA Response Time in Young Adults (Cohort Competition Trials) ............... 82Figure 5. LPA Response Time in Young Adults ............................................................. 83Figure 6. Visual Representation of Outliers in Intelligence and Language Measures..... 84Figure 7. LPA Response Time in Children (Cohort Competition Trials)........................ 86Figure 8. Visual Representation of Removed Outlier in Verbal Comprehension Index .. 87Figure 9. The Relationship Between Lexical Processing Speed and Working Memory in Children ........................................................................................................................ 88Figure 10. The Relationship Between Lexical Processing Speed and Language Composite in Children ...................................................................................................... 89Figure 11. The Relationship Between Lexical Processing Speed and Synonyms in Children............................................................................................................................. 90Figure 12. The Relationship Between Lexical Processing Speed and Sentence Completion in Children..................................................................................................... 91Figure 13. The Relationship Between Lexical Processing Speed and Grammatical Morphemes in Children .................................................................................................... 92Figure 14. The Relationship Between Lexical Processing Speed and Nonliteral Language in Children........................................................................................................ 93Figure 15. The Relationship Between Lexical Processing Speed and Autistic Symptomology in Children............................................................................................... 94Figure 16. The Relationship Between Lexical Processing Speed and Social Awareness in Children...................................................................................................... 95Figure 18. The Relationship Between Lexical Processing Speed and Social Motivation in Children...................................................................................................... 97Figure 20. The Relationship Between Lexical Processing Speed and Social Cognition in Children ........................................................................................................................ 99

v
Abstract Relationships between Lexical Processing Speed, Language Skills, and Autistic Traits in Children
ErinAbrigoFeliciaHurewitz,Ph.D.
According to current models of spoken word recognition listeners understand
speech as it unfolds over time. Eye tracking provides a non-invasive, on-line method
to monitor attention, providing insight into the processing of spoken language. In the
current project a spoken lexical processing assessment (LPA) confirmed current
theories of spoken word recognition and investigated relationships between speed of
lexical processing and intelligence, language skills and autism related traits.
Participants were thirty-five young adult university students and thirty-five
children between the ages of 7 years and 11 years 11 months. Lexical processing was
assessed through the LPA, which measures the latency of eye fixation to images
representing target nouns and was implemented on a Tobii T60 Eye Tracker. In
addition, adults were administered the Wechsler Abbreviated Scale of Intelligence
(WASI), the WMI index taken from the Wechsler Adult Intelligence Scale (WAIS-
IV), and selected subtests from the Comprehensive Assessment of Spoken Language
(CASL). Child participants were administered the Wechsler Intelligence Scale for
Children - Fourth Edition (WISC-IV), and selected CASL subtests. Adult guardians
of child participants completed the Social Responsiveness Scale (SRS) as it related to
the participant. It was hypothesized that since auditory input is a primary mechanism
by which children encounter language and are exposed to information during

vi
development, efficiency of lexical processing may act as a gatekeeper to the
development of these skills.
Results from the Lexical Processing assessment are consistent with
predictions based on the cohort model of speech perception. Relationships between
lexical processing speed, working memory, intelligence and linguistic skills were not
evident in young adults. However in children, who are actively developing cognitive
skills, we see clear relationships between speed of lexical processing and working
memory, linguistic skills including vocabulary knowledge, syntax, and non-literal
language comprehension, and traits related to the autism phenotype. The results of
the current project indicate promise for the use of the lexical processing assessment
not only in continued processing speed and autism-related research, but also point to
potential utility in terms of early identification of children at risk for difficulty with
language acquisition and deficits in social interaction.

1
Chapter 1: Introduction Eye tracking methodology has been used extensively to study spoken language
processing, starting with a pioneering study showing that eye movements are closely
time-locked to the occurrence of spoken words that refer to those objects (Cooper,
1974). Eye tracking has also been used to study the effect of word-frequency on
spoken word recognition (Dahan, Magnuson, & Tanenhaus, 2001) although the
methodology has not yet been used in the investigation of individual differences in
language processing.
At the same time, tests of language processing that are currently in use have
important limitations as a result of design, calling into question the validity of such
tests. These tests of language processing are confounded by the inclusion of the
measurement of skills in domains outside of language processing. For example, the
Speed and Capacity of Language Processing (SCOLP) assessment is essentially a
reading test, automatically confounding language processing with reading ability.
Additionally, tests of processing speed, like the Coding and Symbol Search subtests
of the Weschler assessments, are often confounded by motor requirements, and are
sensitive to both motivation and to difficulty working under timed conditions.
Because widely used measures of information processing are limited by these
confounds, the creation of a pure processing speed assessment, enabling the
characterization of lexical processing speed in individuals, would be a valuable tool
in the clinical setting. Processing speed can be conceptualized as a measure of

2
efficiency in performing basic cognitive operations and can affect performance on
intelligence tests indirectly, by allowing working memory to be used more efficiently.
In other words, depending on the efficiency of processing, information may be lost,
affecting both success on tasks and the amount of information that can be
successfully encoded. Processing speed may also affect performance on intelligence
tests directly, for example, by speeding retrieval of task relevant material from long-
term memory (Kail, 2000).
Research has demonstrated a positive relationship between the speed with
which individuals can perform different cognitive processes and the scores they earn
on various measures of intelligence (Jensen, 1998; Kail & Salthouse, 1994; Lally &
Nettelbeck, 1977; Vernon, 1983). The relationship between processing speed and
intelligence from one viewpoint, namely a prototypic multifactor view of intelligence
(Carroll, 1993) includes processing speed, along with memory and inductive
reasoning, as separate and independent factors contributing to intelligence. However,
research supports the claim that processing speed is causally linked to other elements
of intelligence. In this view, it’s suggested that cognitive development can be
conceptualized as a cascade where age related changes in processing speed lead to
changes in working memory, which in turn, lead to changes in performance on tests
of fluid intelligence (Kail & Salthouse, 1994).
Support for the hypothesis that rapid processing enhances memory which, in
turn, enhances reasoning was reported in a study that found that almost half of a
reported age-related increase in reasoning ability was mediated by developmental
changes in processing speed and working memory (Fry & Hale, 1996). Even when

3
age-related differences in speed, working memory, and fluid intelligence were
statistically controlled, individual differences in speed had a direct effect on working
memory capacity, which was a direct determinant of individual differences in
inductive reasoning (Fry & Hale, 1996).
In addition to its affect on intelligence, processing speed may be related to
language ability, as basic lexical processing ability is necessary for the understanding
of speech. Individuals who have slowed lexical processing may be at increased risk
for language difficulties. Insight into the influence of processing speed on
comprehension can be found in the literature on reading speed and comprehension.
Literature on the study of reading suggests that slow reading is associated with poor
comprehension. Faster readers tend to have better comprehension over what is read,
and tend to be more proficient readers (Carver, 1990; Pinnell, 1995). This may be
accounted or by capacity of working memory, a human processing system that
provides temporary storage and manipulation of the information necessary for
complex cognitive tasks (Baddeley, 1992). A slower reader is likely to understand
less because working memory becomes taxed in an effort to hold onto previously read
material until the end of a sentence or passage. A slow reader is more likely to forget
content before reaching the end of a page or even sentence, because of the burden the
slow pace of reading is placing on working memory, making it impossible to integrate
words and phrases into coherent representations. The phonological loop, a component
of working memory, which stores and rehearses speech based information (Baddeley,
1992), may be implicated in a similar process affecting comprehension of spoken
language. Namely, an individual with slowed lexical processing may not have

4
sufficient working memory capacity to hold on to information from the beginning of
a spoken sentence until the completion of the sentence, and as a result, may fail to
understand spoken language in some instances.
Here, we have designed and piloted a language based processing speed
assessment, which is an ecologically valid method to determine individual differences
in lexical processing. It’s commonly known that the orienting of attention is usually
accompanied by a shift in eye gaze toward the object of our attention. Despite
evidence, collected after extended training and in the laboratory setting, that attention
can be shifted even when the eyes remain fixed (Posner, 1980), in real world
environments eye gaze naturally shifts indicating the allocation of attention. Since
early eye tracking research tells us that referents are fixated on in close temporal
proximity to when they are heard (Cooper, 1974), an assessment measuring fixation
to target after a word is presented is a natural task, appropriate even for individuals
who may have difficulty understanding complex task instructions often required for
less natural tasks. This assessment takes advantage of the fact that eye fixation serves
as the window into the focus of one’s attention. Further, the task successfully
divorces information processing measures from reading and motor ability, skills that
generally confound results, especially in special populations. Performance on the
task may provide insight into an individual’s language processing abilities, as lexical
processing is essential language comprehension. It may also provide insight into
intelligence as it’s been suggested that one of the most meaningful ways to
conceptualize mental capacity is in terms of an individual’s processing speed (Kail &
Salthouse, 1994).

5
Chapter 2: Background
2.1 Spoken Word Recognition Marslen-Wilson (Marslen-Wilson, 1987) suggests that the process of spoken
word recognition includes the three basic functions of access, selection, and
integration. The access function is said to be concerned with the relationship of the
incoming sensory input to the recognition process and includes the mapping of speech
signals onto the representations of word-forms in the mental lexicon. The selection
function discriminates word forms accessed form sensory input and selects the word-
form that matches the available input best. Finally, the integration function is said to
be concerned with the relationship of the recognition process to the higher-level
representation of the utterance.
Current models of spoken word recognition are consistent with the idea that
listeners evaluate speech as it unfolds, with speech input being compared to an
activated set of lexical candidates. The cohort model of spoken word recognition
(Marslen-Wilson, 1987; Marslen-Wilson & Welsh, 1978) suggests that the onset of a
word activates a set of lexical candidates, or words that share the initial portion of the
acoustic-phonetic input with that word. The set of candidate words sharing the initial
acoustic-phonetic input comprise a cohort, and words in the cohort compete for
recognition. As additional acoustic-phonetic input is received competitors that are
not consistent with those speech sounds drop out of competition until only one item,
the word to be recognized, remains. For example when the acoustic-phonetic input
/bee/ is presented initially as a speaker pronounces the word BEAKER, cohort
competitors BEAKER, BEETLE, BEET, BEAVER, BEACH, among others, compete

6
with each other for recognition. As the additional input /k/ is received competitors
drop out and eventually, in this case, BEAKER is selected.
This model was revised, however, with the accumulation of evidence
supporting the effect of word-frequency on spoken word recognition. Marslen-
Wilson (1987) examined lexical decision latencies for word pairs like STREET and
STREAK, where the recognition point for both words was the word-final stop-
consonant. This design allowed reaction time to be measured form comparable points
in the two words, namely, the release of the final stop. Comparing decision latencies
for high frequency words with a mean frequency of 130 per million to low frequency
words with a mean frequency of 3 per million, an advantage was found for high
frequency words. In an experiment using the gating paradigm (Grosjean, 1980),
where listeners hear successively larger fragments of target words and indicate, after
each fragment, which word they think is being presented, an effect of frequency on
spoken word recognition was confirmed. Words that participants named were
categorized by frequency and it was found that subjects produced more high
frequency words than low frequency words after the presentation of the first and
second gate although the preference for high frequency started to disappear by the
third gate (Tyler, 1984).
While the original cohort model did not consider the effect of word frequency,
the revised cohort model recognizes a transient frequency effect, as there seems to be
a temporary advantage for more frequent words. The revised model still assumes that
all word-forms matching a given input will be accessed by that input and remain
active candidates for selection while a match in the sensory input remains. At the

7
same time it concedes that early in the word, high frequency words will be stronger
candidates than lower-frequency words. The revised model posits that elements are
not simply switched on or off as sensory and contextual information accumulates
leading to the eventual single candidate, but that outcome and timing of the
recognition process reflects the differential levels of activation of successful and
unsuccessful candidates, and the rate at which their respective activation levels are
rising and falling (Marslen-Wilson, 1987).
It’s been suggested that the cohort model may not be able to explain the process
of spoken word recognition when some characteristics of speech in real life
conditions are considered. For example, in continuous speech, word onsets are often
not clearly marked, calling into question the assumption that listeners can reliably
identify the beginning speech sounds of a word (Allopenna, Magnuson, & Tanenhaus,
1998). Additionally, according to the cohort theory, lexical candidates with only a
partial match to the onset of a word will never enter into the candidate set. If the
cohort model is accurate, a special recovery mechanism would be required during
word recognition in noisy environments, which is a typical setting for communication
with speech (Allopenna, et al., 1998).
Another perspective on the process of spoken word recognition, espoused by
the continuous mapping model, accounts for these criticisms of the cohort model.
The continuous mapping model assumes that lexical access takes place continuously
and that the initial portion of a spoken word still exerts a strong influence shortly after
word onset, but also suggests that the set of activated alternatives include words that
do not have the same onset but that may contain overlapping speech sounds later in

8
the word, as in a rhyme (Allopenna, et al., 1998). For example, BEAKER is
predicted to activate SPEAKER, a rhyme, as well as BEETLE, which shares initial
speech sounds. Evidence for continuous mapping comes from an eye-tracking study
where eye-movements were tracked as subjects were asked to move objects. It was
reported that latency and accuracy of eye movements to a target object are affected by
the presence of both objects with overlapping initial phonemes, or cohort competitors,
and objects that rhyme with the target (Allopenna, et al., 1998). For example, after
the instruction “Pick up the candle,” eye movement to a candle is slower in the
presence of CANDY and HANDLE.
2.2 Speech Perception in Noise Although most of our understanding of spoken word recognition comes from
studies conducted in noise free environments, everyday verbal communication often
takes place in the presence of interfering noise. Fortunately, human speech
processing systems generally enable communication in unfavorable but common
listening situations such as in a noisy restaurant or at a cocktail party. Typically
developing individuals with normal hearing commonly use the presence of temporal
and spectral dips present in background sounds to enhance intelligibility of speech
sounds (Cooke, 2006; Meddis & Hewitt, 1992; Miller & Licklider, 1950). In a
process called ‘dip listening’ individuals take advantage of rapid fluctuations in level
of background sounds, and ‘glimpse’ speech signal during times when the signal-to-
noise ratio is relatively high (temporal dips) (Miller & Licklider, 1950). They also
take advantage of the fact that spectrum of target speech is often different from
background speech, leaving some frequencies of the target speech unmasked by the

9
competing speech and resulting in high signal-to-noise ratio in those frequencies
(spectral dips) (Meddis & Hewitt, 1992).
2.3 Eye Tracking Methodology Eye tracking methodology is widely used in the study of spoken word
recognition. Eye movements are closely time-locked to the occurrence of spoken
words that refer to those objects (Cooper, 1974; Tanenhaus, Spivey-Knowlton,
Eberhard, & Sedivy, 1995). As a result, eye gaze is often considered a measure of
attention. We naturally move our eyes, and focus on a particular area of a visual field,
in order to see that portion of the field with fine resolution. At the same time, we
divert our attention to that point and focus our concentration on the object or region
of interest. It’s been suggested that if we can track a person’s eye movements, we can
follow the path of that person’s attention (Duchowski, 2007).
In fact, a field of research is based on the premise that even pre-verbal children
spontaneously direct their attention to events that match what they are hearing. When
infants are presented with different images on each of two screens and are
simultaneously presented with auditory material, the direction of their gaze gives
meaningful information about their language comprehension abilities. This is the
basis of the intermodal preferential looking paradigm (IPLP) (Golinkoff, 1987),
which was adapted from the work of Spelke (1976), for use in assessing early
language comprehension. A classic example of the paradigm comes from in an
experiment using IPLP to study noun comprehension. When a picture of a boat
appeared on one screen while a picture of a shoe appeared on the other, and infants
heard “Where’s the shoe? Find the shoe!” infants looked more quickly and longer

10
toward the screen displaying the shoe than the screen displaying the boat (Golinkoff,
1987). The IPLP, which has been used extensively (Golinkoff, 1987; Hollich, et al.,
2000; Meints, Plunkett, Harris, & Dimmock, 2002; Reznick, 1990) takes advantage of
a response already in the repertoire of infants, visual fixation, to glean information
about language comprehension during a task that even infants do naturally.
A similar, and well known, method for the study of spoken word
comprehension using eye tracking is the “visual world” paradigm, where participants
follow instructions to look, at, pick up, or move one of a set of objects presented in a
well defined visual workspace (Tanenhaus & Spivey-Knowlton, 1996). In this
paradigm, timing and pattern of fixations to potential referents in the visual display
are used to draw inferences about comprehension (Tanenhaus, Magnuson, Dahan, &
Chambers, 2000). Eye tracking lends itself to the study of spoken word
comprehension because it offers direct, objective and quantitative observation of
behavior. The estimated time required for an individual to program a saccade is
200ms (Hallett, 1986). Using this information, in addition to total latency of fixation
to targets, eye-tracking provides a non-intrusive, on-line measure of how
comprehension unfolds overtime, and of how it is influenced by the information
provided by visual context, and enables the study of comprehension as it occurs in
natural contexts (Eberhard, Spivey-Knowlton, Sedivy, & Tanenhaus, 1995).
Eye tracking technology along with the visual world paradigm is an ideal
package for use in a lexical processing assessment. Since individuals naturally fixate
on referents in the environment when they are mentioned, eye-tracking provides a
continuous on-line measure of comprehension independent of spoken or manual

11
response (Cooper, 1974; Tanenhaus, et al., 1995), and enables the quantification of
the latency of lexical processing. The ecological validity of the measure adds to its
strength and lends itself to use in populations with developmental disorders, given the
minimal need for task instructions.
2.4 Autism and the Broader Autism Phenotype According to diagnostic criteria developed by the American Psychiatric
Association, Autistic disorder is diagnosed based on abnormal or impaired
development in the domains of social interaction, communication, and restricted
activities and interests (2000). Diagnosis of the disorder is warranted when an
individual meets DSM-IV criteria in each one of the triad of domains. However,
current conceptualizations of autistic disorder subscribe to the concept of the broader
autism phenotype, which purports that autism-related traits are continuously
distributed in the population, independent of the diagnostic status of individuals.
Research on families where one or more members have been diagnosed with the
disorder point to a genetic component (Muhle, Trentacoste, & Rapin, 2004; Szatmari,
Jones, Zwaigenbaum, & MacLean, 1998) and suggest that autistic disorder may
represent extreme cases of deficits in social and communicative functioning that are
continuously distributed in nature. In this way, the field is moving away from the
conceptualization of autism as the presence or absence of diagnosis, and instead is
looking at autistic symptomology as characteristics that are present to greater or lesser
degrees in all people.
2.5 Language Functioning in Autism Language deficits are often considered a hallmark of autism disorder, as many

12
children who receive the diagnosis have a history of delay or failure to develop
spoken language. Although language deficits specifically are not a required criterion
for diagnosis of autism spectrum disorders, problems with language have become
central to our conceptualization of the disorder as they are often the first presenting
symptoms (Kurita, 1985; Lord & Paul, 1997), and have been shown to be the most
important feature for the prediction of the prognosis and developmental course of the
disorder (Rutter, 1970; Venter, Lord, & Schopler, 1992).
Language functioning in autism is variable. While twenty-five percent of all
children with autism never develop functional language capabilities (Klinger, Dawson,
& Renner, 2002), other children diagnosed with autism have vocabulary, grammatical
knowledge and articulation skills within the normal range of functioning (Lord &
Paul, 1997). In a comprehensive study of language profiles in children with autism,
the heterogeneity of language abilities were explored using a broad range of language
measures including measures of articulation skills, receptive and expressive
vocabulary, nonsense word repetition, and higher-order receptive and expressive
syntax and semantics (Kjelgaard & Tager-Flusberg, 2001). This study included
children between the ages of four and fourteen who represented a spectrum of IQ
scores and who been diagnosed with autism. The study found a wide range of
performance on each of the language measures, and identified different language
subgroups based on performance on the major language measures administered.
Children were placed into “normal,” “borderline,” or “impaired” language
classifications dependant on whether their scores fell within normal limits, fell more
than one standard deviation below the mean, or fell more than two standard

13
deviations below the mean. About one quarter of the sample scored within the
normal range across all the tests administered and were identified as the normal
subtype, another quarter were identified as borderline, and half the sample were
classified as impaired (Kjelgaard & Tager-Flusberg, 2001).
Additionally, the study found a significant relationship between IQ and
language abilities, indicating that IQ accounts for some of the heterogeneity found in
language in children with autism. At the same time, while the majority of children
classified as having normal language abilities also had IQ scores in the normal range,
some children with normal language earned IQ scores consistent with mental
retardation. Additionally, among those classified as impaired, children with IQ’s in
the normal range and children with mental retardation were represented. This
indicates that language subtypes are not fully determined by IQ (Kjelgaard & Tager-
Flusberg, 2001).
2.6 Social Interest in Speech and Voice perception in Autism The underlying cause of language deficits seen in some individuals with autism
remains unknown. However, data on typically developing children suggest a link
between social interaction and language learning. Specifically, language learning in
typically developing infants may be enhanced by their social interest in speech,
especially speech directed toward them, often called ‘motherese,’ which is
characterized by higher pitch, slower tempo, and exaggerated intonation contours
(Fernald, 1985; Grieser & Kuhl, 1988). Typically developing infants, given a choice,
show a preference for infant directed speech compared to adult directed speech
(Cooper & Aslin, 1990; Fernald, 1985; Glenn & Cunningham, 1983) and it’s been

14
reported that this infant directed speech is beneficial to language learners (Fernald,
1985; Fernald & Kuhl, 1987; Hirsh-Pasek, et al., 1987; Karzon, 1985; Kemler, Hirsh-
Pasek, Jusczyk, & Cassidy, 1989). Specifically, infant directed speech compared to
adult directed speech, has been shown to contain particularly good phonetic
exemplars or sounds that are clearer, longer, and more distinct from one another
(Burnham, Kitamura, & Vollmer-Conna, 2002; Kuhl, et al., 1997). An association
between the clarity of a mothers speech when she talks to her infant and that infant’s
speech perception skills has also been reported (Liu, Kuhl, & Tsao, 2003).
A lack of interest in social communication, particularly speech, is well
documented in autism (Baron-Cohen, Tager-Flusberg, & Cohen, 1993). Toddlers and
preschool children with autism demonstrate deficits in social orienteering, such as the
failure to orient in response to one’s own name (Dawson, Meltzoff, Osterling, Rinaldi,
& Brown, 1998; Dawson, et al., 2004; Osterling & Dawson, 1994; Osterling, Dawson,
& Munson, 2002) and fail to prefer their mothers voices over a recording of many
superimposed voices, unlike typically developing infants (Klin, 1991, 1992). It’s also
been shown that individuals with autism are impaired in naming vocally expressed
emotion (Hobson, Ouston, & Lee, 1989), and matching vocally and facially expressed
emotions (Hobson, Ouston, & Lee, 1988).
Lack of preferential attention to speech and abnormal voice processing in
autism has also been shown with neuroimaging. One fMRI study showed a lack of
activation in voice selective regions of the superior temporal sulcus in response to
vocal sounds but a normal activation pattern to non-vocal sounds in autism (Gervais,
et al., 2004). Another study used event related brain potential (ERP) responses to

15
simple tones, complex tones and vowels to study the sensory and early attentional
processing of sounds in high functioning children with autism compared to typically
developing children. After hearing a series of identical sounds, the occasional
presentation of a deviant sound should elicit a sensory response and an ERP index of
involuntary attentional orienting, the P3a. Sensory processing and speech
discrimination were comparable across groups, however in individuals with autism,
involuntary orienting was affected by the nature of the stimulus, with normal
response to both simple and complex tone changes, but no evidence of a P3a after
vowel changes, indicating lack of involuntary attention switch (Ceponiene, et al.,
2003). These results suggest that in children with autism, impairment in auditory
processing of vowels occurs beyond the stage of sensory processing. Additionally,
exclusive lack of P3a response to vowels suggests a speech sound specific deficit in
attentional orienting.
Evidence for voice related auditory deficits affecting a listener’s ability to
register an auditory change in speech stimulus, has also been described in autism. A
failure to show a significant mismatch negativity (MMN) response to a change in
speech syllables in an oddball sequence has been shown in children in children with
autism compared to controls (Kuhl, Coffey-Corina, Padden, & Dawson, 2005).
Mismatch negativity is an event related potential (ERP) component known to be
elicited by an odd stimulus in a sequence of stimuli regardless of whether an
individual is attending to the stimuli. Interestingly, when children with autism were
divided according to whether or not they showed a preference for child directed
speech, those who did show the preference exhibited a MMN resembling that of

16
typically developing children, while the children who preferred non-speech analog
signals matched acoustically to a child directed speech sample continued to fail to
show the MMN response (Kuhl, et al., 2005).
The results from these studies suggest that individuals with autism seem to
show a lack of interest in speech and abnormal orienteering to socially relevant
auditory information like vocal sounds. In line with this evidence, a hypothesis
regarding language deficits in autism could be that a lack of interest in and attention
to the human voice in some children leads to a dearth of learning opportunities,
ultimately resulting in absent or deficient language acquisition.
Chapter 3: Statement Of Problem and Current Project Eye-tracking is thought of as a measure of attention because of the fact that
we focus our eyes on a portion of a visual field in order attend to it and to examine it
more closely. Additionally, we know that eye movements are closely time-locked to
the occurrence of spoken words that refer to those objects (Cooper, 1974; Tanenhaus,
et al., 1995), indicating that the speed at which we are able to fixate on an item will
be an indication of spoken lexical information processing speed. To the best of our
knowledge, individual differences in eye tracking of auditory information processing
have not been studied.
The development of the Lexical Processing Assessment presented here is
important because currently employed standardized language assessments require
some degree of receptive and expressive language for administration. Because of this,
pre-verbal children and children with language deficits, are often not successfully

17
screened for language difficulty early in development, when intervention services
may be most crucial. Currently, young children must wait until they have developed
enough language skills to be able to complete traditional language testing, or are not
assessed at all if they fail to develop these required skills. With the development of
the current assessment, lexical processing, a basic component of understanding
spoken language, may be assessed in individuals who have not developed
sophisticated receptive or expressive language.
The first aim of this project was the creation of a lexical processing
assessment using eye tracking technology. Although an ideal long-term project goal
is to create age norms across the lifespan, which could be utilized in clinical
assessment, the focus of this dissertation project was a pilot assessment of young
adults between the ages of 18 and 21, and children between the ages of 7 and 11 years
11 months. Using the Lexical Processing Assessment (LPA) lexical processing was
assessed through the measurement of the latency of eye-fixation to pictures
representing target nouns in three conditions including the presence of a cohort
competitor, rhyme competitor, and no competition. There were also three
environmental conditions including no noise, pink noise, and conversational noise.
We were interested in whether lexical processing speed, as measured by our
assessment, is related to intelligence and language functioning in adults and during
child development. We were also interested in whether lexical processing speed is
related to presence of autistic traits in typically developing children. We hypothesize
relationships between lexical processing speed and intelligence, language skills, and
social skills and abilities, with slowed processing acting as the trigger for a cascade
18
responsible for deficits in those domains. If a relationship exists the assessment may
prove useful as a screening tool for intelligence and language functioning in pre-
verbal individuals and others excluded from traditional assessment due to language
skills required.
Chapter 4: The Spoken Lexical Processing Assessment
4.1 Assessment Procedure
The Lexical Processing Assessment (LPA) measures the latency of eye
fixation to pictures representing target nouns using eye-tracking technology. The
assessment was designed and implemented on a Tobii T60 Eye Tracker. The T60 data
rate is 60Hz and the device utilizes a 17” thin film transistor (TFT) screen. On each
trial, four pictures representing simple nouns, each assigned to one quadrant of the
Tobii T60 eye-tracking computer screen, with a fixation cross marking the center of
the screen, were presented. Participants were instructed to fixate on the cross
between trials, and to follow the instructions they heard through headphones. On each
trial, participants heard the verbal instruction “Find the _____.” Participants followed
this instruction by looking at the picture indicated. Each trial was in one of three
conditions: cohort competition, rhyme competition, or no competition. Trials were
also randomized to occur in three environmental background noise conditions: no
noise, pink noise, and background conversation. Figure 1 provides a representation of
the assessment interface. The four images comprising each trial were pre-chosen but
were assigned quadrant positions randomly by the computer on each trial. The order

19
of trials was also randomized. The assessment consists of 90 trials, requiring each
subject to perform ten trials in each of nine trial types.
4.2 Assessment Experimental Design
The Lexical Processing Assessment (LPA) was developed as a 3x3 within-
subjects experimental design. The independent variables are noun competition (no-
competition, cohort competition, rhyme competition) and environmental competition
(no noise, pink noise, conversational noise). The dependent variable is latency of
eye-fixation to target noun.
This 3x3 design is conceptualized to enable the study of three different levels
of processing in each independent variable. The design incorporates 3 levels of
lexical competition in order to test the listener’s resilience to different conditions that
might tax the processing of speech. According to the revised cohort model, nouns that
share initial cohort sounds will have overlapping activation during natural speech
perception (Marslen-Wilson, 1987). The presence of a cohort competitor is the most
taxing level of processing, and is expected to produce a slowdown in a saccade to
target. In the rhyme condition an image representing a noun containing a speech
sound that overlaps with the target in a later section of the word is included as a
distractor item. This is predicted produce a milder competitor effect and associated
slowdown in lexical processing. In the no-competition condition distractor items do
not share initial cohort sounds or rhyming speech sounds with the target. The no-
competition trials represent the purest level of the noun competition trials. The three
noun competition trials are crossed with the three environmental noise conditions.
This design enables us to determine whether there are interactions or additive

20
interference as a result of environmental distractions. Figure 2 provides a schematic
of the assessment design.
4.3 Assessment Creation Noun selection. In order to ensure the assessment was appropriate for use with all
potential users, including very young children, care was taken in choosing nouns to
be included in the measure. Words used as targets and distractors are all common
nouns present in spoken English with at least the frequency of 4 occurrences per
million words. This requirement was verified through the use of the Corpus of
Contemporary American English (COCA) (http://www.americancorpus.org/) or
according to a database created from five spoken language corpora taken from a
longitudinal study (Brown, 1973; Carterette & Jones, 1974; Demetras, Post, & Snow,
1986; Sachs, 1983), archived through the Child Language Data Exchange System
(CHILDES) (MacWhinney, 2000). The COCA, created and maintained by Mark
Davies, Professor of Corpus Linguistics at Brigham Young University, contains more
than 385 million words equally divided among spoken, fiction, popular magazines,
newspapers, and academic texts. The database created from CHILDES, a
computerized database of transcripts from language learners, contains 1,311,864
words. Corpora making up this database can be seen in Figure 3.
Cohort Competitor Trials. Cohort competitor trials consist of a target noun, a
cohort competitor, and two additional distractor nouns. A cohort competitor is
defined as a noun beginning with the same initial phoneme and continuing to contain
overlapping speech sounds with the target for between 100 and 300 ms from word
onset. Distractor nouns do not rhyme with or begin with the same phoneme as either

21
the target or cohort competitor. All four nouns are frequency matched according to
the criteria described below.
Rhyme Competitor Trials. Rhyme competitor trials consist of a target noun and
a rhyme competitor, which rhyme with the target, and two additional distractor nouns.
Distractor nouns do not rhyme with or begin with the same phoneme as either the
target or rhyme competitor. All four nouns are frequency matched according to the
criteria described below.
No Competition Trials. No competition trials consist of pictures representing the
target noun and each of three distracter nouns. The distracter nouns do not rhyme or
begin with the same phoneme as the target nouns. All four nouns are frequency
matched according to the criteria described below.
Frequency Matching. On a given trial, nouns representing all four pictures were
matched for frequency in spoken English. Determination of spoken English
frequency was completed by lemma search and incorporated all members of the
lexeme of each target word, as exposure to these similar words overlaps with
frequency of exposure to the target word. We chose to limit our frequency matching
to the use of spoken word frequency on the basis that young children, a portion of our
target population, will not have been exposed to material in the other formats.
Determination of frequency was completed using spoken English frequency data
compiled in the Corpus of Contemporary American English (COCA) or the five
corpora database created from CHILDES.
To determine frequency based CHILDES corpora selections, a frequency
search on this database using the program CLAN (Computer Language ANalysis) (B

22
MacWhinney, 2000) returned the raw frequency of each token represented. Our
calculation of frequency included words both when they were included as part of
utterances spoken by the child and as utterances directed toward the child. This
method provides a comprehensive sample of use and exposure and represents
familiarity with words. Additionally, inclusion of both child and adult utterances
increases the number of utterance we have to draw from. Raw frequencies were
translated into frequency per million words. The COCA database provides spoken
frequency in terms of frequency per million. The frequency of each word, regardless
of the database of origin, in units of occurrence per million spoken words, was
converted to a LOG scale. This operation transformed our data by squeezing together
the larger values, stretching out the smaller values, and created a scale accounting for
the unequal effect of hearing very infrequent words compared to more frequent words.
Following word frequency conversion to a LOG scale, rules were implemented to
create frequency-matched trials.
Because the eye tracking literature does not support a single method for
matching stimuli for frequency a survey of methods used in previous research served
as a guide to the development of criteria that ensures close frequency match within
the limitation imposed by the practically of creating a large number of word pairs. In
one study designed to examine the frequency effects of eye fixation latency, Dahan
and colleagues (Dahan, et al., 2001) created cohort pairs, where one word was
deemed to be High Frequency, and one was deemed to be Low Frequency. In this
study frequency was determined according to Francis and Kucera (Francis, 1982).
The high frequency stimuli had an average occurrence of 138 times per million (LOG

23
= 2.14), and the low frequency stimuli had an average occurrence of 10 times per
million (LOG = 1). After a LOG transformation the difference score is 1.14,
indicating this margin of difference makes word frequency sufficiently different in
the view of these authors.
In another study designed to evaluate the effect of word frequency on word
recognition performance, Allen et al. (Allen, Smith, Lien, Weber, & Madden, 1997)
used words from four levels of word frequency, where frequency was determined by
occurrence in the Kucera and Francis (Kucera, 1967) norms. Very high frequency
words had an occurrence rate of 240-1,016, medium high frequency words had an
occurrence rate of 151-235, low frequency words had an occurrence rate of 40-54,
and very low frequency words had an occurrence rate of 1-5 (Allen, et al., 1997).
Criteria for choosing these ranges were not indicated in the manuscript. We
translated these ranges to LOG frequencies, and determined the difference scores for
each category to get an indication of a range of LOG frequency of words considered
to match according to the standards used by Allen et al. LOG Frequency ranges for
very high frequency words, high frequency words, low frequency words, and very
low frequency words were .63, .19, .13 and .7 respectively.
On the basis of this review, we determined a LOG frequency difference cut-
off score of .6 will discriminate a frequency matched pair from a pair that differs on
frequency in spoken English. This cut-off score is well below the 1.4 difference score
between the averages of high and low frequency words used by Dahan et al. (Dahan,
et al., 2001), and is close to the difference score representing the range for high
frequency and very low frequency words according to Allen (Allen, et al., 1997). We

24
reason that if Allen’s medium high frequency and low frequency categories were
collapsed to create three categories –high frequency, medium frequency, and low
frequency, our .6 cut off, deemed to signify frequency matching, would be more strict
than all three of his LOG frequency ranges .63, .78, and .7.
To create frequency matched pairs and trials, we created difference scores
from candidate cohort and rhyming word pairs, and retained pairs whose difference
score is .6 or below. After cohort pairs and rhyme pairs were identified, distracter
nouns were added, using the same frequency rule so that the difference score between
the LOG of the highest and lowest word in the four word set was no greater than the
pre-determined cut-off of .6.
Picture Stimuli Selection. 360 pictures [4 pictures x 30 trials x 3 conditions]
were selected from either Nova Development Corporation’s Art Explosion –Photo
Objects 150,000, from images in the public domain obtained through the wikimedia
commons database, or taken by the investigator or research assistants using a digital
camera.
In order to ensure the images selected to represent target words are
prototypical representations of those words, all images were rated by three individuals
in a norming exercise. Volunteers viewed each picture individually on a computer
screen and were asked to rate the images in response to the question “How good a
representation of a ______ is this picture? ” A likert scale, ranging from 1 indicating a
poor representation of the noun to 5, representing an ideal prototypical image
representing the noun, was used. All images included in the LPA were rated no lower
than a three on the likert scale on any occasion.

25
In an additional measure to ensure that pictures are identifiable as the nouns
they were intended to represent, the assessment introduces pictures to users by
naming them. Each picture is introduced to subjects in random order prior to each
trial. As each noun is presented auditorily, a box appears framing the image
representing it. Eye fixation on the image is required to trigger the introduction of the
next item.
Chapter 5: Methods
5.1 Participants
Thirty-five young-adult Drexel University undergraduate students were
recruited from the Drexel community through the Psychology 101 research subject
pool. The online research opportunity listing provided a basic description of the
study, eligibility criteria, and instructions for volunteering. Eligible participants were
native English speakers between the ages of 18 and 21. Exclusion criteria included
the report of less than normal or corrected normal vision, or hearing impairment.
Prospective participants were invited to the Developmental Lab at Drexel University,
where eligibility criteria were reviewed and informed consent was completed prior to
the study session.
A total of thirty-five children were recruited through partnerships with St.
Cyprian, St. Gabriel, and St. Mary’s Interparochial School, three private Catholic
Schools in the city of Philadelphia. Recruiting took place through letters home to
parents/guardians, followed by open house or back to school night at each school
where guardians were introduced to the study, given the opportunity to ask questions,

26
and finally, were guided through the informed consent process. As part of the
informed consent process eligibility criteria were reviewed. Children who, according
to guardian report, had less than normal or corrected normal vision, or hearing
impairment were excluded. Children who, according to guardian report, spoke a
language other than English in the home, or who acquired English as a second
language, were also excluded. After guardian consent was obtained at a school
meeting, school administrators scheduled study sessions for each participating child
during school hours. Prior to the study session, each child completed an assent
process and agreed to participate.
5.2 Measures Lexical Processing. The spoken lexical processing assessment described in
chapter four was administered.
Intelligence. The Wechsler Abbreviated Scale of Intelligence (WASI) was used to
evaluate general intelligence in the young adult sample. The WASI is comprised of 4
subtests and yields three IQ scores including Verbal, Performance and Full Scale IQ
(Weschler, 2002). The WASI was developed for individuals from age 6 to 89:11
years.
The Wechsler Intelligence Scale for Children - Fourth Edition (WISC-IV) was
used to evaluate general intelligence in the child sample. The WISC-IV is comprised
of 10 core subtests representing intellectual functioning in cognitive areas including
verbal comprehension (VCI), perceptual reasoning (PRI), processing speed (PSI), and
working memory (WMI), which make up a composite representing general

27
intellectual ability or full scale IQ (FSIQ) (Wechsler, 2003). The WISC-IV was
developed for children age 6 to 16:11 years.
Language. Selected subtests from the Comprehensive Assessment of Spoken
Language (CASL) were used to evaluate language skills in both the young adult and
child samples. The CASL, a norm referenced oral language assessment, whose
subtests can be administered and scored individually, was designed for individuals
from ages 3 to 21 (Carrow-Woolfolk, 1999). The CASL was standardized using a
nationally representative sample of 1,700 individuals between the ages of 3 and 21
years with and without disabilities. Internal reliability for the CASL subtests was
reported within a range of .78 to .90 in our selected subtests, indicating high
homogeneity among items in each of the tests (Carrow-Woolfolk, 1999).
CASL Subtests were selected to measure knowledge and performance in
Semantic, Syntactic, and Supralinguistic language domains. Subtests were also
chosen with consideration to the availability of norms in our target age populations.
Semantic language was measured with the Synonyms and Sentence
Completion subtests of the CASL. The synonyms subtest assesses lexical knowledge
by looking at the examinee’s ability to identify a synonym for a given word from
multiple choices. In this test, the examiner reads a target word followed by four
additional words. The examinee selects an answer choice that she believes is the
closest, in meaning, to the target word. The sentence completion subtest, a test of
semantic integration, measures the ability to retrieve and express one of a few
appropriate words that complete the end of a presented sentence meaningfully, and in

28
a form grammatically appropriate to the stimulus sentence. The sentence completion
task requires word knowledge, syntax comprehension, recall, and expression.
Syntactic aspects of language, or the knowledge and use of morphology and
syntax, was measured in young adults and children with the CASL subtest
Grammatical Morphemes. The Grammatical Morphemes subtest measures the
knowledge of the form and meaning of grammatical morphemes and includes verb
and noun modulators, prepositions, articles, possessives, pronouns and derivational
suffixes. The test is structured in the form of analogies. For example, the examiner
will present “bed is to beds as dress is to _____.”
Linguistic competence, where sophistication beyond individual word
comprehension, and use of vocabulary and syntax is required, will also be assessed.
The Non-Literal Language subtest of the CASL assesses the ability to comprehend
the intended meaning of utterances in cases where non-literal interpretation is
required and includes cases of figurative speech, indirect requests and sarcasm. In
this subtest, a sentence containing a non-literal expression is read aloud by the
examiner, and the examinee is instructed to respond by explaining what is meant.
Autistic Symptomology. The Social Responsiveness Scale (SRS), a 65-item
questionnaire, which includes items related to aspects of interpersonal behavior,
communication and repetitive/stereotypic behavior that are characteristic of autism
spectrum disorders, was used as a measure of autistic symptomology in the child
sample. At the time of the consent to participate in the study, a parent of each child
participant completed the SRS with respect to their child.

29
This measure was chosen for use in the current study because, in line with
current research on the disorder, this instrument conceptualizes autism as a spectrum
condition rather than an all-or-nothing diagnosis. The SRS provides a metric to
compare a child’s behavior to established norms in order to identify where an
individual falls within the entire range of behavior that exists in the general
population (Constantino & Gruber, 2005). As such, the SRS offers a method of
characterizing autistic traits, along a natural continuum, even in a typically
developing population. The SRS, through report of a caretaker who knows the child
well, assess the severity of symptoms of autism as they occur in the natural social
setting and generates a single score which serves as an index of severity of social
deficits (Constantino, et al., 2003).
The composition of the SRS also provides scores for five subscales based on
parental responses to items belonging to five categories of behavioral observations.
Social Awareness targets the child’s ability to pick up on social cues, while the Social
Cognition subscale assesses a child’s ability to interpret those social cues after they
have been picked up. The Social Communication subscale addresses expressive
social communication displayed by the child. The Social Motivation subscale targets
motivation for engagement in social-interpersonal behavior. Finally, the Autistic
Mannerisms subscale includes items used to identify stereotypical behaviors or highly
restricted interests characteristics that may be displayed by the child (Constantino &
Gruber, 2005).
In terms of its use as valid measure of autistic symptomology, the SRS has
been reported to compare favorably with the Autism Diagnostic Interview –Revised

30
(ADI-R), the current gold standard for the assessment of autism, with correlation
coefficients greater than .64 between SRS scores and all algorithm scores for DSM-
IV criterion sets generated by the ADI-R (Constantino & Davis, 2003). This
relationship, along with it’s documented inter-rater reliability on the order of .8,
makes the SRS a valid quantitative measure of autistic traits (Constantino & Davis,
2003).
5.3 Procedure Eligible prospective young adult participants, after registering online to
participate in exchange for credit in Psychology 101, were invited to the
Developmental Lab at Drexel University to participate in the study. Each child was
tested at her respective partnering Philadelphia Catholic School, following parental
informed consent and assent procedures.
In a single study session, young adult participants were administered the
Lexical Processing Assessment, WASI, WAIS-IV WMI, and selected CASL subtests.
Child participants, in three separate study sessions, were administered the Lexical
Processing Assessment, WISC-IV, and selected CASL subtests. A parent or guardian
completed the SRS at the time of informed consent. All testing administration was
conducted either by the study coordinator or a trained research assistant.
All digital LPA assessment data and standardized testing was de-identified
through the exclusive use of subject number and was stored under lock and key and
on a password-protected computer in our research lab at Drexel University. Only
authorized personnel viewed data, for the purposes of scoring assessments and data
analysis.

31
Chapter 6. Results: Young Adults
6.1 Description of Sample Demographic Characteristics, Intelligence and Language Functioning.Thirty-
five young adult Drexel University students participated in this study. Approximately
fifty-four percent of the sample was female while approximately forty-six percent
was male. Table 1 describes the results of the intelligence and language measures
administered as part of the study. The summary table includes Full Scale IQ as well
as Performance IQ and Verbal IQ indices, WAIS-IV Working Memory Index, a
language composite calculated as the mean of administered CASL subtests, and
individual CASL subtest scores.
LPA Assessment. Young adults earned a mean reaction time of 740.51 (SD =
276.05) on the Lexical Processing Assessment. When collapsed over Environmental
Condition, the mean reaction time in the Cohort Condition for the levels Cohort,
None, and Rhyme were 818.60 (SD = 289.66), 734.34 (SD = 270.38), and 669.27
(SD = 246.32) respectively. The mean reaction times in the Environmental Condition,
when collapsed over Cohort Condition, for the levels Conversation, None, and Pink
were 731.86 (SD = 249.70), 740.97 (SD = 287.21), and 748.65 (SD = 289.36)
respectively. Table 2 describes the results of the Lexical Processing Assessment for
all conditions. Values represent latency of fixation to target in milliseconds.
Missing Data. Of the thirty-five young adult participants in the study, three were
discovered to be outside of the age range required for standardized testing norms.
These three participants were not administered standardized WASI, WAIS IV, or
CASL assessments. An additional two subjects were not administered the WAIS-IV

32
Working Memory Index due to experimenter error. All thirty-five participants
participated in the lexical processing assessment. Thirty young adults (86%)
completed the all study tasks.
6.2 Data Analysis
Prior to analysis, reaction time data collected on the lexical processing
assessment were cleaned in order to ensure that outliers, that occurred as a result of
either fixation on target prior to trial onset or clear track loss, were not included in
analysis. Because research in psychophysics supports the notion that the
programming of a saccade is initiated about 200 ms prior to its launch (Matin, Shao,
& Boff, 1993), all data points representing target fixation in fewer that 150
milliseconds were discarded. This provides assurance that data points representing
fixation latencies that were the result of saccades initiated prior to the onset of a trial
are not included in analysis. Data points representing target fixation over 2500
milliseconds were also discarded, as they indicate track loss. A total of 152 out of
3150 observations or about 4.8 percent of assessment trials fell outside the 150 to
2500 milliseconds range and were discarded prior to analysis.
Two additional adjustments to data were made prior to analysis. Preliminary
observation of reaction time data through a histogram revealed a positively skewed
distribution. As a result, to normalize the distribution, reaction time data was
submitted to a natural log transformation, which is recommended and used widely in
the field of psycholingistics (Lenzner, Kaczmirek & Lezner, 2010; Ratcliff, 1993).
Additionally, in order to test the relationship between a broadly inclusive
conceptualization of the language domain, a language composite variable was created.

33
Language composite was calculated as the mean of the scores earned on the four
CASL subtests Synonyms, Sentence Completion, Grammatical Morphemes, and
Non-literal Language.
Data analysis was conducted using the open source statistical programming
environment R (R Core Design Team, 2010). Analysis used linear mixed-effects
modeling, and utilized restricted maximum likelihood estimation (REML; Baayen, et
al., 2008), via the lme4 statistical package (Bates, 2007) within R. Preliminary model
testing concluded that random effects subject ID (subject), slide ID (item), and slide
order account for variance in our model, and are therefore included as random effects.
We also wished to account for subject bias in speed of processing toward the four
quadrants of the screen as it is well known that in western cultures the attentional
trajectory flows from left to right. Research indicates that individuals focus initially
on the left side of a visual field to explore objects such as artwork (Elkind & Weiss,
1967), display stronger inhibition of return when stimuli sequence are in a left to right
trajectory (Spalek & Hammad, 2005), and even maintain an internal imaginary
number line with smaller numbers on the left and larger numbers on the right
(Dehaene, Bossini, & Giraux, 1993). To account for the effect of bias toward the left
side of the screen, we also included target position as an error term in the model. As a
result of significant correlations between variables of interest, analyses were not
conducted in one full model. Intercorrelations for variables of interest can be seen in
Table 3. Additionally, as recent research in sentence processing suggests that the risk
of spurious effects in mixed-effects modeling is reduced by inclusion of interactions
between fixed and random effects (Roland, 2009), this method was employed in
34
supplementary analyses. Mixed-effects models used in analysis can be seen in
Appendix A.
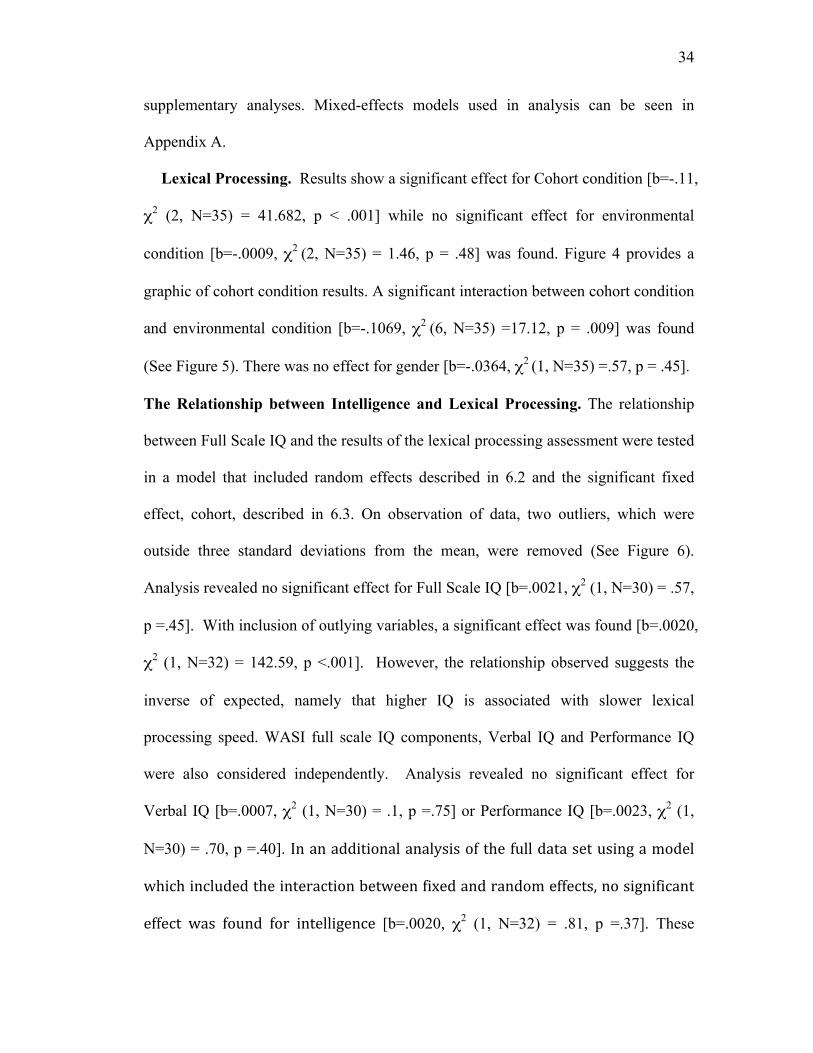
Lexical Processing. Results show a significant effect for Cohort condition [b=-.11,
χ2 (2, N=35) = 41.682, p < .001] while no significant effect for environmental
condition [b=-.0009, χ2 (2, N=35) = 1.46, p = .48] was found. Figure 4 provides a
graphic of cohort condition results. A significant interaction between cohort condition
and environmental condition [b=-.1069, χ2 (6, N=35) =17.12, p = .009] was found
(See Figure 5). There was no effect for gender [b=-.0364, χ2 (1, N=35) =.57, p = .45].
The Relationship between Intelligence and Lexical Processing. The relationship
between Full Scale IQ and the results of the lexical processing assessment were tested
in a model that included random effects described in 6.2 and the significant fixed
effect, cohort, described in 6.3. On observation of data, two outliers, which were
outside three standard deviations from the mean, were removed (See Figure 6).
Analysis revealed no significant effect for Full Scale IQ [b=.0021, χ2 (1, N=30) = .57,
p =.45]. With inclusion of outlying variables, a significant effect was found [b=.0020,
χ2 (1, N=32) = 142.59, p <.001]. However, the relationship observed suggests the
inverse of expected, namely that higher IQ is associated with slower lexical
processing speed. WASI full scale IQ components, Verbal IQ and Performance IQ
were also considered independently. Analysis revealed no significant effect for
Verbal IQ [b=.0007, χ2 (1, N=30) = .1, p =.75] or Performance IQ [b=.0023, χ2 (1,
N=30) = .70, p =.40]. Inanadditionalanalysisofthefulldatasetusingamodel
whichincludedtheinteractionbetweenfixedandrandomeffects,nosignificant
effect was found for intelligence [b=.0020, χ2 (1, N=32) = .81, p =.37]. These

35
consistent results indicate no relationship between intelligence and performance on
the lexical processing assessment in adults.
The Relationship between Working Memory and Lexical Processing. The
relationship between Working Memory and the results of the lexical processing
assessment were tested in a model that included significant random effects described
in 6.2 and the significant fixed effect, cohort, described in 6.3. On observation of data,
one outlier, which was outside three standard deviations of the mean, was removed
(See Figure 6). Analysis revealed no significant effect for working memory [b=.0009,
χ2 (1, N=29) = .20, p =.65].
In an additional analysis using amodel which included the interaction
between fixed and randomeffects, no significant effectwas found forworking
memory [b=.0015, χ2 (1, N=30) = .64, p =.43]. The result of this analysis, which
included the full data set, is consistent with the result following the removal of the
outlier. Our analyses found no relationship between working memory capacity and
performance on the lexical processing assessment.
The Relationship between Language Skills and Lexical Processing. The
relationship between Language skills and the results of the lexical processing
assessmentweretestedinamodelthatincludedrandomeffectsdescribedin6.2
and the fixedeffect, cohort,described in6.3.On observation of data, one outlier,
which was outside three standard deviations of the mean, was removed (See Figure 6).
Analysis revealed no significant effect for language composite [b=.0077, χ2 (1,
N=31) = .2.31, p =.13].

36
The relationship between unique language domains, as measured by CASL
subtests, and lexical processing was also considered. Analysis revealed a significant
effect for semantic integration as measured by CASL subtest Sentence Completion
[b=.0054, χ2 (1, N=31) = 4.11, p < .05]. However, the relationship described by this
model suggested the inverse of the expected relationship, namely that more advanced
semantic integration abilities are associated with slower lexical processing speed.
Analysis revealed no significant effect for semantics/vocabulary knowledge as
measured by CASL subtest Synonyms [b=.0028, χ2 (1, N=31) = .46, p =.5], syntax as
measured by CASL subtest Grammatical Morphemes [b=.0021, χ2 (1, N=31) = .29, p
=.59] or supralinguistic language as measured by CASL subtest Non-literal Language
[b=.0016, χ2 (1, N=31) = .22, p =.64].
In an additional analysis using amodel which included the interaction
between fixedandrandomeffects,nosignificanteffectwas found for language
skills [b=.0034, χ2 (1, N=32) = .76, p =.38]. The result of this analysis, which
included the full data set, is consistent with the result following the removal of the
outlier.
Chapter 7. Results: Children
7.1 Description of Sample Demographic Characteristics, Intelligence, Language Functioning, and
Autistic Symptomology. Thirty-five elementary school children participated in this
study. Approximately fifty-one percent of the sample was female while
approximately forty-nine percent was male. Table 4 describes the results of

37
intelligence, language and autistic symptomology assessments administered as part of
this study. The summary table includes Full Scale IQ as well as component IQ
indices, language Composite along with individual CASL subtest scores, and SRS
scores along with scores for individual SRS component scales.
LPA Assessment. Child participants earned a mean reaction time of 948.17 ms
(SD = 725.06) on the Lexical Processing Assessment. When collapsed over
Environmental Condition, the mean reaction time in the Cohort Condition for the
levels Cohort, None, and Rhyme were 1008.98 (SD = 750.23), 896.38 (SD = 697.59),
and 938.97 (SD = 722.68) respectively. The mean reaction times in the
Environmental Condition, when collapsed over Cohort Condition, for the levels
Conversation, None, and Pink were 946.29 (SD = 756.24), 940.77 (SD = 695.12), and
957.61 (SD = 722.87) respectively. Table 5 describes the results of the Lexical
Processing Assessment for all conditions. Values represent latency of fixation to
target in milliseconds.
Missing Data. Thirty-four of thirty-five child participants (97%) completed all
the study tasks. In one case the CASL subtest non-literal language was discontinued
due to environmental disruption in the school setting. Analysis included all available
data.
7.2 Data Analysis
According to the rational cited in 6.2, reaction time data collected on the
lexical processing assessment in children were cleaned in order to ensure that
observations that occurred as a result of either fixation to target prior to trial onset or
clear track loss were not included in analysis. Data points representing target fixation

38
faster than 100 milliseconds and slower than 6000 milliseconds were discarded.
These cut-off criteria were determined based on visual inspection of histograms and
reflect the slower processing speed of children compared to adults. Using these
criteria, a total of 473 out of 3150 observations or about fifteen percent of assessment
trials were discarded prior to analysis. Because the design of the assessment required
fixation to target prior initiation of a new trial, these discarded trials include instances
of track loss, which are coded as very slow reaction times. Like the adult data,
reaction time data for children were submitted to natural log transformation in order
to correct a positively skewed distribution. Additionally, a language composite was
calculated as the mean of the scores earned on the four CASL subtests prior to
analysis.
Data analysis used linear mixed effects modeling, described in section 6.2.
Consistent with model testing using young adult data, preliminary model testing
concluded that subject ID (subject), slide ID (item) and target position account for
variance in our model and were included in the statistical model as random effects.
Model testing on the child data, unlike on the adult data, did not find an effect of slide
order on performance on the lexical processing assessment. Because there was no
evidence that performance changed during the course of the assessment, slide order
was not included as a random effect in the model. Guided by the knowledge that age
influences development in children, age was included in analyses. As expected, and
consistent with the adult data, correlations among variables were found. As a result,
analyses were not conducted in one full model and instead separate models were

39
created. Correlations for variables of interest can be seen in Tables 6 and 7. Mixed
effects models used in analyses can be viewed in Appendix B.
Lexical Processing. Results show a significant effect for Cohort condition
[b=-.1096, χ2 (2, N=35) = 10.46, p = .005] while no significant effect for either the
environmental condition [b=-.0037, χ2 (2, N=35) = 1.41, p = .49] or the interaction
between cohort condition and environmental condition [b=.1547, χ2 (6, N=35) =11.24,
p = .08] was found. Figure 7 provides a graphic of reaction times in the three cohort
conditions. There was no effect for gender [b=-.0939, χ2 (1, N=35) =1.42, p = .23].
There was also a significant difference in reaction time in young adults and children [t
(4163.78) =-8.11, p < .001].
The Relationship between Intelligence and Lexical Processing. The relationship
between Full Scale IQ and lexical processing speed was tested in a model that
included random effects described in 7.2 and the significant fixed effect, cohort,
described in 7.3. Language Composite was left out of this analysis due to its
correlation [ r(33) = .69, p< .001] with Full Scale IQ (See Table 6). The results do
not show a significant effect for Full Scale IQ [b=-.0039, χ2 (1, N=35) = 2.49, p =.11].
The relationship between stand-alone components of intelligence, as
conceptualized by the Wechsler Intelligence Scale for Children–IV (WISC-IV), and
lexical processing speed were also considered. WISC-IV indices measuring verbal
comprehension (VCI), processing speed (PSI), working memory (WMI), and
perceptual reasoning (PRI) were submitted to linear mixed modeling. No significant
result for PSI [b=-.0012, χ2 (1, N=35) = .14, p =.71], or PRI [b=-.0042, χ2 (1, N=35)
= 2.96, p =.09] were found. An outlier, which was over three standard deviations

40
outside the mean, was removed from the VCI data (See Figure 8). No significant
result for VCI was found [b=-.0047, χ2 (1, N=35) = 2.56, p =.11]. Analysis indicates
a significant result for WMI [b=-.0061, χ2 (1, N=35) = 4.17, p = .04] (See Figure 9).
The Relationship between Language Skills and Lexical Processing. The
relationship between Language skills and the results of the lexical processing
assessment were tested in a model that included the significant random effects
described in 7.2 and the significant fixed effect, cohort, described in 7.3. The results
showed a significant effect for language composite [b=-.0172, χ2 (1, N=35) = 20.05,
p < .001] (See Figure 10).
The relationship between unique language domains, as measured by stand-
alone CASL subtests, and lexical processing was also considered. Analysis of CASL
subtests Synonyms [b=-.0078, χ2 (1, N=35) = 6.69, p = .009], Sentence Completion
[b=-.0089, χ2 (1, N=35) = 17.57, p < .001], Grammatical Morphemes [b=-.0085, χ2 (1,
N=35) = 5.84, p = .02] and Non-Literal Language [b=-.0084, χ2 (1, N=34) = 148.93,
p < .001] revealed significant effects for semantics/vocabulary knowledge, semantic
integration, syntax and supralinguistic language respectively (See Figures 11-14).
The Relationship between Autistic Symptomology and Lexical Processing.
The relationship between autistic symptomology, as measured by the SRS, and the
results of the lexical processing assessment were tested in a model that included the
random effects described in 7.2 and the significant fixed effect, cohort, described in
7.3. The results showed a significant effect for SRS [b=.0089, χ2 (1, N=35) = 6.08, p
= .02] (See Figure 15). The relationship between individual SRS subscales and
lexical processing was also considered. Analysis of SRS subtests Social Awareness

41
[b=.0061, χ2 (1, N=35) = 6.38, p = .01], Social Communication [b=.0084, χ2 (1,
N=35) = 8.14, p = .004], and Social Motivation [b=.0054, χ2 (1, N=35) = 6.33, p
= .01] revealed significant effects. One outlier, which was outside three standard
deviations form the mean, was removed from the social cognition data (See Figure
19). On analysis, there was also a significant effect for Social Cognition [b=.0117, χ2
(1, N=34) = 4.86, p = .004]. There was no significant effect for Social Mannerisms
[b=.0024, χ2 (1, N=35) = 1.47, p = .23]. The relationships between lexical processing
and SRS component subscales can be seen in Figures 16-20.
An additional analysis was conducted to consider the possibility that the data
points representing the children with high SRS scores may be driving the significant
effect reported above. Although none of the thirty-five children in our sample were
reported to have been diagnosed with an autism spectrum disorder by a parent or
guardian, three children, by parental report, received SRS scores falling in the range
described in the SRS manual as indicating “deficiencies in reciprocal social behavior
that are clinically significant” (Constantino & Gruber, 2005). To confirm that data
from these three children were not responsible for the relationship reported above, the
analysis was repeated using a subset of data, which excluded the relevant three
observations. Results of analysis using only the subset of children whose SRS scores
suggest typical development, the significant result for SRS remained [b=.0114, χ2 (1,
N=32) = 5.20, p = .02] (See Figure 15). Even among children who are not likely to
meet criteria for an ASD diagnosis on the basis of SRS score, those who earned
higher SRS scores, indicating greater autistic symptomology, also showed slower
lexical processing speed as measured by the Lexical Processing Assessment.

42
Chapter 8: Discussion
8.1 Review of Results and Limitations Lexical Processing Speed.The cohort model of spoken word recognition (Marslen-
Wilson, 1987; Marslen-Wilson & Welsh, 1978) describes word recognition as taking
place on-line, as words unfold in time. The model holds that cohort competitors, or
other words that share the initial portion of acoustic-phonetic input with a target word,
are activated as lexical candidates when processed. According to the model, cohort
competitors compete for recognition until additional acoustic input informs the
listener that a word is no longer consistent with speech sounds in the target word.
Based on the cohort models of speech perception, it was predicted that lexical
processing speed would be slower in the presence of cohort competition compared to
in the presence of rhyme competition or in a no competition condition. Reaction
times observed in this experiment are slower than reaction times reported in the
literature for both eye fixation to target and motor reaction time of hand movement,
which have been reported as 222ms (SD=35) and 234 (SD=41) respectively
(Bekkering, et al., 1994). The comparatively slower reaction times can me explained
by our method of measurement. In this experiment reaction time was measured from
the onset of the target word. At this time, in many cases, the listener does not possess
enough information to initiate saccade to target. Time required for the word to unfold
is included in our measurement of reaction time. Our results did confirm previous
research findings of slower processing speed in the presence of cohort competition
(Allopenna, et al., 1998), in both young adults and children, consistent with
expectations based on the cohort model of spoken word recognition.

43
The continuous mapping model of speech perception adds to the cohort model
by positing that the set of activated alternatives also include those words that rhyme
with a target word (Allopenna, et al., 1998). This model accounts for the fact that
listeners are able to recover word meaning, even in cases where an initial speech
sound is missed, therefore failing to activate the target word according to the process
espoused by the cohort model. The lexical processing assessment, by including a
rhyme condition, was able to test the prediction made by the continuous mapping
model of speech perception, namely, that lexical processing speed would be slower in
the presence of rhyme competition compared to in a no competition condition.
The results from our young adult sample indicate that lexical processing in the
rhyme competition condition was significantly faster than in both the cohort
competition condition and the no competition conditions. While we had predicted
processing speed in the rhyme condition may be faster than the cohort condition, we
had not expected that reaction time in the presence of rhyme competition would be
faster than reaction time in the absence of competition. On exit interview several
young adult subjects indicated that they had noticed, during the initial introduction to
stimuli, which took place prior to the initiation of the trial, that some trials contained
two rhyming words. A likely explanation for the decreased reaction time in rhyme
trials is that adults learned that on those trials one of the rhyming words would be the
target item. By narrowing the candidate target items from four down to two, even
before the trial began, adults gained an unintended advantage resulting in quicker
reaction times in rhyme trials. Among our child sample, a rhyme effect was not
found. Interestingly, on informal exit survey, no children reported noticing that there

44
were rhyming items among the lexical processing trials. Overall, results from our
assessment do not support previous findings (Allopenna, et al., 1998) indicating a
rhyme effect in spoken word recognition. Failure to replicate this finding could be
due to limitations imposed by the design of our assessment.
The lexical processing assessment was also designed to be able to consider the
effects of environmental noise on lexical processing speed. This component of the
assessment is important because verbal communication in natural settings often takes
place in the presence of background noise. Past research has shown that the
intelligibility of speech sounds is related to an articulation index, calculated as a ratio
of speech and unwanted sounds received by the ear (French & Steinberg, 1947) and
that the presence of temporal and spectral dips present in background sounds serve to
enhance intelligibility of speech sounds (Meddis & Hewitt, 1992; Miller & Licklider,
1950). It is well known that background noise plays a role in speech recognition. In
elementary school aged children, background noise has also been found to affect
speech recognition and compromise academic performance in the classroom setting
(Ando, Nakane, & Egawa, 1975; Crook & Langdon, 1974). In the present study, it
was predicted that background noise may interfere with lexical processing. It was
expected that this would be evident by slowed reaction time in the presence of
background noise compared to in no noise competition conditions. However, no
effect for environmental noise condition was found. This suggests that in both young
adult and child populations, subjects were able to extract speech sounds from
background noise without the expected cost of increased reaction time.

45
The lexical processing assessment was also designed to assess the potential
interaction between cohort condition and environmental condition, such that the
effect of noun competition on the latency of eye fixation may depend on the presence
of background noise. Among adults, a significant interaction suggesting that the
presence of pink noise affects latency of eye-fixation in cohort conditions
differentially was found. Whereas, response time was longest in the cohort condition
followed by the no competition condition, and finally the rhyme condition in those
trials containing both background conversation noise and no noise, latency of eye-
fixation did not follow this pattern in trials containing background pink noise. Young
adult subjects display increased eye-fixation latency in pink noise compared to the
other environmental background conditions in rhyme competition trials. No
interaction was found in the child population.
The Relationship between Intelligence and Lexical Processing Speed.
Processing speed has long been conceptualized as a component of intelligence.
Theorists have agreed on a plausible relationship between processing speed and
cognition and argue it is central to intellectual functioning (Colombo, 1993; Eysenck,
1987; Haith & McCarty, 1990; Kail, 1992). In fact, modern day gold standard
intelligence measures, the WAIS-IV and WISC-IV, include processing speed as a
component index, which combined with other indices, make up the full scale IQ score.
Processing speed is also seen as playing an even more deeply rooted role in
the conceptualization of intelligence. Instead of as an independent factor, which
contributes to the measure of intelligence, processing speed has been described as a
causal link to performance on various other elements of intelligence (Kail, 2000). For

46
example, as explained by Kail (2000), a child who earned below average scores in
processing speed, memory, and reasoning would have been, historically, considered
to be subpar in those three domains. Considered from a more dynamic view of
intelligence, it may be the case that the child has a deficit only in processing speed,
which leads to poor performance in other domains of cognition. Further support for
this comes from the finding that processing speed, working memory, and fluid
intelligence improve with age following a similar time course, suggesting that the
three abilities are related rather than independent constructs (Fry & Hale, 2000).
Based on the known relationship between processing speed, working memory,
and intelligence, Fry and Hale (1996) proposed the developmental cascade model, in
which they posit that during development processing speed becomes faster, leading to
improvements in working memory, which, in turn, leads to better performance in
reasoning and problem solving. Evidence that age related increases in processing
speed were associated with improved working memory capacity, along with higher
scores on tests of fluid intelligence (Fry & Hale, 1996), supported their theory and led
to the conclusion that as children are able to process information more rapidly,
working memory is able to function more effectively, which leads to the ability to
solve problems and thus, improved performance on measures of fluid intelligence.
In the current study, we hypothesized a relationship between lexical
processing speed and intelligence, in line with previous research findings on the
relationship between processing speed and intelligence presented above. Specifically,
we predicted that performance on the WASI and the WISC-IV, in young adults and
children respectively, would predict lexical processing speed.

47
The results from our young adult sample showed no significant effect for the
WASI full scale IQ, component measures Verbal IQ or Performance IQ, or the
working memory index of the WAIS-IV. Many previous reports of the relationship
between processing speed and intelligence are taken from research on children during
development (Dougherty & Haith, 1997; Fry & Hale, 1996). A possible explanation
for the lack of significant effects in adults is that the relationship no longer holds in
individuals who have reached a developmental peak in speed of processing and a
likely plateau in development of intelligence. It could be that the role of processing
speed in the development of intelligence is only evident when children are developing
cognitively and actively acquiring those skills that become crucial in the
measurement of intelligence. Further, the four subtests making up the full scale and
component WASI indices, unlike the full length Wechsler intelligence assessments do
not include a measure of processing speed. This removes the expectation of a
relationship between lexical processing speed and intelligence simply because the
design of the assessment includes processing speed as a component, essentially
defining intelligence, in part, as processing speed.
According to the developmental cascade model (Fry & Hale, 1996) we also
expected a significant effect for the relationship between lexical processing speed and
intelligence in children. Further support for the hypothesis comes from an established
relationship between visual processing speed and intelligence during development.
Dougherty (Dougherty & Haith, 1997) found that visual reaction time, measured as
the time between the presentation of an image and initiation of eye movement
towards the picture, at three and a half months correlates with intelligence (on the

48
Wechsler Preschool and Primary Scale of Intelligence-Revised) at 4 years of age.
Infants with faster visual processing speed tended to have higher IQ scores as 4-
yearolds.
Guided by the developmental cascade model, and with this previous research
as a basis, we expected the WISC-IV full-scale IQ and component WMI, PSI, PRI,
and VCI indices to predict lexical processing speed in children. However, the results
fail to show a significant effect for WISC-IV full scale IQ. Analysis failed to find an
effect for processing speed (PSI), perceptual reasoning (PRI) or verbal
comprehension (VCI). As predicted, there was a significant effect for working
memory (WMI). Working memory, as an essential element of the developmental
cascade model, is the WISC-IV index expected to have the closest relationship with
lexical processing speed. Lack of a significant effect for processing speed was
particularly unexpected given that the two measures of processing speed, the lexical
processing speed assessment and the WAIS-IV PSI, although dependent on a motor
component, are purported to measure the same construct. Visual reaction time
measures, like the lexical processing assessment, engage automatic and natural
responses whereas manual measures of processing speed, like those included in
Wechsler assessments, require more effort and are sensitive to differences in motor
ability and attentional ability which affects task complexity for differing populations.
In a study looking at event related potentials (ERP’s) and reaction time (RT) during
cognitive tasks which varied in complexity, it was found that P300 latency to target
stimuli, along with RT, increased with task demands and was inversely related to
mental ability (McGarry-Roberts, Stelmack, & Campbell, 1992). The results suggest

49
that P300 latency and RT may influence stimulus evaluation time and the response
production time associated with cognitive processing and that these may vary
inversely with intelligence. The task may be experienced as more complex in young
children who are actively developing attentional control, compared to adults whose
attentional control system is mature and allows them to attend to the entire display
field.
The Relationship between Linguistic Competence and Lexical Processing
Speed. In the current study, a relationship between lexical processing speed and
linguistic competence, as measured by the CASL assessment, was hypothesized for
both adults and children. Faster and more efficient lexical processing was expected to
result in increased opportunity for developing linguistic competence including the
acquisition of vocabulary and grammar, and for gaining experience with higher order,
non-literal language. In other words, it is expected that if an individual’s processing
resources are taxed in the task of lexical processing, she may lack the resources to
process beyond the basics of word identification and may fail to understand the
gestalt in conversation. This may lead to compromised development of higher order
language, including the ability to understand non-literal language and would be
reflected by the presence of deficits in various linguistic domains.
The current study hypothesized a relationship between lexical processing
speed and linguistic competence, as measured by a CASL language composite.
Relationships between lexical processing speed and individual CASL subtests
measuring language areas semantics/vocabulary knowledge, semantic integration,
syntax and Supralinguistic language were also hypothesized. Results indicated no

50
relationship between language skills and performance on the lexical processing
assessment in young adults. It is likely that because linguistic development in young
adult university students has generally reached a plateau, the current sample
performed near ceiling on the CASL. As a result, the CASL may not be an ideal
measure of individual differences in this population.
In children, however, significant effects were found for the CASL language
composite and each of the individual language subtests, Synonyms, Sentence
Completion, Grammatical Morphemes, and Non-Literal Language. The result
indicates relationships between lexical processing speed and language areas including
semantics/vocabulary knowledge, semantic integration, syntax and supralinguistic
language. The strongest effects were found for Sentence Completion and Non-Literal
Language.
Not unexpected, given our findings showing a relationship between linguistic
processing speed and language competency in children but not adults, previous
research using eye tracking has shown differences in the way adults and young
children handle temporary syntactic ambiguity during online sentence processing.
Given an ambiguous phrase like “Put the frog on the napkin…” where the
prepositional phrase could be interpreted as a modifier or as a location for putting,
adults tend to resolve temporary syntactic ambiguity according to the Referential
Principle of syntactic ambiguity (Crain & Steedman, 1985). In accordance with this
principle, adults pursued the Modifier interpretation when visual context supported
that interpretation (i.e. in a two referent context) or the Destination interpretation
when visual context indicated no modifier was required to determine the referent (i.e.

51
in a one referent context) (Trueswell, Sekerina, Hill, & Logrip, 1999). Unlike adults,
five-year-old children appear to be insensitive to the Referential Principle preferring
instead the Destination interpretation of ambiguous prepositional phrases regardless
of context (Trueswell, et al., 1999). The authors suggest that a likely explanation for
the inability of five year olds to employ the Referential Principle is limited processing
capacity, which may lead them to abandon low probability syntactic alternatives and
show preference for the destination interpretation given an ambiguous sentence
(Trueswell, et al., 1999).
One factor postulated to account for the relation between speed of processing
and cognition, according to Salthouse’s (1996) processing speed theory of age
differences in cognition, is termed the simultaneity mechanism. The simultaneity
mechanism’s role in the relationship between speed of processing and quality of
cognitive performance can be explained as slow processing leading to a reduction in
the amount of simultaneously available information required for high level processing
(Salthouse, 1996). According to the reasoning behind by the simultaneity mechanism,
we would expect that faster processing speed would allow for increased information
available for use during learning. This is consistent with our finding that increased
lexical processing speed is associated with better performance in high level language
skills. CASL subtests Sentence Completion and Nonliteral language, which assess
semantic integration and understanding of non-literal language showed the strongest
relationship to lexical processing speed. These subtests require abstraction and
synthesis of various content available simultaneously for success.

52
The Relationship between Autistic Phenotype and Lexical Processing Speed.
The results of the current study support a relationship between lexical processing
speed and autistic traits measured in typically developing children. Consideration of
autistic symptoms in non-diagnosed individuals is consistent with the
conceptualization of autism as a spectrum disorder in which autism related traits are
continuously distributed in the population. Although the field is now conceptualizing
autistic symptoms in terms of this broader autism phenotype, much research on
autistic symptomology comes from studies conducted on those who have been
diagnosed with the disorder. Linguistic deficits have come to be known as a hallmark
of the disorder, and research into the processes underlying linguistic deficits in autism
is ongoing. Individuals with autism have been shown to have a deficit in the ability
to process transient sequential stimuli like those encountered in spoken language.
Another hallmark of autistic disorder is deficits in social skills and abilities.
Welsh has suggested that social and communication impairments in autism spectrum
disorders may be the result of deficits in auditory processing that affect the ability to
process and understand spoken language (Welsh, Rodrigues, Edgar, & Roberts, 2010).
In the current study, we show a relationship between lexical processing speed and
autistic traits as indexed by total SRS score as well as component SRS scores
measuring social awareness, social communication, social motivation, and social
cognition. The present results, conceptualized with consideration to the broader
autism phenotype, are consistent with the findings of abnormal speech parsing and
auditory processing in autism.

53
The current research is not the first to report a relationship between autistic
traits and auditory processing in the general population. Previous research has
identified a link between autistic traits in the undiagnosed general population and
auditory speech perception style. Stewart and Ota (Stewart & Ota, 2008) determined
that Autism Quotient scores are negatively correlated with the Ganong effect, or
tendency to shift phonetic segment identification toward the perception of a real word
in a listening task (ie. toward perception of gift rather that kift). In individuals with
higher AQ, phonetic perception was less likely to be influenced by lexical
information and is more in line with the actual acoustic difference present. This
result speaks to differences in style of integration of acoustic and lexical information
in phonetic processing.
8.2 Conclusions, Implications, and Future Directions
In the current project, a pure measure of processing speed, the Lexical
Processing Assessment (LPA), was created using eye tracking technology. The design
of the assessment is such that eye-fixation to pictures representing target words,
during a visual world paradigm, are an indication of lexical information processing
speed. The assessment enables the study of individual differences in linguistic
processing speed and the relationship between language based processing speed and
the development of other skills and abilities which are hypothesized to be affected by
processing speed. Data from the lexical processing speed assessment confirm the
cohort model of speech perception by showing slowed processing speed in the
presence of cohort competition compared to in rhyme competition and no competition

54
conditions. This result establishes the Lexical Processing Assessment (LPA) as a
reliable tool for the study of individual differences in processing speed.
It was hypothesized that lexical processing speed, as measured by the
assessment, would be related to scores of intelligence, language functioning, and
additionally, in a child population, traits related to the autistic phenotype. While these
relationships were uncovered in children, results in adults were not consistent with a
relationship between processing speed and intelligence scores or linguistic ability.
A few explanations for the current results are worth considering. One possible
explanation is related to the peak in processing speed well documented by early
adulthood. Young adults have also likely reached a plateau in the development of
intelligence and language functioning by this stage of development eliminating the
variability that may be required to uncover relationships. Related, the simple task
demands of the LPA assessment may lack the complexity to make the task a good
measure to show the link between processing seed and intelligence in young adults.
To put this simply, the LPA assessment may be “too easy” for young adults, whereas
developing children are taxed even in a task with relatively simple demands. The
literature supports this explanation with the finding that the more complex the
speeded task, the stronger the relationship between speed and intelligence (Jenson,
1988). This has been interpreted in the literature as indicating that the more demand a
task places on memory and attention, the stronger the correlation between speed and
general fluid intelligence (Conway, Cowan, Bunting, Therriault, & Minkoff, 2002).
It’s been suggested that a reason that performance on complex tasks like the
reading span (RSPAN), counting span (CSPAN) and operation span (OSPAN) are

55
related to measures of fluid intelligence is that they do not allow the participant to
rely on automatized routines to perform the task (Conway et al., 2002). Instead, they
rely on working memory capacity. The LPA task, by design, and in contrast, takes
advantage of the natural automatic response of eye-fixation to a named object in the
visual field. While the LPA assessment does likely place a small attentional and
short-term memory demand on participants by nature of the need to remember the
quadrant position of each item for maximum efficiency, the task is largely automatic
and relies on working memory minimally if at all. In a related vein, it has been
suggested in the literature that particular tasks may be good measures of particular
constructs in children but not in adults and vice versa (Conway et al., 2002). The
simplicity of the LPA task may result in it being a poor measure of working memory
in young adults while the demands may remain high enough to tap into working
memory during development. As a result, perhaps the lack of results in adults can be
attributed to the fact that for adults, the LPA is a near pure processing speed measure.
To be clear, it may be that for the adult population, the LPA lacks the significant
working memory demand that has been suggested as the link between processing
speed and fluid intelligence.
Several studies document the link between working memory and fluid
intelligence (Conway et al., 20002; Engle, Tuhoolski, Laughlin, & Conway, 1999;
Kyllonen & Christal, 1990) This suggests that it may be the working memory
component, not the pure processing speed construct that is responsible for the
relationship between processing speed and intelligence in Fry’s 1996 study. In fact,
Conway and colleagues (2002) point out that the processing speed tasks used in the

56
research conducted by Fry and Hale, which concluded a relationship between
processing speed and intelligence, included measures of processing that were
confounded with working memory. They argue that of the four tasks which
constituted the processing speed composite in the study, two had minimal demands
on working memory and two, including a visual search and an abstract matching to
sample task, placed heavy demands on working memory. Because processing speed
and working memory were confounded in the measures used, the result, indicating a
meaningful relationship between processing speed and intelligence, may be erroneous.
It is possible that working memory ability is truly responsible for the relationship
observed. This possibility is supported by additional research. Conway and colleagues
failed to find a relationship between processing speed and fluid intelligence when
they took care to select pure processing speed tasks devoid of working memory
demands (Conway et al., 2002).
Another consideration, as insight into the lack of consistent findings between
lexical processing speed and intelligence across populations studied in the current
project, is related to a possible distinction between developmental differences in
cognitive ability and individual differences in cognitive ability. Research has shown
that processing speed is an important factor underlying developmental differences in
cognitive ability in childhood (Fry & Hale, 1996) and in the aging population
(Salthouse, 1996). Expectations for adults have been inferred although it is possible,
as suggested by Conway and colleagues (2002), that factors accounting for
developmental differences in cognitive ability do not match the factors that account
for individual differences in cognitive ability in young adults. The possibility exists

57
that processing speed is important for developmental differences in childhood but not
for individual differences in adults (Conway et al., 2002).
Data from the current study does support relationships between processing
speed and the development of other skills during development. We see a clear
relationship between linguistic processing speed and working memory, linguistic
ability, and autism-related traits in children between ages 7 and 11-years-11 months.
These results are consistent with the claim made in developmental cascade model put
forth by Kale and Salthouse, suggesting that increases in processing speed predict
improvement in working memory (1994). Our results are also in line with
expectations based on the processing-speed theory of age differences in cognition,
which attributes age-related differences in cognitive functioning to a reduction of the
speed of execution of cognitive operations as individuals age. Although this theory
was proposed to explain cognitive decline in adults, the mechanism is thought to be
relevant to the development of cognitive functioning during childhood.
The processing speed theory of adult age differences in cognition, proposed
by Salthouse (1996), accounts for age-related differences in cognition in two ways,
termed the limited time mechanism and the simultaneity mechanism. The limited time
mechanism suggests that when speed of processing is faster there is more opportunity
to accomplish a larger amount of processing, and that more processing results in
higher levels of performance. In a related aspect of the theory, the simultaneity
mechanism discusses the availability of information over time. It suggests that
slower processing means that products of early processing may be lost to decay

58
before later processing is complete, resulting in lack of access to relevant information
and reduced cognitive ability.
The current results are consistent with these theories inasmuch as we see
evidence that faster processing of incoming linguistic information as allowing the
developing child the opportunity to learn more efficiently, resulting in increased
learning. We see this in all aspects of linguistic development measured using the
CASL and in the development of social skills as measured by the SRS. However,
according to the developmental cascade model and the processing speed theory of
cognition we would expect increased processing speed to have a global effect on
learning, which would extend to increased intellectual ability. Outside of working
memory in isolation, the current results do not support a relationship between
processing speed and either individual components of intelligence or a full scale IQ
score as measured by the WASI or WISC-IV in models separating linguistic ability
and intellectual functioning.
Although the current study did not include investigation into reading skill and
its relationship to speed of processing, research supports a relationship between
processing speed, rapid auditory naming and reading ability. It is well known that as
children grow older they are able to name familiar objects more rapidly. Research
shows that this increase in rapid auditory naming speed is a predictor of reading skill
(Wolf, Bally & Morris 1986; Spring & Davis, 1988). Traditional interpretation of this
observation is that automaticity, a function of age related experience, is the basis of
the link between rapid naming and reading skill (Wolf, Bally & Morris 1986; Spring
& Davis, 1988). However, (Kail & Hall, 1994) reported that it is not age, but rather

59
processing speed, that predicts naming time. In addition, the study showed that
naming time is linked to reading recognition, which is linked to reading
comprehension.
Although the current study did not consider the development of reading ability,
the literature related to processing speed, rapid auditory naming and reading suggests
a likely relationship between lexical processing speed and the development of reading
skills. The lexical processing speed assessment developed as part of the current
project may be a useful tool for further study of this relationship. Additionally, the
current results, taken together with previous research, suggest that an assessment like
the LPA may be of clinical utility. This type of assessment has the potential to
facilitate early identification of children who have slowed lexical processing speed
and who, as a result, may be at risk for reading difficulty. Identification of these
children before reading problems develop may have implications for intervention.
An important result of the current project, which has implications for future
research, is the finding of a relationship between processing speed and autistic
symptomology in typically developing children. Backed by the results of the current
study, we propose that slowed lexical processing speed, which can be measured
simply as reaction time in this assessment, may be an underlying factor in autism. Our
results are consistent with a theory proposed by Siegal and Blades (Siegal & Blades,
2003) which suggests auditory processing, the mechanism through which children
encounter language, may act as a gatekeeper to later development. Difficulty
processing and extracting linguistic information from speech likely leads to

60
disadvantage in the acquisition of language and in the ability to participate in
conversation and associated difficulty with social skills and abilities.
The current results are consistent with the hypothesis that a deficit in auditory
processing may be underlying the basis for autistic symptomology and may, in fact,
be a “gatekeeper” to the development of both language and social skills. This
conceptualization is consistent with an existing hypothesis proposed to explain a
cause of language impairment in autism, namely a fundamental deficit in the ability to
process transient sequential stimuli (Ricks & Wing, 1975; Tanguay, 1984). In a
similar hypothesis, termed the time-parsing deficit hypothesis, Boucher hypothesizes
that all individuals with autism spectrum disorders have impaired time-parsing of
events on an extended scale, like conversational exchange, which contribute to
linguistic aspects of pragmatic impairment (Boucher, 2003). She suggests that in
more severe forms of the disorder impaired time-parsing on the scale of sentences,
words, and morphemes may contribute to increased difficulty with semantic and
syntactic development. She submits that in the most severe cases, those characterized
by the absence of language development, individuals may have additional impairment
in time-parsing on the level of syllables and phonemes, eliminating the capacity for
language acquisition (Boucher, 2003). The results of the current research speak only
to autistic traits in normally developing individuals. An important next step in the
research program would be to look carefully at lexical processing in individuals
diagnosed with autism. Boucher’s hypothesis could be tested through investigation of
relationships between lexical processing speed and linguistic skills in a diagnosed
population.

61
The results of the current project indicate promise for the use of the LPA
assessment not only in continued autism-related research, but also points to potential
utility in clinical practice. The assessment was designed deliberately for ease of use
with special populations, in particular individuals with autism. It has a minimal
receptive language requirement and no expressive language requirement, lending
itself to use with young children and others with limited language functioning, a
defining feature of autism. Another limitation of traditional assessments, in terms of
their utility in assessing children with autism, is that that they assume that motivation
for performance is naturally provided by social reinforcement through interactions
with the examiner. This strategy works well with typically developing children.
However, children with autism do not typically show preference for social events
such as smiles, praise, or gestures (Rincover & Newsom, 1985), making it a challenge
to motivate them during assessment.
Research on motivation in children with autism has shown that sensory
reinforcers produce a higher percentage of correct responses and result in an equal
number of trials before satiation when compared with edible reinforcers (Rincover &
Newsom, 1985), which are another common method to motivate children with autism
(Lovaas, Koegel, Simmons, & Long, 1973). The lexical processing assessment can be
seen as an operant task where participants are trained to look at the target for a visual
reward. Positive reinforcement through this rewarding stimulus serves to maintain
the behavior. This design element eliminates the problem posed by the lack of
motivation through social reinforcement observed in many children with autism. The
implicit nature of the task can also be seen in the task design, which takes advantage

62
of the ecological validity inherent in the task. Even without a task instruction, it is
well known that eye gaze maps to visual referents related to spoken words. However,
research indicates that subjects lack awareness of this natural gaze toward referents.
In a recent study of eye-gaze self-monitoring only one of 14 individuals with autism
and 7 of 14 typically developing individuals noticed they were controlling gaze
contingent lenses (Grynszpan et al., 2011). This lack of awareness of agency related
to eye gaze suggests lack of explicit eye-gaze control during visual fixation to a target
on tasks like our lexical processing assessment.
In the future, following careful norming studies, an assessment like the LPA is
likely to provide meaningful information to clinicians in a variety of patient
populations. As a result of the careful assessment design, children with autism, who
often present with the unique challenges to testing discussed above, may produce
valid results using the LPA. Very young children, and others who have not
developed sophisticated language, will also be testable using this assessment.
Additionally, there is clinical utility for such an assessment in a rehabilitation setting
as current measures of processing speed rely heavily on motor functioning. Currently,
there are not reliable measures of processing speed available for use with individuals
with paralysis or impaired motor functioning. As a result, processing speed measures
are often left off of screening batteries for individuals with spinal cord and brain
injury.

63
References Allen, P., Smith, A., Lien, M., Weber, T., & Madden, D. (1997). Word frequency effects at brief exposure durations: Comment on Paap and Johansen (1994). Journal of Experimental Psychology, Human Perception and Performance, 23, 1792-1797. Allopenna, P., Magnuson, J., & Tanenhaus, M. (1998). Tracking the time course of spoken word recognition using eye movements: Evidence for continuous mapping models. Journal of Memory and Language, 38(4), 419-439. Ando, Y., Nakane, Y., & Egawa, J. (1975). Effects of aircraft noise on the mental work of pupils. Journal of Sound and Vibration, 43(4), 683-691. American Psychiatric Associaton. (2000). Diagnostic and statistical manual of mental disorders (4th ed., text rev.). Washington, DC: Author. Baddeley, A. (1992). Working memory. Science, 255, 556-559. Baron-Cohen, S., Tager-Flusberg, H., & Cohen, D. (1993). Understanding other minds: Perspectives from autism. Oxford, UK: Oxford University Press. Bates, D. M., & Sarkar, D. (2007). lme4: Linear mixed-effects models using S4 classes, R package version 0.99875-6. Bekkering, H., Adam, J., Kingma, H., Huson, A., & Whiting, H. (1994). Reaction time latencies of hand and eye movements in single- and dual- task conditions. Experimental Brain Research, 97, 471-476. Boucher, J. (2003). Language development in autism. International Congress Series, 1254, 247-253. Brown, R. (1973). A first language: The early stages. Oxford, England: Harvard University Press. Burnham, D., Kitamura, C., & Vollmer-Conna, U. (2002). What's new, pussycat? On talking to babies and animals. Science, 296, 1435. Carroll, J. (1993). Human cognitive abilities: A survey of factor-analytic studies. New York: Cambridge University Press. Carrow-Woolfolk, E. (1999). CASL: Comprehensive assessment of spoken language. Circle Pines, MN: American Guidance Services.

64
Carterette, E., & Jones, M. (1974). Informal speech: Alphabetic & phonemic texts with statistical analyses and tables. Berkley, CA: University of California Press. Carver, R. (1990). Reading rate: A review of research and theory. San Diego, CA: Academic Press. Ceponiene, R., Lepistö, T., Shestakova, A., Vanhala, R., Alku, P., Näätäten, R., & Yaguchi, K. (2003). Speech-sound-selective auditory impairment in children with autism: They can perceive but do not attend. Proceedings of the National Academy of Sciences, 100(9), 5567-5572. Columbo, J. (1993). Infant cognition: Predicting later intellectual functioning. Newbury Park, CA: Sage Publications. Constantino, J., Davis, S., Todd, R., Schindler, M., Gross, M., Brophy, . . . Reich, W. (2003). Validation of a brief quantitative measure of autistic traits: Comparison of the social responsiveness scale with the autism diagnostic interview-revised. Journal of Autism and Developmental Disorders, 33(4), 427-433. Constantino, J., & Gruber, C. (2005). Social Responsiveness Scale Manual. Los Angeles, CA: Western Psychological Services. Conway, A., Cowan, N., Bunting, D., Therriault, D., & Minkoff, S. (2002). A latent variable analysis of working memory capacity, short-term memory capacity, processing speed, and general fluid intelligence. Intelligence, 30, 163-183. Cooke, M. (2006). A glimpsing model of speech perception in noise. The Journal of the Acoustical Society of America, 119, 1562. Cooper, R. (1974). The control of eye fixation by the meaning of spoken language: A new methodology for the real-time investigation of speech perception, memory, and language processing. Cognitive Psychology, 6(1), 84-107. Cooper, R., & Aslin, R. (1990). Preference for infant-directed speech in the first month after birth. Child Development, 61, 1584-1595. Crain, S., & Steedman, M. (1985). On not being led up the garden path: The use of context by the psychological parser. In D. Dowty, L. Karttunen, & A. Zwicky (Eds.), Natural language parsing: Psychological, computational, and theoretical perspectives (pp. 320-358). Cambridge, UK: Cambridge University Press. Crook, M., & Langdon, F. (1974). The effects of aircraft noise in schools around London Airport. Journal of Sound and Vibration, 34(2), 221-232.

65
Dahan, D., Magnuson, J., & Tanenhaus, M. (2001). Time course of frequency effects in spoken-word recognition: Evidence from eye movements. Cognitive Psychology, 42(4), 317-367. Dawson, G., Meltzoff, A., Osterling, J., Rinaldi, J., & Brown, E. (1998). Children with autism fail to orient to naturally occurring social stimuli. Journal of Autism and Developmental Disorders, 28(6), 479-485. Dawson, G., Toth, K., Abbott, R., Osterling, J., Munson, J., Estes, A., & Liaw, J. (2004). Early social attention impairments in autism: Social orienting, joint attention, and attention to distress. Developmental Psychology, 40(2), 271-282. Dehaene, S., Bossini, S., & Giraux, P. (1993). The mental representation of parity and number magnitude. Journal of Experimental Psychology: General, 122(3), 371. Demetras, M., Post, K., & Snow, C. (1986). Feedback to first language learners: The role of repetitions and clarification questions. Journal of Child Language, 13(2), 275. Dougherty, T. M., & Haith, M. M. (1997). Infant expectations and reaction time as predictors of childhood speed of processing and IQ. Developmental Psychology, 33(1), 146. Duchowski, A. (2007). Eye tracking methodology: Theory and practice. London, UK: Springer-Verlag Inc. Eberhard, K., Spivey-Knowlton, M., Sedivy, J., & Tanenhaus, M. (1995). Eye movements as a window into real-time spoken language comprehension in natural contexts. Journal of Psycholinguistic Research, 24(6), 409-436. Elkind, D., & Weiss, J. (1967). Studies in perceptual development: III. Perceptual exploration. Child Development, 38(2), 553-561. Engle, R., Tuholsky, S., Laughlin, J., & Conway, A. (1999). Working memory, short-term memory and general fluid intelligence: a latent variable approach. Journal of Experimental Psychology: General, 128, 309-331. Eysenck, H. (1987). Speed of information processing, reaction time, and the theory of intelligence. In P. Vernon (Ed.), Speed of information processing and intelligence (pp. 22-67). Norwood, NJ: Ablex. Fernald, A. (1985). Four-month-old infants prefer to listen to motherese. Infant Behavior and Development, 8(2), 181-195. Fernald, A., & Kuhl, P. (1987). Acoustic determinants of infant preference for motherese speech. Infant Behavior & Development, 10(3), 279-293.

66
Francis, W., & Kucera, H (1982). Frequency analysis of English usage: Lexicon and grammar. Boston, MA: Houghton Mifflin. French, N., & Steinberg, J. (1947). Factors governing the intelligibility of speech sounds. Journal of the Acoustical Society of America, 19, 90-119. Fry, A., & Hale, S. (1996). Evidence for a developmental cascade. Psychological Science, 7(4), 237-241. Fry, A., & Hale, S. (2000). Relationships among processing speed, working memory, and fluid intelligence in children. Biological Psychology, 54, 1-34. Gervais, H., Belin, P., Boddaert, N., Leboyer, M., Coez, A., Sfaello, I., . . . Zilbovicus, M. (2004). Abnormal cortical voice processing in autism. Nature Neuroscience, 7(8), 801-802. Glenn, S., & Cunningham, C. (1983). What do babies listen to most? A developmental study of auditory preferences in nonhandicapped infants and infants with Down’s syndrome. Developmental Psychology, 19(3), 332-337. Golinkoff, R. (1987). The eyes have it: Lexical and syntactic comprehension in a new paradigm. Journal of Child Language, 14(1), 23-45. Grieser, D., & Kuhl, P. (1988). Maternal speech to infants in a tonal language: Support for universal prosodic features in motherese. Developmental Psychology, 24(1), 14-20. Grosjean, F. (1980). Spoken word recognition processes and the gating paradigm. Perception & Psychophysics, 28(4), 267. Grynszpan, O., Nadel, J., Martin, J., Simonin, J., Bailleul, P., Wang, Y., … Constant, J. (2011). Self-monitoring of gaze in high functioning autism. Journal of Autism and Developmental Disorders, Online First, 21 November 2011. Haith, M. M., & McCarty, M. E. (1990). Stability of visual expectations at 3.0 months of age. Developmental Psychology, 26(1), 68. Hallett, P. (1986). Eye movements. In K. Boff, L. Kaufman, & J. Thomas (Eds.), Handbook of perception and human performance (pp. 10-112). New York, NY: Wiley. Hirsh-Pasek, K., Kemler, N., Jusczyk, P., Cassidy, K., Druss, B., & Kennedy, L. (1987). Clauses are perceptual units for young infants. Cognition, 26(3), 269. Hobson, R., Ouston, J., & Lee, A. (1988). Emotion recognition in autism: Coordinating faces and voices. Psychological Medicine, 18(4), 911-923.

67
Hobson, R., Ouston, J., & Lee, A. (1989). Naming emotion in faces and voices: Abilities and disabilities in autism and mental retardation. British Journal of Developmental Psychology, 7(3), 237-250. Hollich, G., Hirsh-Pasek, K., & Golinkoff, R. (2000). Breaking the language barrier: An emergentist coalition model for the origins of word learning. Monographs of the Society for Research in Child Development, 65 (3, Serial No. 262). Jensen, A. (1998). The g factor: The science of mental ability. Westport, CT: Praeger. Kail, R. (1992). Processing speed, speech rate, and memory. Developmental Psychology, 28(5), 899. Kail, R. (2000). Speed of information processing: Developmental change and links to intelligence. Journal of School Psychology, 38(1), 51-61. Kail, R., & Hall, L., (1994). Processing speed, naming speed, and reading. Developmental Psychology, 30(6), 949-954. Kail, R., & Salthouse, T. (1994). Processing speed as a mental capacity. Acta Psychologica, 86(2-3), 199. Karzon, R. (1985). Discrimination of polysyllabic sequences by one to four-month-old infants. Journal of Experimental Child Psychology, 39(2), 326-342. Kemler, N., Hirsh-Pasek, K., Jusczyk, P., & Cassidy, K. (1989). How the prosodic cues in motherese might assist language learning. Journal of Child Language, 16(1), 55. Kjelgaard, M., & Tager-Flusberg, H. (2001). An investigation of language impairment in autism: Implications for genetic subgroups. Language and Cognitive Processes, 16(2), 287-308. Klin, A. (1991). Young autistic children's listening preferences in regard to speech: A possible characterization of the symptom of social withdrawal. Journal of Autism and Developmental Disorders, 21(1), 29-42. Klin, A. (1992). Listening preferences in regard to speech in four children with developmental disabilities. Journal of Child Psychology and Psychiatry, 33(4), 763-769. Klinger, L., Dawson, G., & Renner, P. (2002). Autistic disorder. In E. Mash & R. Barkley (Eds.), Child psychopathology (2nd ed., pp. 409-454). New York, NY: Guilford Press.

68
Kucera, H., & Francis, W. (1967). Computational analysis of present-day American English. Providence, RI: Brown University Press. Kuhl, P., Andruski, J., Chistovich, I., Chistovich, L., Kozhevnikova, E., Ryskina, V., . . . Lacerda, F. (1997). Cross-language analysis of phonetic units in language addressed to infants. Science, 277, 684-686. Kuhl, P., Coffey-Corina, S., Padden, D., & Dawson, G. (2005). Links between social and linguistic processing of speech in preschool children with autism: Behavioral and electrophysiological measures. Developmental Science, 8(1), 1-12. Kurita, H. (1985). Infantile autism with speech loss before the age of thirty months. Journal of the American Academy of Child Psychiatry, 24(2), 191. Kyllonen, P., & Christal, R. (1990). Reasoning ability is (little more than) working memory capacity?! Intelligence, 14, 389-433. Lenzner, T., Kaczmirek, L., & Lenzner, A. (2010). Cognitive burden of survey questions and response times: A psycholinguistic experiment. Applied Cognitive Psychology, 24(7), 1003-1020. Lally, M., & Nettelbeck, T. (1977). Intelligence, reaction time, and inspection time. American Journal of Mental Deficiency, 82(3), 273. Liu, H., Kuhl, P., & Tsao, F. (2003). An association between mothers' speech clarity and infants' speech discrimination skills. Developmental Science, 6(3), 1-10. Lord, C., & Paul, R. (1997). Language and communication in autism. In D. Cohen & F. Volkmar (Eds.), Handbook of autism and pervasive developmental disorders (2nd ed.). New York, NY: John Wiley & Sons. Lovaas, O., Koegel, R., Simmons, J., & Long, J. (1973). Some generalization and follow-up measures on autistic children in behavior therapy. Journal of Applied Behavior Analysis, 6, 131-166. MacWhinney, B. (2000). The CHILDES project: Tools for analyzing talk (3rd ed.). Mahwah, NJ: Lawrence Erlbaum Associates. Marslen-Wilson, W. (1987). Functional parallelism in spoken word-recognition. Cognition, 25(1), 71-102. Marslen-Wilson, W., & Welsh, A. (1978). Processing interactions and lexical access during word recognition in continuous speech. Cognitive Psychology, 10(1), 29-63. Matin, E., Shao, K., & Boff, K. R. (1993). Saccadic overhead: Information processing time with and without saccades. Perception & Psychophysics, 53, 372-380.

69
McGarry-Roberts, P., Stelmack, R., & Campbell, K. (1992). Intelligence, reaction time and event related potentials. Intelligence, 16(3-4), 289-313. Meddis, R., & Hewitt, M. (1992). Modeling the identification of concurrent vowels with different fundamental frequencies. The Journal of the Acoustical Society of America, 91, 233. Meints, K., Plunkett, K., Harris, P., & Dimmock, D. (2002). What is “on” and “under” for 15, 18-and 24-month-olds? Typicality effects in early comprehension of spatial prepositions. British Journal of Developmental Psychology, 20(1), 113-130. Miller, G., & Licklider, J. (1950). The intelligibility of interrupted speech. The Journal of the Acoustical Society of America, 22, 167. Muhle, R., Trentacoste, S. V., & Rapin, I. (2004). The genetics of autism. Pediatrics, 113(5), e472. Osterling, J., & Dawson, G. (1994). Early recognition of children with autism: A study of first birthday home videotapes. Journal of Autism and Developmental Disorders, 24(3), 247-257. Osterling, J., Dawson, G., & Munson, J. (2002). Early recognition of 1-year-old infants with autism spectrum disorder versus mental retardation. Development and Psychopathology, 14(2), 239-251. Pinnell, G. S., Pikulski, J.J., Wixson, K.K., Campbell, J.R., Gough, P.P., & Beatty, A.S. (1995). Listening to children read aloud. Washington, DC: National Center for Education Statistics, U.S. Department of Education. Posner, M. (1980). Orienting of attention. The Quarterly Journal of Experimental Psychology, 32(1), 3-25. Ratcliff, R. (1993). Methods for dealing with reaction time outliers. Psychological Bulletin, 114, 510–532. R Core Design Team (2010). R: A language and environment for statistical computing. Reznick, J. (1990). Visual preference as a test of infant word comprehension. Applied Psycholinguistics, 11(2), 145-166. Ricks, D. M., & Wing, L. (1975). Language, communication, and the use of symbols in normal and autistic children. Journal of Autism and Developmental Disorders, 5(3), 191-221.

70
Rincover, A., & Newsom, C. (1985). The relative motivational properties of sensory and edible reinforcers in teaching autistic children. Journal of Applied Behavior Analysis, 18(3), 237-248. Roland, D. (2009, March). Relative clauses remodeled: The problem with Mixed-Effect Models. Poster presented at the CUNY Conference on Human Sentence Processing, Davis, California. Rutter, M. (1970). Autistic children: Infancy to adulthood. Seminars in Psychiatry, 2, 435-450. Sachs, J. (1983). Talking about the there and then: The emergence of displaced reference in parent-child discourse. In K. E. Nelson (Ed.), Children’s language (Vol. 4, pp. 1-28). Hillsdale, NJ: Earlbaum. Salthouse, T. A. (1996). The processing-speed theory of adult age differences in cognition. Psychological Review, 103(3), 403. Siegal, M., & Blades, M. (2003). Language and auditory processing in autism. Trends in Cognitive Sciences, 7(9), 378-380. Spalek, T. M., & Hammad, S. (2005). The left-to-right bias in inhibition of return is due to the direction of reading. Psychological Science, 16(1), 15. Spring, C., & Davis, J. (1988). Relations of digit naming speed with threee components of reading. Applied Psycholinguistics, 9, 315-334. Stewart, M. E., & Ota, M. (2008). Lexical effects on speech perception in individuals with “autistic” traits. Cognition, 109, 157-162. Szatmari, P., Jones, M., Zwaigenbaum, L., & MacLean, J. (1998). Genetics of autism: Overview and new directions. Journal of Autism and Developmental Disorders, 28(5), 351-368. Tanenhaus, M., Magnuson, J., Dahan, D., & Chambers, C. (2000). Eye movements and lexical access in spoken-language comprehension: Evaluating a linking hypothesis between fixations and linguistic processing. Journal of Psycholinguistic Research, 29(6), 557-580. Tanenhaus, M., & Spivey-Knowlton, M. (1996). Eye-Tracking. Language and Cognitive Processes, 11(6), 583-588. Tanenhaus, M., Spivey-Knowlton, M., Eberhard, K., & Sedivy, J. (1995). Integration of visual and linguistic information in spoken language comprehension. Science, 268(5217), 1632-1634.

71
Tanguay, P. (1984). Toward a new classification of serious psychopathology in children. Journal of the American Academy of Child Psychiatry, 23(4), 373-384. Trueswell, J. C., Sekerina, I., Hill, N. M., & Logrip, M. L. (1999). The kindergarten-path effect: Studying on-line sentence processing in young children. Cognition, 73(2), 89-134. Tyler, L. (1984). The structure of the initial cohort: Evidence from gating. Perception & Psychophysics, 36(5), 417. Venter, A., Lord, C., & Schopler, E. (1992). A follow-up study of high-functioning autistic children. Journal of Child Psychology and Psychiatry, 33(3), 489-597. Vernon, P. (1983). Speed of information processing and general intelligence. Intelligence, 7(1), 53-70. Wechsler, D. (2002). Wechsler Abbreviated Scale of Intelligence (WASI). San Antonio, TX: Psychological Corporation. Wechsler, D. (2003). WISC-IV technical and interpretive manual. San Antonio, TX: Psychological Corporation. Welsh, J., Rodrigues, P., Edgar, J., & Roberts, T. (2010, May). Gamma band oscillopathy: An electrical signature of language impairment in ASD that impairs active listening. Paper presented at the International Society of Autism Research, Philadelphia, PA. Wolf, M., Bally, H., & Morris, R. (1986). Automaticity, retrieval processes, and reading: A longitudianl study in average and impaired readers. Child Development, 57, 998-1000.

72
Table 1. Summary Scores for Intelligence and Language Measures in Young Adults
Variable N M SD Range WASI Full Scale IQ 32 112.34 10.68 85-135 WASI Verbal IQ 32 112.91 11.35 93-134 WASI Performance IQ 32 108.94 10.60 79-129 WAIS-IV Working Memory Index 30 108.90 12.84 89-139 CASL Language Composite 32 102.46 6.10 83.5-116.5 CASL Synonyms 32 103.97 6.83 87-117 CASL Sentence Completion 32 106.63 9.29 88-127 CASL Grammatical Morphemes 32 100.28 8.55 70-119 CASL Non-Literal Language 32 98.99 7.28 83-113
Note: All scores are presented as Standard Scores (M = 100, SD = 15)

73
Table 2. Reaction Time Results for the Lexical Processing Assessment in Young Adults Cohort Condition
Cohort None
Rhyme Total
Mean SEM Mean SEM Mean SEM Mean SEM
Pink
821.45
18.29
726.63
14.17
699.16
14.02
748.65
9.14
None
828.34
15.00
753.99
16.90
639.59
13.37
740.97
9.09 Conversation
805.84
14.26
722.49
12.89
668.61
12.91
731.86
7.91
Envi
ronm
enta
l Con
ditio
n
Total
818.60
9.20
734.34
8.52
669.27
7.79
740.51
5.04
Note: Reaction times are expressed in milliseconds

74
Table 3. Intercorrelations Between Intelligence and Language Variables in Young
Adults Key: FSIQ=WASI Full-scale IQ; VIQ=WASI Verbal IQ; PIQ=WASI Performance IQ; WMI=WAIS-IV Working Memory Index; SYN=CASL Synonyms; SC=CASL Sentence completion; GM=CASL Grammatical morphemes; NL=CASL Nonliteral Language; LC=Language Composite.
Variable FSIQ VIQ PIQ WMI SYN SC GM NL LCFSIQ 1.000 VIQ 0.880 1.000 PIQ 0.840 0.487 1.000
WMI 0.501 0.276 0.576 1.000
SYN 0.528 0.484 0.423 0.245 1.000 SC 0.442 0.416 0.321 0.467 0.519 1.000 GM 0.448 0.341 0.439 0.215 0.588 0.445 1.000 NL 0.302 0.289 0.219 0.251 0.619 0.370 0.151 1.000
LC 0.563 0.500 0.460 0.394 0.869 0.793 0.730 0.666 1.000
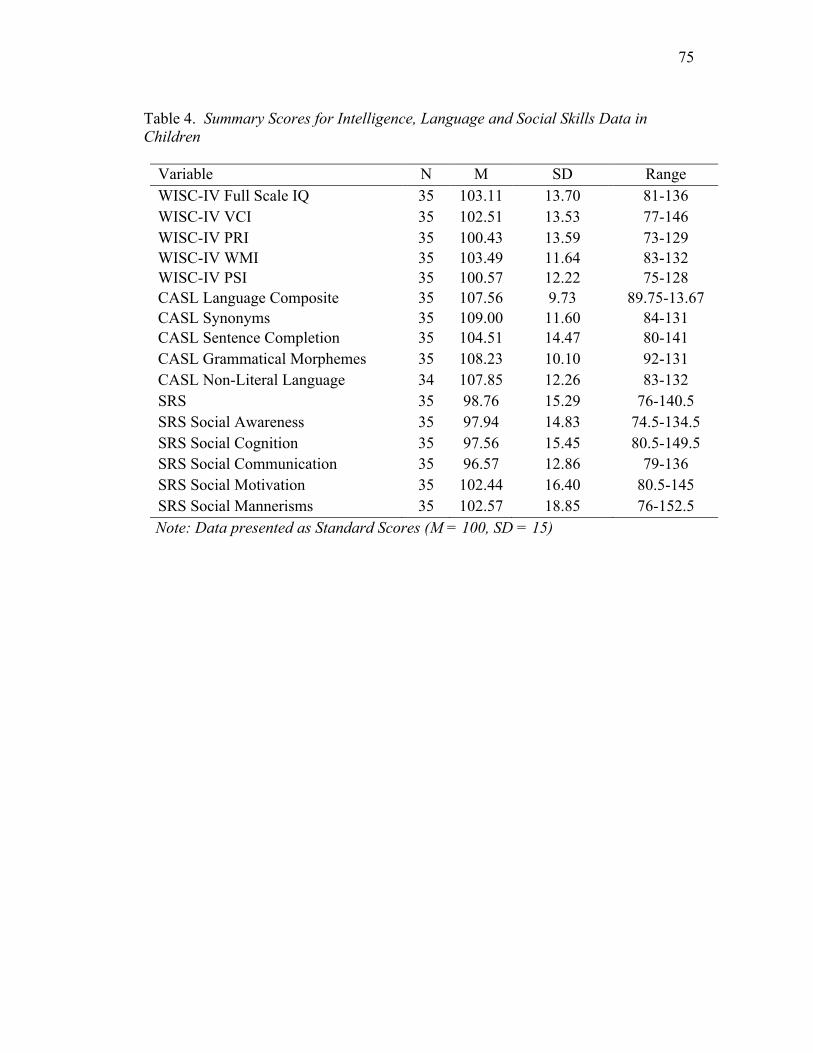
75
Table 4. Summary Scores for Intelligence, Language and Social Skills Data in Children
Variable N M SD Range WISC-IV Full Scale IQ 35 103.11 13.70 81-136 WISC-IV VCI 35 102.51 13.53 77-146 WISC-IV PRI 35 100.43 13.59 73-129 WISC-IV WMI 35 103.49 11.64 83-132 WISC-IV PSI 35 100.57 12.22 75-128 CASL Language Composite 35 107.56 9.73 89.75-13.67 CASL Synonyms 35 109.00 11.60 84-131 CASL Sentence Completion 35 104.51 14.47 80-141 CASL Grammatical Morphemes 35 108.23 10.10 92-131 CASL Non-Literal Language 34 107.85 12.26 83-132 SRS 35 98.76 15.29 76-140.5 SRS Social Awareness 35 97.94 14.83 74.5-134.5 SRS Social Cognition 35 97.56 15.45 80.5-149.5 SRS Social Communication 35 96.57 12.86 79-136 SRS Social Motivation 35 102.44 16.40 80.5-145 SRS Social Mannerisms 35 102.57 18.85 76-152.5
Note: Data presented as Standard Scores (M = 100, SD = 15)

76
Table 5. Reaction Time Results for the Lexical Processing Assessment in Children CohortCondition
Cohort None Rhyme Total Mean SEM Mean SEM Mean SEM Mean SEM
Pink
990.64
43.05
892.00
38.63
992.13
44.78
957.61
24.37
None
983.34
39.33
952.91
44.40
886.27
36.67
940.77
23.25
Convo
1051.47
47.27
844.61
37.76
940.30
44.32
946.29
25.17
Environm
entalCond.
Total
1008.98
25.06
896.38
23.32
938.97
24.28
948.17
14.01
Note: Reaction times are expressed in milliseconds

77
Table 6. Intercorrelations Between Intelligence and Language Variables in Children
Key:FSIQ=WISC‐IVFullScaleIQ;VCI=WISC‐IVVerbalComprehensionIndex;PRI=WISC‐IVPerceptualReasoningIndex;WMI=WISC‐IVWorkingMemoryIndex;PSI=WISC‐IVProcessingSpeedIndex;LC=CASLLanguageComposite;SYN=CASLSynonyms;SC=CASLSentenceCompletion;GM=CASLGrammaticalMorphemes;NL=CASLNonliteralLanguage;SRS=SocialResponsivenessScale
Variable FSIQ VCI PRI WMI PSI LC SYN SC GM NL SRS AGE FSIQ 1.000 VCI 0.828 1.000 PRI 0.838 0.686 1.000 WMI 0.633 0.508 0.334 1.000 PSI 0.724 0.401 0.546 0.360 1.000 LC 0.687 0.734 0.514 0.597 0.405 1.000 SYN 0.416 0.418 0.411 0.194 0.250 0.678 1.000 SC 0.655 0.741 0.469 0.559 0.401 0.889 0.461 1.000 GM 0.659 0.574 0.562 0.566 0.451 0.742 0.381 0.522 1.000 NL 0.380 0.505 0.120 0.517 0.183 0.829 0.267 0.722 0.482 1.000 SRS -0.025 -0.114 0.014 -0.103 -0.018 -0.259 -0.153 -0.201 -0.326 -0.140 1.000 AGE -0.065 0.005 -0.199 -0.221 -0.062 -0.011 -0.007 0.027 -0.161 0.121 0.085 1.000

78
Table 7. Intercorrelations Between Social Responsiveness Scale Variables in Children
Key: SRS=Social Responsiveness Scale; AWARE= SRS Social Awareness; COGN= SRS Social Cognition; COMM= SRS Social Communication; MOTIV= SRS Social Motivation; MANN=SRS Social Mannerisms
Variable SRS AWARE COGN COMM MOTIV MANN SRS 1.000 AWARE 0.794 1.000 COGN 0.896 0.658 1.000 COMM 0.915 0.702 0.738 1.000 MOTIV 0.782 0.667 0.656 0.604 1.000 MANN 0.860 0.503 0.784 0.793 0.480 1.000

79
Figure 1. Representation of Assessment Interface
Figure1.Representationofassessmentinterfacewithnocompetition,cohortcompetition,andrhymecompetitiontrials(lefttoright).Redboxindicatestarget,blackboxindicatescompetitor.

80
Figure 2. Assessment Design Schematic CohortCompetition
None
Cohort
Rhyme
None
bridecagedeskmoon
(nonoise)
shellshoetoy
sword(nonoise)
trainrainsticktree
(nonoise)
Pink
forkearthbikeflute
(pinknoise)
cloudclownnestglue
(pinknoise)
boxfoxglasssled
(pinknoise)
Environm
entalCom
petition
Conversatio
n
nursesoapdrumbench
(conversationnoise)
pillpigskullhat
(conversationnoise)
bearchairnutice
(conversationnoise)
Figure 2. Assessment design schematic. This schematic presented with representative sample stimuli. Red text indicates target, blue text indicates cohort competitor, gold text indicates rhyme competitor, black text indicates distractor.

81
Figure 3. Selection of Noun Stimuli
Corpus Name Age Range N Description Brown Adam 2;3-4;10
Eve 1;6-2;3 Sarah 2;3-5;1
3 Large longitudinal study of three children
Carterette 1st grade students 3rd grade students 5th grade students adults
54 48 48 24
Speech sample taken in simple social situations (groups of three)
Post Lew 1;10.20 – 2;8.7 She 1;7,18 – 2;5.8 Tow 1;7.5 -2;5.3
3 10 free play sessions over a 9 month period in the child’s home
Sachs 1.1 – 5;1 1 Longitudinal naturalistic study Suppes 1;11 – 3;11 1 Longitudinal study of a single child Warren-Leubecker
1;6 – 3;1 4;6 – 6;2
10 10
Parent-child interactions
Figure 3. Selection of Noun Stimuli. This is a summary of corpra selected from the CHILDES database for use in the selection of noun stimuli.

82
Figure 4. LPA Response Time in Young Adults (Cohort Competition Trials)

83
Figure 5. LPA Response Time in Young Adults

84
Figure 6. Visual Representation of Outliers in Intelligence and Language Measures

85

86
Figure 7. LPA Response Time in Children (Cohort Competition Trials)

87
Figure 8. Visual Representation of Removed Outlier in Verbal Comprehension Index

88
Figure 9. The Relationship Between Lexical Processing Speed and Working Memory in Children

89
Figure 10. The Relationship Between Lexical Processing Speed and Language Composite in Children

90
Figure 11. The Relationship Between Lexical Processing Speed and Synonyms in Children

91
Figure 12. The Relationship Between Lexical Processing Speed and Sentence Completion in Children

92
Figure 13. The Relationship Between Lexical Processing Speed and Grammatical Morphemes in Children

93
Figure 14. The Relationship Between Lexical Processing Speed and Nonliteral Language in Children

94
Figure 15. The Relationship Between Lexical Processing Speed and Autistic Symptomology in Children

95
Figure 16. The Relationship Between Lexical Processing Speed and Social Awareness in Children

96
Figure 17. The Relationship Between Lexical Processing Speed and Social Communication in Children

97
Figure 18. The Relationship Between Lexical Processing Speed and Social Motivation in Children

98
Figure 19. Visual Representation of Removed Outlier in SRS Social Cognition

99
Figure 20. The Relationship Between Lexical Processing Speed and Social Cognition in Children

100
Appendix A: Linear Mixed Models in Young Adults FullModelRandomEffectsinYoungAdultsADULTMODEL.lmer<‐RESPONSETIME~1+(1|SLIDE#)+(1+TARGETPOSITION|SUBJECT#)+(1|SLIDEORDER)LexicalProcessinginYoungAdultsCohortConditionADULTMODEL.lmer<‐lmer(RESPONSETIME~(1|SLIDE#)+(1+TARGETPOSITION|SUBJECT#)+(1|SLIDEORDER))ADULTMODEL.lmer<‐lmer(RESPONSETIME~COHORTCONDITION+(1|SLIDE#)+(1+TARGETPOSITION|SUBJECT#)+(1|SLIDEORDER))EnvironmentalConditionADULTMODEL.lmer<‐lmer(RESPONSETIME~(1|SLIDE#)+(1+TARGETPOSITION|SUBJECT#)+(1|SLIDEORDER))ADULTMODEL.lmer<‐lmer(RESPONSETIME~ENVIRONMENTALCONDITION+(1|SLIDE#)+(1+TARGETPOSITION|SUBJECT#)+(1|SLIDEORDER))Interaction(Cohort*Environment)ADULTMODEL.lmer<lmer(RESPONSETIME~COHORTCONDITION+(1|SLIDE#)+(1+TARGETPOSITION|SUBJECT#)+(1|SLIDEORDER))ADULTMODEL.lmer<‐lmer(RESPONSETIME~COHORTCONDITION+COHORTCONDITION*ENVIRONMENTALCONDITION+(1|SLIDE#)+(1+TARGETPOSITION|SUBJECT#)+(1|SLIDEORDER))

101
LexicalProcessingandIntelligenceinYoungAdultsADULTMODEL.lmer<‐lmer(RESPONSETIME~COHORTCONDITION+COHORTCONDITION*ENVIRONMENTALCONDITION+(1|SLIDE#)+(1+TARGETPOSITION|SUBJECT#)+(1|SLIDEORDER))ADULTMODEL.lmer<‐lmer(RESPONSETIME~COHORTCONDITION+COHORTCONDITION*ENVIRONMENTALCONDITION+FSIQ+(1|SLIDE#)+(1+TARGETPOSITION|SUBJECT#)+(1|SLIDEORDER))*VIQ and PIQ were tested in this model individually, replacing FSIQ SupplementaryAnalysisLexicalProcessingandIntelligenceinYoungAdultsADULTMODEL.lmer<‐lmer(RESPONSETIME~COHORTCONDITION+(1|SLIDE#)+(1+TARGETPOSITION|SUBJECT#)+(1|SLIDEORDER)+(FSIQ|SLIDE#))ADULTMODEL.lmer<‐lmer(RESPONSETIME~COHORTCONDITION+FSIQ+(1|SLIDE#)+(1+TARGETPOSITION|SUBJECT#)+(1|SLIDEORDER)+(FSIQ|SLIDE#))LexicalProcessingandWorkingMemoryinYoungAdultsADULTMODEL.lmer<‐lmer(RESPONSETIME~COHORTCONDITION+COHORTCONDITION*ENVIRONMENTALCONDITION+(1|SLIDE#)+(1+TARGETPOSITION|SUBJECT#)+(1|SLIDEORDER))ADULTMODEL.lmer<‐lmer(RESPONSETIME~COHORTCONDITION+COHORTCONDITION*ENVIRONMENTALCONDITION+WMI+(1|SLIDE#)+(1+TARGETPOSITION|SUBJECT#)+(1|SLIDEORDER))SupplementaryAnalysisLexicalProcessingandWorkingMemoryinYoungAdultsADULTMODEL.lmer<‐lmer(RESPONSETIME~COHORTCONDITION+COHORTCONDITION*ENVIRONMENTALCONDITION+(1|SLIDE#)+(1+TARGETPOSITION|SUBJECT#)+(1|SLIDEORDER)+(WMI|SLIDE#))ADULTMODEL.lmer<‐lmer(RESPONSETIME~WMI+COHORTCONDITION+COHORTCONDITION*ENVIRONMENTALCONDITION+(1|SLIDE#)+(1+TARGETPOSITION|SUBJECT#)+(1|SLIDEORDER)+(WMI|SLIDE#))

102
LexicalProcessingandLanguageSkillsinYoungAdultsADULTMODEL.lmer<‐lmer(RESPONSETIME~COHORTCONDITION+COHORTCONDITION*ENVIRONMENTALCONDITION+(1|SLIDE#)+(1+TARGETPOSITION|SUBJECT#)+(1|SLIDEORDER))ADULTMODEL.lmer<‐lmer(RESPONSETIME~COHORTCONDITION+COHORTCONDITION*ENVIRONMENTALCONDITION+LANGUAGECOMPOSITE+(1|SLIDE#)+(1+TARGETPOSITION|SUBJECT#)+(1|SLIDEORDER))*Synonyms, Sentence Completion, Grammatical Morphemes, and Non-literal Language were tested in this model individually, replacing Language Composite. SupplementaryAnalysisLexicalProcessingandLanguageSkillsinYoungAdultsADULTMODEL.lmer<‐lmer(RESPONSETIME~COHORTCONDITION+COHORTCONDITION*ENVIRONMENTALCONDITION+(1|SLIDE#)+(1+TARGETPOSITION|SUBJECT#)+(1|SLIDEORDER)+(LANGUAGECOMPOSITE|SLIDE#))ADULTMODEL.lmer<‐lmer(RESPONSETIME~COHORTCONDITION+COHORTCONDITION*ENVIRONMENTALCONDITION+LANGUAGECOMPOSITE+(1|SLIDE#)+(1+TARGETPOSITION|SUBJECT#)+(1|SLIDEORDER)+(LANGUAGECOMPOSITE|SLIDE#))

103
Appendix B: Linear Mixed Models in Children FullModelRandomEffectsinChildrenCHILDMODEL.lmer<‐RESPONSETIME~1+(1|SLIDE#)+(1+TARGETPOSITION|SUBJECT#)LexicalProcessinginChildrenCohortConditionCHILDMODEL.lmer<‐lmer(RESPONSETIME~AGE+(1|SLIDE#)+(1+TARGETPOSITION|SUBJECT#))CHILDMODEL.lmer<‐lmer(RESPONSETIME~AGE+COHORTCONDITION+(1|SLIDE#)+(1+TARGETPOSITION|SUBJECT#))EnvironmentalConditionCHILDMODEL.lmer<‐lmer(RESPONSETIME~AGE+(1|SLIDE#)+(1+TARGETPOSITION|SUBJECT#))CHILDMODEL.lmer<‐lmer(RESPONSETIME~AGE+ENVIRONMENTALCONDITION+(1|SLIDE#)+(1+TARGETPOSITION|SUBJECT#))Interaction(Cohort*Environment)CHILDMODEL.lmer<lmer(RESPONSETIME~AGE+COHORTCONDITION+(1|SLIDE#)+(1+TARGETPOSITION|SUBJECT#))CHILDMODEL.lmer<‐lmer(RESPONSETIME~AGE+COHORTCONDITION+COHORTCONDITION*ENVIRONMENTALCONDITION+(1|SLIDE#)+(1+TARGETPOSITION|SUBJECT#))LexicalProcessingandIntelligenceinChildrenCHILDMODEL.lmer<‐lmer(RESPONSETIME~AGE+SRS+COHORTCONDITION+(1|SLIDE#)+(1+TARGETPOSITION|SUBJECT#))CHILDMODEL.lmer<‐lmer(RESPONSETIME~FSIQ+AGE+SRS+COHORTCONDITION+(1|SLIDE#)+(1+TARGETPOSITION|SUBJECT#))Note:VCI,PSI,WMI,PRIweretestedindividually,replacingFSIQinthismodelInaseparateanalysis,LanguageCompositewasaddedtothismodelLexicalProcessingandLanguageSkillsinChildrenCHILDMODEL.lmer<‐lmer(RESPONSETIME~AGE+SRS+COHORTCONDITION+(1|SLIDE#)+(1+TARGETPOSITION|SUBJECT#))CHILDMODEL.lmer<‐lmer(RESPONSETIME~LANGUAGECOMPOSITE+AGE+SRS+

104
COHORTCONDITION+(1|SLIDE#)+(1+TARGETPOSITION|SUBJECT#))Note:SYN,SC,GM,andNLweretestedinthismodelindividually,replacingLanguageComposite.LexicalProcessingandAutisticSymptomologyinChildrenCHILDMODEL.lmer<‐lmer(RESPONSETIME~AGE+COHORTCONDITION+(1|SLIDE#)+(1+TARGETPOSITION|SUBJECT#))CHILDMODEL.lmer<‐lmer(RESPONSETIME~SRS+AGE+COHORTCONDITION+(1|SLIDE#)+(1+TARGETPOSITION|SUBJECT#))Note:SocialAwareness,SocialCognition,SocialCommunication,SocialMotivation,andSocialMannerismweretestedindividually,replacingSRSinthismodel

105
Vita
Erin Abrigo
Education: Drexel University, Philadelphia, PA Ph.D., Clinical Psychology (2012) SmithCollege,Northampton,MAB.A.,Psychology(2002)Minor:PhilosophyTraining: JamesA.HaleyVeterans’Hospital,Tampa,FL,
PredoctoralInternshipinClinicalPsychology(2012)JamesA.HaleyVeterans’Hospital,Tampa,FL,
PostdoctoralfellowshipinRehabilitationPsychology(2012‐present)