relationships between normal faults and gas migration in south taranaki, new zealand
TRANSCRIPT

GNS Science
Relationships between normal faults and gas migration in
South Taranaki, New Zealand
Brad Ilg, Jan Baur, Andy Nicol, Rob Funnell, Miko Fohrmann, Mike Milner(scheduled to be submitted to AAPG Bulletin in 2009)

GNS Science
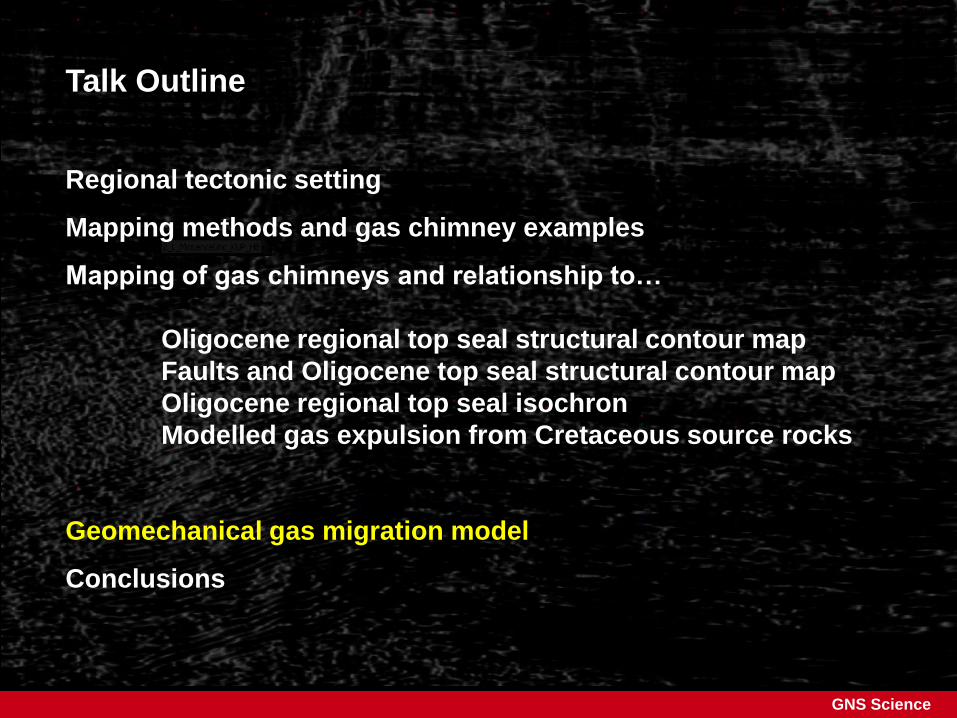
Talk Outline
Regional tectonic setting
Mapping methods and gas chimney examples
Mapping of gas chimneys and relationship to…
Oligocene regional top seal structural contour map
Faults and Oligocene top seal structural contour map
Oligocene regional top seal isochron
Modelled gas expulsion from Cretaceous source rocks
Geomechanical gas migration model
Conclusions

GNS Science
Southern Inversion Zone
Wanganui
Basin
Taranaki
Graben
STUDY REGION
~75% NZ oil & gas come from the area.
Large areas remain unexplored;
potential billions $$ to NZ GDP.

GNS Science
Taranaki Graben (TG)
1) Cretaceous extension (source)
2) Paleocene-Eocene passive margin
(source, reservoir, seal)
3) Oligocene maximum flooding (seal)
4) Miocene shortening (traps; 2nd res/seal)
5) Pliocene burial (maturation)
6) Plio-Pleistocene extension (2nd migration)
A’
A
Southern tip of
back-arc-basin
(BAB)
TG
A A’
5 km
10 km
15 km
12 3
4
Western Platform Taranaki Graben Wanganui Basin
Tane-1 Maui-3 Toru-1 Rimu-B1
56
~500 km long geomodel

GNS Science
Talk Outline
Regional tectonic setting
Mapping methods and gas chimney examples
Mapping of gas chimneys and relationship to…
Oligocene regional top seal structural contour map
Faults and Oligocene top seal structural contour map
Oligocene regional top seal isochron
Modelled gas expulsion from Cretaceous source rocks
Geomechanical gas migration model
Conclusions

GNS Science
2D and 3D lines viewed in
talk shown as thin red line.
Actively viewed line is in
bold
50 km
~8000 km2 area
>5000 line-km 2D seismic
~385 km2 3D seismic
Some available data

GNS Science
Basic set-up: manual chimney mapping using single seismic attribute-
Semblance (“slowness of energy return”) good for faults, fractures, fluids
Kerry 3D volume, east-west cross-line 2178, SEM, 15 km wide x ~6 km deep
Current line
shown in bold
Gas imaged leaking into water column circa 1985 and 1996

GNS Science
Toru-1
Kerry3D inline 2400 ~40 x 7 km
Petroleum system
overview
Pleistocene UC
Pliocene
overburden
Late Miocene UC
Miocene Reservoirs
Paleogene seals,
reservoirs, source
Cretaceous source
rock

GNS Science
Line sk10-2664-SEM, 40 km x ~5 km deep
Manaia Fault
strands
Taranaki
Fault
Late Miocene UC
“leaking” faults (type 1)Kupe-1
well
vertical gas chimney (type 2)Sea floor
Inse
t bo
x n
ext s
lide
GNS Science
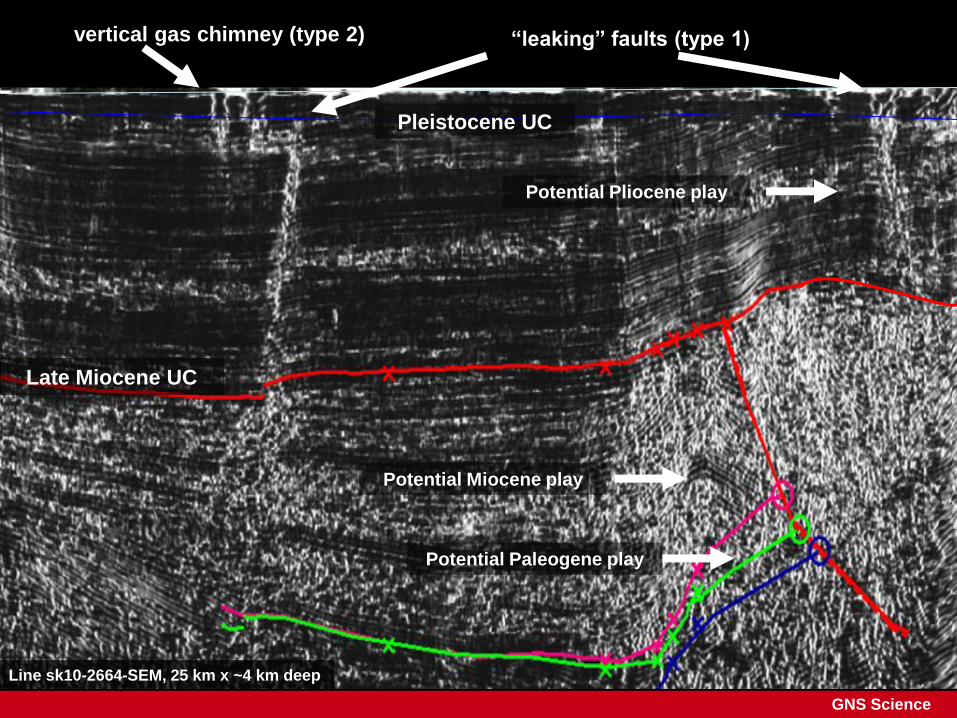
Late Miocene UC
Line sk10-2664-SEM, 25 km x ~4 km deep
“leaking” faults (type 1)vertical gas chimney (type 2)
Pleistocene UC
Potential Paleogene play
Potential Miocene play
Potential Pliocene play

GNS Science
Cape Egmont Fault tip
“not leaking”
Late Miocene UC
Plio-Pleistocene UC
Cape Egmont “not leaking” at surface
Line tnz81-630a-2338, 36 km x ~5 km deep

GNS Science
Talk Outline
Regional tectonic setting
Mapping methods and gas chimney examples
Mapping of gas chimneys and relationship to…
Oligocene regional top seal structural contour map
Faults and Oligocene top seal structural contour map
Oligocene regional top seal isochron
Modelled gas expulsion from Cretaceous source rocks
Geomechanical gas migration model
Conclusions

GNS Science
Chimneys and top seal structural contour (ms TWT)
migrations
across TF
•HW play
•FW play
migrations
across CEF

GNS Science
Late Neogene faults and structural closure on top seal contour (ms TWT)
High structural
permeability
on anticlines
Low structural
permeability
on anticlines
Type 1
Type 2

GNS Science
Chimneys & regional Oligocene top seal thicknessType 1
Type 2
High Oligocene
top-seal
permeability
Low
Oligocene
top-seal
permeability
200 ms TWT isochron

GNS Science
Exp
uls
ion
from
Cre
taceo
us s
ou
rce
High Oligocene
top-seal
permeability
Low structural
permeability
High structural permeability
on anticlines
Oligocene seal
200 ms TWT
isochron
Low Oligocene
top-seal
permeability
GNS Science
Talk Outline
Regional tectonic setting
Mapping methods and gas chimney examples
Mapping of gas chimneys and relationship to…
Oligocene regional top seal structural contour map
Faults and Oligocene top seal structural contour map
Oligocene regional top seal isochron
Modelled gas expulsion from Cretaceous source rocks
Geomechanical gas migration model
Conclusions

GNS Science
Stern et al., 1992
Fault nucleation controlled by
flexure of anticlines in modern
tectonic setting.
Fault orientation controlled by
far field back-arc basin plate
tectonic stresses.
Faults open
on highs
Faults
closed?
Top seal
open
Top seal
closed?Shallow
plays

GNS Science
Numerically modelled strain (left) and experimentally deformed natural
analogue (right) for flexural deformation (from Couples et al., 2007).
Htz82a-118 Sk10-2664
Taranaki Fault
c.f. heterogeneous Taranaki Graben initial Plio-Pleistocene condition.
~85 x ~ 6 km
Cape Egmont Fault

GNS Science
“Academic” conclusions and tentative predictions
•The Taranaki and Cape Egmont faults appear relatively impermeable at their tips.
However, discrete zones along them appear to be highly permeable allowing for
hydrocarbon migration out of the Graben, i.e. bulk horizontal fault permeability > bulk
vertical fault permeability on these large-throw structures.
•High structural permeability is largely confined to north (consistent with Stern et al.,
1992 flexural modelling and Nicol et al., 2007 finite strain mapping). This is a back-arc
tip-migration effect enhanced by Miocene and earlier structural amplitude. Once the
tip has passed, dilation evolves to slip, structural permeability decreases.
•High top seal permeability is largely confined to west. This is an effect of Paleogene
plate boundary foreland basin deposition.
•Subduction and back-arc basin-related flexural deformation convey high structural
permeability to the Taranaki Graben relative to Western Platform.

GNS Science
“Practical” conclusions and tentative predictions
New exploration opportunities may exist in several general locations:
•Miocene plays where regional Oligocene top seal is thin (e.g. Maari, Moki).
•Paleogene plays south of zone of high structural permeability and east of 200
ms TWT regional seal isochron (charge and top seal limited, e.g. Tahi-1).
•Paleogene and Miocene plays in high structural permeability zones on flanks of
anticlines and in soft linked relays (not easily predicted, e.g. Kupe South??) .
•Taranaki Fault footwall zone between leaking steps in fault trace (big volume?).
•Taranaki Fault hanging-wall in Pliocene strata of same area (risky-untested?).

GNS Science
Acknowledgements
• The authors thank the Kupe Joint Venture [Origin Energy Resources (Kupe) Limited,
Genesis Energy Limited, New Zealand Oil & Gas Limited, and Mitsui & Co. Limited] for the
provision of the reprocessed 3D seismic reflection volume used in this study.
• Badleys Geosciences for the provision of an academic license of TrapTester software.
Schlumberger for the provision of an academic license for Petrel software (Baur) and Paul
de Groot for the provision of an OpendTect license (Baur) used in this study.
• This work, part of wider public good studies of the basin systems of New Zealand, was
funded by the New Zealand Government FRST contract C05X0905.

GNS Science
Neural networks (de Groot, 1999) are applied to attributes inc. similarity, absolute energy, variance.
1) Neural network is trained on the attributes extracted at chimney and non-chimney example locations
and then applied to the entire data set.
2) Neural network classifies seismic data into chimney (red) and non-chimney samples (light blue).
3) Output samples are assigned high values for chimneys and low values for non-chimneys (e.g. below)
Neural network mapping of
meta-attributes.
Example neural network
training exercise (right)
and application to 2D line
hzt82a-136 (below)
1 2
3 type 2 type 2? type 1 type 1 type 2