relative quantification quantstudio 3d analysissuite software
TRANSCRIPT

HELP
For Research Use Only. Not for use in diagnostic procedures.
QuantStudio™ 3D AnalysisSuite™ Software:Relative Quantificationfor use with QuantStudio™ 3D Digital PCR System and QuantStudio™ 3DAnalysisSuite™ Server System
Publication Number MAN0009636
Revision A.0

For Research Use Only. Not for use in diagnostic procedures.
The information in this guide is subject to change without notice.
DISCLAIMER
LIFE TECHNOLOGIES CORPORATION AND/OR ITS AFFILIATE(S) DISCLAIM ALL WARRANTIES WITH RESPECT TO THIS DOCUMENT, EXPRESSED ORIMPLIED, INCLUDING BUT NOT LIMITED TO THOSE OF MERCHANTABILITY, FITNESS FOR A PARTICULAR PURPOSE, OR NON-INFRINGEMENT. TOTHE EXTENT ALLOWED BY LAW, IN NO EVENT SHALL LIFE TECHNOLOGIES AND/OR ITS AFFILIATE(S) BE LIABLE, WHETHER IN CONTRACT, TORT,WARRANTY, OR UNDER ANY STATUTE OR ON ANY OTHER BASIS FOR SPECIAL, INCIDENTAL, INDIRECT, PUNITIVE, MULTIPLE OR CONSEQUENTIALDAMAGES IN CONNECTION WITH OR ARISING FROM THIS DOCUMENT, INCLUDING BUT NOT LIMITED TO THE USE THEREOF.
Trademarks
Microsoft, Windows, and Excel are registered trademarks of Microsoft Corporation. Adobe and Reader are registered trademarks of Adobe Systems,Inc. RedHat is a registered trademark of Red Hat, Inc. Linux is a registered trademark of Linus Torvalds. All other trademarks are the property ofThermo Fisher Scientific and its subsidiaries.
Life Technologies is a Thermo Fisher Scientific brand. ©2014 Thermo Fisher Scientific Inc. All rights reserved.

Contents
QuantStudio™ 3D AnalysisSuite™ Software Help: RelativeQuantification . . . . . . . . . . . . . . . . . . . . . . . . . . . . . . . . . . . . . . . . . . . . . . . . . . . . . . . . . . . . . . 6
■ About this Help system .. . . . . . . . . . . . . . . . . . . . . . . . . . . . . . . . . . . . . . . . . . . . . . . . . . . 7
Revision history . . . . . . . . . . . . . . . . . . . . . . . . . . . . . . . . . . . . . . . . . . . . . . . . . . . . . . . . . . . . . . . . . 7
Purpose . . . . . . . . . . . . . . . . . . . . . . . . . . . . . . . . . . . . . . . . . . . . . . . . . . . . . . . . . . . . . . . . . . . . . . . 7
Prerequisites . . . . . . . . . . . . . . . . . . . . . . . . . . . . . . . . . . . . . . . . . . . . . . . . . . . . . . . . . . . . . . . . . . . 7
Obtain information from the Help system . . . . . . . . . . . . . . . . . . . . . . . . . . . . . . . . . . . . . . . . . . 7
■ CHAPTER 1 Analysis workflow .. . . . . . . . . . . . . . . . . . . . . . . . . . . . . . . . . . . . . . . . 9
Relative Quantification analysis workflow . . . . . . . . . . . . . . . . . . . . . . . . . . . . . . . . . . . . . . . . . . 9
■ CHAPTER 2 Create a project . . . . . . . . . . . . . . . . . . . . . . . . . . . . . . . . . . . . . . . . . . . 10
Create a project . . . . . . . . . . . . . . . . . . . . . . . . . . . . . . . . . . . . . . . . . . . . . . . . . . . . . . . . . . . . . . . . 10
■ CHAPTER 3 Import chip data . . . . . . . . . . . . . . . . . . . . . . . . . . . . . . . . . . . . . . . . . . 11
Import from shared storage . . . . . . . . . . . . . . . . . . . . . . . . . . . . . . . . . . . . . . . . . . . . . . . . . . . . . 11
Import from local source . . . . . . . . . . . . . . . . . . . . . . . . . . . . . . . . . . . . . . . . . . . . . . . . . . . . . . . . 12
■ CHAPTER 4 Define chip settings . . . . . . . . . . . . . . . . . . . . . . . . . . . . . . . . . . . . . . 13
Set up assays . . . . . . . . . . . . . . . . . . . . . . . . . . . . . . . . . . . . . . . . . . . . . . . . . . . . . . . . . . . . . . . . . . 13
Set up samples . . . . . . . . . . . . . . . . . . . . . . . . . . . . . . . . . . . . . . . . . . . . . . . . . . . . . . . . . . . . . . . . 15
Set up dilutions . . . . . . . . . . . . . . . . . . . . . . . . . . . . . . . . . . . . . . . . . . . . . . . . . . . . . . . . . . . . . . . . 15
Import chip setup . . . . . . . . . . . . . . . . . . . . . . . . . . . . . . . . . . . . . . . . . . . . . . . . . . . . . . . . . . . . . . 16
■ CHAPTER 5 View the data quality for each chip . . . . . . . . . . . . . . . . . . . . . . 17
Review chip quality . . . . . . . . . . . . . . . . . . . . . . . . . . . . . . . . . . . . . . . . . . . . . . . . . . . . . . . . . . . . . 17
Set the quality threshold . . . . . . . . . . . . . . . . . . . . . . . . . . . . . . . . . . . . . . . . . . . . . . . . . . . . . . . . 18
Omit chip results . . . . . . . . . . . . . . . . . . . . . . . . . . . . . . . . . . . . . . . . . . . . . . . . . . . . . . . . . . . . . . . 19
QuantStudio™ 3D AnalysisSuite™ Software Help: Relative Quantification 3

■ CHAPTER 6 View the Relative Quantification calls . . . . . . . . . . . . . . . . . . 21
About the Relative Quantification calls . . . . . . . . . . . . . . . . . . . . . . . . . . . . . . . . . . . . . . . . . . . . 21
Review the Relative Quantification calls . . . . . . . . . . . . . . . . . . . . . . . . . . . . . . . . . . . . . . . . . . . 23Edit calls . . . . . . . . . . . . . . . . . . . . . . . . . . . . . . . . . . . . . . . . . . . . . . . . . . . . . . . . . . . . . . . . . 24Undo or Reset manual calls . . . . . . . . . . . . . . . . . . . . . . . . . . . . . . . . . . . . . . . . . . . . . . . . . 26Omit chip data . . . . . . . . . . . . . . . . . . . . . . . . . . . . . . . . . . . . . . . . . . . . . . . . . . . . . . . . . . . . . 26
Scatter plot . . . . . . . . . . . . . . . . . . . . . . . . . . . . . . . . . . . . . . . . . . . . . . . . . . . . . . . . . . . . . . . . . . . 27Save the Scatter plot . . . . . . . . . . . . . . . . . . . . . . . . . . . . . . . . . . . . . . . . . . . . . . . . . . . . . . . 27Print the Scatter plot . . . . . . . . . . . . . . . . . . . . . . . . . . . . . . . . . . . . . . . . . . . . . . . . . . . . . . . 27
■ CHAPTER 7 View the analysis results for a project . . . . . . . . . . . . . . . . . 28
About the Relative Quantification results . . . . . . . . . . . . . . . . . . . . . . . . . . . . . . . . . . . . . . . . . . 28
Review the Relative Quantification results . . . . . . . . . . . . . . . . . . . . . . . . . . . . . . . . . . . . . . . . . 29
■ CHAPTER 8 View the analysis results for each chip . . . . . . . . . . . . . . . . . 31
About the Relative Quantification replicate results . . . . . . . . . . . . . . . . . . . . . . . . . . . . . . . . . 31
Review the Relative Quantification replicate results . . . . . . . . . . . . . . . . . . . . . . . . . . . . . . . . 32
■ CHAPTER 9 View the Relative Quantification analysis and displaysettings . . . . . . . . . . . . . . . . . . . . . . . . . . . . . . . . . . . . . . . . . . . . . . . . . . . . . . . . . . . . . . . . . . . . 33
About the confidence interval (CI) . . . . . . . . . . . . . . . . . . . . . . . . . . . . . . . . . . . . . . . . . . . . . . . . 33
About precision . . . . . . . . . . . . . . . . . . . . . . . . . . . . . . . . . . . . . . . . . . . . . . . . . . . . . . . . . . . . . . . . 34
■ CHAPTER 10 Export data . . . . . . . . . . . . . . . . . . . . . . . . . . . . . . . . . . . . . . . . . . . . . . 35
Export chip setup . . . . . . . . . . . . . . . . . . . . . . . . . . . . . . . . . . . . . . . . . . . . . . . . . . . . . . . . . . . . . . 35
Export project level results . . . . . . . . . . . . . . . . . . . . . . . . . . . . . . . . . . . . . . . . . . . . . . . . . . . . . 35
Export projects . . . . . . . . . . . . . . . . . . . . . . . . . . . . . . . . . . . . . . . . . . . . . . . . . . . . . . . . . . . . . . . . 36
■ CHAPTER 11 Manage the Results plot . . . . . . . . . . . . . . . . . . . . . . . . . . . . . . . . 37
Save the Results plot . . . . . . . . . . . . . . . . . . . . . . . . . . . . . . . . . . . . . . . . . . . . . . . . . . . . . . . . . . . 37
Print the Results plot . . . . . . . . . . . . . . . . . . . . . . . . . . . . . . . . . . . . . . . . . . . . . . . . . . . . . . . . . . . 37
■ CHAPTER 12 Manage projects . . . . . . . . . . . . . . . . . . . . . . . . . . . . . . . . . . . . . . . . . 38
View the list of projects . . . . . . . . . . . . . . . . . . . . . . . . . . . . . . . . . . . . . . . . . . . . . . . . . . . . . . . . . 38
Create a project . . . . . . . . . . . . . . . . . . . . . . . . . . . . . . . . . . . . . . . . . . . . . . . . . . . . . . . . . . . . . . . . 38
Open a project . . . . . . . . . . . . . . . . . . . . . . . . . . . . . . . . . . . . . . . . . . . . . . . . . . . . . . . . . . . . . . . . . 39
Copy a project . . . . . . . . . . . . . . . . . . . . . . . . . . . . . . . . . . . . . . . . . . . . . . . . . . . . . . . . . . . . . . . . . 39
Import a project . . . . . . . . . . . . . . . . . . . . . . . . . . . . . . . . . . . . . . . . . . . . . . . . . . . . . . . . . . . . . . . . 39
Contents
4 QuantStudio™ 3D AnalysisSuite™ Software Help: Relative Quantification

■ CHAPTER 13 Manage project properties . . . . . . . . . . . . . . . . . . . . . . . . . . . . . 40
View the project summary . . . . . . . . . . . . . . . . . . . . . . . . . . . . . . . . . . . . . . . . . . . . . . . . . . . . . . . 40
Rename a project . . . . . . . . . . . . . . . . . . . . . . . . . . . . . . . . . . . . . . . . . . . . . . . . . . . . . . . . . . . . . . 40
Add comments to a project . . . . . . . . . . . . . . . . . . . . . . . . . . . . . . . . . . . . . . . . . . . . . . . . . . . . . . 41
■ CHAPTER 14 Manage project display settings . . . . . . . . . . . . . . . . . . . . . . . 42
Apply a filter . . . . . . . . . . . . . . . . . . . . . . . . . . . . . . . . . . . . . . . . . . . . . . . . . . . . . . . . . . . . . . . . . . 42
Change the display of table data . . . . . . . . . . . . . . . . . . . . . . . . . . . . . . . . . . . . . . . . . . . . . . . . . 42
■ CHAPTER 15 About the Software Quality Metrics . . . . . . . . . . . . . . . . . . . 44
About chip quality . . . . . . . . . . . . . . . . . . . . . . . . . . . . . . . . . . . . . . . . . . . . . . . . . . . . . . . . . . . . . . 44
Factors contributing to quality value assessment . . . . . . . . . . . . . . . . . . . . . . . . . . . . . . . . . . 44Contrast assessment . . . . . . . . . . . . . . . . . . . . . . . . . . . . . . . . . . . . . . . . . . . . . . . . . . . . . . . 45Spatial uniformity assessment . . . . . . . . . . . . . . . . . . . . . . . . . . . . . . . . . . . . . . . . . . . . . . 45
About the quality threshold . . . . . . . . . . . . . . . . . . . . . . . . . . . . . . . . . . . . . . . . . . . . . . . . . . . . . . 46
About data quality flags . . . . . . . . . . . . . . . . . . . . . . . . . . . . . . . . . . . . . . . . . . . . . . . . . . . . . . . . . 47
■ CHAPTER 16 Troubleshooting . . . . . . . . . . . . . . . . . . . . . . . . . . . . . . . . . . . . . . . . . 48
Troubleshooting quality flags in the software . . . . . . . . . . . . . . . . . . . . . . . . . . . . . . . . . . . . . . 48
Troubleshooting chip images using the Chip View . . . . . . . . . . . . . . . . . . . . . . . . . . . . . . . . . . 49
Troubleshooting analysis results . . . . . . . . . . . . . . . . . . . . . . . . . . . . . . . . . . . . . . . . . . . . . . . . . 52
■ Documentation and support . . . . . . . . . . . . . . . . . . . . . . . . . . . . . . . . . . . . . . . . . . . . . 54
Related documentation . . . . . . . . . . . . . . . . . . . . . . . . . . . . . . . . . . . . . . . . . . . . . . . . . . . . . . . . . 54
Obtaining support . . . . . . . . . . . . . . . . . . . . . . . . . . . . . . . . . . . . . . . . . . . . . . . . . . . . . . . . . . . . . . 54
Limited product warranty . . . . . . . . . . . . . . . . . . . . . . . . . . . . . . . . . . . . . . . . . . . . . . . . . . . . . . . 55
Contents
QuantStudio™ 3D AnalysisSuite™ Software Help: Relative Quantification 5

QuantStudio™ 3D AnalysisSuite™ SoftwareHelp: Relative Quantification
Welcome to the QuantStudio™ 3D AnalysisSuite™ Software Help: Relative Quantification.
The Relative Quantification module allows you to quantify the amount of a targetrelative to total genetic material interrogated using digital PCR (dPCR). This analysismodule is ideal for ratio analysis or low-fold detection to perform applications such ascopy number variation on the QuantStudio™ 3D Digital PCR 20K Chip. Up to 100chips can be combined and analyzed in a single project, to automatically display ascatter plot based on the observed FAM™ dye,VIC® dye, and undetermined dye signalevents. For further quality control, you can manually define the boundaries of theseevents and use the software to calculate a ratio of rare to wild-type events across thechips in a project.
Use the Table of Contents in the left navigation pane to find your topic of interest, orenter your search term(s) in the Search field above (see “Obtain information from theHelp system” on page 7).
6 QuantStudio™ 3D AnalysisSuite™ Software Help: Relative Quantification

About this Help system
Revision history
Revision Date Description Pub. no.
A.0 February2014
New Product- help documentationfor use and navigation of the server-based QuantStudio™ 3DAnalysisSuite™ Software designed toanalyze Relative Quantificationdigital PCR experiments.
MAN0009636
Purpose
This Help system provides step-by-step instructions for using the server-basedQuantStudio™ 3D AnalysisSuite™ Software to analyze Relative Quantification digitalPCR experiment data generated by the QuantStudio™ 3D Digital PCR System anddescribes how to troubleshoot the data.
Prerequisites
This Help system assumes that you have access to and are familiar with theprocedures provided in the QuantStudio™ 3D Digital PCR System User Guide (see “Related documentation” on page 54).
This Help system also assumes that you have a general understanding of:• Data storage, file transfers, and copying and pasting.• The Red Hat® Enterprise Linux® and Microsoft® Windows® operating systems,
the Internet, and Internet-based browsers.
Obtain information from the Help system
The QuantStudio™ 3D AnalysisSuite™ Software features a Help system that describeshow to use each feature of the user interface. You can use the Help system to findtopics of interest by:
• Reviewing the table of Contents in the sidebar.
QuantStudio™ 3D AnalysisSuite™ Software Help: Relative Quantification 7

• Searching for a specific topic – Enter your search term in the Search field in theupper right, then click Enter. The search results will appear under the Search tabin the sidebar.
To access the Help system click from any screen.
About this Help systemObtain information from the Help system
8 QuantStudio™ 3D AnalysisSuite™ Software Help: Relative Quantification

Analysis workflow
Relative Quantification analysis workflow
The following figure shows the workflow for analyzing dual reporter digital PCRexperiments using the Relative Quantification module of the AnalysisSuite™ Software.
START
q
Select the Relative Quantification module
q
Create a project
q
Import chip data
q
Define the assays, samples, and dilutions for each chip (optional)
q
Review chip quality and adjust quality threshold (optional)
q
Review data point calls and manually assign calls (optional)
q
Review calculated ratios and quantities and adjust analysis settings(optional)
q
Export project data
q
FINISH
Note: If you cannot view the results of an open project, then contact TechnicalSupport (see “Obtaining support” on page 54).
1
QuantStudio™ 3D AnalysisSuite™ Software Help: Relative Quantification 9

Create a project
Create a project
1. In the Project Listing screen, click Create project.
2. Enter a unique project name up to 100-characters in length.The project name:
• Should be descriptive and easy to remember.• Cannot contain the following characters:
% * ? | ; : , ! @ # $ ( ) < > / \ " ' ` ~ [ ] { } = & ^ -• Cannot end with a period (.).
3. Click OK. The software saves the project.
4. In the Import Data tab, import data into the project as needed.
2
10 QuantStudio™ 3D AnalysisSuite™ Software Help: Relative Quantification

Import chip data
A project can include experiment data (.eds) files from up to 100 chips. You canimport chips from the shared storage on the QuantStudio™ 3D AnalysisSuite™ ServerSystem or from a local source.
Note: Refer to the QuantStudio™ 3D Digital PCR System User Guide (Pub. no.MAN0007720) for information on transferring data files from the QuantStudio™ 3DDigital PCR Instrument to another location (shared storage on the AnalysisSuite™
Server System , a network file server, an external storage device such as a USB drive,or the Life Technologies™ cloud data storage service).
Import from shared storage
If you transferred completed experiment (.eds) files from chips run on aQuantStudio™ 3D Instrument to the shared storage on the QuantStudio™ 3DAnalysisSuite™ Server System, they are listed in the Import Data tab and are availablefor import into the current project.
In the Import Data tab, select from the chip(s) available to import from shared storage:
• Individual chip – Select a row in the table, then click (Import into project).
• Multiple chips – Click-drag or press Shift to select continuous rows, or pressCtrl to select discontinuous rows, then click Import chip(s).
The selected chip(s) are moved to the project list on the right. You can select to delete( ) any chip before continuing with project setup.
Note: If a transferred experiment file is not visible in the Import Data tab, thencontact Technical Support (see “Obtaining support” on page 54).
3
QuantStudio™ 3D AnalysisSuite™ Software Help: Relative Quantification 11

Import from local source
To import chip data from your computer or other local source (network file server orUSB drive):
1. In the Import Data tab, click Import from local source.
2. Navigate to and select one or more experiment (.eds) files to import, then clickOpen.
Note: Click-drag or press Shift to select continuous files, or press Ctrl to selectdiscontinuous files.
The selected files are added to the project list on the right. You can select to delete( ) any file before continuing with project setup.
Chapter 3 Import chip dataImport from local source3
12 QuantStudio™ 3D AnalysisSuite™ Software Help: Relative Quantification

Define chip settings
■ Set up assays . . . . . . . . . . . . . . . . . . . . . . . . . . . . . . . . . . . . . . . . . . . . . . . . . . . . . . . . 13
■ Set up samples . . . . . . . . . . . . . . . . . . . . . . . . . . . . . . . . . . . . . . . . . . . . . . . . . . . . . . . 15
■ Set up dilutions . . . . . . . . . . . . . . . . . . . . . . . . . . . . . . . . . . . . . . . . . . . . . . . . . . . . . . 15
■ Import chip setup . . . . . . . . . . . . . . . . . . . . . . . . . . . . . . . . . . . . . . . . . . . . . . . . . . . . 16
The Define Chips tab is automatically populated with the default values from chipsimported into a project. You can edit the default chip settings applied to the chips in aproject, select the default chip settings to use at chip import, import new chip settingsfrom an existing experiment (.eds) file, and apply the same chip settings to multiplechips in the project.
Note: During analysis, chips with the same sample, target, and dilution settings areconsidered technical replicates, while chips with the same sample and target butdifferent dilution settings are considered a dilution series.
• To edit default chip settings:– Click a field in the table and enter a value.
Note: Optionally, enter an editable comment for a chip.– As needed, use the options below the table to continue to set up (add or edit)
chip settings and select the default chip settings to use at chip import.
• To assign the same chip settings to multiple chips:a. Select the top checkbox to select all rows, or select individual checkboxes.
Click-drag or press Shift to select continuous rows. Press Ctrl to selectdiscontinuous rows.
b. Click Assign settings to multiple chips, select the chip settings to use, thenclick Save.
• To import new chip settings into the project:a. Click Import settings.
b. Navigate to and select an existing experiment (.eds) file, then click Open.
Set up assays
After you create a project, you can use the Define Chips tab to edit existing assays,add new assays, and select the default assays for the project.
The default assay in the software uses the following settings:
4
QuantStudio™ 3D AnalysisSuite™ Software Help: Relative Quantification 13

Note: The software automatically assigns FAM™ dye as the Target Dye to each newchip that is imported into a Relative Quantification project. The software uses theTarget Dye as the numerator in reported ratio results.
• To edit existing assays:– In the chip settings table, click a field in the Assay column, then:
– Enter a new assay name (do not use spaces) and optionally select a newTarget Dye. A new assay is added to the assay details table and isavailable for selection in the chip settings table.
– Select a new assay from the drop-down menu. The Target Dye definedfor the selected assay is automatically shown.
– Below the chip settings table, click Show details next to the Assay type.Optionally, edit the assay settings.
Note: Changes to assay settings are automatically shown in the chip settingstable.
• To add and define new assays:a. Below the chip settings table, click Add next to an Assay type.
A new assay is added to the assay details table and is available for selectionin the chip settings table.
b. (Optional) Edit the assay settings:– Enter a new Assay name (do not use spaces).– Select a Target Dye from the drop-down menu.– Enter a Description for the assay.
c. (Optional) Click Delete to remove a setting.
Note: You cannot delete settings that are currently assigned to one or morechips.
d. (Optional) Select a default assay.
• To select a default assay:a. Below the chip settings table, click Show details next to the Assay type.
b. Select the Default value option for the assay you wish to apply to each newchip upon import into the project. This assay will be shown by default in thechip settings table. Click Clear to remove your selection.
Define chip settingsSet up assays4
14 QuantStudio™ 3D AnalysisSuite™ Software Help: Relative Quantification

Set up samples
After you create a project, you can use the Define Chips tab to edit existing samples,add new samples, and select the default samples for the project.
• To edit existing samples:– In the chip settings table, click a field in the Sample column, then:
– Enter a new sample name (do not use spaces). A new sample is added tothe sample details table and is available for selection in the chip settingstable.
– Select a new sample from the drop-down menu.– Below the chip settings table, click Show details next to the Sample type.
Optionally, edit the sample settings.
Note: Changes to sample settings are automatically shown in the chip settingstable.
• To add and define new samples:a. Below the chip settings table, click Add next to the Sample type.
A new sample is added to the sample details table and is available forselection in the chip settings table.
b. (Optional) Edit the sample Name.
c. (Optional) Click Delete to remove a setting.
Note: You cannot delete settings that are currently assigned to one or morechips.
d. (Optional) Select a default sample.
• To select a default sample:a. Below the chip settings table, click Show details next to the Sample type.
b. Select the Default value option for the sample you wish to apply to eachnew chip upon import into the project. This sample will be shown by defaultin the chip settings table. Click Clear to remove your selection.
Set up dilutions
After you create a project, you can use the Define Chips tab to edit existing dilutions,add new dilutions, and select the default dilutions for project.
• To edit existing dilutions:– In the chip settings table, click a field in the Dilution column, then:
– Enter a new dilution. A new dilution is added to the dilution detailstable and is available for selection in the chip settings table.
Note: You can enter the dilution as numeric values (for example, 0.01),alphanumeric values (for example, 1 to 100), or in scientific notation (forexample, 1E-2).
Define chip settingsSet up samples 4
QuantStudio™ 3D AnalysisSuite™ Software Help: Relative Quantification 15

– Select a new dilution from the drop-down menu.– Below the chip settings table, click Show details next to the Dilution type.
Optionally, edit the dilution settings.
Note: Changes to dilution settings are automatically shown in the chip settingstable.
• To add and define new dilutions:a. Below the chip settings table, click Add next to the Dilution type.
The software computes the next dilution based on the default dilution factorof 10. This new dilution is added to the dilution details table and is availablefor selection in the chip settings table.
b. (Optional) Edit the dilution value shown in the Name column.
c. (Optional) Click Delete to remove a setting.
Note: You cannot delete settings that are currently assigned to one or morechips.
d. (Optional) Select a default dilution.
• To select a default dilution:a. Below the chip settings table, click Show details next to the Dilution type.
b. Select the Default value option for the dilution you wish to apply to eachnew chip upon import into the project. This dilution will be shown bydefault in the chip settings table. Click Clear to remove your selection.
Import chip setup
You can import existing chip setup information from a saved comma-separated (.csv)file instead of entering chip settings into the Define Chips tab.
1. Select the Define Chips tab of an open project.
2. Click Upload setup, then navigate to and select the chip setup (.csv) file youwish to import in to the project.
Note: Make sure to select the correct chip setup type for your analysis module.
3. Click Open to add the setup information to the project.
4. (Optional) Continue to define the chip settings.
Define chip settingsImport chip setup4
16 QuantStudio™ 3D AnalysisSuite™ Software Help: Relative Quantification

View the data quality for each chip
■ Review chip quality . . . . . . . . . . . . . . . . . . . . . . . . . . . . . . . . . . . . . . . . . . . . . . . . . . 17
■ Set the quality threshold . . . . . . . . . . . . . . . . . . . . . . . . . . . . . . . . . . . . . . . . . . . . . . 18
■ Omit chip results . . . . . . . . . . . . . . . . . . . . . . . . . . . . . . . . . . . . . . . . . . . . . . . . . . . . . 19
You can use the Review Quality tab to perform a quality check on the digital PCRdata from each chip in a project and conduct further analysis, if necessary. The dataviews in the Review Quality tab:
• Visualize the spatial distribution of data across the chips.• Provide an overview of the observed dye intensities for reaction wells (data
points) that exceed the user-defined quality threshold (see “About chip quality”on page 44).
• Are color-coded by the assigned call by default.
Note: The information displayed and the activities you can perform in the ReviewQuality tab will vary based on your experiment type.
Review chip quality
1. Select the Review Quality tab of an open project.
2. Select a chip to view:• Select a row in the Table view tab.• Navigate to and select an image in the Chip view thumbnails tab. Move the
pointer over an image to view the experiment name.
Note: Use the flag indicators to determine which chips to view. We recommendperforming a quality check of the data for chips that display a or flag (see “About data quality flags” on page 47).
3. Select the data point color options:• Color by quality – Displays each data point by quality, on a continuous
color scale from red (low quality) to green (high quality). You can use thisoption to include or exclude reaction wells from the results. For example:
5
QuantStudio™ 3D AnalysisSuite™ Software Help: Relative Quantification 17

• Color by calls (default) – Displays each data point by the assigned call,based on the target (dye) signal detected in a reaction well. You can use thisoption to verify the uniformity of calls across a chip. For example:
Note: Data points that do not meet the default quality threshold areautomatically filtered out (removed) by the software and displayed in white. Youcan lower the quality threshold to include these reaction wells in the results.Each chip fiducial (area of attachment of the chip to the chip base) is displayed inthe software as a white semi-circle at the chip edge(s).
4. Review the data points in each view and adjust the quality threshold or omitchips from the results as needed.
Set the quality threshold
In the Review Quality tab, select a chip to view and adjust the quality threshold untilyou have an acceptable balance of data quantity and quality.
Note: Thermo Fisher Scientific has validated the system using the default qualitythreshold of 0.5. Increasing the quality threshold may not necessarily improve theaccuracy of your results. We recommend adjusting the quality threshold if youobserve obvious artifacts (such as debris, bubbles, or excess PCR reaction) which
View the data quality for each chipSet the quality threshold5
18 QuantStudio™ 3D AnalysisSuite™ Software Help: Relative Quantification

produce lower quality data points that can be excluded from analysis by increasingthe quality threshold. See Chapter 16, “Troubleshooting” for more information.
1. Select the Color by quality data point color option.
2. Drag the slider (below the Chip view) to the desired quality threshold, in 0.02increments from 0 to 1. A higher quality threshold will filter out (remove) moredata points from the results.
The software automatically reanalyzes the chip results and updates thefollowing:
• Color and number of data points in each view that are above the qualitythreshold.
• Quality Threshold value shown in the Table view tab.• Flag indicator, if applicable. For example, a or flag indicates that a user
has modified the analysis results originally generated by the instrumentsoftware.
3. (Optional) To apply the new quality threshold to all of the chips in the project,select Apply to all chips.
After you review the chip level results, you can continue to adjust the qualitythreshold, review the project level results, or omit the chip results from the project.
Omit chip results
If you determine that the data quality for a chip is unacceptable after reviewing thedata in the Review Quality tab, you can omit the chip results from the project.
Note: Omitting a chip does not delete the chip from the project. You can select toinclude data from an omitted chip in the project results at any time.
• To omit a chip from the results:– Select a row in the Table view tab, then select the Omit checkbox.– Select an image in the Chip view thumbnails tab, then click Omit this chip
from results.
The software automatically removes the chip data from the project results anddisables the data views for the selected chip.
• To include an omitted chip in the results:– Select a row in the Table View tab, then deselect the Omit checkbox.
View the data quality for each chipOmit chip results 5
QuantStudio™ 3D AnalysisSuite™ Software Help: Relative Quantification 19

– Select an image in the Chip view thumbnails tab, then click Include this chipin results.
The software automatically includes the chip data in the project results andenables the data views for the selected chip.
View the data quality for each chipOmit chip results5
20 QuantStudio™ 3D AnalysisSuite™ Software Help: Relative Quantification

View the Relative Quantificationcalls
■ About the Relative Quantification calls . . . . . . . . . . . . . . . . . . . . . . . . . . . . . . . . . . 21
■ Review the Relative Quantification calls . . . . . . . . . . . . . . . . . . . . . . . . . . . . . . . . . 23
■ Scatter plot . . . . . . . . . . . . . . . . . . . . . . . . . . . . . . . . . . . . . . . . . . . . . . . . . . . . . . . . . . 27
For Relative Quantification experiments, the software automatically assigns a call toeach data point in a chip based on single dye thresholds that define each call type.You can use the data viewing tools in the Relative Quantification module to reviewthe automatic call assignments for each chip in a project and manually assign calls asneeded.
Note: Adjusting the quality threshold in the Review Quality tab will not override anymanual call assignments.
About the Relative Quantification calls
The Review Calls tab displays the call assigned to each data point in the selectedchip(s) of a Relative Quantification project.
• Scatter plot – Displays the signal from the FAM™ reporter dye on the Y-axisagainst the signal from the VIC® reporter dye on the X-axis. By default, all datapoints are shown in the plot. The data points in the plot are color-codedaccording to the following call types:
6
QuantStudio™ 3D AnalysisSuite™ Software Help: Relative Quantification 21

Call (Color) Description
FAM (blue) Data points with only FAM™
reporter dye signal,generally located closer tothe Y-axis of the plot, awayfrom the origin
VIC (red) Data points with only VIC®
reporter dye signal,generally located closer tothe X-axis of the plot, awayfrom the origin
FAM + VIC (green) Data points with bothFAM™ and VIC® reporterdye signal, generallylocated midway betweenthe FAM™ and VIC® datapoint clusters in the plot,away from the origin
View the Relative Quantification callsAbout the Relative Quantification calls6
22 QuantStudio™ 3D AnalysisSuite™ Software Help: Relative Quantification

Call (Color) Description
No Amp (yellow) Data points with no signal,generally located near theorigin of the plot
Undetermined (dark grey) Data points withunresolved signal, manualcall, or originally below thedefault quality thresholdthen included at a lowerquality threshold,generally locatedanywhere on the plot
• Results table – Includes the following:
Column Description
Show When selected, shows data points in the scatter plot for theassociated chip
Assay Assay name
Sample Sample name
Dilution Sample dilution factor entered for the chip
Chips Chip containing the data group
Omit When selected, omits the call results for the associated chip
Review the Relative Quantification calls
Use the data viewing tools present in the Review Calls tab of a Relative Quantificationproject to verify the automatic call assignments and edit calls as needed.
• In the scatter plot:– Change the plot display settings as needed:
– To move within the plot display – Click , click , then drag to reposition the plot. Click to return to the original zoom level.
View the Relative Quantification callsReview the Relative Quantification calls 6
QuantStudio™ 3D AnalysisSuite™ Software Help: Relative Quantification 23

– To change the plot display – Click , then drag a slider to thedesired X-axis, Y-axis, or data point size to show in the plot. Clickanywhere in the Adjust Axis dialog to close the dialog.
IMPORTANT! The software automatically scales the plot to display alldata points in the selected chip(s). To easily view particular data pointsin the plot, increase the data point size as needed.
– Review the call for each data point and edit as needed (see “Edit calls” onpage 24).
– View the plot as an image file (see “Scatter plot” on page 27).
• In the results table:– Use the table display settings to show, sort, or group the data (see “Change
the display of table data” on page 42).– Use the Show checkboxes to show or hide data in the scatter plot. Click and
drag or press Shift to select continuous rows, or press Ctrl to selectdiscontinuous rows. Use the top checkbox to select or deselect all rows.
– Omit the call results for a chip (see “Omit chip data” on page 26).
In the Review Calls tab for Relative Quantification projects, select one or more chipsto view and confirm that data points cluster as expected. Review the call for each datapoint and edit as needed.
IMPORTANT! Due to the high number of data points present in a chip, there may besome overlap in the display of individual data points. We strongly recommend thatyou use the following procedure to review and verify the assigned call for each datapoint.
1. Use the results table to show or hide the data from one or more chips in thescatter plot, and adjust plot settings as needed (see “Review the RelativeQuantification calls” on page 23).
2. Use the following methods to review each cluster in the scatter plot and selectdata points for editing:
• Data points in a cluster – This is an ideal method for reviewing data pointsfrom multiple chips.
a. Click a call type (FAM, VIC, and so on) to bring those data points to theforeground.
Note: By default, all data points are shown in the plot. Data points inthe background (faded color) may be hidden from view by data pointsin the foreground (saturated color). You can only edit data points thatare in the foreground.
b. Confirm that the data points are shown in the expected location in theplot (see “About the Relative Quantification calls” on page 21).
Edit calls
View the Relative Quantification callsReview the Relative Quantification calls6
24 QuantStudio™ 3D AnalysisSuite™ Software Help: Relative Quantification
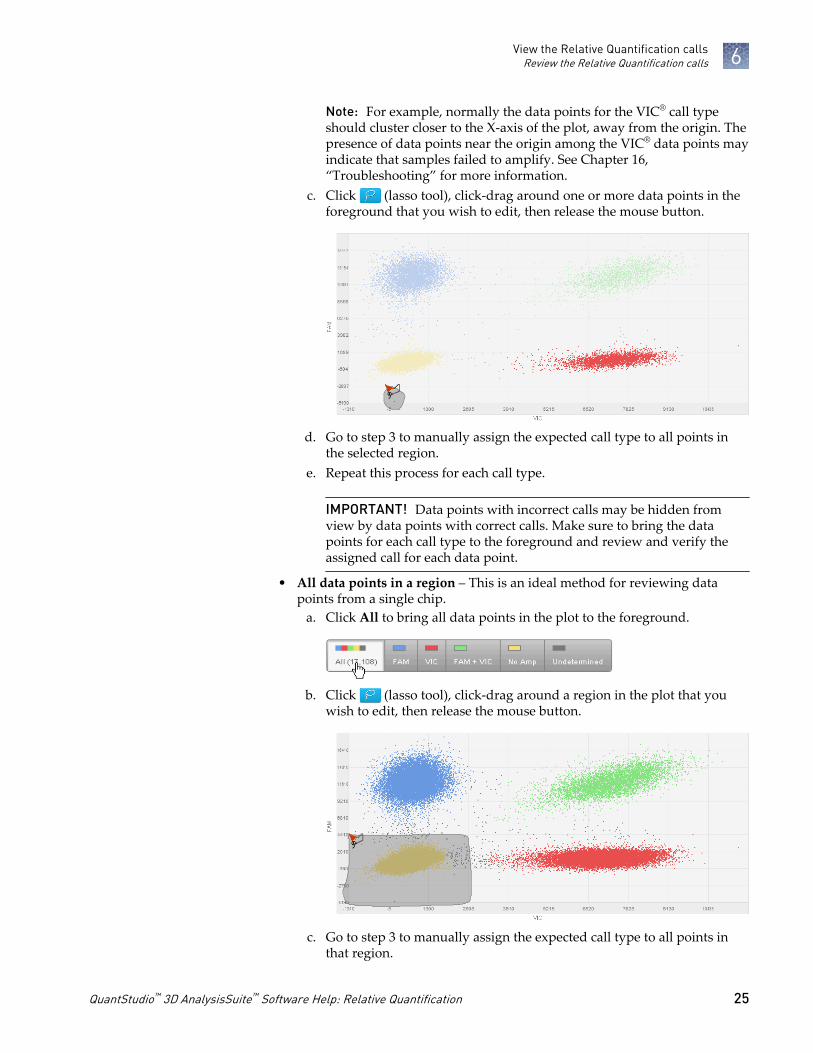
Note: For example, normally the data points for the VIC® call typeshould cluster closer to the X-axis of the plot, away from the origin. Thepresence of data points near the origin among the VIC® data points mayindicate that samples failed to amplify. See Chapter 16,“Troubleshooting” for more information.
c. Click (lasso tool), click-drag around one or more data points in theforeground that you wish to edit, then release the mouse button.
d. Go to step 3 to manually assign the expected call type to all points inthe selected region.
e. Repeat this process for each call type.
IMPORTANT! Data points with incorrect calls may be hidden fromview by data points with correct calls. Make sure to bring the datapoints for each call type to the foreground and review and verify theassigned call for each data point.
• All data points in a region – This is an ideal method for reviewing datapoints from a single chip.
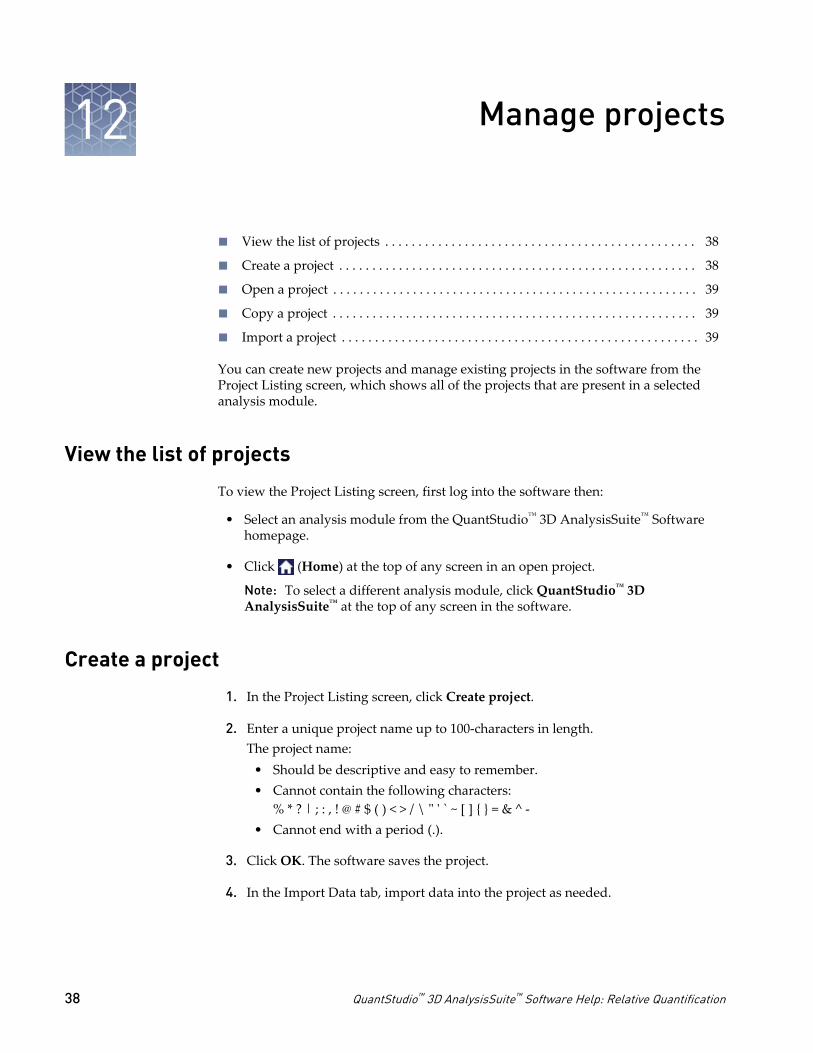
a. Click All to bring all data points in the plot to the foreground.
b. Click (lasso tool), click-drag around a region in the plot that youwish to edit, then release the mouse button.
c. Go to step 3 to manually assign the expected call type to all points inthat region.
View the Relative Quantification callsReview the Relative Quantification calls 6
QuantStudio™ 3D AnalysisSuite™ Software Help: Relative Quantification 25

3. Manually assign a call:• Click a call type.
• Right-click in the plot and select a call type from the drop-down menu.
The software automatically reassigns the new call type to your selection.
Note: Adjusting the quality threshold in the Review Quality tab will notoverride any manual call assignments. However, after you adjust the qualitythreshold we recommend that you review the call for each data point to verify ifthere are any new undetermined calls in the plot that are hidden from view byother data points.
4. As needed, click Undo or Reset to reverse one or more manual calls (see “Undoor Reset manual calls” on page 26).
5. If required, omit the chip data from the results (see “Omit chip data” onpage 26).
To reverse one or more manual calls for the selected chip(s) in a project, you can click:
• Undo one time to reverse the last manual call applied to the chip(s), or multipletimes to reverse multiple call edits in sequence.
IMPORTANT! If you import or delete chip(s) from a project, you cannot Undoany of the manual calls that were applied before this action.
• Reset to return all manual calls applied to the chip(s) to the original calls made bythe software.
If you determine that the calls for a chip in a Relative Quantification project areunacceptable after reviewing the data in the Review Calls tab, you can omit the chipdata from the project results.
Note: Omitting chip data does not delete the chip from the project. You can select toinclude omitted chip data in the project results at any time.
• Omit chip data – In the data table, select the Show checkbox to show the calls fora chip in the scatter plot, then select the Omit checkbox for the selected chip.The software automatically removes the chip data from the project results anddisables the data views for the selected chip.
Undo or Resetmanual calls
Omit chip data
View the Relative Quantification callsReview the Relative Quantification calls6
26 QuantStudio™ 3D AnalysisSuite™ Software Help: Relative Quantification

• Include omitted chip data – In the data table, select the Show checkbox to showthe calls for a chip in the scatter plot, then deselect the Omit checkbox for theselected chip.The software automatically includes the chip data in the project results andenables the data views for the selected chip.
Scatter plot
You can save the plot shown in the Review Calls tab as a Portable Network Graphic(PNG) file.
1. Select the Review Calls tab of an open project.
2. Adjust the plot display settings as needed.
3. Click View As Image, then click Save As in the image dialog box.The software automatically saves the image as a PNG file using the default filename (Scatter_Plot_<project name>.png) and browser downloads location.
4. Close the image dialog box.
You can print an image of the plot shown in the Review Calls tab.
1. Select the Review Calls tab of an open project.
2. Adjust the plot display settings as needed.
3. Click View As Image, then click Print in the image dialog box.The software automatically opens the image in a new Untitled tab.
4. In the Print dialog box, select the printer and print options, then click Print.
Note: Make sure to close the Untitled tab when the print is complete.
5. Close the image dialog box.
Save the Scatterplot
Print the Scatterplot
View the Relative Quantification callsScatter plot 6
QuantStudio™ 3D AnalysisSuite™ Software Help: Relative Quantification 27

View the analysis results for aproject
To view the analysis results for all of the chips (experiments) in a project:
1. Select the See Results tab of an open project.
2. If needed, select the Results tab if it is not already shown by default.
About the Relative Quantification results
For Relative Quantification experiments, the Results tab displays the aggregate resultsfor each unique sample and assay combination, which may include replicates and/ormultiple dilutions.
• Bar graph – Displays the data group (Sample-Assay) on the X-axis and dye signalratio (Target/Total) on the Y-axis.
Note: You can use the available data display and table display settings to changethe default data group shown in the graph (see “Review the RelativeQuantification results” on page 29).
• Results table – Includes the following:
7
28 QuantStudio™ 3D AnalysisSuite™ Software Help: Relative Quantification

Column Description
Color Color assigned to the data group
Assay Assay name
Sample Sample name
Target/Total Calculated ratio of target dye signal over total dye (FAM™ +VIC®) signal from the target gene(s)
CI Target/Total Upper and lower confidence interval for Target/Total dyesignal ratio
Copies/µL (FAM andVIC)
Quantity of sample in copies/µL for each dye
CI Copies/µL (FAMand VIC)
Upper and lower confidence interval for quantity of sample incopies/µL for each dye
Precision (FAM andVIC)
Calculated precision (%) of each dye for the data group (see “About precision” on page 34)
Note: You can improve (lower) the calculated precision bycombining multiple chips into one "virtual" chip. To do this,apply the same sample name to all chips of interest.
Chips Number of chips containing the data group
Recommendation Suggestion for further dilutions as generated by the softwareif the set precision is exceeded
Note: The calculated sample quantity (Copies/µL) for each dye represents theconcentration of the sample in the PCR reaction mix, not the concentration of theoriginal sample before dilution (stock concentration), unless you have set theappropriate dilution in the software.
Review the Relative Quantification results
Review the calculated ratios and quantities shown in the Results tab for a RelativeQuantification project, and use the display settings to show and group the data asneeded.
• In the bar graph:– Move the pointer over a bar in the graph to view a summary of the results
for that data group.– Adjust the data display and analysis settings (see Chapter 9, “View the
Relative Quantification analysis and display settings”).– View the graph as an image file.
• In the results table, you can:– Use the checkboxes to show or hide data in the bar graph. Click-drag or
press Shift to select continuous rows, or press Ctrl to select discontinuousrows. Use the top checkbox to select or deselect all rows.
– Select a color square in the Color column to replace the color associated withthe data group.
Chapter 7 View the analysis results for a projectReview the Relative Quantification results 7
QuantStudio™ 3D AnalysisSuite™ Software Help: Relative Quantification 29

– Use the table display settings to show, sort, or group the data (see “Changethe display of table data” on page 42).
Chapter 7 View the analysis results for a projectReview the Relative Quantification results7
30 QuantStudio™ 3D AnalysisSuite™ Software Help: Relative Quantification

View the analysis results for eachchip
To view the analysis results for each chip in a project:
1. Select the See Results tab of an open project.
2. If needed, select the Replicates tab if it is not already shown by default.
About the Relative Quantification replicate results
For Relative Quantification experiments, the Replicates tab reports the results for eachchip in the project. Results can be grouped by replicate (chips assigned with the samesample, assay, and dilution) to help identify any outliers.
The Replicates table includes the following:
Column Description
Assay Assay name
Sample Sample name
Dilution Sample dilution factor entered for the chip
Chip Chip assigned with the same sample, assay, and dilution
Target/Total Calculated ratio of target dye signal over total dye (FAM™ + VIC®)signal from the target gene(s)
CI Target/Total Lower and upper confidence interval for Target/Total dye signalratio
Copies/Rxn (FAM andVIC)
Quantity of sample in copies/reaction well, for each dye
CI Copies/Rxn (FAMand VIC)
Lower and upper confidence interval for quantity of sample incopies/reaction well, for each dye
Copies/µL (FAM andVIC)
Quantity of sample in copies/µL, for each dye
CI Copies/µL (FAM andVIC)
Lower and upper confidence interval for quantity of sample incopies/µL, for each dye
8
QuantStudio™ 3D AnalysisSuite™ Software Help: Relative Quantification 31

Column Description
# of Neg (FAM andVIC)
Total number of negative calls for each dye in the chip, asdetermined from the Review Calls scatter plot
Note: Negative call means the software determines that a welldoes not contain any copy of the target labeled with the assignedtarget dye.
# of Undetermined Total number of undetermined calls in the chip, as determinedfrom the Review Calls scatter plot
Note: Undetermined calls are those data points with unresolvedsignal, manual call, or originally below the default qualitythreshold then included at a lower quality threshold, generallylocated anywhere on the plot.
# qualified by QT Total number of reaction wells in the chip that exceed theselected quality threshold
# of Filled Total number of filled reaction wells in the chip
Run Date Date and time the chip run was completed on the instrument
Flag Quality flag for the chip, if present
Comment Chip level comment, if entered on the Define Chips tab
Note: The calculated sample quantity (Copies/Rxn and Copies/µL) represents theconcentration of the sample loaded into the chip, not the concentration of the originalsample before dilution (stock concentration).
Review the Relative Quantification replicate results
Review the calculated ratios and quantities and the assigned calls shown in theReplicates tab for a Relative Quantification project, and omit any outliers.
• Select the results to display in the table (see “Change the display of table data” onpage 42):
– Drag a column heading above the table to group the table data by theselected attribute. To create a hierarchical grouping, repeat this process withadditional columns.
– Adjust additional table display settings to show or sort the table data.
• Select an experiment (.eds) file in the Chip column to review the chip quality andomit the chip from the results, if necessary.
Chapter 8 View the analysis results for each chipReview the Relative Quantification replicate results8
32 QuantStudio™ 3D AnalysisSuite™ Software Help: Relative Quantification

View the Relative Quantificationanalysis and display settings
The See Results tab also contains the data analysis and display settings for the project,which you can select in the settings view at the top of the tab.
1. Click Show settings to open the settings view.
2. Select Color by to assign the bar graph with one of the default color categories(Sample or Assay), or by the User defined color selected in the Results table.The software automatically updates the data display in the bar graph, and in theColor column of the Results table.
3. Select the data analysis settings:• Confidence level (%) – Select the confidence level to use for the project, as
shown in the bar graph and Results table. The default value is 95%.• Desired precision (%) – Select the desired precision for the software to use
to generate recommended actions for the project. The default value is 10%.
Note: If the calculated value shown in the Precision column of the Resultstable exceeds the desired precision entered here, the software may provide asuggestion for further dilutions of the PCR reaction mix to achieve thedesired precision (see the Recommendation column for more information).
The software automatically updates the data display in both the bar graph andResults table.
4. Click Hide settings to close the settings view.
About the confidence interval (CI)
The confidence interval (CI) calculations for the Absolute Quantity (AQ) in theAnalysisSuite™ Software only account for the Poisson error and result in a CI that isconsistent with the random distribution of molecules across the chip assuming thatthe deposition of the molecules follows a Poisson process. For the CI around theRelative Quantity (RQ), the AQ of each target is first determined along with the CIaround the AQ. The RQ is then calculated along with a CI around the RQ, consistentwith the CI expected for the ratio of two types of target molecules distributed by twoindependent Poisson processes. If replicate chips are run, the combined RQ result
9
QuantStudio™ 3D AnalysisSuite™ Software Help: Relative Quantification 33

across the replicate chips is calculated using a weighted average of the RQ result fromindividual chips, where the weighting factor is derived from the inverse of the CIaround the RQ value from each chip.
About precision
Precision refers to the ability to distinguish between two measurements (such assample concentrations) with a certain confidence. The AnalysisSuite™ Softwarecalculates precision as the ratio of the maximum deviation of the confidence bound orinterval (numerator) to the mean value (denominator). For example:
where λ (lambda) is the value you wish to estimate. In the software, λ is the sampleconcentration measured in copies/µL. The maximum deviation is used since theconfidence interval (CI) is asymmetric.
Precision is used to express the tightness of the CI (see “About the confidence interval(CI)” on page 33). The lower the precision, the tighter the CI. For example, if thesample concentration estimate is 1 copy/µL and the 95% CI for this estimate is 0.9 to1.1, the calculated precision would be 10% with a 5% chance that the trueconcentration is outside of the 0.9 to 1.1 CI, and assuming the only source of variationcomes from the random distribution of molecules across a chip assuming that thedeposition of the molecules follows a Poisson process.
Note: For the Relative Quantity (RQ) calculations in the AnalysisSuite™ Software, theAbsolute Quantity (AQ) of each target is first determined along with the precisionaround the AQ, then the RQ is calculated. Precision around the RQ is not calculatedby the software.
Chapter 9 View the Relative Quantification analysis and display settingsAbout precision9
34 QuantStudio™ 3D AnalysisSuite™ Software Help: Relative Quantification

Export data
Export chip setup
You can export the setup information for each chip in a project into a comma-separated (.csv) file, for use with other projects and that you can open in aspreadsheet program such as Microsoft® Excel®.
1. Select the Define Chips tab of an open project.
2. Click Export settings.The software automatically exports all of the chip settings in the project to acomma-separated (.csv) file using the default file name (<project name>_Setup)and browser downloads location.
Export project level results
The Export tab contains an overview of the project data that you can export and openin a spreadsheet program such as Microsoft® Excel®.
1. Select the Export tab of an open project.
2. Review the information shown in each section:
Section Description
Summary Displays the setup properties and analysis settings for theproject
Note: The software automatically appends this summary tothe top of each exported file.
Results Displays the results for all chips that are assigned to thesame sample group, which may include replicates and/ormultiple dilutions
Replicates Displays the results for all chips that are assigned to thesame sample group and dilution
Digital calls Displays the digital calls for each chip in the project
3. Adjust the table display settings as needed.
Note: While you can adjust the display of data in each table for reviewpurposes, the software will export all data using the default table displaysettings.
10
QuantStudio™ 3D AnalysisSuite™ Software Help: Relative Quantification 35

4. Click Export.The software automatically exports the project data to a comma-separated (.csv)file using the default file name (<project name>_export) and browser downloadslocation.
Export projects
Transfer one or more projects out to another work station running AnalysisSuite™
Software or into files that you can archive or pass to another user.
1. Select an analysis module from the QuantStudio™ 3D AnalysisSuite™ Softwarehomepage.
2. In the Project Listing screen, use the checkboxes to select one or more projects totransfer out of the software.
Note: Click-drag or press Shift to select continuous rows, or press Ctrl to selectdiscontinuous rows. Use the top checkbox to select or deselect all rows.
3. Click Export project(s).The software automatically exports a single project to a .las file or multipleprojects to a .zip file using the project name and browser downloads location.
Chapter 10 Export dataExport projects10
36 QuantStudio™ 3D AnalysisSuite™ Software Help: Relative Quantification

Manage the Results plot
Save the Results plot
You can save the plot shown in the See Results tab as a Portable Network Graphic(PNG) file.
1. Select the See Results tab of an open project.
2. Adjust the plot display settings as needed.
3. Click View as image, then click Save As in the image dialog box.The software automatically saves the image as a PNG file using the default filename (Result_Plot_<project name>.png) and browser downloads location.
4. Close the image dialog box.
Print the Results plot
You can print an image of the plot shown in the See Results tab.
1. Select the See Results tab of an open project.
2. Adjust the plot display settings as needed.
3. Click View as image, then click Print in the image dialog box.The software automatically opens the image in a new Untitled tab.
4. In the Print dialog box, select the printer and print options, then click Print.
Note: Make sure to close the Untitled tab when the print is complete.
5. Close the image dialog box.
11
QuantStudio™ 3D AnalysisSuite™ Software Help: Relative Quantification 37
Manage projects
■ View the list of projects . . . . . . . . . . . . . . . . . . . . . . . . . . . . . . . . . . . . . . . . . . . . . . . 38
■ Create a project . . . . . . . . . . . . . . . . . . . . . . . . . . . . . . . . . . . . . . . . . . . . . . . . . . . . . . 38
■ Open a project . . . . . . . . . . . . . . . . . . . . . . . . . . . . . . . . . . . . . . . . . . . . . . . . . . . . . . . 39
■ Copy a project . . . . . . . . . . . . . . . . . . . . . . . . . . . . . . . . . . . . . . . . . . . . . . . . . . . . . . . 39
■ Import a project . . . . . . . . . . . . . . . . . . . . . . . . . . . . . . . . . . . . . . . . . . . . . . . . . . . . . . 39
You can create new projects and manage existing projects in the software from theProject Listing screen, which shows all of the projects that are present in a selectedanalysis module.
View the list of projects
To view the Project Listing screen, first log into the software then:
• Select an analysis module from the QuantStudio™ 3D AnalysisSuite™ Softwarehomepage.
• Click (Home) at the top of any screen in an open project.
Note: To select a different analysis module, click QuantStudio™ 3DAnalysisSuite™ at the top of any screen in the software.
Create a project
1. In the Project Listing screen, click Create project.
2. Enter a unique project name up to 100-characters in length.The project name:
• Should be descriptive and easy to remember.• Cannot contain the following characters:
% * ? | ; : , ! @ # $ ( ) < > / \ " ' ` ~ [ ] { } = & ^ -• Cannot end with a period (.).
3. Click OK. The software saves the project.
4. In the Import Data tab, import data into the project as needed.
12
38 QuantStudio™ 3D AnalysisSuite™ Software Help: Relative Quantification

Open a project
1. In the Project Listing screen, navigate to and select a project name in the Projectstable to open it.
Note: By default, a project opens to the Project Dashboard tab. Click the ImportChips link to import chips to an empty project.
2. Manage the project properties as needed.
Copy a project
You can create a copy of an existing project for use with the same Life Technologies™
user account.
1. Open the project to be copied (see “Open a project” on page 39).
Note: Make sure to note down the original name for later use.
2. Rename the project (see “Rename a project” on page 40).
3. Export the renamed project from the software (see “Export projects” on page 36).
4. Rename the open project using the original project name noted in step 1.
Note: Project names in the software must be unique.
5. Import the renamed project into the software (see “Import a project” onpage 39).The software shows both project names (the original and the copy) in the ProjectListing screen for the logged in user.
Import a project
You can use the Project Listing screen to import projects from another location orunder a different name. Only files of type .las can be transferred to the AnalysisSuite™
Software.
1. In the Project Listing screen, click Import project, then navigate to and select theproject (.las) file you wish to import into the software.
IMPORTANT! Make sure the project you select to import has a unique projectname (see “Rename a project” on page 40).
2. Click Open to add the project to the Projects table.
Manage projectsOpen a project 12
QuantStudio™ 3D AnalysisSuite™ Software Help: Relative Quantification 39
Manage project properties
View the project summary
The Project Dashboard tab contains a summary of the latest information about aproject. You can review the project level notifications and results, and navigate todetailed setup and results screens from this tab.
1. Select the Project Dashboard tab of an open project, if not already selected.
Note: By default, a project opens to the Project Dashboard tab. Click the ImportChips link to import chips to an empty project.
2. View a summary of the latest information about the project:• Notifications – Displays the data flags and comments for the project. From
here, you can add new comments or reply to existing comments.• Results to date – Plots the analysis results for all chips in the project. Click
See details to navigate to the See Results tab and review the results in moredetail.
• Description – Optionally, click to enter a description for the project if noneis displayed in this field. The project description is included in the export ofproject data.
• Targets or Assays, Samples, Dilutions, and Chips – Displays the chips andchip settings associated with the project. Click See details next to a setting tonavigate to the Define Chips tab and review the settings in more detail.
3. Optionally, edit the following project properties from this tab:• Add a comment, or read and reply to comments in the project.• Enter a description for the project.
Rename a project
You can rename a project at any time (for example, if you wish to create a copy of anexisting project).
1. Click the project name or Edit project name from any screen of an open project.
2. Enter a unique project name up to 100-characters in length.The project name:
• Should be descriptive and easy to remember.• Cannot contain the following characters:
13
40 QuantStudio™ 3D AnalysisSuite™ Software Help: Relative Quantification

% * ? | ; : , ! @ # $ ( ) < > / \ " ' ` ~ [ ] { } = & ^ -• Cannot end with a period (.).
3. Press Enter.
Add comments to a project
The Add Comments dialog box allows you to enter detailed information about theproject (for example, observations about the data, reasons why you made specificdecisions, and so on). You can add comments to a project at any time. You may preferto enter comments after viewing and analyzing the data.
1. Click Add comment in the Notifications section of the Project Dashboard tab, orat the top of any other screen in an open project.
2. Enter up to 255 characters to associate with the project, then click POST.
Note: After you click POST, the comment is time stamped and permanentlyrecorded in the project, and it cannot be modified or removed.
3. (Optional) In the Notifications section of the Project Dashboard tab, click Read/Reply and repeat step 2 to respond to a posted comment.
Note: You can also add an editable comment to any chip in the project from theDefine Chips tab.
Chapter 13 Manage project propertiesAdd comments to a project 13
QuantStudio™ 3D AnalysisSuite™ Software Help: Relative Quantification 41

Manage project display settings
Apply a filter
You can filter the chip data shown in the Import Data and Review Quality tabs asfollows (for example, to show fewer chips or to view specific chip results):
• Filter the chips to import – In the Import Data tab, click Show Filters, then:– Show by import state – Select Chips not imported yet to view the remaining
chips available for import into the project. Select All Chips to remove thefilter criteria.
– Filter by run date –– Select the Run in the past checkbox, then enter the run date settings for
the chips to import. Deselect the checkbox to remove the filter criteria.– Select the Date range of run checkbox, then click to select a data
range, or enter a data range for the chips to import. Deselect thecheckbox to remove the filter criteria.
The software automatically updates the chip data shown in the Import Data tabaccording to your filter criteria.
• Filter the chip quality data – In the Review Quality tab, click Show Filters, then:– Search for a specific chip – Enter all or part of the chip name you wish to
view, then click Go. Click Clear to remove the filter criteria.– Sort the chip results – Select to sort by Flagged chips or Recently ran chips.
The software automatically updates the chip data shown in the Review Qualitytab according to your filter criteria.
Change the display of table data
You can use any of the following settings to change the display of table data in anopen project, if available:
• Show/hide columns – Click to the right of a column heading, then select thecontents to show or hide in the table from the Columns drop-down menu.
• Sort column entries – To sort column content:– Click once on a column heading to sort the rows in the table according to the
content in the column. You can change the sorting order with a second click.A third click will clear the sorting order.
14
42 QuantStudio™ 3D AnalysisSuite™ Software Help: Relative Quantification

– Click to the right of a column heading, then select to Sort Ascending orSort Descending from the drop-down menu.
• Change column order – Click a column heading and drag the column to thedesired position.
• Group column entries – Drag a column heading above the table to group thetable data by the selected attribute. To create a hierarchical grouping, repeat thisprocess with additional columns, then:
– Click to expand all entries for a group and click to collapse the entries.– Click to sort the table data according to the selected group. You can
change the sorting order with a second click. A third click will clear thesorting order.
– Click to remove the group.
• Adjust the viewable area of a table section – Click-drag the split line to adjustthe viewable area of each table section.
Chapter 14 Manage project display settingsChange the display of table data 14
QuantStudio™ 3D AnalysisSuite™ Software Help: Relative Quantification 43

About the Software Quality Metrics
■ About chip quality . . . . . . . . . . . . . . . . . . . . . . . . . . . . . . . . . . . . . . . . . . . . . . . . . . . 44
■ Factors contributing to quality value assessment . . . . . . . . . . . . . . . . . . . . . . . . . 44
■ About the quality threshold . . . . . . . . . . . . . . . . . . . . . . . . . . . . . . . . . . . . . . . . . . . . 46
■ About data quality flags . . . . . . . . . . . . . . . . . . . . . . . . . . . . . . . . . . . . . . . . . . . . . . . 47
About chip quality
The software assesses whether the data on a chip is reliable based upon loading,signal, noise, and other data analysis characteristics for each reaction well (see “Factors contributing to quality value assessment” on page 44) and displays qualityindicators for each chip in a project:
• Quality threshold – A measure of the individual well quality for a chip, on acontinuous scale from 0 (low quality) to 1 (high quality). The default qualitythreshold is 0.5 (see “About the quality threshold” on page 46). You can adjustthis scale to filter the wells (data points) to include or exclude from analysis (see “Set the quality threshold” on page 18).
• Quality flag – A measure of the overall chip quality, based on well qualitythresholds and other data analysis characteristics. Use to determine which chipsto review (see “About data quality flags” on page 47).
Factors contributing to quality value assessment
The quality value for each reaction well in a Digital PCR 20K Chip can help toeliminate areas of the chip compromised by faulty loading, presence of debrisparticles, or poor imaging.
The AnalysisSuite™ Software calculates a quality value for each reaction well based onthe following factors, assessed in order:
1. Contrast between each reaction well and its surroundings (see “Contrastassessment” on page 45).
2. Spatial uniformity of positive and negative wells across the chip (see “Spatialuniformity assessment” on page 45).
After the software calculates a quality value for each reaction well in a chip, it appliesa default quality threshold of 0.5 (see “About the quality threshold” on page 46),resulting in the automatic exclusion of reaction wells with quality values < 0.5 fromfurther analysis. This allows the inclusion of unaffected areas of the chip in the resultsand helps to eliminate false positives from non-biochemical sources.
15
44 QuantStudio™ 3D AnalysisSuite™ Software Help: Relative Quantification

Note: Thermo Fisher Scientific has validated the system using the default qualitythreshold of 0.5. Increasing the quality threshold may not necessarily improve theaccuracy of your results. We recommend adjusting the quality threshold if youobserve obvious artifacts (such as debris, bubbles, or excess PCR reaction) whichproduce lower quality data points that can be excluded from analysis by increasingthe quality threshold. See Chapter 16, “Troubleshooting” for more information.
The AnalysisSuite™ Software identifies the contrast between each reaction well in achip and its surroundings by comparing the signal level in the reaction well to thesignal level of the surrounding area.
A high contrast is expected regardless of well concentration, while areas with lowcontrast receive low quality values and are used to identify and remove the effects ofdebris on the chip or chip lid.
In the example below, a chip is shown in the Review Quality tab using the Color byquality option, then a higher quality threshold is applied to remove the debrisparticle from further analysis (see “Set the quality threshold” on page 18).
The factors contributing to spatial uniformity across the chip are assessed in thefollowing order:
1. Identification of positives and negatives for each dye using the distribution in afluorescence histogram (see “Positive and negative uniformity” on page 45).
2. Spatial distribution of FAM™ and/or VIC® dye signal (see “Dye signaluniformity” on page 46).
Positive and negative uniformity
To identify the positive and negative calls in a chip, the AnalysisSuite™ Software usesa histogram of the dye fluorescence values to automatically set a call discriminationthreshold for the chip, then determines the positive or negative call for each dye ineach reaction well on the chip. The location of the reaction well on the chip and thecall it receives is used to assess the spatial uniformity of the distribution of the callsacross the chip (see “Dye signal uniformity” on page 46).
Note: The positive and negative call determination is based upon an automatic callthreshold of the unfiltered data. For example, the threshold assessment is mosteffective with a bi-modal (two peak) distribution of fluorescent values for each dye.
Contrastassessment
Spatial uniformityassessment
About the Software Quality MetricsFactors contributing to quality value assessment 15
QuantStudio™ 3D AnalysisSuite™ Software Help: Relative Quantification 45

Dye signal uniformity
To assess the spatial distribution of positives and negatives across the chip, theAnalysisSuite™ Software uses an algorithm to compare the expected degree of clusters(connectivity) of high FAM™ or VIC® dye signal at a given concentration against theobserved connectivity to calculate the uniformity component of the per well qualityvalue. A uniform distribution of positive calls is expected. Reaction wells forminggroups of positives that cluster differently from what is expected at the estimatedconcentration are assigned lower quality values. Note that this algorithm is onlyapplicable at concentrations under a certain value, where predicting the degree ofconnectivity makes sense.
Among other artifacts, this algorithm helps to identify the unexpected transfer of fluidacross wells (bridging) on a chip. In the example below, a chip is shown in the ReviewQuality tab using the Color by calls option to identify areas of non-uniformity. Fromthe Color by calls option, a higher quality threshold is applied to remove the areas ofnon-uniformity from further analysis (see “Set the quality threshold” on page 18).
About the quality threshold
The quality threshold in the AnalysisSuite™ Software is set at 0.5 by default. Thisdefault was empirically set by Thermo Fisher Scientific using a representative sampleof chips with higher and lower quality images (including clean and dirty chips,bridging, and loading failures) and was selected to automatically exclude reactionwells with quality values below the threshold from further analysis.
About the Software Quality MetricsAbout the quality threshold15
46 QuantStudio™ 3D AnalysisSuite™ Software Help: Relative Quantification

To use the quality threshold in your analysis, we recommend that you review the datain the Review Quality tab for any chips that display the (yellow) flag (see Chapter5, “View the data quality for each chip”), then use the:
• Color by calls view to assess the spatial uniformity of the positive and negativecalls across the chip (see “Spatial uniformity assessment” on page 45).
• Color by quality view to adjust the quality threshold as needed to exclude wellsthat are of lower quality than surrounding higher quality wells but are notautomatically filtered from the analysis using the default threshold of 0.5. Forexample, you may wish to exclude wells that contain obvious artifacts (such asdebris), that are within clusters of positive or negative wells, or that lie betweenthe main positive and negative call distributions.
Note: Thermo Fisher Scientific has validated the system using the default qualitythreshold of 0.5. Increasing the quality threshold may not necessarily improve theaccuracy of your results. We recommend adjusting the quality threshold if youobserve obvious artifacts (such as debris, bubbles, or excess PCR reaction) whichproduce lower quality data points that can be excluded from analysis by increasingthe quality threshold. See Chapter 16, “Troubleshooting” for more information.
About data quality flags
Data quality flags generated and displayed by the software are a measure of theoverall chip quality, based on well quality thresholds and other data analysischaracteristics.
In order, from high quality to low quality:• (green) – Review of the analysis results is not required. This flag is shown if the
data meets all quality thresholds.• (yellow) – Review of the analysis results is suggested. This flag is shown if the:
– Instrument cannot clearly identify the population of unamplified wells.– Distribution of unamplified wells on the chip is not uniform.– Sample concentration is outside the optimal range (200-2000 copies/µL) for
the system as currently defined by the Thermo Fisher Scientific chip qualitymetrics.
Note: For more information on sample concentration, see the QuantStudio™
3D Digital PCR System User Guide.• (red) – Review of the analysis results is strongly suggested. If necessary,
reimage the Digital PCR 20K Chip or rerun the sample. This flag is shown if thetotal number of filled wells is < 5000 or the percentage of low quality wells (thosewith well quality < 0.5) is > 15%.
• (green), (yellow), or (red) – Indicates that a user has modified the analysisresults originally generated by the instrument software.
Note: To revert an edited flag to its default state, delete the associated chip fromthe project, then import it back into the project.
Note: For single reporter experiments, the software displays a quality flag if it isassociated with the selected target dye. For dual reporter experiments, the softwaredisplays the lowest quality flag associated with the target dyes.
About the Software Quality MetricsAbout data quality flags 15
QuantStudio™ 3D AnalysisSuite™ Software Help: Relative Quantification 47
Troubleshooting
■ Troubleshooting quality flags in the software . . . . . . . . . . . . . . . . . . . . . . . . . . . . 48
■ Troubleshooting chip images using the Chip View . . . . . . . . . . . . . . . . . . . . . . . . 49
■ Troubleshooting analysis results . . . . . . . . . . . . . . . . . . . . . . . . . . . . . . . . . . . . . . . 52
Troubleshooting quality flags in the software
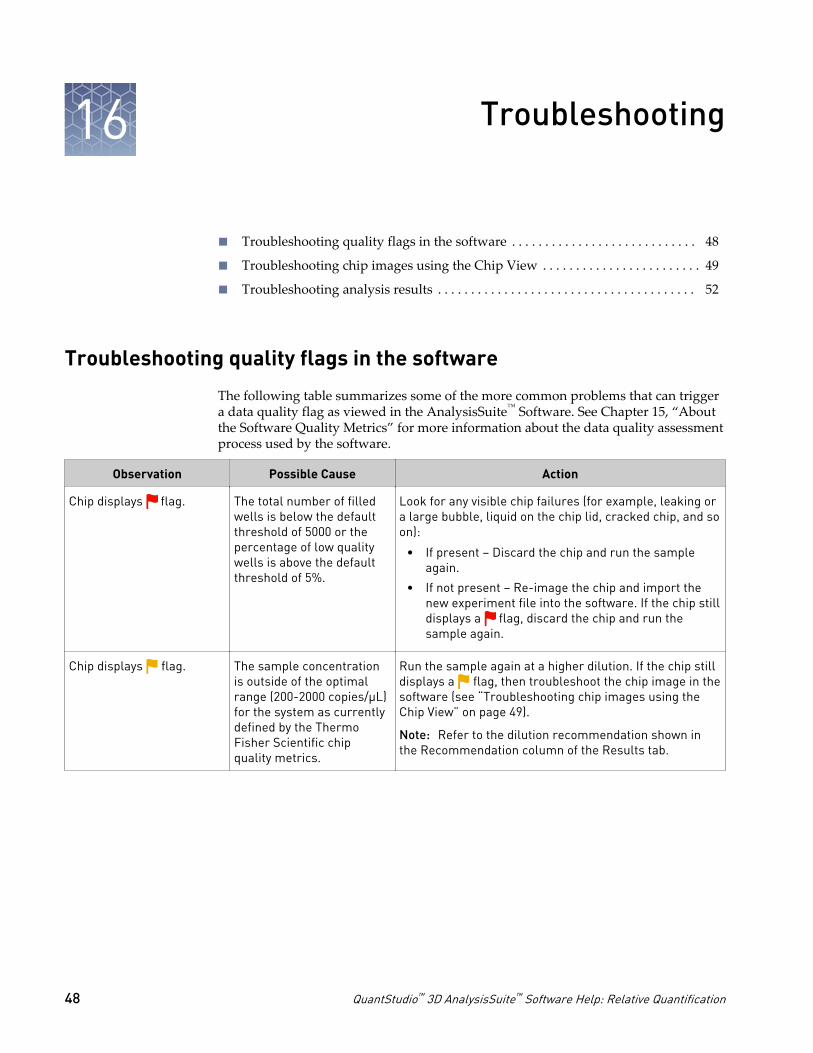
The following table summarizes some of the more common problems that can triggera data quality flag as viewed in the AnalysisSuite™ Software. See Chapter 15, “Aboutthe Software Quality Metrics” for more information about the data quality assessmentprocess used by the software.
Observation Possible Cause Action
Chip displays flag. The total number of filledwells is below the defaultthreshold of 5000 or thepercentage of low qualitywells is above the defaultthreshold of 5%.
Look for any visible chip failures (for example, leaking ora large bubble, liquid on the chip lid, cracked chip, and soon):
• If present – Discard the chip and run the sampleagain.
• If not present – Re-image the chip and import thenew experiment file into the software. If the chip stilldisplays a flag, discard the chip and run thesample again.
Chip displays flag. The sample concentrationis outside of the optimalrange (200-2000 copies/µL)for the system as currentlydefined by the ThermoFisher Scientific chipquality metrics.
Run the sample again at a higher dilution. If the chip stilldisplays a flag, then troubleshoot the chip image in thesoftware (see “Troubleshooting chip images using theChip View” on page 49).
Note: Refer to the dilution recommendation shown inthe Recommendation column of the Results tab.
16
48 QuantStudio™ 3D AnalysisSuite™ Software Help: Relative Quantification

Observation Possible Cause Action
Chip displays flag.(continued)
The instrument cannotclearly identify thepopulation of unamplifiedwells.
Review the data in the Review Quality tab of the RelativeQuantification module. In the Histogram view, if youobserve:
• A single peak (mono-modal) – Confirm that the callthreshold is on the appropriate side of the peakbased on the chip settings (for example, NTC or lowdilution). Manually adjust the call threshold toimprove the call assignment accuracy, if necessary.
• Two peaks (bi-modal) with poor separation or morethan two peaks –
– Increase the quality threshold to create a morebi-modal distribution, if possible. Make sure tobalance the number of data points included inthe analysis against the desired data quality andcall separation.
– Manually adjust the call threshold to improvethe call assignment accuracy. If this is notpossible, omit the chip from the results.
Note: If you set up both target dyes for the chip, reviewthe data in the scatter plot view of the RelativeQuantification module and verify that calls are clearlyseparated in the plot.
The distribution ofunamplified wells on thechip is not uniform.
Review the data in the Chip view of the Review Qualitytab. Select the Color by calls data point color option,then:
1. Verify that calls are randomly distributed across thechip.
2. Increase the quality threshold to adjust the negativecall distribution across the chip, if possible. Makesure to balance the number of data points includedin the analysis against the desired data quality andcall distribution.
3. (Optional) If calls are still not randomly distributedacross the chip, omit the chip from the results.
Troubleshooting chip images using the Chip View
The following table summarizes some of the more common problems that can affectimaging of Digital PCR 20K Chips.
Note: In the examples shown below, the conditions triggered a data flag in theDigital PCR 20K Chip and the conditions were diagnosed using the Chip View of theAnalysisSuite™ Software.
TroubleshootingTroubleshooting chip images using the Chip View 16
QuantStudio™ 3D AnalysisSuite™ Software Help: Relative Quantification 49
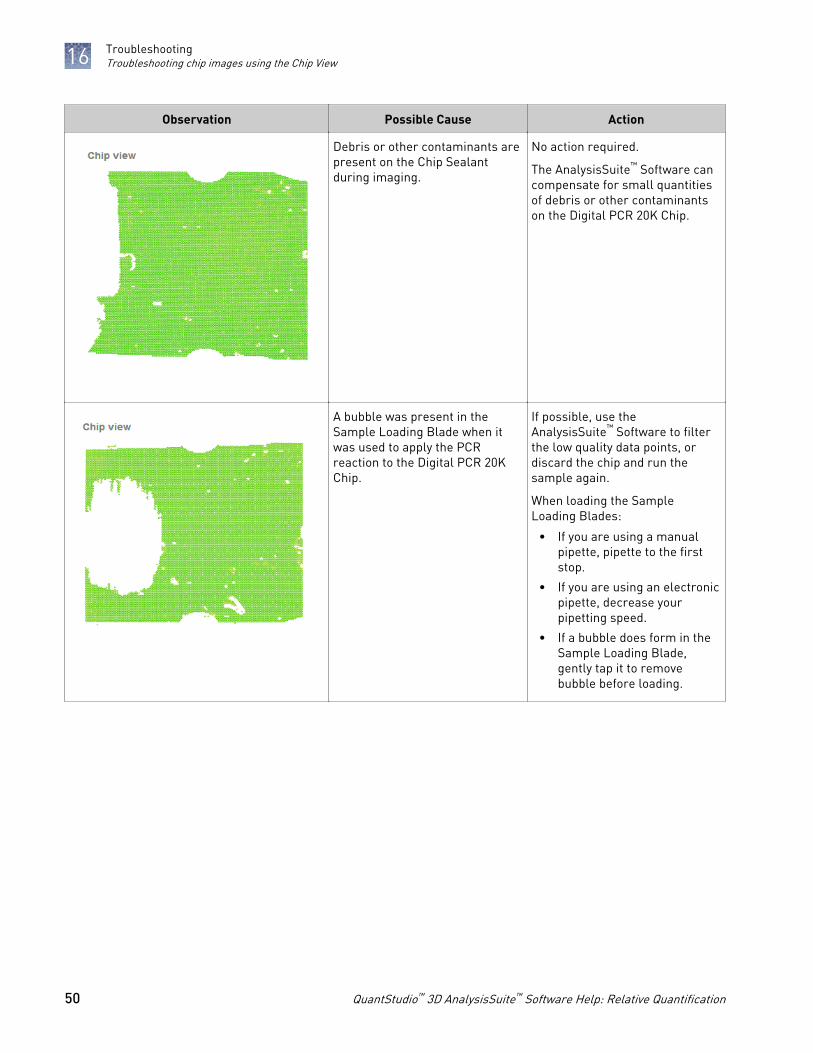
Observation Possible Cause Action
Debris or other contaminants arepresent on the Chip Sealantduring imaging.
No action required.
The AnalysisSuite™ Software cancompensate for small quantitiesof debris or other contaminantson the Digital PCR 20K Chip.
A bubble was present in theSample Loading Blade when itwas used to apply the PCRreaction to the Digital PCR 20KChip.
If possible, use theAnalysisSuite™ Software to filterthe low quality data points, ordiscard the chip and run thesample again.
When loading the SampleLoading Blades:
• If you are using a manualpipette, pipette to the firststop.
• If you are using an electronicpipette, decrease yourpipetting speed.
• If a bubble does form in theSample Loading Blade,gently tap it to removebubble before loading.
TroubleshootingTroubleshooting chip images using the Chip View16
50 QuantStudio™ 3D AnalysisSuite™ Software Help: Relative Quantification

Observation Possible Cause Action
• Excess PCR reaction waspresent on the Digital PCR20K Chip after loading it withthe Sample Loading Blade.
• The Sample Loading Bladewas drawn across the chiptoo quickly or at an angleshallower than 70-80°.
If possible, use theAnalysisSuite™ Software to filterthe low quality data points, ordiscard the chip and run thesample again.
To prevent leaving excess PCRreaction on the Digital PCR 20KChips:
• Confirm that the heatedblock used to load DigitalPCR 20K Chips is set to40±1°C.
• Make sure to wait20 seconds after loading aDigital PCR 20K Chip beforepre-wetting it withImmersion Fluid.
• Make sure to install theTiltBase to the GeneAmp® PCRSystem 9700. You mustthermal cycle the DigitalPCR 20K Chips at an 11°angle.
• Make sure to draw theSample Loading Bladeacross the chip slowly(>10 seconds) and at a70-80° angle.
TroubleshootingTroubleshooting chip images using the Chip View 16
QuantStudio™ 3D AnalysisSuite™ Software Help: Relative Quantification 51

Observation Possible Cause Action
• The Digital PCR 20K Chipleaked during thermalcycling or imaging.
• A large bubble was presentin the chip (insufficientImmersion Fluid).
• Immersion Fluid was notapplied to the chipimmediately after loading(evaporation of the PCRreaction).
• Excess Immersion Fluid ispresent on the Chip CaseLid.
If present, remove excessImmersion Fluid from the chip lidand run the chip again.
If possible, use theAnalysisSuite™ Software to filterthe low quality data points.
Make sure to apply ImmersionFluid to each chip immediatelyafter loading it with PCR reaction.
To minimize leakage, whensealing each Digital PCR 20KChip:
• Wear correctly fitted glovesto prevent the glove materialfrom snagging during lidapplication.
• Make sure that the ChipCase Lid is correctly alignedto the Chip Case.
• Firmly press all four cornerswhen applying the Chip CaseLid.
• Cure the Chip Sealant underultraviolet light for at least30 seconds.
Troubleshooting analysis results
The following table summarizes some of the more common problems that can affectthe analysis results for a project as viewed in the AnalysisSuite™ Software. In some ofthe examples shown below, the conditions triggered a data quality flag.
TroubleshootingTroubleshooting analysis results16
52 QuantStudio™ 3D AnalysisSuite™ Software Help: Relative Quantification

Observation Possible Cause Action
The See Results tab does not display numerical resultsafter combining multiple chips with the same data group(sample and target or assay combination).
The software cannotcalculate numerical resultsfor one or more of the chipsin the data group. Forexample, the sampleconcentration is either toohigh or too low.
Omit the chip(s) that do notcontain numerical resultsfrom the project.
The calculated call threshold does not update in theReview Quality tab after increasing the quality threshold.
The number of data pointsis less than the minimumthreshold of 5000.
Decrease the qualitythreshold to include morethan 5000 data points.
TroubleshootingTroubleshooting analysis results 16
QuantStudio™ 3D AnalysisSuite™ Software Help: Relative Quantification 53

Documentation and support
Related documentation
Document Publicationnumber
Description
QuantStudio™ 3D Digital PCRSystem User Guide
MAN0007720 Describes the QuantStudio™ 3DDigital PCR System hardware andsoftware and provides informationon preparing, maintaining, andtroubleshooting the system.
QuantStudio™ 3D Digital PCRSystem Quick Reference
MAN0008159 Describes the QuantStudio™ 3DDigital PCR System hardware andsoftware and provides brief, step-by-step procedures for commontasks.
QuantStudio™ 3D AnalysisSuite™
Server System Quick Reference4486248 Describes the AnalysisSuite™
Server System hardware andsoftware and provides informationon installing the system and brief,step-by-step procedures forcommon tasks.
Portable document format (PDF) versions of related documentation are available at http://www.lifetechnologies.com/quantstudio3d.
Note: To open the user documentation, use the Adobe® Reader® software availablefrom www.adobe.com
Note: For additional documentation or if you cannot access the user documentation,see “Obtaining support” on page 54.
Obtaining support
For the latest services and support information for all locations, go to:
www.lifetechnologies.com/support
At the website, you can:• Access worldwide telephone and fax numbers to contact Technical Support and
Sales facilities• Search through frequently asked questions (FAQs)
54 QuantStudio™ 3D AnalysisSuite™ Software Help: Relative Quantification

• Submit a question directly to Technical Support ([email protected])• Search for user documents, SDSs, vector maps and sequences, application notes,
formulations, handbooks, certificates of analysis, citations, and other productsupport documents
• Obtain information about customer training• Download software updates and patches
Limited product warranty
Life Technologies Corporation and/or its affiliate(s) warrant their products as set forthin the Life Technologies' General Terms and Conditions of Sale found on LifeTechnologies' website at www.lifetechnologies.com/termsandconditions. If you haveany questions, please contact Life Technologies at www.lifetechnologies.com/support.
Documentation and supportLimited product warranty
QuantStudio™ 3D AnalysisSuite™ Software Help: Relative Quantification 55

Headquarters5791 Van Allen Way | Carlsbad, CA 92008 USA | Phone +1 760 603 7200 | Toll Free in USA 800 955 6288For support visit lifetechnologies.com/support or email [email protected]
lifetechnologies.com
19 February 2014