release 2t10 ingls final clean - mzweb.com.br file2 management agenda during the first six months of...
TRANSCRIPT

1
2Q10 EARNINGS RELEASE
Belo Horizonte, August 11th, 2010 - Kroton Educacional S/A (BM&FBovespa: KROT11), “Kroton”
or the “Company”, announces today its results for the second quarter of 2010. Except where
stated otherwise, the Company’s operating and financial information is presented on a
consolidated basis and in Brazilian Reais, in accordance with Brazilian corporate law.
MESSAGE FROM THE MANAGEMENT
Our main objective in 2010 is to integrate Kroton and IUNI into ONE COMPANY, BETTER AND
STRONGER, preparing it for solid growth in 2011.
The focus of management in the second quarter of 2010 was the Post Merger Integration
(PMI) project, with 15 task forces that designed the streamlined processes and defined all the
parameters and systems of the resulting company.
Two projects that became operational on August 1st are a priority for the successful integration
of Kroton and IUNI: (a) implementation of the new Academic Model for Post-Secondary
Education and (b) unification of the financial ERPs and of the integrated planning and control
process. Both goals were successfully achieved. The relevant impact of these projects on
academic and management quality and on the Company’s operating margins will begin to
show in 3Q10, as detailed in this report.
The other PMI projects are being implemented according to their specific schedules. Several of
the Company's departments have already been unified. The remaining ones, which depend on
more complex system integration and/or geographic changes, will be completely consolidated
by the end of 2010.
EXECUTIVE SUMMARY
INVESTOR
RELATIONS
Carlos Lazar – Head of IR
Thiago Ribas - Manager
Phillipe Casale – Analyst
Phone number:
+55 (11) 3775-2002 / 2003
E-mail: [email protected]
www.kroton.com.br/ir
CONFERENCE CALL
Portuguese: English:
09:30 AM – Brasília 11:00 AM – Brasília
08:30 AM – New York 10:00 AM – New York
01:30 PM – London 03:00 PM – London
Tel: +55 (11) 2188-0155 Tel: +1 (973) 935-8893
Replay: +55 (11) 2188-0155 Replay: +1 (706) 645-9291
Code: Kroton Code: 87839529
Webcast: Webcast:
www.kroton.com.br/ri www.kroton.com.br/ir

2
Management Agenda
During the first six months of 2010, the Company defined and implemented integration and
costs optimization projects. In the second half of the year, management will review the
company´s strategy, adjusting its commercial positioning, redesigning the course offerings, and
improving the students retention and attraction processes.
INTEGRATION STATUS
New Academic Model
The new academic model became operational on August 1st at all post-secondary education
facilities, including both Pitágoras and IUNI units. The new model was designed after IUNI’s
successful experience and based on the best concepts of the Pitágoras teaching model.
The new academic model will assure high educational standards to our students by introducing
new concepts and improvements, including extracurricular activities and several digital tools to
support the teaching and learning processes. The content of all courses were redesigned based
on the balanced-scorecard (BSC) methodology, which takes into consideration each market’s
demands and individual needs in order to assure that our students are prepared to succeed in
their personal and professional lives.
The implementation of the new model will also immediately improve the operation’s gross
margin, mainly at the Pitágoras units, by optimizing both the curriculum matrix and the
number of traditional classroom hours. With the new model, the number of faculty at
Pitágoras facilities decreased by 449 professors for the second half of 2010.
- Definition of PMI project
- Integrated Structure
- Designation of Executive Officers
- Integration projects
– 15 task forces
March
–June
August 1st
May
-Dec.
Sept.March
2010
Nov.
-Dec.
2011
- Start-up of the new academic model
- New management model– greater predictability and
control
-Start-up of integrated ERP
- New budget and control processes
-Strategic Review
- Review of courses' portfolio
- Positioning and pricing
- Redesigning processes
- Complete integration
- Expense reduction–suppliers, rent/leasing, general expenses
- Quick wins
- Strategy for organic growth
- New commercial and advertising strategy
- Preparation of 2011 Budget
- New acquisitions

3
To implement the new academic model, several activities were carried out in 2Q10, including:
• Review of the content of all courses with the revision and adaptation of over 2,200
curriculum matrixes ;
• Individual review of curriculum matrixes for the over 40,000 Pitágoras students;
• Implementation of the Faculty and Student Portals;
• Implementation of an intense training program for directors, coordinators and
professors;
• Holding hundreds of meetings with directors, coordinators, professors and students;
• Holding several meetings with the Professors’ Unions; a company proposal essentially
based on maintaining scholarships for faculty who are no longer part of our staff was
approved;
• Communication with the responsible authorities.
See the “KROTON NEW ACADEMIC MODEL” on Kroton’s investor relations website:
www.kroton.com.br/ir, for more information on the model's premises and concepts.
Structural and Process Changes
To guarantee a fast integration of the Company’s financial systems, we decided to use the
“Protheus” system, which was used by IUNI as the single company´s ERP, and the “RM”
system, which Kroton uses for payrolls. Consequently, as of August 1st, Kroton discontinued the
Datasul financial ERP. By the end of the year, the payroll of all IUNI´s units will have migrated
to the RM system.
The new integrated ERP is essential for the implementation of the new management and
control process and to unify the control, finances and human resources teams. The
management model implemented assures budget execution following the approved budget
through a system that only allows for the disbursement of previously-approved operating
expenses and investments.
“Lyceum”, Kroton’s academic system, was improved and adjusted to operate in accordance
with the Company’s new academic model and also with Protheus. “Olimpo”, IUNI’s academic
system, was also improved.
Improvements to credit and collection processes implemented at Kroton are being expanded
to IUNI’s units.
The Company’s integrated organizational structure has been defined and several departments
and facilities have already optimized their staff. The new structure will be fully in place by the
end of the year.
The back-office structure of the Company’s campuses was redefined and adjusted to fall into
one of three structural patterns based on the number of students. Integrated support rooms
for professors and students were implemented at all facilities. The organization structure and
staffing levels of the integrated company as well the necessary adjustments to be
implemented by the end of 2010 have been defined.
4
Synergies
Taking into consideration the successful implementation of the new academic model and
integration projects, and the additional actions that will be fully implemented by the end of
the year, management is confident to indicate the financial goals described below.
With the adjustment on the teaching staff of 449 professors, the new academic model will
allow for annualized savings of R$14.4 million for the period August-December 2010. With the
full implementation of the academic model savings of R$17 million/year will be achieved by
2011-2012.
Furthermore, the adjustment of the administrative staff already implemented, of 630 people,
will reduce the administrative payroll by R$16.2 million/year, already impacting the period
August-December 2010.
In addition to the adjustments implemented in the academic and back-office areas which
reduced the staff by 1,079 people, other actions that have been implemented to optimize
costs, corresponding to R$4 million/year, will also impact positively the financial performance
in the second half of the year. Many other initiatives currently under way will provide
additional synergies in the future.
With the completion of the integration project and the implementation of the new academic
model, synergies from the integration of IUNI will exceed R$40 million/year compared with the
R$20 million originally forecasted. Due to more profound optimizations, non-recurring
integration costs will reach approximately R$30 million (R$15 million in the first half and R$15
million in the second half of the year), higher than the R$20 million estimated during the
acquisition. The main difference is related to a larger number of layoffs than originally
forecasted. Taking into consideration that the benefits of the new academic model and back-
office adjustments will impact mainly the period from August to December, the Company’s
estimate for the 2010 pro forma adjusted EBITDA (excluding non-recurring expenses) is R$60
million (or nearly R$68 million, also excluding start-up and greenfield expenses, which can no
longer be deferred).
Based on the results from August to December, the Company’s annualized EBITDA running
rate, excluding non-recurring payment expenses, will be approximately R$100 million/year.
Finally, EBITDA margin should reach between 22% and 23% in 2012-2013 by completing the
integration and the process-optimization projects, fully implementing the new academic
model and gradually adjusting gross margins in courses with lackluster margins.

5
2Q10 RESULTS
2Q10 results were impacted by R$11.7 million in non-recurring expenses (R$15.8 million in the
first six months of 2010 – pro forma), mainly due to the acquisition of IUNI and the integration
project, as detailed below:
* Pro-forma data (consolidating all the months of IUNI’s results in the period)
In addition, margins have also been impacted by several factors, including:
(a) expenses and costs from the following greenfields and start-ups: Barreiro, Poços de Caldas,
Votorantim, Governador Valadares, Feira de Santana, Marabá and Maceió - totaling R$3.7
million in 2Q10 and R$6.4 million in the pro forma first six months of 2010;
(b) provision for the stock option program (R$1.0 million in 2Q10 and R$1.6 million in the first
six months of 2010);
(c) specific discounts at the facilities acquired from IUNI due to promotional campaigns
implemented before the acquisition for the purpose of bringing in new students;
(d) negative performance in some Pitágoras units that still have courses with negative gross
margins;
(e) seasonal lower EBITDA in the primary and secondary education segment, since most of the
revenues are posted in the first quarter; and
(f) negative EBITDAs from Projecta, the new basic education segment focused in the public
sector (R$0.7 million in 2Q10 and R$0.6 million in the first six months of 2010).
EBITDA adjusted for the exclusion of non-recurring and start-up expenses amounted to R$2.3
million in 2Q10 (1.5% over net revenue) and R$46.8 million in the first six months pro forma
(13.6% over net revenue).
* Pro-forma data (consolidating all the months of IUNI’s results in the period)
NEW FIES – FINANCING FOR POST-SECONDARY EDUCATION STUDENTS
In May 2010, the Ministry of Education announced a new students loan program (new FIES),
which could have a huge impact on the sector’s growth. The new FIES may also have a
significant effect on reducing delinquency and student dropout rates.
Values in R$ ('000) 2Q10 1Q10* 6M10*
IUNI Acquisition - Auditors, Lawyers and Consultants (1,523) (716) (2,239)
Integration Project - Consultings (5,299) (1,145) (6,444)
Integration Project - Layoff Expenses (4,451) - (4,451)
Other (450) (2,179) (2,629)
Total of Non-recurring Expenses (11,723) (4,040) (15,763)
Values in R$ ('000) 2Q10 1Q10* 6M10*
EBITDA (13,045) 37,903 24,858
(-) Non-Recurring Expenses 11,723 4,040 15,763
(-) Costs and Expenses of Start-Ups and Greenfields 3,674 2,539 6,212
Adjusted EBITDA 2,352 44,482 46,833
Adjusted EBITDA Margin 1.5% 23.6% 13.6%

6
According to the new measure, students will have access to lines of credit at an interest rate of
3.4% p.a., with an 18-month grace period following graduation and maturity of more than 3-
times the course length.
In June and July, the Company implemented a support structure to facilitate students’ access
to FIES. Defaulting and dropout students were targeted in this period. Until August 10th, 2010,
about 1,500 students had signed contracts for the new FIES and more 2,500 students were
with their approval processes in progress. Another 3,000 students who were already part of
the FIES will also migrate to the new conditions. Therefore we shall have approximately 7,000
students in the FIES by the end of this year and surpass 10,000 by the beginning of 2011.
Several initiatives were put into place, including:
• For new and current students:
- Creation of an exclusive Kroton webpage - www.novofies.com.br
- Material on the FIES for marketing consultants and to monitor sign-ups;
- Billboard campaigns in facilities eligible to participate in FIES;
- Active call-center campaigns and wide announcements in eligible facilities;
- Announcements through attendants within the student support system;
- Announcements regarding FIES in classrooms;
- Contact with students with scholarships and default students to offer FIES;
- Creation of special rooms containing FIES promotional material in each unit;
- Agreements with the Caixa Econômica (Federal Bank that supports the FIES) for on-
campus assistance.
• Dropout students:
- Active call-center campaigns in conjunction with collection initiatives;
- The creation of a link on the student portal containing information on FIES.
The Company expects the number of students associated with FIES to increase since admission
examinations will include this new option to attract and retain students in the different
facilities.
Kroton also understands that the new FIES will show the competitive advantages of schools
that provide quality education with strong brands and reputation, since the average course
ticket will be less relevant in the students’ decision and choice. In this sense, the Company
recently concluded an extensive segmentation and positioning study supported by Copernicus
Marketing Consulting showing that, the Pitágoras brand is well recognized in the cities where
the study was conducted and stands out for its quality education compared to its competitors.
The combination of a brand name, strong reputation, and availability of attractive financing
will allow the Company to attract new students and reduce delinquency and dropouts.
ASSIGNMENTS
In May 2010, IUNI and Kroton integrated their post-secondary education into a single
management unit. Rodrigo Galindo, former IUNI´s CEO, was assigned to this position.

7
In August 11, 2010, the Board of Directors appointed Renato Friedrich as the Company’s Chief
Financial Officer (CFO). A professional with extensive experience, he holds a bachelor’s degree
in Economics from Universidade da Região de Joinville — Univille and a MBA from the School
of Business Administration and Management of Santa Catarina State University (ESAG/UDESC).
Renato also holds certificate programs in Management and Finance by Wharton and Yale.
Among his previous experiences, Renato has served as CFO and IRO at Datasul S.A., BCP
Telecomunicações S.A., BSE Telecomunicações S.A. and Electrolux do Brasil S.A., and was
Executive Vice President of M. Abuhab Participações and CFO of Agentrics LLC and NeoGrid
S.A.
Carlos Lazar was hired to head up the Investor Relations Department, and Fernando Inoshita
was hired as the Company controller.
OPERATING
PRIMARY AND SECONDARY EDUCATION
Recent mergers and acquisitions and the presence of international players in primary and
secondary education have shown the importance of this segment in the education industry.
Kroton is one of the main companies in this segment, and Pitágoras is recognized throughout
Brazil for its solid reputation regarding quality in education. Since its foundation in the 1960s,
the Company has experience operating primary and secondary educational facilities. Since the
1990s, it has been offering education-related solutions to a network comprising over 720
associated schools that serve 265,000 students.
In 2009, the Company started selling its services to public schools through the Projecta brand
based on its 40-year experience in the private sector and supported by its own management
technology used in the municipalities, which was tested for over ten years by Fundação
Pitágoras. Twenty-four thousand students in primary and secondary public schools are already
part of Projecta. There is great potential for growth in the primary and secondary public sector,
which is substantially larger than the private sector.
In 2010, the Company has been developing several improvements focusing on quality and
using state-of-the-art educational and support tools to be offered to the primary and
secondary education network. Some of the developments to be introduced in 2011 are:
• A new Educational Portal that allows integration among students, parents and teachers
through a virtual platform;
• The Robotics Project in partnership with Lego that brings together state-of-the-art
technology and learning;
• The “Mind Lab”, which consists of brain teasers (tabletop games) linked to the course
program;
• “The Connected Room” - using laptops, students can keep up with the topics shown on a
digital board.
PERFORMANCE

8
Primary and Secondary Education Student Evolution
Associated Schools – Nationwide Platform
POST-SECONDARY EDUCATION
In the second quarter of 2010, there were 88,094 post-secondary education students in the
Company, of which 78,8 thousand were enrolled in our bachelor’s and associate degree
programs and 9,2 thousand in graduate programs.
In 2Q10, Pitágoras units conducted their last quarterly entrance exam. The admission
processes will now be held every six months following the implementation of the new
academic model.
With the new graduate and transfer students, Kroton added 5,691 students. Dropout students
and graduates totaled 5,946 students.
3
121
7
3
2
4
11
714
8
12
19
139
22
21
16
2
8
343
14
77
8
25
37
202720 Primary and Secondary Associate Schoolsin Brazil (+6 in Japan)
216,600 241,000
10,000
24,000
2007 2008 2009 2010
Private Network Public Network - PROJECTA
183,900207,800
226,600
265,000

9
Post-Secondary Education Student Evolution
Post-Secondary Units
88,3495,691 (1,957) (3,989) 88,094
1Q10 New Students Drop Out Graduates 2Q10
Macapá(AP)
Marabá(PA)
Lauro de Freitas(BA)
São Luis(MA)
Salvador(BA)
Itabuna(BA)
Feira de Santana(BA)
Teixeira de Freitas(BA)
Linhares(ES)
Guarapari(ES)
Rio de Janeiro(RJ)
Votorantim(SP)
Jundiaí(SP)
Londrina(PR)
Belo Horizonte(MG) 8 units
Uberlândia(MG)Poços de Caldas(MG)
Ipatinga(MG)
Contagem(MG)
Betim(MG)
Sinop(MT) 2 units
Tangará da Serra(MT) 2 units
Cuiabá(MT) 3 units
Várzea Grande(MT)
Rondonópolis(MT) 2 units
Primavera do Leste(MT)
Divinópolis(MG)

10
FINANCIAL
MAIN PRO FORMA INDICATORS
The table above highlights the Company’s main pro-forma indicators, including IUNI’s
results from January to February 2010. Taking into consideration that the acquisition was
concluded in March 2010, the consolidated figures for the second quarter of 2010 and the
accumulated 2010 correspond to recurring amounts (excluding non-recurring expenses)
from both companies. Recurring EBITDA excludes only non-recurring expenses and costs in
the period.
CORPORATE RESULTS
Except where stated otherwise, the analysis hereinafter refers to corporate results, i.e.,
consolidating IUNI’s figures as from March 2010.
* Recurring and adjusted data exclude non-recurring expenses.
GROSS REVENUE
Values in R$ ('000) 2Q10 1Q10 Chg% 6M10
Gross Revenue 187,082 211,860 (11.7)% 398,942
Net Revenue 156,625 188,257 (16.8)% 344,882
Gross Profit 35,923 22,635 58.7% 58,558
Gross Margin 22.9% 12.0% 10.9 p.p 17.0%
Recurrring EBITDA (1,322) 41,362 n.a. 40,040
Recurring EBITDA Margin (0.8)% 22.0% (22.8) p.p. 11.6%
Adjusted Net Income (Loss) (11,820) 27,578 n.a. 15,758
Adjusted Net Income Margin (7.5)% 14.6% (22.2) p.p. 4.6%
Values in R$ ('000) 2Q10 2Q09 Chg% 1Q10 % AH 6M10 6M09 % AH
Gross Revenue 187,082 101,758 83.8% 162,145 15.4% 349,227 218,369 59.9%
Net Revenue 156,625 88,469 77.0% 144,392 8.5% 301,018 193,664 55.4%
Gross Profit 35,923 29,605 21.3% 64,734 (44.5)% 100,657 80,387 25.2%
Gross Margin 22.9% 33.5% (10.5) p.p. 44.8% (21.9) p.p. 33.4% 41.5% (8.1) p.p.
Recurrring EBITDA (1,322) 10,747 n.a. 30,409 n.a. 29,089 44,182 (34.2)%
Recurring EBITDA Margin (0.8)% 12.1% (13.0) p.p. 21.1% (21.9) p.p. 9.7% 22.8% (13.2) p.p.
Adjusted Net Income (Loss) (11,820) 7,343 n.a. 23,284 n.a. 11,464 32,872 (65.1)%
Adjusted Net Income Margin (7.5)% 8.3% (15.8) p.p. 16.1% (23.7) p.p. 3.8% 17.0% (13.2) p.p.
Values in R$ ('000) 2Q10 2Q09 Chg% 1Q10 Chg% 6M10 6M09 Chg%
Gross Revenue 187,082 101,758 83.8% 162,145 15.4% 349,227 218,369 59.9%
Primary and Secondary Education 27,577 29,090 (5.2)% 55,613 (50.4)% 83,190 75,334 10.4%
Post Secondary Education 159,505 72,668 119.5% 106,532 49.7% 266,037 143,035 86.0%
(-) Gross Revenue Deductions (32,739) (13,741) 138.3% (19,454) 68.3% (52,192) (25,446) 105.1%
Primary and Secondary Education (2,679) (2,149) 24.6% (2,360) 13.5% (5,038) (3,544) 42.2%
Post Secondary Education (30,060) (11,592) 159.3% (17,094) 75.9% (47,154) (21,902) 115.3%
(+) Interenst and Penalties on
Post Secondary Education Tuition 2,282 452 404.9% 1,701 34.2% 3,983 741 437.5%
Net Revenue 156,625 88,469 77.0% 144,392 8.5% 301,018 193,664 55.4%
Primary and Secondary Education 24,898 26,941 (7.6)% 53,253 (53.2)% 78,151 71,790 8.9%
Post Secondary Education 131,727 61,528 114.1% 91,139 44.5% 222,866 121,874 82.9%
PERFORMANCE

11
55.629.1 27.6
75.3 83.2
106.5
72.7
159.5
143.0
266.0
1Q10 2Q09 2Q10 6M09 6M10
Primary and Secondary Education Post-Secondary Education
162.1
101.8
187.1218.3
349.2
Kroton’s gross revenue amounted to R$187.1 million in 2Q10, up 83.8% year over year. Gross
revenue increased from R$218.4 million in 1H09 to R$349.2 million in 1H10, up 59.9%.
Variations in gross revenue are basically due to the growth in post-secondary education after
the acquisition of IUNI, which increased Kroton’s platform by 16 new campuses and over
42,000 students.
In the first six months of 2010, Kroton recorded gross revenues of R$83.2 million in primary
and secondary education a 10.4% increase year over year. This growth is directly related to the
higher number of contracts in our education network and the annual adjustment of average
prices for teaching materials sold to associated schools.
GROSS REVENUE (R$ million)
GROSS REVENUE DEDUCTIONS
Total deductions in 2Q10 amounted to R$32.7 million, of which R$2.7 million are related to
primary and secondary education operations and R$30.1 million to post-secondary education.
In the first six months, deductions totaled R$52.2 million.
Deductions – Primary and Secondary Education
Given the fact that the sale of textbooks is exempt from the taxes PIS, COFINS and ICMS,
primary and secondary education deductions comprise taxes related to school operations,
reimbursements for teaching materials and discounts given for payments at sight.
In 2Q10, deductions amounted to R$2.7 million - R$0.8 million in taxes and R$1.9 million in
returns. Primary and secondary education deductions represented 10.8% of the segment’s net
revenue, or 1.7% of the Company's total net revenue.
Values in R$ ('000) 2Q10 2Q09 Chg% 1Q10 Chg%
Gross Revenue 27,577 29,090 (5.2)% 55,613 (50.4)%
(-) Gross Revenue Deductions (2,679) (2,149) 24.6% (2,360) 13.5%
Taxes (838) (705) 18.9% (671) 24.9%
Returns (1,839) (1,433) 28.3% (1,640) 12.1%
Other (2) (11) (81.8)% (49) (95.9)%
Net Revenue 24,898 26,941 (7.6)% 53,253 (53.2)%

12
53.326.9 24.9
71.8 78.2
91.1
61.5131.7
121.9
222.9
1Q10 2Q09 2Q10 6M09 6M10
Primary and Secondary Education Post-Secondary Education
144.4
88.4
156.6193.7
301.1
Deductions – Post-Secondary Education
In the quarter, post-secondary education reported deductions of R$30.1 million, comprising
taxes (ISS on operational revenue related to bachelor’s and associate degree programs and ISS,
PIS and COFINS on graduate courses), the ProUni scholarship program, reimbursements or
cancelled tuitions after issuing the corresponding bill and unconditional discounts. For better
understanding we have also included conditional discounts (calculated as financial expenses)
granted for timely monthly tuition payments offered to employees at companies with which
we have commercial agreements.
Year over year, the 4-p.p. increase in post-secondary education deductions over the segment’s
net revenue is due to discounts given in acquired IUNI facilities, which were incorporated into
to our financial results. The special discounts aimed at attracting more students impacted
intensely the 2Q10 and were part of a promotional program implemented before the
aforementioned acquisition.
NET REVENUE
Net revenue in the second quarter of 2010 was up 77.0% on 2Q09, for a total of R$156.6
million. This growth in revenue is the result of the addition of IUNI operations, as clearly shown
by the net revenue evolution in post-secondary education, which jumped from R$61.5 million
to R$131.7 million in 2Q10.
In the first six months of the year, total revenue stood at R$301.0 million, with an 8.9%
increase in revenue from primary and secondary education and an 82.9% increase in revenue
from post-secondary education.
NET REVENUE (R$ million)
Values in R$ ('000) 2Q10 2Q09 Chg% 1Q10 Chg%
Gross Revenue 159,505 72,668 119.5% 106,532 49.7%
(-) Gross Revenue Deductions (30,060) (11,592) 159.3% (17,094) 75.9%
Taxes (3,628) (2,071) 75.2% (2,676) 35.6%
ProUni (13,889) (5,962) 133.0% (8,265) 68.0%
Returns (1,544) (141) 995.0% (1,126) 37.1%
Unconditional Discounts (138) (861) (84.0)% (252) (45.2)%
Conditional Discounts (10,861) (2,557) 324.8% (4,776) 127.4%
(+) Interenst and Penalties on Post Secondary 2,282 452 404.9% 1,701 34.2%
Net Revenue 131,727 61,528 114.1% 91,139 44.5%

13
Average Ticket The price of books sold to primary and secondary schools were increased by 5% at the
beginning of the year in accordance with the variation of the Extended Consumer Price Index
(INPC) during the period. In 2010, the average annual net ticket for primary and secondary
education stood at R$349.65.
In post-secondary education, of the tuition for all courses was adjusted in accordance with the
variation of INPC. Following a standardizing of calculation criteria between Kroton and IUNI,
the average net ticket for 2Q10 was R$495.63 per month.
COSTS OF PRODUTCS AND SERVICES
Vertical Analysis – Costs of Products and Services
The Company's total costs in the second quarter of 2010 totaled R$120.7 million, or 77.1% of
Kroton's net revenue in the period. Costs of post-secondary education – the segment with the
greatest share in Kroton's business mix – were responsible for over 90.5% of all costs, equal to
69.7% of net revenue in 2Q10.
The cost of products related to the publishing and printing of teaching material for Kroton’s
primary and secondary education network totaled R$4.1 million in the quarter, equivalent to
2.6% of the Company’s net revenue, versus 3.9% in 2Q09.
In post-secondary education, faculty and other personnel totaled R$69.6 million in the quarter
(44.4% of the Company's net revenue).
Values in R$ ('000) 2Q10 2Q09 Chg% 1Q10 Chg% 6M10 6M09 Chg%
Costs of Products and Services (120,702) (58,864) 105.1% (79,659) 51.5% (200,361) (113,277) 76.9%
Primary and Secondary Education
Costs of Products (Associated Schools Network) (4,105) (3,455) 18.8% (9,015) (54.5)% (13,120) (10,651) 23.2%
Costs of Services (Own Operations) (7,407) (7,361) 0.6% (6,364) 16.4% (13,770) (14,089) (2.3)%
Faculty and Other Personnel (6,046) (6,056) (0.2)% (4,525) 33.6% (10,570) (11,062) (4.4)%
Rent (203) (326) (37.7)% (210) (3.3)% (413) (616) (33.0)%
Administrative Costs (1,035) (979) 5.7% (1,084) (4.5)% (2,119) (2,166) (2.2)%
Other (123) - n.a. (545) (77.4)% (668) (245) 172.7%
Post Secondary Education
Costs of Services (109,190) (48,048) 127.3% (64,280) 69.9% (173,471) (88,537) 95.9%
Faculty and Other Personnel (69,599) (30,906) 125.2% (37,832) 84.0% (107,431) (56,034) 91.7%
Rent (14,395) (5,554) 159.2% (10,188) 41.3% (24,584) (11,006) 123.4%
Administrative Costs (24,008) (11,193) 114.5% (15,462) 55.3% (39,470) (20,746) 90.3%
Other (1,188) (395) 200.8% (798) 48.9% (1,986) (751) 164.4%
Values in R$ ('000) 2Q10 2Q09 Chg% 1Q10 Chg% 6M10 6M09 Chg%
Costs of Products and Services (77.1)% (66.5)% (10.5) p.p. (55.2)% (21.9) p.p. (66.6)% (58.5)% (8.1) p.p.
Primary and Secondary Education
Costs of Products (Associated Schools Network) (2.6)% (3.9)% 1.3 p.p (6.2)% 3.6 p.p (4.4)% (5.5)% 1.1 p.p
Costs of Services (Own Operations) (4.7)% (8.3)% 3.6 p.p (4.4)% (0.3) p.p. (4.6)% (7.3)% 2.7 p.p
Faculty and Other Personnel (3.9)% (6.8)% 3.0 p.p (3.1)% (0.7) p.p. (3.5)% (5.7)% 2.2 p.p
Rent (0.1)% (0.4)% 0.2 p.p (0.1)% 0.0 p.p (0.1)% (0.3)% 0.2 p.p
Administrative Costs (0.7)% (1.1)% 0.4 p.p (0.8)% 0.1 p.p (0.7)% (1.1)% 0.4 p.p
Other (0.1)% 0.0% (0.1) p.p. (0.4)% 0.3 p.p (0.2)% (0.1)% (0.1) p.p.
Post Secondary Education
Costs of Services (69.7)% (54.3)% (15.4) p.p. (44.5)% (25.2) p.p. (57.6)% (45.7)% (11.9) p.p.
Faculty and Other Personnel (44.4)% (34.9)% (9.5) p.p. (26.2)% (18.2) p.p. (35.7)% (28.9)% (6.8) p.p.
Rent (9.2)% (6.3)% (2.9) p.p. (7.1)% (2.1) p.p. (8.2)% (5.7)% (2.5) p.p.
Administrative Costs (15.3)% (12.7)% (2.7) p.p. (10.7)% (4.6) p.p. (13.1)% (10.7)% (2.4) p.p.
Other (0.8)% (0.4)% (0.3) p.p. (0.6)% (0.2) p.p. (0.7)% (0.4)% (0.3) p.p.

14
9.0 3.5 4.1
70.6
55.4
116.6
55.2%
66.5%
77.1%
0,0
20,0
40,0
60,0
80,0
100,0
120,0
140,0
160,0
180,0
100,0
120,0
1Q10 2Q09 2Q10
Costs of Products Costs of Services Total Costs / Net Revenue %
58.9
120.7
79.6
The 15.4-p.p. increase in the cost of post-secondary services as a percentage of net revenue
between 2Q09 and 2Q10 is mainly the result of costs related to start-ups that are still under
development (new courses and greenfield facilities in Poços de Caldas, Barreiro, Feira de
Santana, Votorantim, Marabá, Governador Valadares and Maceió).
COST OF PRODUCTS AND SERVICES (R$ million)
GROSS PROFIT AND GROSS MARGIN
Kroton’s gross profit in the second quarter of 2010 increased by 21.3% year over year, ending
2Q10 at R$35.9 million (gross margin of 22.9%). Growth in the period totaled 25.2%, up from
R$80.4 million in the first half of 2009 to R$100.6 million in the first six months of 2010.
Primary and Secondary Education
Kroton’s gross profit in the primary and secondary education segment totaled R$13.4 million in
2Q10, with a margin of 53.8%. This result is made up of the Kroton’s own operations - which
include the Company's schools and contracts with private companies to operate schools - and
the educational network of associated schools.
Due to its scale and current stage of maturity, the primary and secondary education network's
Values in R$ ('000) 2Q10 2Q09 Chg% 1Q10 Chg%
Gross Revenue 27,577 29,090 (5.2)% 55,613 (50.4)%
Own Operations 10,584 9,620 10.0% 8,396 26.1%
Associated Schools Network 16,993 19,470 (12.7)% 47,217 (64.0)%
Net Revenue 24,898 26,941 (7.6)% 53,253 (53.2)%
Own Operations 9,866 8,897 10.9% 7,827 26.1%
Associated Schools Network 15,032 18,044 (16.7)% 45,426 (66.9)%
Gross Profit 13,387 16,125 (17.0)% 37,874 (64.7)%
Own Operations 2,459 1,536 60.1% 1,463 68.1%
Associated Schools Network 10,927 14,589 (25.1)% 36,411 (70.0)%
Gross Margin 53.8% 59.9% (6.1) p.p. 71.1% (17.4) p.p.
Own Operations 24.9% 17.3% 7.7 p.p 18.7% 6.2 p.p
Associated Schools Network 72.7% 80.9% (8.2) p.p. 80.2% (7.5) p.p.

15
margins contribute significantly more than those of the Company’s own operations. The
education network recorded a gross margin of 72.7% in 2Q10, while the margin from the
Company's own operations stood at 24.9%.
The 8.2-p.p. decrease in the education network’s gross margin from 2Q09 to 2Q10 is the result
of the introduction of new businesses, such as Projecta - an education network for public
schools - in an early stage of operations.
Post-Secondary Education
Many post-secondary education facilities are currently in the process of organic growth and
maturation, while several are still in the earliest stages of development. Several other facilities
acquired in the last few years are currently undergoing restructuring in order to increase their
margins. Thus, the gross margin in 2Q10 stood at 17.1%.
OPERATING EXPENSES
Vertical Analysis – Operating Expenses
The Company’s total operating expenses in the second quarter of 2010 totaled R$47.4 million.
In addition to these expenses, Kroton recorded non-recurring expenses amounting to R$11.7
million in 2Q10 and R$15.2 million in 1H10 (excluding the months of January and February for
IUNI) mainly related to the process of integrating IUNI.
For the second half of the year, additional non-recurring expenses of nearly R$15.0 million
should be recorded as a consequence of the integration process and implementation of the
new academic model.
Values in R$ ('000) 2Q10 2Q09 Chg% 1Q10 Chg%
Gross Revenue 159,505 72,668 119.5% 106,532 49.7%
Net Revenue 131,727 61,528 114.1% 91,139 44.5%
Gross Profit 22,537 13,480 67.2% 26,859 (16.1)%
Gross Margin 17.1% 21.9% (4.8) p.p. 29.5% (12.4) p.p.
Values in R$ ('000) 2Q10 2Q09 Chg% 1Q10 Chg% 6M10 6M09 Chg%
Gross Profit 35,923 29,605 21.3% 64,734 (44.5)% 100,657 80,387 25.2%
Operational Expenses (Income) (47,372) (22,627) 109.4% (39,448) 20.1% (86,820) (43,752) 98.4%
Selling Expenses (19,356) (12,049) 60.6% (19,834) (2.4)% (39,190) (21,941) 78.6%
Personnel Expenses (15,342) (4,732) 224.2% (10,575) 45.1% (25,916) (9,060) 186.1%
General and Administrative (10,557) (6,588) 60.2% (8,780) 20.2% (19,337) (13,879) 39.3%
Other Operating Income (Expenses) (1,962) 898 n.a. (104) n.a. (2,066) 1,439 (243.5)%
Goodwill Amortization (155) (156) (0.4)% (155) 0.0% (311) (311) (0.1)%
Non-Recurring Expenses (11,723) - n.a. (3,459) 238.9% (15,182) - n.a.
Adjusted Net Income (23,172) 6,978 n.a. 21,827 n/a (1,345) 36,635 n.a.
2Q10 2Q09 Chg% 1Q10 Chg% 6M10 6M09 Chg%
Gross Profit 22.9% 33.5% (10.5) p.p. 44.8% (21.9) p.p. 33.4% 41.5% (8.1) p.p.
Operational Expenses (Income) (30.2)% (25.6)% (4.7) p.p. (27.3)% (2.9) p.p. (28.8)% (22.6)% (6.3) p.p.
Selling Expenses (12.4)% (13.6)% 1.3 p.p (13.7)% 1.4 p.p (13.0)% (11.3)% (1.7) p.p.
Personnel Expenses (9.8)% (5.3)% (4.4) p.p. (7.3)% (2.5) p.p. (8.6)% (4.7)% (3.9) p.p.
General and Administrative (6.7)% (7.4)% 0.7 p.p (6.1)% (0.7) p.p. (6.4)% (7.2)% 0.7 p.p
Other Operating Income (Expenses) (1.3)% 1.0% (2.3) p.p. (0.1)% (1.2) p.p. (0.7)% 0.7% (1.4) p.p.
Goodwill Amortization (0.1)% (0.2)% 0.1 p.p (0.1)% 0.0 p.p (0.1)% (0.2)% 0.1 p.p
Non-Recurring Expenses (7.5)% - n.a. (2.4)% (5.1) p.p. (5.0)% - n.a.
Adjusted Net Income (14.8)% 7.9% (22.7) p.p. 15.1% (29.9) p.p. (0.4)% 18.9% (19.4) p.p.

16
BREAKDOWN OF OPERATING EXPENSES – 2Q10
Selling Expenses
Selling expenses are composed of expenses with marketing, copyrights, and provisions for
doubtful accounts (PDA). The “other” line mainly covers travel and third-party service
expenses.
Total expenses, including advertising and the sales team, dropped in relation to net revenue in
the quarter and in the first half of the year. The percentage of these expenses versus net
revenue decreased by 1.1 p.p., from 6.2% in 2Q09 to 5.1% in 2Q10. Year to date, the decrease
was 0.5 p.p.
The Company significantly adjusted its account receivables at the end of last year and
restructured its credit and collections department, with the support of a specialized
consultant. At the same time Kroton also implemented a change in the provision criteria,
adjusting the provision for doubtful accounts to meet the reality of operations and students’
profile.
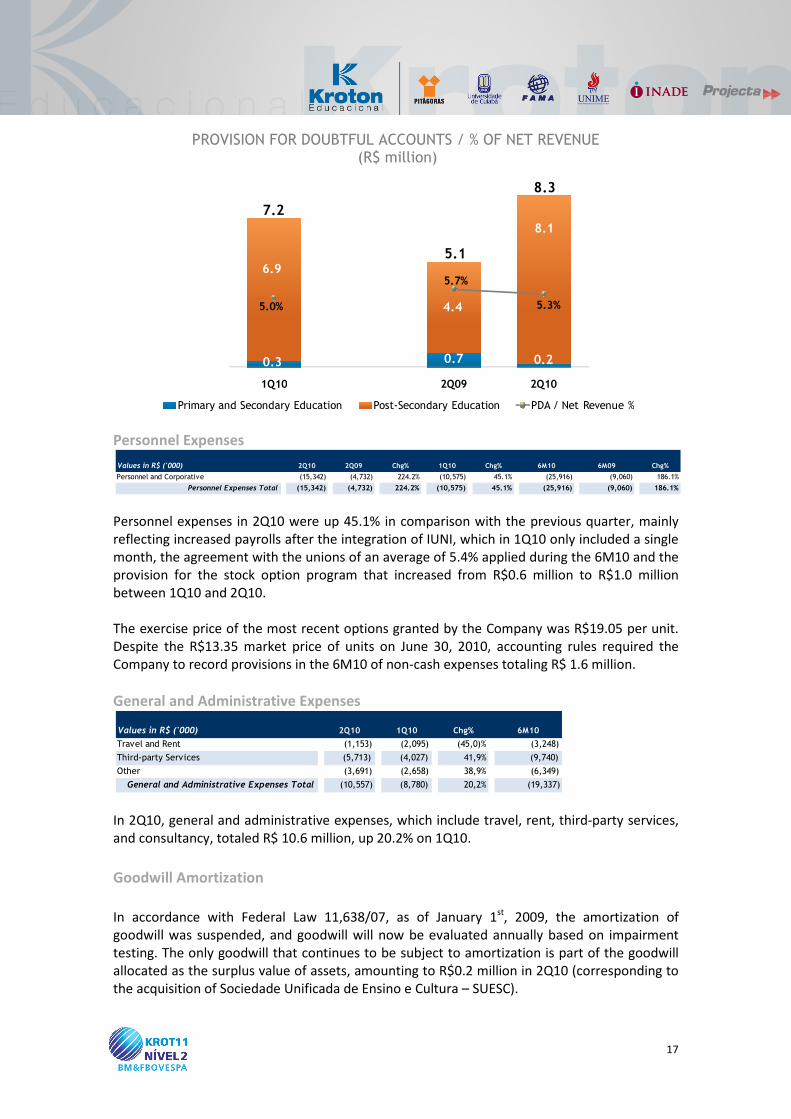
In 2Q10, the PDA was R$8.3 million, equivalent to 5.3% of the Company’s net revenue in the
period. Year to date, the PDA totaled R$15.5 million, equivalent to 5.1% of the accumulated
revenue.
Values in R$ ('000) 2Q10 2Q09 Chg% 1Q10 Chg% 6M10 6M09 Chg%
Sales Team (1,766) (740) 138.6% (1,993) (11.4)% (3,759) (1,374) 173.6%
Marketing and Copyright (6,254) (4,782) 30.8% (8,713) (28.2)% (14,967) (11,677) 28.2%
Provision for Doubtfull Account (PDA) (8,287) (5,051) 64.1% (7,193) 15.2% (15,480) (6,293) 146.0%
Other (3,049) (1,476) 106.6% (1,935) 57.6% (4,984) (2,597) 91.9%
Selling Expenses Total (19,356) (12,049) 60.6% (19,834) (2.4)% (39,190) (21,941) 78.6%
Selling Expenses
41%
Personnel Expenses
32%
General and Administrative
22%
Other Expenses4%
Goodwill Amortization
1%
17
PROVISION FOR DOUBTFUL ACCOUNTS / % OF NET REVENUE (R$ million)
Personnel Expenses
Personnel expenses in 2Q10 were up 45.1% in comparison with the previous quarter, mainly
reflecting increased payrolls after the integration of IUNI, which in 1Q10 only included a single
month, the agreement with the unions of an average of 5.4% applied during the 6M10 and the
provision for the stock option program that increased from R$0.6 million to R$1.0 million
between 1Q10 and 2Q10.
The exercise price of the most recent options granted by the Company was R$19.05 per unit.
Despite the R$13.35 market price of units on June 30, 2010, accounting rules required the
Company to record provisions in the 6M10 of non-cash expenses totaling R$ 1.6 million.
General and Administrative Expenses
In 2Q10, general and administrative expenses, which include travel, rent, third-party services,
and consultancy, totaled R$ 10.6 million, up 20.2% on 1Q10.
Goodwill Amortization
In accordance with Federal Law 11,638/07, as of January 1st, 2009, the amortization of
goodwill was suspended, and goodwill will now be evaluated annually based on impairment
testing. The only goodwill that continues to be subject to amortization is part of the goodwill
allocated as the surplus value of assets, amounting to R$0.2 million in 2Q10 (corresponding to
the acquisition of Sociedade Unificada de Ensino e Cultura – SUESC).
Values in R$ ('000) 2Q10 2Q09 Chg% 1Q10 Chg% 6M10 6M09 Chg%
Personnel and Corporative (15,342) (4,732) 224.2% (10,575) 45.1% (25,916) (9,060) 186.1%
Personnel Expenses Total (15,342) (4,732) 224.2% (10,575) 45.1% (25,916) (9,060) 186.1%
Values in R$ ('000) 2Q10 1Q10 Chg% 6M10
Travel and Rent (1,153) (2,095) (45,0)% (3,248)
Third-party Services (5,713) (4,027) 41,9% (9,740)
Other (3,691) (2,658) 38,9% (6,349)
General and Administrative Expenses Total (10,557) (8,780) 20,2% (19,337)
0.3 0.7 0.2
6.9
4.4
8.1
5.0%
5.7%
5.3%
-1,0
1,0
3,0
5,0
7,0
9,0
11,0
13,0
15,0
0,0
1,0
2,0
3,0
4,0
5,0
6,0
7,0
8,0
9,0
1Q10 2Q09 2Q10
Primary and Secondary Education Post-Secondary Education PDA / Net Revenue %
5.1
8.3
7.2
18
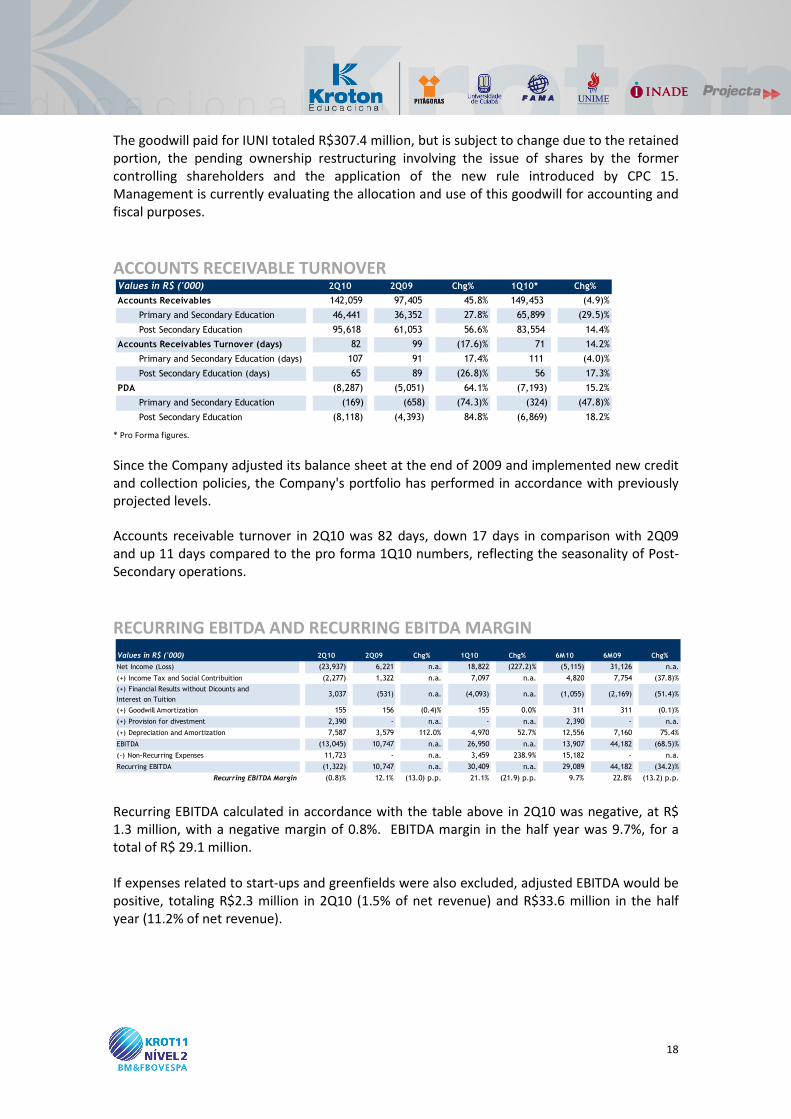
The goodwill paid for IUNI totaled R$307.4 million, but is subject to change due to the retained
portion, the pending ownership restructuring involving the issue of shares by the former
controlling shareholders and the application of the new rule introduced by CPC 15.
Management is currently evaluating the allocation and use of this goodwill for accounting and
fiscal purposes.
ACCOUNTS RECEIVABLE TURNOVER
* Pro Forma figures.
Since the Company adjusted its balance sheet at the end of 2009 and implemented new credit
and collection policies, the Company's portfolio has performed in accordance with previously
projected levels. Accounts receivable turnover in 2Q10 was 82 days, down 17 days in comparison with 2Q09
and up 11 days compared to the pro forma 1Q10 numbers, reflecting the seasonality of Post-
Secondary operations.
RECURRING EBITDA AND RECURRING EBITDA MARGIN
Recurring EBITDA calculated in accordance with the table above in 2Q10 was negative, at R$
1.3 million, with a negative margin of 0.8%. EBITDA margin in the half year was 9.7%, for a
total of R$ 29.1 million.
If expenses related to start-ups and greenfields were also excluded, adjusted EBITDA would be
positive, totaling R$2.3 million in 2Q10 (1.5% of net revenue) and R$33.6 million in the half
year (11.2% of net revenue).
Values in R$ ('000) 2Q10 2Q09 Chg% 1Q10* Chg%
Accounts Receivables 142,059 97,405 45.8% 149,453 (4.9)%
Primary and Secondary Education 46,441 36,352 27.8% 65,899 (29.5)%
Post Secondary Education 95,618 61,053 56.6% 83,554 14.4%
Accounts Receivables Turnover (days) 82 99 (17.6)% 71 14.2%
Primary and Secondary Education (days) 107 91 17.4% 111 (4.0)%
Post Secondary Education (days) 65 89 (26.8)% 56 17.3%
PDA (8,287) (5,051) 64.1% (7,193) 15.2%
Primary and Secondary Education (169) (658) (74.3)% (324) (47.8)%
Post Secondary Education (8,118) (4,393) 84.8% (6,869) 18.2%
Values in R$ ('000) 2Q10 2Q09 Chg% 1Q10 Chg% 6M10 6M09 Chg%
Net Income (Loss) (23,937) 6,221 n.a. 18,822 (227.2)% (5,115) 31,126 n.a.
(+) Income Tax and Social Contribuition (2,277) 1,322 n.a. 7,097 n.a. 4,820 7,754 (37.8)%
(+) Financial Results without Dicounts and
Interest on Tuition 3,037 (531) n.a. (4,093) n.a. (1,055) (2,169) (51.4)%
(+) Goodwill Amortization 155 156 (0.4)% 155 0.0% 311 311 (0.1)%
(+) Provision for divestment 2,390 - n.a. - n.a. 2,390 - n.a.
(+) Depreciation and Amortization 7,587 3,579 112.0% 4,970 52.7% 12,556 7,160 75.4%
EBITDA (13,045) 10,747 n.a. 26,950 n.a. 13,907 44,182 (68.5)%
(-) Non-Recurring Expenses 11,723 - n.a. 3,459 238.9% 15,182 - n.a.
Recurring EBITDA (1,322) 10,747 n.a. 30,409 n.a. 29,089 44,182 (34.2)%
Recurring EBITDA Margin (0.8)% 12.1% (13.0) p.p. 21.1% (21.9) p.p. 9.7% 22.8% (13.2) p.p.

19
ADJUSTED FINANCIAL RESULT
Kroton’s financial result, adjusted to eliminate interest on overdue monthly tuition payments
and conditional discounts, totaled R$3.0 million in 2Q10 and consisted of R$2.3 million in
financial revenue and R$5.3 million in expenses.
After the payment of a large part of IUNI's bank debt in March, interest on loans were down in
relation to last quarter, from R$2.0 million to R$0.7 million.
With the incorporation of IUNI, bank expenses increased, but shall be reduced in the near
future through the amplified centralization of financial operations.
INCOME TAX AND SOCIAL CONTRIBUTION TAX
As a result of the accounting loss recorded in the second quarter of 2010, the Company totaled
R$2.3 million in tax credits. This amount is the difference between the income tax and social
contribution credit of R$2.5 million from the fiscal year and deferred taxes of R$0.2 million.
As a result of ProUni, operations in post-secondary education are not taxed, and income from
primary and secondary education is taxed at a rate of 34%.
ADJUSTED NET INCOME AND ADJUSTED NET MARGIN
In addition to increased costs and expenses, which have already been addressed in this report,
accounting losses (adjusted in accordance with the table above) of R$11.8 million in 2Q10
were also the result of investment losses totaling R$2.4 million due to the sale of the Rio Claro
facility (see “Subsequent Events”). Adjusted net income in the 6M10 totaled R$11.5 million,
with a margin of 3.8%.
Values in R$ ('000) 2Q10 2Q09 Chg% 1Q10 Chg% 6M10 6M09 Chg%
Adjusted Financial Result (3,037) 531 n.a. 4,093 n.a. 1,055 2,169 (51.4)%
Adjusted Financial Revenue 2,270 2,302 (1.4)% 7,802 (70.9)% 10,071 5,690 77.0%
Interest Gain on Financial Investments 1,515 1,977 (23.4)% 6,879 (78.0)% 8,393 5,006 67.7%
Others 755 325 132.3% 923 (18.2)% 1,678 684 145.3%
Adjusted Financial Expenses (5,307) (1,771) 199.7% (3,709) 43.1% (9,016) (3,521) 156.1%
Bank Expenses (1,415) (379) 273.4% (496) 185.3% (1,911) (602) 217.4%
Interest on Loans (676) (390) 73.3% (2,083) (67.5)% (2,759) (838) 229.2%
Monetary Revaluation on Certain Liabilities (345) (372) (7.3)% (359) (3.9)% (705) (1,328) (46.9)%
Others (2,871) (630) 355.7% (771) 272.4% (3,641) (753) 383.5%
Values in R$ ('000) 2Q10 2Q09 Chg% 1Q10 Chg% 6M10 6M09 Chg%
Net Income (23,937) 6,221 n.a. 18,822 n.a. (5,115) 31,126 n.a.
(+) Deferred Income Tax and Social Contribution 239 966 (75.2)% 848 (71.8)% 1,087 1,435 (24.3)%
(+) Goodwill Amortization 155 156 (0.4)% 155 0.0% 311 311 (0.1)%
(+) Non-Recurring Expenses 11,723 - n.a. 3,459 238.9% 15,182 - n.a.
Adjusted Net Income (Loss) (11,820) 7,343 n.a. 23,284 n.a. 11,464 32,872 (65.1)%
Adjusted Net Margin (7.5)% 8.3% (15.8) p.p. 16.1% (23.7) p.p. 3.8% 17.0% (13.2) p.p.

20
CASH AND CAPITALIZATION
As specified in the IUNI stock purchase agreement, of the total value of the acquisition, part
will be paid to the company's former controller up to 145 days after the agreement’s
signature. The remaining part to be paid was estimated at R$58.1 million (subject to
adjustments considering IUNI's net debt and working capital between June 30, 2009 and
February 28, 2010). Given that the adjustment process has not yet ended, the Company paid
to seller in June 2010 R$30.0 million in advance. Also, at the end of 1Q10, R$140.9 million
were used to pay back IUNI’s bank debt.
The Company’s total cash, after these payments, was R$ 56.0 million in 2Q10. Considering a
total of R$21.4 million in loans and financing (R$8.1 million in short-term and R$13.2 million
long term), Kroton’s net cash balance in the second quarter stood at R$ 34.6 million.
CASH FLOW AND INVESTIMENTS
The Company has been rigorously reviewing the management of its investments. Funds are
invested after consistency with the approved budget, and are submitted to a rigid appraisal of
return on capital invested.
Investments in new facilities and courses are made on a selective basis, taking into account
each investment’s potential for growth and the maturity cycle. New classes only begin after a
minimum number of students have enrolled, taking into account the business’ intrinsic natural
dropout rate. The opening of new campuses is always preceded by a widespread and
substantive market analysis.
In 2Q10, in addition to the R$30.0 million payment for the acquisition of IUNI, Kroton invested
an additional R$11.5 million, broken down as follows:
(i) R$9.1 million to improve existing campuses;
(ii) R$2.4 million in corporate projects.
Values in R$ ('000) 2Q10 1Q10 Chg%
Cash and Banks 56,000 107,160 (47.7)%
Loans and Financing 21,389 21,653 (1.2)%
Short-term Debt 8,118 8,010 1.4%
Long-term Debt 13,271 13,643 (2.7)%
Shareholders Equity 787,401 814,509 (3.3)%
Total Capitalization 808,790 836,162 (3.3)%
Net Cash 34,611 85,507 (59.5)%

21
EVOLUTION OF CASH POSITION (R$ million)
SHAREHOLDING STRUCTURE
Kroton’s capital stock is represented by 436,839,622 shares, of which 229,913,715 are
common shares and 206,925,907 preferred. The Company’s free-float is 41.2%, equivalent to
25,693,314 units.
SHARE PERFORMANCE
Kroton’s units (KROT11) have been listed on Level 2 of the BM&FBovespa since July 2007,
composing the Differentiated Corporate Governance Index (IGC) and the Differentiated Share
Tag Along Index (ITAG).
KROT11 have been present in all trading sessions in 2Q10, with a trading volume of R$91.6
million in 8,590 trades and an average daily trading volume of R$1.5 million. On June 30, 2010,
shares were listed at R$13.35 per unit, equivalent to a market value of R$833.1 million.
During 2Q10, KROT11 drop 19.6%, while the Ibovespa fell by 13.4%, the IGC fell by 9.4% and
the ITAG by 8.5% in the same period. Currently, Kroton units are followed by 10 different local
and international research brokers.
107.2 (7.1)
56.0
(30.0)
(11.5)
(2.6)
Cash Position on 03/31/2010
Cash Generated from Operations
IUNI Acquisition CAPEX Cash Flow from Financing Activities
Cash Position on 06/30/2010
(57.0)(57.0)(57.0)(57.0)(57.0)(57.0)(57.0)(57.0)(57.0)(57.0)(57.0)(57.0)
CAPITAL
MARKET

22
SHARE BUYBACK
The Board of Directors approved on last May 11th the second Buyback Program, authorizing
the purchase of a maximum of one million (1,000,000) units to be held in treasury for future
sale or cancellation, equivalent to 3.9% of all outstanding shares.
This second program was carried out considering the Company's need to purchase shares in
order to honor its Stock Option Plan and considering the current price of the Company’s shares
on the market. Under the second buyback plan, as of June 30, 2010, a total of 293,800 units
had been purchased, equivalent to 29.4% of the approved total, at an average of R$14.06 per
unit.
SALE OF POST-SECONDARY UNIT
On July 26, 2010, the Company informed the market of the sale of the Instituto de Ensino de
Rio Claro e Representações (“CBTA” or “IERC”), a post-secondary educational facility located in
the city of Rio Claro in the state of São Paulo. The campus was sold considering that it did not
achieve the desired growth and still required significant investment in order to reach adequate
performance levels in line with other Kroton's post-secondary units.
The transaction totaled R$2.0 million, of which:
• R$ 1.4 million was paid up front;
• R$ 0.1 million to be paid on September 15, 2010, conditioned upon the validation of
the effective number of students enrolled on the base date of August 30, 2010;
• R$0.3 million to be paid by December 31, 2010;
• R$0.2 million to be paid by 2013.
Highlights 2Q10
Ticker KROT11
Corporate Governance Level Nível II
Total Number of Units 62,405,660
Free-Float 41.2%
Market Capitalization R$ 833.1 million
Average Daily Trade Volume (quarter average) R$ 1.5 million
Maximum (R$ per unit) R$ 16.95
Minimun (R$ per unit) R$ 12.91
Average (R$ por unit) R$ 14.94
Closing Quote on June 30th 2010 R$ 13.35
SUBSEQUENT
EVENTS

23
ABOUT KROTON EDUCACIONAL
Kroton is one of the largest private educational organizations in Brazil, operating in the primary
and secondary education segment for over 40 years and in the post-secondary education
segment since 2001. Kroton operates on an integrated and diversified basis through its own
schools and colleges, and provides education services, teaching technologies and teaching
materials to a primary and secondary education network of more than 720 partner schools. In
the post-secondary education segment, Kroton operates 39 campuses.
DISCLAIMER
This document contains forward-looking statements and information. These statements and
information are merely forecasts and not guarantees of future performance. We warn all
stakeholders that these forward-looking statements and information are and will be, as the
case may be, subject to risks, uncertainties and factors related to Kroton’s (and its controller’s)
business operations and environments, given that the real results of such corporations may
differ from predicted future results or those implied by forward-looking declarations and
information.

24
ANNEX 1 – CORPORATE BALANCE SHEET
06/30/10 % Net Rev. 03/31/10 % Net Rev. Chg%
Current Assets 222,698 21.1% 279,878 25.2% (20.4)%
Cash and Banks 56,000 5.3% 107,160 9.7% (47.7)%
Accounts Receivable 121,130 11.5% 129,970 11.7% (6.8)%
Inventories 10,478 1.0% 9,527 0.9% 10.0%
Deferred Taxes 11,311 1.1% 10,098 0.9% 12.0%
Advances to Suppliers 1,199 0.1% 1,628 0.1% (26.3)%
Other Accounts Receivable 22,580 2.1% 21,495 1.9% 5.0%
Non-current 833,441 78.9% 829,053 74.8% 0.5%
Non-current Assets 57,335 5.4% 54,595 4.9% 5.0%
Accounts Receivables 20,929 2.0% 19,483 1.8% 7.4%
Deferred Taxes 5,056 0.5% 5,807 0.5% (12.9)%
Subsidiaries Credit 115 0.0% - 0.0% n.a.
Other 31,236 3.0% 29,305 2.6% 6.6%
Investments 1,600 0.2% 1,600 0.1% 0.0%
Fixed Assets 212,007 20.1% 204,832 18.5% 3.5%
Intangible 560,130 53.0% 565,551 51.0% (1.0)%
Deferred 2,369 0.2% 2,476 0.2% (4.3)%
Total Assets 1,056,139 100.0% 1,108,931 100.0% (4.8)%
Liabilities and Shareholders' Equity
Current 156,685 14.8% 182,536 16.5% (14.2)%
Account Payable 18,094 1.7% 17,075 1.5% 6.0%
Loans and Financing 8,118 0.8% 8,010 0.7% 1.4%
Payments and Social Charges 47,827 4.5% 37,280 3.4% 28.3%
Income and Social Contribution Taxes 7,287 0.7% 9,412 0.8% (22.6)%
Tax and Contribuitons Collectable 10,394 1.0% 9,656 0.9% 7.6%
Advances from Customers 18,391 1.7% 26,941 2.4% (31.7)%
Other 46,574 4.4% 74,162 6.7% (37.2)%
Non-current Liabilities 112,027 10.6% 111,865 10.1% 0.1%
Loans and Financing 13,271 1.3% 13,643 1.2% (2.7)%
Deferred Taxes 703 0.1% 586 0.1% 20.0%
Other 98,054 9.3% 97,636 8.8% 0.4%
Minority Interest 26 0.0% 21 0.0% 23.8%
Shareholder´s Equity 787,401 74.6% 814,509 73.4% (3.3)%
Capital 821,020 77.7% 821,020 74.0% 0.0%
Capital Reserve 16,569 1.6% 15,577 1.4% 6.4%
Treasury Stocks (25,599) (2.4)% (21,436) (1.9)% 19.4%
Profit (Loss) Earnings (24,589) (2.3)% (652) (0.1)% n.a.
Total Liabilities and Shareholders' Equity 1,056,139 100.0% 1,108,931 100.0% (4.8)%
(In thousand reais, except otherwise indicated)

25
ANNEX 2 – CORPORATE QUARTERLY RESULTS
2Q10 % Net Rev. 2Q09 % Net Rev. 2Q10 /2Q09 1Q10 % Net Rev. 2Q10 /1Q10
Gross Revenue 187,082 113.2% 101,758 112.3% 83.8% 162,145 179.0% 15.4%
Primary and Secondary Education 27,577 16.7% 29,090 32.1% (5.2)% 55,613 61.4% (50.4)%
Post-secondary Education 159,505 96.6% 72,668 80.2% 119.5% 106,532 117.6% 49.7%
Deductions (21,878) (13.2)% (11,184) (12.3)% 95.6% (14,678) (16.2)% 49.1%
Primary and Secondary Education (2,679) (1.6)% (2,149) (2.4)% 24.6% (2,360) (2.6)% 13.5%
Post-secondary Education (19,199) (11.6)% (9,035) (10.0)% 112.5% (12,318) (13.6)% 55.9%
Net Revenue 165,204 100.0% 90,574 100.0% 82.4% 147,467 162.8% 12.0%
Primary and Secondary Education 24,898 15.1% 26,941 29.7% (7.6)% 53,253 58.8% (53.2)%
Post-secondary Education 140,306 84.9% 63,633 70.3% 120.5% 94,214 104.0% 48.9%
Costs of Products/Services (120,702) (73.1)% (58,864) (65.0)% 105.1% (79,659) (87.9)% 51.5%
Cost of Products Sold (4,105) (2.5)% (3,455) (3.8)% 18.8% (9,015) (10.0)% (54.5)%
Cost of Services (116,598) (70.6)% (55,409) (61.2)% 110.4% (70,644) (78.0)% 65.1%
Gross Profit 44,502 26.9% 31,710 35.0% 40.3% 67,809 74.9% (34.4)%
Operating Income (Expenses) (59,095) (35.8)% (22,627) (25.0)% 161.2% (42,907) (47.4)% 37.7%
Selling Expenses (11,069) (6.7)% (6,998) (7.7)% 58.2% (12,641) (14.0)% (12.4)%
Provision for Doubtful Accounts (8,287) (5.0)% (5,051) (5.6)% 64.1% (7,193) (7.9)% 15.2%
Personnel Expenses (19,793) (12.0)% (4,732) (5.2)% 318.3% (10,575) (11.7)% 87.2%
General and Administrative Expenses (17,829) (10.8)% (6,588) (7.3)% 170.6% (12,239) (13.5)% 45.7%
Other Operating Income (Expenses) (1,962) (1.2)% 898 1.0% n.a. (104) (0.1)% n.a.
Goodwill Amortization (155) (0.1)% (156) (0.2)% (0.4)% (155) (0.2)% 0.0%
Income (Loss) from Operations before Interests
and Financial Results(14,593) (8.8)% 9,083 10.0% n.a. 24,902 27.5% n.a.
Financial Results (11,617) (7.0)% (1,574) (1.7)% 638.0% 1,017 1.1% n.a.
Financial Expenses (16,168) (9.8)% (4,328) (4.8)% 273.6% (8,485) (9.4)% 90.5%
Financial Revenues 4,552 2.8% 2,754 3.0% 65.3% 9,503 10.5% (52.1)%
Income (Loss) from Operations (26,209) (15.9)% 7,509 8.3% n.a. 25,919 28.6% n.a.
Income Tax and Social Contribuition 2,277 1.4% (1,322) (1.5)% n.a. (7,097) (7.8)% n.a.
Current 2,516 1.5% (356) (0.4)% n.a. (6,249) (6.9)% n.a.
Deferred (239) (0.1)% (966) (1.1)% (75.2)% (848) (0.9)% (71.8)%
Minority Interest (4) (0.0)% 34 0.0% n.a. (1) (0.0)% 633.3%
Net Income (Loss) for the Period (23,937) (14.5)% 6,221 6.9% n.a. 18,822 20.8% n.a.
(In thousand reais, except otherwise indicated)

26
ANNEX 3 – CORPORATE ACCUMULATED RESULTS
6M10 % Net Rev. 6M09 % Net Rev. 6M10 / 6M09
Gross Revenue 349,227 111.7% 218,369 110.3% 59.9%
Primary and Secondary Education 83,190 26.6% 75,334 38.0% 10.4%
Post-secondary Education 266,037 85.1% 143,035 72.2% 86.0%
Deductions (36,555) (11.7)% (20,339) (10.3)% 79.7%
Primary and Secondary Education (5,038) (1.6)% (3,544) (1.8)% 42.2%
Post-secondary Education (31,517) (10.1)% (16,795) (8.5)% 87.7%
Net Revenue 312,672 100.0% 198,030 100.0% 57.9%
Primary and Secondary Education 78,151 25.0% 71,790 36.3% 8.9%
Post-secondary Education 234,520 75.0% 126,240 63.7% 85.8%
Costs of Products/Services (200,361) (64.1)% (113,277) (57.2)% 76.9%
Cost of Products Sold (13,120) (4.2)% (10,651) (5.4)% 23.2%
Cost of Services (187,241) (59.9)% (102,626) (51.8)% 82.5%
Gross Profit 112,311 35.9% 84,753 42.8% 32.5%
Operating Income (Expenses) (102,002) (32.6)% (43,752) (22.1)% 133.1%
Selling Expenses (23,709) (7.6)% (15,648) (7.9)% 51.5%
Provision for Doubtful Accounts (15,480) (5.0)% (6,293) (3.2)% 146.0%
Personnel Expenses (30,367) (9.7)% (9,060) (4.6)% 235.2%
General and Administrative Expenses (30,068) (9.6)% (13,879) (7.0)% 116.6%
Other Operating Income (Expenses) (2,066) (0.7)% 1,439 0.7% n.a.
Goodwill Amortization (311) (0.1)% (311) (0.2)% (0.1)%
Income (Loss) from Operations before Interests
and Financial Results10,309 3.3% 41,001 20.7% (74.9)%
Financial Results (10,599) (3.4)% (2,197) (1.1)% 382.4%
Financial Expenses (24,653) (7.9)% (8,628) (4.4)% 185.7%
Financial Revenues 14,054 4.5% 6,431 3.2% 118.5%
Income (Loss) from Operations (290) (0.1)% 38,804 19.6% n.a.
Income and social contribuition tax (4,820) (1.5)% (7,754) (3.9)% (37.8)%
Current (3,733) (1.2)% (6,319) (3.2)% (40.9)%
Deferred (1,087) (0.3)% (1,435) (0.7)% (24.3)%
Minority Interest (5) (0.0)% 76 0.0% n.a.
Net Income (Loss) for the Period (5,115) (1.6)% 31,126 15.7% n.a.
(In thousand reais, except otherwise indicated)
27
ANNEX 4 – CASH FLOW STATEMENT
Consolidated 2Q10 2Q09
Cash Flow from Operating Activities
Result before Income and Social Contribution Tax and Minority Interest
Adjustments for reconciling the result with the cash used in operations
Depreciation and Amortization 7,742 3,735
Capital Reserve - premium on share issue 993 -
Income on Sales of permanent asset (36) 278
Provision for Investments Loss 2,390 -
Changes in assets and liabilities
Decrease in Accounts Receivable 7,394 9,583
Increase in Inventories (951) (2,254)
Increase in other Accounts Receivable (2,874) (4,898)
Increase(Decrease) in Accounts Payable 1,019 (2,451)
Decrease in Advances from Customers (8,551) (12,088)
Increase (Decrease) in other Accounts Payable 14,129 (11,432)
Cash generated from operations (4,954) (12,018)
Interest paid on loans (1,921) 390
Taxes and Social Contribuition paid (187) (532)
Net Cash Provided by (Used in) Operating Activities (7,062) (12,160)
Cash Flow from Investing Activitie
Acquisition of fixed assets (9,119) (11,839)
Acquisitions of new colleges (30,000) -
Additions to intangible (2,356) (3,965)
Goodwill Adjustes on acquisitions - 2,020
Net Cash Provided by (Used in) Investing Activities (41,475) (13,784)
Cash Flow from Financing Activities
Treasury Stocks (4,163) (23)
Loans and Financing 1,655 (1,142)
Loan Changes (115) -
Net Cash Provided by (Used in) Financing Activities (2,623) (1,165)
Net Decrease in cash and cash equivalents (51,160) (27,109)
Cash - at Beginning of Period 107,160 105,026
Cash - at End of Period 56,000 77,917
Net increase (decrease) in cash and cash equivalents (51,160) (27,109)
(26,209) 7,509