reliability assessment of design rules for stainless … · reliability assessment of design rules...
TRANSCRIPT

Eighth International Conference on
STEEL AND ALUMINIUM STRUCTURES
Edited by B. Young
Hong Kong, China, December 7 – 9, 2016
RELIABILITY ASSESSMENT OF DESIGN RULES FOR STAINLESS
STEEL STRUCTURES
S. AFSHAN
a, P. FRANCIS
b, N.R. BADDOO
b and L. GARDNER
c
a Department of Mechanical, Aerospace and Civil Engineering, Brunel University London, London, UK
Email: [email protected]
b The Steel Construction Institute, Ascot, UK
Email: [email protected], [email protected]
c Department of Civil and Environmental Engineering, Imperial College London, London, UK
Email: [email protected]
Keywords: Material over-strength; Partial factors; Reliability; Stainless steel; Statistical parameters.
Abstract. This paper presents a re-evaluation of the current partial resistance factors
recommended in EN 1993-1-4 for the design of stainless steel elements. Material data from
key stainless steel producers were collected and carefully analysed, and representative values
of the over-strength and the coefficient of variation (COV) of the material yield strength and
ultimate tensile strength, necessary for performing reliability analysis, were established. The
EN 1990 Annex D First Order Reliability Method (FORM) was applied to a substantial pool
of experimental results. At the cross-section level, stub column and in-plane bending test
results were used to assess the γM0 partial resistance factor. At the member level, flexural
buckling and lateral-torsional buckling test results were used to evaluate the γM1 partial
resistance factor. It is revealed that the current recommended partial resistance factors in EN
1993-1-4 (γM0 = γM1 = 1.1) cannot generally be reduced, and in some cases, modified design
resistance equations are required, if the current safety factors are to be maintained.
1 INTRODUCTION
Three partial safety factors, γM0, used in cross-section design checks, γM1, employed in
member instability design checks, and γM2, used in expressions for determining the resistance
of cross-sections in tension and the resistance of bolted and welded connections, are used in
EN 1993-1-4 [1] for the design of stainless steel structural members. The partial resistance
factors allow for uncertainties in the material properties, the geometric properties and the
accuracy of the design resistance functions, and their values are obtained through calibration
of the codified design resistance equations, using reliability methods to achieve a certain target
reliability requirement. The recommended values in EN 1993-1-4 [1] are: γM0 = γM1 = 1.1 and
γM2 = 1.25. Since the establishment of the EN 1993-1-4, a substantial pool of experimental
results and statistical material and geometric data have been generated. The objective of this
study is therefore to re-evaluate these recommended partial factors in light of this information
with a focus on cross-section and member resistances (i.e. γM0 and γM1). The theoretical
background of the reliability method adopted in the Eurocodes, as outlined in EN 1990 [2], is

S.AFSHAN et al.
2
briefly described. The statistical data on material and geometric properties of structural
stainless steel sections from the literature and stainless steel producers are then presented.
Finally, reliability assessments of the EN 1993-1-4 [1] design resistance equations are carried
out, covering: cross-sections in compression, flexural buckling, in-plane bending and lateral-
torsional buckling. Note that a more comprehensive account of this investigation is reported in
[3].
2 METHODOLOGY FOR THE STATISTICAL EVALUATION OF RESISTANCE
MODELS
2.1 Theoretical background
The safety assessment of the resistance functions employed in Eurocode 3 is based on a
statistical evaluation of relevant experimental data, carried out within a probabilistic reliability
theory framework, leading to the determination of the γM values. Equation (1) presents the
probability of failure, Pf, i.e. the probability that the resistance (R) minus the action effect (E)
is less than zero, in terms of the cumulative distribution function of the standardised normal
distribution evaluated for a total reliability index . The total reliability index , which is
selected based on a series of consequence classes (CC) is directly related to the reliability
classes (RC), as defined in Annex C of EN 1990 [2]. A value of = 3.8 has been adopted in
the analyses performed in this paper, which corresponds to typical building structures will fall
into reliability class RC2 with a reference design life of 50. To calibrate the codified design
resistance functions, a semi-probabilistic approach, where the variabilities of the load effects
and resistance functions are assessed separately has been used in EN 1990 [2], through the use
of FORM sensitivity factors E and R, resulting in Equations (2) and (3) for the action effect
and resistance, respectively, where Ed is the design action effect and Rd is the design
resistance. Hence, to establish the partial safety factor for a new design procedure, only
Equation (3) needs to be considered.
0ERPPf (1)
EdEEP (2)
RdRRP (3)
The sensitivity factors may be approximately taken as E = −0.7 and R = +0.8, provided
that the ratio of the standard deviation of the action effect E and resistance R is such that
0.16 ≤ σE/σR ≤ 7.6 [2]. This means that for reliability class RC2, the probability of the
resistance of structural components falling below the design resistance is as given in Equation
(4). The partial resistance factor γM, given in Equation (5) is defined as the ratio of the
nominal resistance value rn, determined from the design resistance equation under
consideration, using the nominal geometric and material properties, and the design resistance
value rd, determined from the reliability analysis procedures using the values of basic
variables measured during testing.
001.08.38.0 dRRP (4)
d
nM
r
r (5)
S.AFSHAN et al.
3
2.2 EN 1990 Annex D method
In Annex D of EN 1990 [2], a set of application rules for obtaining the design values for a
resistance function through a statistical evaluation of experimental data is provided. The
method begins by comparing the theoretical resistance values rt,i obtained from the resistance
function under consideration grt(X), using the measured material and geometric properties,
with the experimental resistance values re,i from each test, through a plot of re,i versus rt,i
values. An error term i = re,i/brt,i, is calculated for each (rt,i,re,i) data pair, showing the
deviation of the experimental resistance values to the mean strength function re = brt, where b
is the mean value correction factor obtained as the least squares best fit of the slope of the re,i
versus rt,i plot. The coefficient of variation of this error term V is used as a measure of the
variabilities associated with the predictions from the resistance function. Considering the
logarithmic normal probability distribution of i, the coefficient of variation of the error term
is given by Equation (6), where 2 is the corresponding variance.
1exp 2 V (6)
If the scatter of the predictions is too high, i.e. large V values, to give an economical
design resistance model, procedures to reduce the scatter are required. The scatter may be
reduced by improving the design model to take into account parameters which had previously
been ignored, or by modifying the parameters b and V by dividing the total test population
into appropriate sub-sets for which the influence of such additional parameters may be
considered to be constant. In this study, the test data have been split into sub-sets based on
their material grade, as explained in more detail in Section 3. The disadvantage of splitting the
test results into sub-sets is that the number of test results in each sub-set can become very
small. In order to avoid unreasonably large safety factors as a result of this, Clause D.8.2.2.5
of EN 1990 Annex D [2] allows the use of the total number of tests in the original series for
determining the kd,n fractile factor. Hence, in this study the kd,n for each sub-set was based on
the total number of tests for all stainless steel grades, for the cross-section shape and failure
mode under consideration.
The effect of the variability of the basic variables in the resistance function grt(X),
including material and geometric properties, is also accounted for through their coefficient of
variation parameter, Vrt. There are two methods of calculating Vrt, depending on the level of
complexity of the resistance function under consideration. For the case of complex and multi-
variable resistance functions, such as the column buckling formula in EN 1993-1-4 [1], Vrt
may be obtained from Equation (7), where grt mX is the resistance function evaluated for the
mean values of the basic variables and (∂grt/∂xi)i is the partial derivative for the variable Xi
multiplied by its respective standard deviation i. Equation (8) is deemed sufficient for
resistance functions of simpler form, such as that for the bending resistance of laterally
restrained beams, where the coefficient of variation of each of the basic variables VXi is used
directly. The analyses carried out in this paper have made use of both methods as appropriate;
this is explained in more detail in Section 4. The coefficients of variation VXi of the basic
variables are generally determined on the basis of prior knowledge, and have been obtained
herein using representative data from stainless steel producers as discussed in more detail in
Section 3.
j
i
i
i
rt
mrtmrt
rtrt
X
g
XgXg
XgVARV
1
2
22
2 .1)(
(7)
S.AFSHAN et al.
4
j
i
Xirt VV1
22 (8)
Finally, the design resistance value rd, leading to the determination of the partial factor γM
is obtained from Equation (9), which applies in cases of a limited number of test results (n ≤
100). In Equation (9), b is the mean value correction factor, grt mX is the design resistance
evaluated for the mean values of the basic variables, kd,n is the design fractile factor and kd,∞ is
the design fractile factor for n tending to infinity (kd,∞ = 3.04). The following parameters: rt =
weighting factor for Qrt, δ = weighting factor for Qδ, Qrt, Qδ and Q - as defined by Equations
(10), (11), (12), (13) and (14), respectively are used to simplify the representation of the
calculations.
2
,, 5.0exp QQkQkXbgr ndrtrtdmrtd (9)
Q
Qrtrt (10)
Q
Q (11)
1ln 2 rtrt VQ (12)
1ln 2 VQ (13)
2222 with ,1ln rtrr VVVVQ (14)
3 STATISTICAL DATA ON MATERIAL AND GEOMETRIC PARAMETERS
3.1 Statistical data on yield strength
Mean values and standard deviations for the yield strength, taken as the 0.2% proof stress,
of different stainless steel grades were collected from a number of major European stainless
steel producers and from the literature [5–9]. Where a number of grades were reported,
average values for each stainless steel type austenitic, duplex and ferritic - were determined. A
summary of the results is presented in Table 1, where the data within each stainless steel type
have been grouped based on the product type - cold-rolled coil/sheet (C), hot-rolled coil/sheet
(H) and hot-rolled plate (P). Since the data from the stainless steel producers were provided
on a confidential basis, the identity of the producers have not been stated and the source is
simply indicated as Producer.
The ratio of mean to minimum specified yield strength fy,mean/fy,min and the coefficient of
variation (COV) of the mean yield strength are also provided in Table 1. The minimum yield
strength values were obtained from EN 10088-4 [10]. One of the assumptions made in the
reliability analysis procedures set out in EN 1990 Annex D is that the minimum (nominal)
yield strength, fy,min, is a characteristic value and should therefore correspond to the 95%
confidence limit. The characteristic yield strengths fy,k corresponding to each set of fy,mean and
standard deviation σ data have been evaluated, and the ratios of fy,k/fy,min are reported in Table
1. The fact that the values of fy,k/fy,min are greater than unity indicates that the assumption that
S.AFSHAN et al.
5
nominal yield strength is a characteristic value is conservative; this has also been found for the
case of carbon steel [11]. Benefit may be derived from the margin between the nominal and
characteristic strength in the reliability analysis, thorough the use of the over-strength
parameter fy,mean/fy,min, where fy,mean is the mean value produced by stainless steel
manufacturers and fy,min is the minimum specified value in EN 10088-4 [10].
During the initial calibration of the EN 1993-1-4 [1] design rules, the over-strength factor
for the material yield strength fy,mean/fy,min was taken as 1.33 with a COV value of 0.066 for all
stainless steels [12]. Analyses of the results in this study have shown that, in fact, these
statistical parameters vary between the different stainless steel types, and their effect needs to
be allowed for in the reliability analysis by dividing the structural performance data into sub-
sets based on their material grade. From the assembled data in Table 1, on average, the
austenitic grades exhibit the highest ratio of fy,mean/fy,min of 1.40, the lowest of 1.20 is shown by
the duplex grades, and an intermediate value of 1.38 is observed for the ferritic grades. The
range of fy,mean/fy,min values for the different stainless steels is 1.34 - 1.54 for the austenitic
grades, 1.04 - 1.33 for the duplex grades and 1.21 - 1.51 for the ferritic grades. In the present
study, representative but conservative values of over-strength were sought. Hence, based
generally on the minimum over-strength values from the different sources (producers), values
of 1.3, 1.1 and 1.2 for the austenitic, duplex and ferritic grades, respectively were considered
appropriate for use in the reliability analyses.
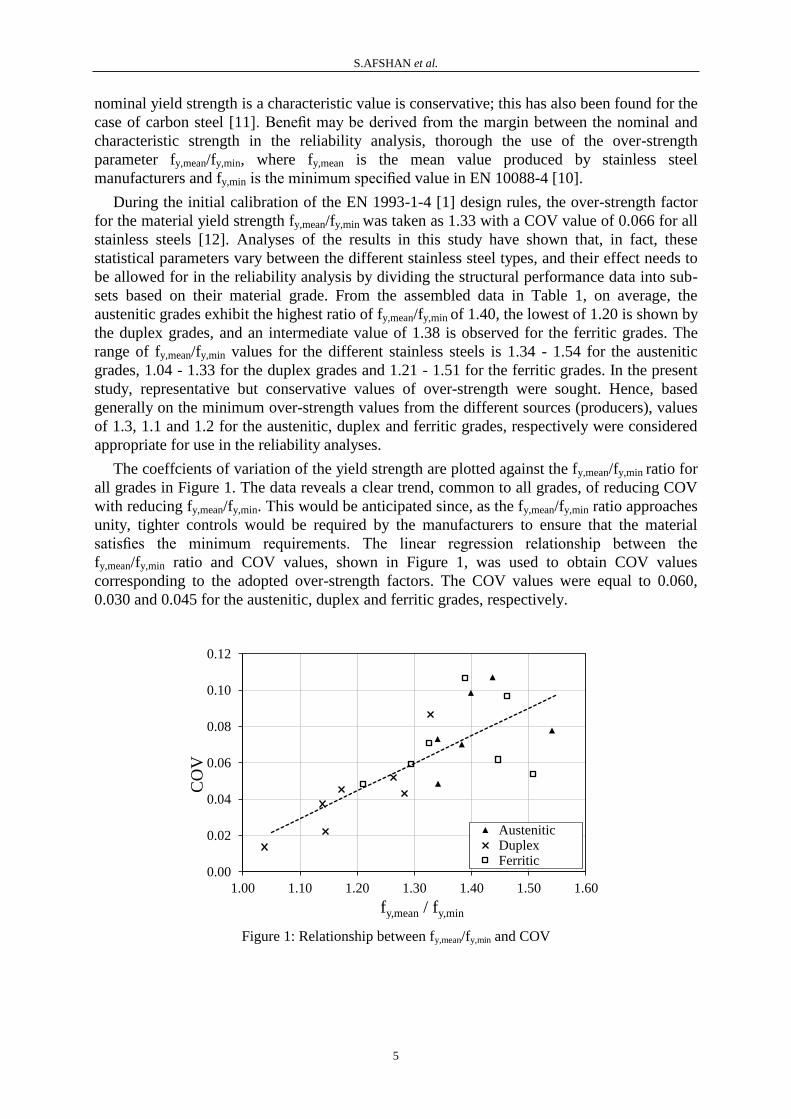
The coeffcients of variation of the yield strength are plotted against the fy,mean/fy,min ratio for
all grades in Figure 1. The data reveals a clear trend, common to all grades, of reducing COV
with reducing fy,mean/fy,min. This would be anticipated since, as the fy,mean/fy,min ratio approaches
unity, tighter controls would be required by the manufacturers to ensure that the material
satisfies the minimum requirements. The linear regression relationship between the
fy,mean/fy,min ratio and COV values, shown in Figure 1, was used to obtain COV values
corresponding to the adopted over-strength factors. The COV values were equal to 0.060,
0.030 and 0.045 for the austenitic, duplex and ferritic grades, respectively.
Figure 1: Relationship between fy,mean/fy,min and COV
0.00
0.02
0.04
0.06
0.08
0.10
0.12
1.00 1.10 1.20 1.30 1.40 1.50 1.60
CO
V
fy,mean / fy,min
AusteniticDuplexFerritic

S.AFSHAN et al.
6
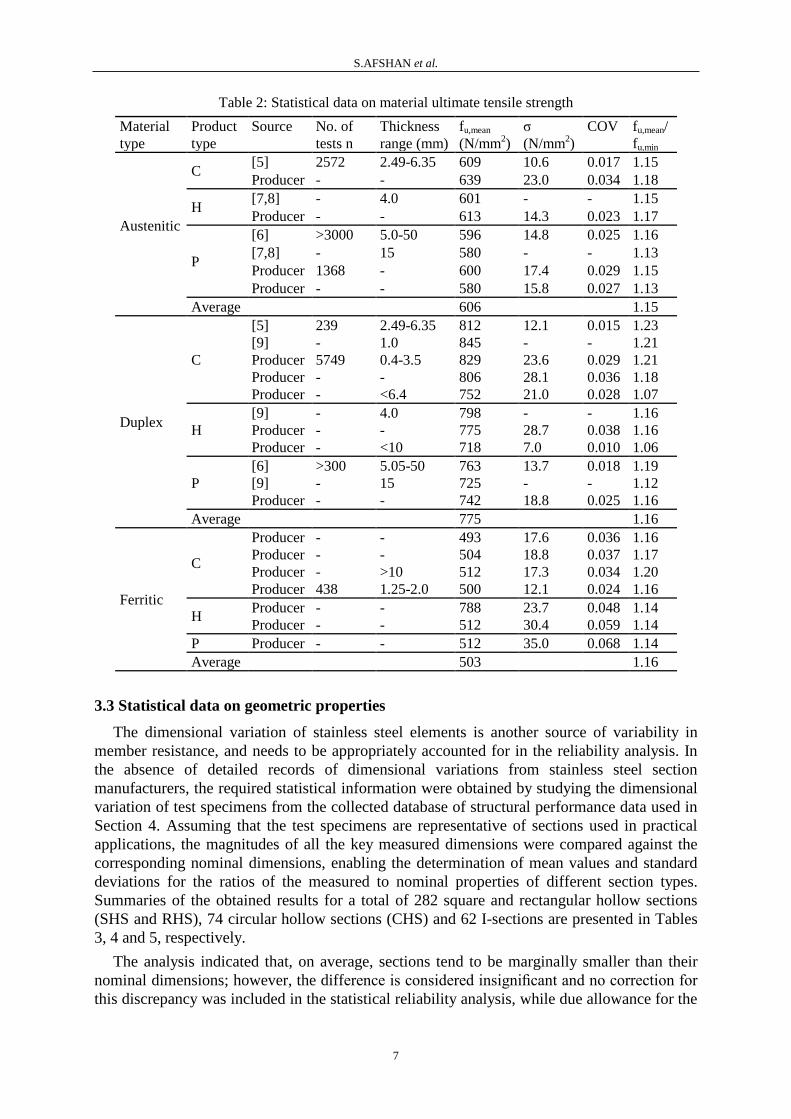
3.2 Statistical data on ultimate tensile strength
A similar analysis to that described above was carried out for the ultimate tensile strength
fu of stainless steel, and the results are summarised in Table 2. The over-strength factor for the
ultimate tensile strength fu,mean/fu,min fell into a tight range of between 1.06 and 1.23 for all
stainless steel grades. Hence, a single over-strength value fu,mean/fu,min, common to all stainless
steel grades of 1.1, which is close to the lower end of this range, was deemed appropriate for
use in reliability analyses. Also, owing to the relatively narrow band of fu,mean/fu,min, no clear
correlation between the over-strength and the associated COV, as had been seen for the case
of the yield strength, could be established. Therefore, considering the range of COV values
obtained from the individual sources for the austenitic and duplex stainless steel grades,
0.017-0.034 and 0.010-0.038, respectively, a common COV value towards the upper end of
these ranges of 0.035 is proposed. To allow for the generally larger scatter obtained from the
individual sources for the ferritic material, 0.024-0.068, a higher COV value of 0.05 is
proposed herein. This value is towards the upper end of the range of COV values from the
individual sources and is only exceeded by two data sets, both with fu,mean/fu,min = 1.14, which
is higher than the adopted value of 1.1, and would therefore be expected to off-set the effect of
the lower COV adopted.
Table 1: Statistical data on material yield strength
Material
type
Product
type
Source No. of
tests n
Thickness
range (mm)
fy,mean
(N/mm2)
σ
(N/mm2)
COV fy,mean/
fy,min
fy,k/
fy,min
Austenitic
C [5] 2572 2.49-6.35 312 15.2 0.049 1.34 1.24
Producer - - 314 22.9 0.073 1.34 1.19
H [7,8] - 4.0 290 - - 1.37 -
Producer - - 326 25.3 0.078 1.54 1.35
P
[6] >3000 5.0-50 294 20.6 0.070 1.38 1.23
[7,8] - 15 283 - - 1.33 -
Producer 1368 - 309 33.0 0.107 1.44 1.20
Producer - - 293 28.8 0.099 1.40 1.19
Average 308 1.40 1.23
Duplex
C
[5] 239 2.49-6.35 586 26.5 0.045 1.17 1.09
[9] - 1.0 650 - - 1.27 -
Producer 5749 0.4-3.5 631 27.3 0.043 1.28 1.19
Producer - - 610 30.9 0.052 1.26 1.16
Producer - <6.4 550 7.5 0.014 1.04 1.01
H
[9] - 4.0 595 - - 1.27 -
Producer - - 591 49.0 0.087 1.33 1.16
Producer - <10 549 12.2 0.022 1.14 1.10
P
[6] >300 5.05-50 524 19.6 0.037 1.14 1.07
[9] - 15 505 - - 1.11 -
Producer - - 520 18.2 0.035 1.19 1.13
Average 570 1.20 1.12
Ferritic
C
Producer - - 331 19.0 0.059 1.29 1.17
Producer - - 349 21.4 0.062 1.45 1.31
Producer - >10 358 19.3 0.054 1.51 1.38
Producer 438 1.25-2.0 352 16.9 0.048 1.21 1.12
H Producer - - 354 34.0 0.097 1.46 1.25
Producer - - 371 26.4 0.071 1.33 1.18
P Producer - - 347 37.0 0.107 1.39 1.16
Average 352 1.38 1.22
S.AFSHAN et al.
7
Table 2: Statistical data on material ultimate tensile strength
Material
type
Product
type
Source No. of
tests n
Thickness
range (mm)
fu,mean
(N/mm2)
σ
(N/mm2)
COV fu,mean/
fu,min
Austenitic
C [5] 2572 2.49-6.35 609 10.6 0.017 1.15
Producer - - 639 23.0 0.034 1.18
H [7,8] - 4.0 601 - - 1.15
Producer - - 613 14.3 0.023 1.17
P
[6] >3000 5.0-50 596 14.8 0.025 1.16
[7,8] - 15 580 - - 1.13
Producer 1368 - 600 17.4 0.029 1.15
Producer - - 580 15.8 0.027 1.13
Average 606 1.15
Duplex
C
[5] 239 2.49-6.35 812 12.1 0.015 1.23
[9] - 1.0 845 - - 1.21
Producer 5749 0.4-3.5 829 23.6 0.029 1.21
Producer - - 806 28.1 0.036 1.18
Producer - <6.4 752 21.0 0.028 1.07
H
[9] - 4.0 798 - - 1.16
Producer - - 775 28.7 0.038 1.16
Producer - <10 718 7.0 0.010 1.06
P
[6] >300 5.05-50 763 13.7 0.018 1.19
[9] - 15 725 - - 1.12
Producer - - 742 18.8 0.025 1.16
Average 775 1.16
Ferritic
C
Producer - - 493 17.6 0.036 1.16
Producer - - 504 18.8 0.037 1.17
Producer - >10 512 17.3 0.034 1.20
Producer 438 1.25-2.0 500 12.1 0.024 1.16
H Producer - - 788 23.7 0.048 1.14
Producer - - 512 30.4 0.059 1.14
P Producer - - 512 35.0 0.068 1.14
Average 503 1.16
3.3 Statistical data on geometric properties
The dimensional variation of stainless steel elements is another source of variability in
member resistance, and needs to be appropriately accounted for in the reliability analysis. In
the absence of detailed records of dimensional variations from stainless steel section
manufacturers, the required statistical information were obtained by studying the dimensional
variation of test specimens from the collected database of structural performance data used in
Section 4. Assuming that the test specimens are representative of sections used in practical
applications, the magnitudes of all the key measured dimensions were compared against the
corresponding nominal dimensions, enabling the determination of mean values and standard
deviations for the ratios of the measured to nominal properties of different section types.
Summaries of the obtained results for a total of 282 square and rectangular hollow sections
(SHS and RHS), 74 circular hollow sections (CHS) and 62 I-sections are presented in Tables
3, 4 and 5, respectively.
The analysis indicated that, on average, sections tend to be marginally smaller than their
nominal dimensions; however, the difference is considered insignificant and no correction for
this discrepancy was included in the statistical reliability analysis, while due allowance for the
S.AFSHAN et al.
8
obtained variability was made. Since the effect of the variability of the individual geometric
parameters depends on the resistance function being considered, an overall coeffcient of
variation Vgeometry parameter may be employed for different resistance functions. A method
based on Equation (7) was used herein, where weighting factors associated with each
geometric variable were evaluated, and used with the dimensional variation data presented in
Tables 3, 4 and 5, to determine suitable Vgeometry parameters. Since the value of the weighting
factors depend on the resistance function being considered, it is possible to have different
Vgeometry values for a given section type used in different resistance functions. Values of
Vgeometry were determined for SHS/RHS, CHS and I-sections for compression and bending
loading cases. A summary of the results from this analysis is presented in Table 6. On a
similar basis, Byfield and Nethercot [11] adopted a value of Vgeometry = 0.02 for carbon steel I-
sections in compression and bending, while a larger value of Vgeometry = 0.05 was utilised for
stainless steel in the development of the AISC stainless steel design guide [13]. Analysis of
the results herein shows that Vgeometry = 0.05 is more appropriate for stainless steel sections;
this value was adopted in all the reliability analyses carried out in this paper.
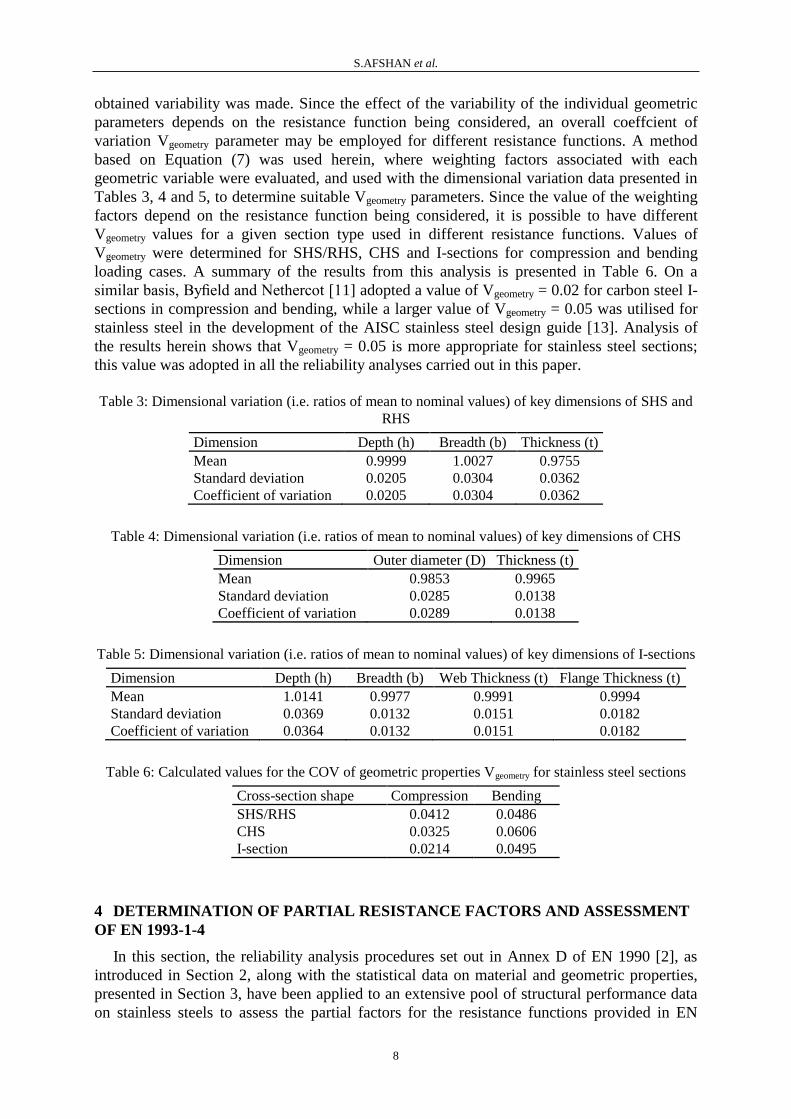
Table 3: Dimensional variation (i.e. ratios of mean to nominal values) of key dimensions of SHS and
RHS
Dimension Depth (h) Breadth (b) Thickness (t)
Mean 0.9999 1.0027 0.9755
Standard deviation 0.0205 0.0304 0.0362
Coefficient of variation 0.0205 0.0304 0.0362
Table 4: Dimensional variation (i.e. ratios of mean to nominal values) of key dimensions of CHS
Dimension Outer diameter (D) Thickness (t)
Mean 0.9853 0.9965
Standard deviation 0.0285 0.0138
Coefficient of variation 0.0289 0.0138
Table 5: Dimensional variation (i.e. ratios of mean to nominal values) of key dimensions of I-sections
Dimension Depth (h) Breadth (b) Web Thickness (t) Flange Thickness (t)
Mean 1.0141 0.9977 0.9991 0.9994
Standard deviation 0.0369 0.0132 0.0151 0.0182
Coefficient of variation 0.0364 0.0132 0.0151 0.0182
Table 6: Calculated values for the COV of geometric properties Vgeometry for stainless steel sections
Cross-section shape Compression Bending
SHS/RHS 0.0412 0.0486
CHS 0.0325 0.0606
I-section 0.0214 0.0495
4 DETERMINATION OF PARTIAL RESISTANCE FACTORS AND ASSESSMENT
OF EN 1993-1-4
In this section, the reliability analysis procedures set out in Annex D of EN 1990 [2], as
introduced in Section 2, along with the statistical data on material and geometric properties,
presented in Section 3, have been applied to an extensive pool of structural performance data
on stainless steels to assess the partial factors for the resistance functions provided in EN

S.AFSHAN et al.
9
1993-1-4 [1]. At the cross-section level, stub column and in-plane bending test results were
used to assess the γM0 partial resistance factor. At the member level, flexural buckling and
lateral-torsional buckling test results were used to evaluate the γM1 partial resistance factor.
The classification of the cross-sections for the treatment of local buckling was based on the
recent classification limits and effective width equations proposed by Gardner and Theofanous
[14], which will replace the current guidelines in the forthcoming amendment to EN 1993-1-4
[1], which is due to be published in 2015.
4.1 Partial factor for cross-section resistance γM0
The compression resistance of a stainless steel cross-section Nc,Rd, as set out in EN 1993-1-
4 [1], is given by Equation (15), where fy is the material yield strength and A is the cross-
sectional area, taken as the gross cross-sectional area for Class 1, 2 and 3 sections and the
effective cross-sectional area Aeff for Class 4 sections. The design moment resistance of a
cross-section subjected to uniaxial bending Mc,Rd is given by Equation (16), where W is the
appropriate section modulus, taken as the plastic section modulus Wpl for Class 1 and 2
sections, the elastic section modulus Wel for Class 3 sections and Weff for Class 4 sections.
0
,
M
y
Rdc
AfN
(15)
0
,
M
y
Rdc
WfM
(16)
Test data on stainless steel stub columns [12, 15–29] and beams [12, 17, 18, 26, 30–39]
were collected and used to assess the partial factors γM0 employed in Equations (15) and (16).
Owing to the relatively simple form of these design resistance functions, Equation (8) was
used to calculate the coeffcient of variation of the model Vrt, with the coeffcient of variation
of the basic variables VXi taken as those presented in Section 3. The results of the statistical
analysis for the two populations of data for cross-sections in compression and cross-sections
in bending are reported in Tables 7 and 8, respectively. The kd,n parameter is the fractile
factor, and is related to the number of tests in each data set. For SHS/RHS, kd,n was
determined on the basis of the total pool of compression test data on this section type,
including both stub columns and long columns. A similar approach was taken for I-sections
and CHS, while the test data on angle, channel and lipped channel sections were combined to
determine a common kd,n value for these sections. The resulting values of kd,n are reported in
Table 7.
The required values of γM0 for cross-section compression resistance derived from the
statistical analyses are reported in Table 7. For SHS/RHS and I-sections, the current γM0 value
of 1.1 is found to be sufficient for all stainless steel grades considered. Test data on stainless
steel open sections such as channles, lipped channels and angles, are relatively limited, and
the data used in this study were acquired from a single source [24], based on which it is
indicated that a γM0 value higher than 1.1 may be required. However, it is recommended that
the current γM0 value of 1.1 should be maintained for these section types in the absence of a
comprehensive set of structural performance test or FE data. Analysis of the CHS data
suggests that while γM0 = 1.1 is conservative for the case of duplex and ferritic grades, it needs
to be increased for the case of austenitic stainless steels. A high γM0 value of 1.32 for the
austenitic grade is mainly as a result of a combination of low b and high Vδ values for this
material. Figure 2 shows the results of all CHS test data, including long columns, where the

S.AFSHAN et al.
10
reduction factor χ = Ntest/Afy is plotted against the member slenderness λ . It shows that the
current plateau length of 0λ = 0.4 as adopted in EN 1993-1-4 [1], below which member
buckling checks are not required, is rather optimistic for CHS members. This elongated
plateau length influences the results of the statistical analysis on cross-section compression
resistance, and contributes to a high required value of γM0 for the austenitic material, which
features test data towards the end of the plateau. The member buckling curves given in of EN
1993-1-4 [1] for the design of stainless steel compression members are known to require
reconsideration [40]; this is the subject of ongoing research and will be discussed further in
subsequent sections.
The statistical analysis results presented in Table 8 suggest that the EN 1993-1-4 [1] design
resistance equation for cross-section bending capacity is consistently conservative for
austenitic, duplex and ferritic stainless steels, and considering the γM0 value for all cross-
section types and grades included for this loading type, it is proposed that the current value of
1.1 is maintained.
Table 7: Summary of statistical analysis results for cross-section compression resistance.
Section type Material No. of
tests n
b Over-
strength
kd,n Vδ Vfy Vgeometry γM0
SHS/RHS Austenitic 71 1.245 1.30 3.14 0.156 0.060 0.05 1.08
I-section Austenitic 20 1.067 1.30 3.30 0.099 0.060 0.05 1.09
Angle Austenitic 12 1.122 1.30 3.40 0.110 0.060 0.05 1.07
Channel Austenitic 11 1.099 1.30 3.40 0.125 0.060 0.05 1.15
Lipped channel Austenitic 12 0.974 1.30 3.40 0.088 0.060 0.05 1.16
CHS Austenitic 19 0.968 1.30 3.23 0.135 0.060 0.05 1.32
SHS/RHS Duplex 24 1.143 1.10 3.14 0.083 0.030 0.05 1.10
I-section Duplex 5 1.202 1.10 3.30 0.032 0.030 0.05 1.06
CHS Duplex 7 1.295 1.10 3.23 0.032 0.030 0.05 0.86
SHS/RHS Ferritic 9 1.073 1.20 3.14 0.054 0.045 0.05 1.02
I-section Ferritic 7 1.099 1.20 3.30 0.044 0.045 0.05 0.98
CHS Ferritic 4 1.182 1.20 3.23 0.036 0.045 0.05 0.90
Table 8: Summary of statistical analysis results for cross-section bending resistance.
Section type Material No. of
tests n
b Over-
strength
kd,n Vδ Vfy Vgeometry γM0
SHS/RHS Austenitic 45 1.296 1.30 3.25 0.120 0.060 0.05 0.95
I-section Austenitic 5 1.136 1.30 4.08 0.056 0.060 0.05 0.94
CHS Austenitic 8 1.272 1.30 4.33 0.122 0.060 0.05 1.08
SHS/RHS Duplex 12 1.219 1.10 3.25 0.095 0.030 0.05 1.07
I-section Duplex 8 1.342 1.10 4.08 0.089 0.030 0.05 1.02
CHS Duplex 3 1.319 1.10 4.33 0.011 0.030 0.05 0.83
SHS/RHS Ferritic 8 1.116 1.20 3.25 0.057 0.045 0.05 0.99

S.AFSHAN et al.
11
Figure 2: Comparison of CHS compression test data with EN 1993-1-4 buckling curve
4.2 Partial factor for member resistance γM1
4.2.1 Flexural buckling resistance
The flexural buckling resistance of a stainless steel compression member Nb,Rd, as set out in
EN 1993-1-4 [2], is given by Equation (17), where fy is the material yield strength, A is the
cross-sectional area (taken as the gross cross-sectional area for Class 1, 2 and 3 sections and
effective cross-sectional area Aeff for Class 4 sections), γM1 is the partial resistance factor for
member resistance and χ is the flexural buckling reduction factor, determined from Equation
(18).
0
1
, for
M
y
Rdb
AfN (17)
in which the flexural buckling reduction factor χ is given by:
cry NAf / and 15.0 with 0.11 2
022
(18)
where Ncr is the elastic critical buckling load, α is the imperfection factor and 0λ is the non-
dimensional limiting slenderness (i.e. the plateau length). For cold-formed open sections and
hollow sections, 0λ = 0.4 and α = 0.49, for welded open sections (buckling about the major
axis) 0λ = 0.2 and α = 0.49 and for welded open sections (buckling about the minor axis) 0λ =
0.2 and α = 0.76.
In order to separate the dependency of the buckling reduction factor χ on the other basic
variables in the design model, fy and A, given in Equation (17), the resistance function may be
expressed as given in Equation (19) where, k is the model constant, independent of A and fy,
and c and d are the model parameters specific to each test specimen and vary with column
slenderness λ .
dc
yRdb AkfN , (19)
0.0
0.2
0.4
0.6
0.8
1.0
1.2
1.4
1.6
0.0 0.4 0.8 1.2 1.6 2.0
Red
uct
ion
fac
tor
χ
Member slenderness
Austenitic (stub columns)Duplex (stub columns)Ferritic (stub columns)Austenitic (long columns)EN 1993-1-4 buckling curveElastic buckling curve

S.AFSHAN et al.
12
The approach to determine the parameters c and d for each specific test specimen are
outlined herein. Considering two columns with the same cross-sectional area A and different
yield strength values fy,1 and fy,2, using Equation (19) the ratio of their capacities becomes:
c
y
y
dc
y
dc
y
Rdb
Rdb
f
f
Akf
Akf
N
N
1,
2,
1,
2,
1,,
2,, (20)
Hence, c may be determined as:
1,2,
1,,2,,
ln
ln
yy
RdbRdb
ff
NNc (21)
The power d may subsequently be determined from Equation (22) by considering two
columns of differing cross-sectional area A1 and A2, assuming that the section second moment
of area I is approximately proportional to A2, giving Ncr,1/Ncr,2 ≈ (A1/A2) 2.
12
1,2,1,,2,,
ln
lnln
AA
ffcNNd
yyRdbRdb (22)
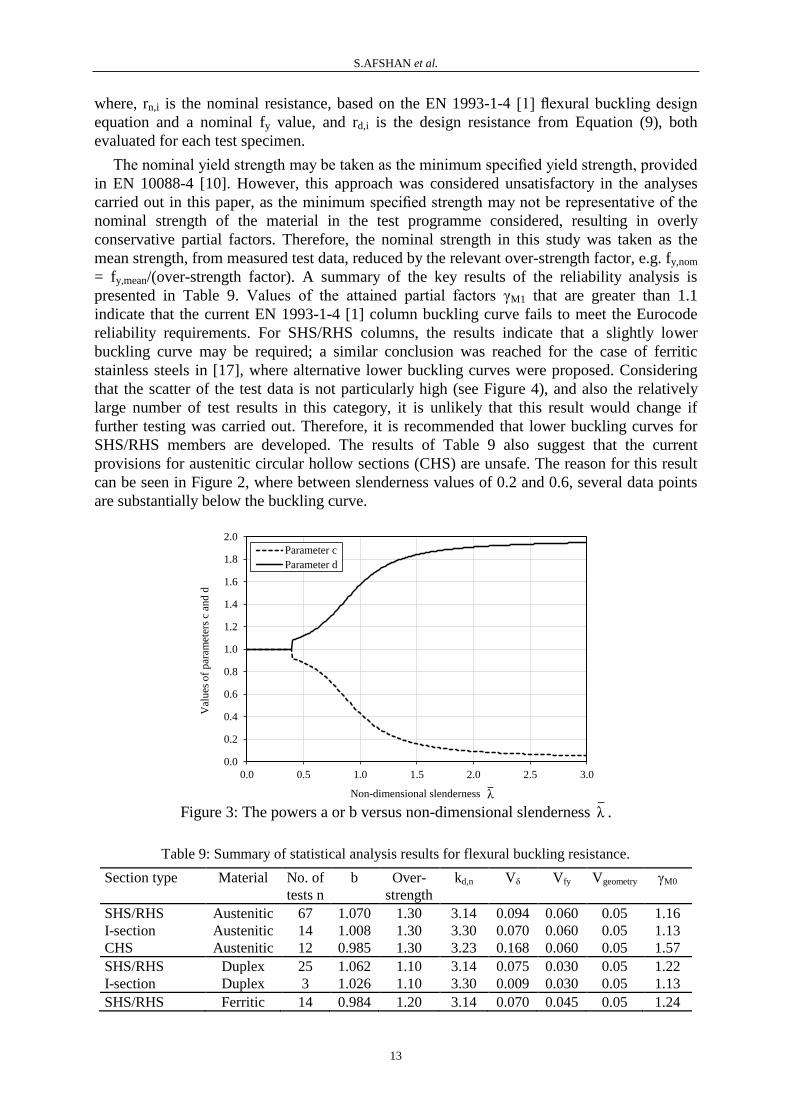
The model parameters c and d were evaluated for each test data using Equations (21) and
(22), respectively by considering a small increase in the variable being changed, i.e. taking fy,2
= 1.001fy,1 and A2 = 1.001A1. The relationship between the two powers c and d and the non-
dimensional slenderness λ has been plotted in Figure 3. The values of the c and d parameters
were calculated based on a plateau length of 0λ = 0.4 and imperfection factor of α = 0.49,
which correspond to the buckling curve specified in EN 1993-1-4 [1] for cold-formed open
sections and hollow sections (welded and seamless). At low slenderness values, 0λ ≤ 0.4,
column capacity is limited by the cross-section resistance which is controlled by the material
yield strength fy and the cross-sectional area A, as presented in Equation (15), and therefore c
= d = 1. Note that in this instance, Equation (7) simplifies to Equation (8). At higher
slenderness values, 0λ > 0.4, the column buckling load Nb,Rd approaches the elastic buckling
load Ncr, which is independent of fy, but dependent on the section geometry; hence the
parameter c approaches zero and Nb,Rd will only depend on the geometric properties and may
be expressed as Nb,Rd = kfy0A
d. It is shown in Figure 3 that d approaches a value of 2.0 with
increasing member slenderness λ , which coincides with the elastic critical buckling load Ncr
considering that the second moment of area I was taken as approximately proportional to A2.
In addition, owing to the complex form of the flexural buckling resistance formulation
provided in EN 1993 1-4 [1], the Vrt parameter, used to allow for the variability of the
material and geometric basic variables, was determined from Equation (7). This allows for the
varying degree of the influence of the basic variables fy and A at different values of member
slenderness to be taken into account. Flexural buckling test data collected from [16, 17, 19–
21, 27, 28, 301, 32, 41, 42], were analysed following the above described modified approach,
and values of the partial factor γM1 for each test specimen were determined. From the least
squares regression of the individual values obtained, an overall γM1 value was subsequently
determined for each stainless steel type considered - see Equation (23).
n
i idin
n
i in
M
rr
r
1 ,,
1
2
,
1 (23)
S.AFSHAN et al.
13
where, rn,i is the nominal resistance, based on the EN 1993-1-4 [1] flexural buckling design
equation and a nominal fy value, and rd,i is the design resistance from Equation (9), both
evaluated for each test specimen.
The nominal yield strength may be taken as the minimum specified yield strength, provided
in EN 10088-4 [10]. However, this approach was considered unsatisfactory in the analyses
carried out in this paper, as the minimum specified strength may not be representative of the
nominal strength of the material in the test programme considered, resulting in overly
conservative partial factors. Therefore, the nominal strength in this study was taken as the
mean strength, from measured test data, reduced by the relevant over-strength factor, e.g. fy,nom
= fy,mean/(over-strength factor). A summary of the key results of the reliability analysis is
presented in Table 9. Values of the attained partial factors γM1 that are greater than 1.1
indicate that the current EN 1993-1-4 [1] column buckling curve fails to meet the Eurocode
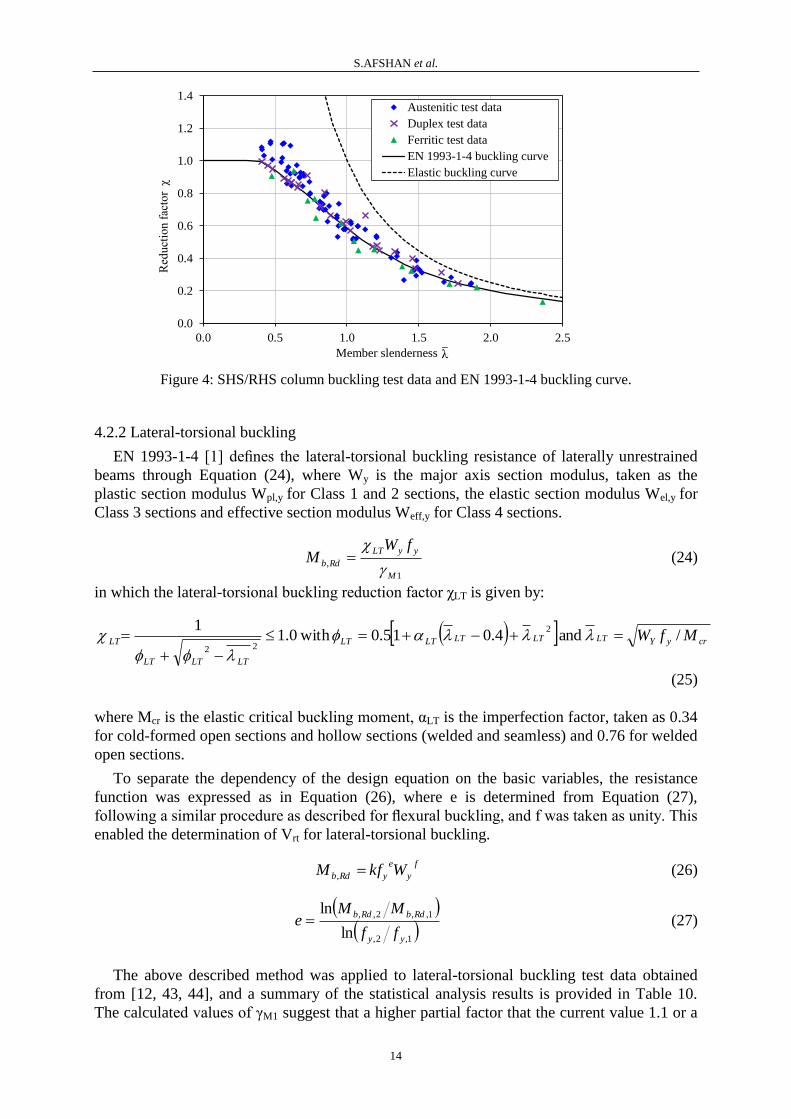
reliability requirements. For SHS/RHS columns, the results indicate that a slightly lower
buckling curve may be required; a similar conclusion was reached for the case of ferritic
stainless steels in [17], where alternative lower buckling curves were proposed. Considering
that the scatter of the test data is not particularly high (see Figure 4), and also the relatively
large number of test results in this category, it is unlikely that this result would change if
further testing was carried out. Therefore, it is recommended that lower buckling curves for
SHS/RHS members are developed. The results of Table 9 also suggest that the current
provisions for austenitic circular hollow sections (CHS) are unsafe. The reason for this result
can be seen in Figure 2, where between slenderness values of 0.2 and 0.6, several data points
are substantially below the buckling curve.
Figure 3: The powers a or b versus non-dimensional slenderness λ .
Table 9: Summary of statistical analysis results for flexural buckling resistance.
Section type Material No. of
tests n
b Over-
strength
kd,n Vδ Vfy Vgeometry γM0
SHS/RHS Austenitic 67 1.070 1.30 3.14 0.094 0.060 0.05 1.16
I-section Austenitic 14 1.008 1.30 3.30 0.070 0.060 0.05 1.13
CHS Austenitic 12 0.985 1.30 3.23 0.168 0.060 0.05 1.57
SHS/RHS Duplex 25 1.062 1.10 3.14 0.075 0.030 0.05 1.22
I-section Duplex 3 1.026 1.10 3.30 0.009 0.030 0.05 1.13
SHS/RHS Ferritic 14 0.984 1.20 3.14 0.070 0.045 0.05 1.24
0.0
0.2
0.4
0.6
0.8
1.0
1.2
1.4
1.6
1.8
2.0
0.0 0.5 1.0 1.5 2.0 2.5 3.0
Val
ues
of
par
amet
ers
c an
d d
Non-dimensional slenderness
Parameter c
Parameter d
λ
S.AFSHAN et al.
14
Figure 4: SHS/RHS column buckling test data and EN 1993-1-4 buckling curve.
4.2.2 Lateral-torsional buckling
EN 1993-1-4 [1] defines the lateral-torsional buckling resistance of laterally unrestrained
beams through Equation (24), where Wy is the major axis section modulus, taken as the
plastic section modulus Wpl,y for Class 1 and 2 sections, the elastic section modulus Wel,y for
Class 3 sections and effective section modulus Weff,y for Class 4 sections.
1
,
M
yyLT
Rdb
fWM
(24)
in which the lateral-torsional buckling reduction factor χLT is given by:
cryYLTLTLTLTLT
LTLTLT
LT MfW / and 4.015.0 with 0.11 2
22
(25)
where Mcr is the elastic critical buckling moment, αLT is the imperfection factor, taken as 0.34
for cold-formed open sections and hollow sections (welded and seamless) and 0.76 for welded
open sections.
To separate the dependency of the design equation on the basic variables, the resistance
function was expressed as in Equation (26), where e is determined from Equation (27),
following a similar procedure as described for flexural buckling, and f was taken as unity. This
enabled the determination of Vrt for lateral-torsional buckling.
f
y
e
yRdb WkfM , (26)
1,2,
1,,2,,
ln
ln
yy
RdbRdb
ff
MMe (27)
The above described method was applied to lateral-torsional buckling test data obtained
from [12, 43, 44], and a summary of the statistical analysis results is provided in Table 10.
The calculated values of γM1 suggest that a higher partial factor that the current value 1.1 or a
0.0
0.2
0.4
0.6
0.8
1.0
1.2
1.4
0.0 0.5 1.0 1.5 2.0 2.5
Red
uct
ion
fac
tor
χ
Member slenderness
Austenitic test data
Duplex test data
Ferritic test data
EN 1993-1-4 buckling curve
Elastic buckling curve
λ

S.AFSHAN et al.
15
lower buckling curve is necessary for lateral-torsional buckling. The results from these tests
show relatively high scatter (see Figure 5), perhaps due to the manner in which the tests were
conducted, but very few points lie below the design curve and those that do are only
marginally below. Hence, the current buckling curve is considered to be satisfactory.
Table 10: Summary of statistical analysis results for lateral-torsional buckling resistance.
Section type Material No. of
tests n
b Over-
strength
kd,n Vδ Vfy Vgeometry γM0
I-section Austenitic 14 1.066 1.30 3.36 0.112 0.060 0.05 1.19
I-section Ferritic 16 1.368 1.20 3.36 0.152 0.045 0.05 1.13
Figure 5: Lateral-torsional buckling test data with EN 1993-1-1 buckling curve.
5 CONCLUSIONS
A reliability assessment of the EN 1993-1-4 structural stainless steel design provisions has
been carried out in this study, and the obtained results have been presented and discussed.
Statistical data on material properties suitable for use in reliability analyses were derived from
industrial data. For yield strength, representative over-strength values and COVs of 1.3 and
0.060 for austenitic, 1.1 and 0.030 for duplex and 1.2 and 0.045 for ferritic stainless steels
were established, while for the ultimate tensile strength, an over-strength value of 1.1 for all
stainless steel grades and COVs of 0.035 for the austenitic and duplex grades and 0.05 for the
ferritic grade were proposed. Based on the database of sections considered in this study, a
COV value of 0.05 was adopted to represent the variability of the geometric properties.
Analysis of cross-section compression and in-plane bending test results showed that the
current γM0 value of 1.1 given in EN 1993-1-4 may be maintained for the section types
considered, excluding CHS elements in compression, where revised design provisions are
needed and a shorter plateau length is recommended. Column flexural buckling design rules
were also assessed, and it was found that the current γM1 value of 1.1 is generally satisfactory,
but some buckling curves, particularly for CHS compression members, should be revisited.
For cases of lateral–torsional buckling, it was recommended that the current γM1 = 1.1 is
maintained, but a reassessment of this value needs to be carried out upon generation of a more
comprehensive pool of experimental data.
0.0
0.2
0.4
0.6
0.8
1.0
1.2
1.4
0.0 0.2 0.4 0.6 0.8 1.0 1.2 1.4 1.6 1.8 2.0
Red
uct
ion f
acto
r χ
LT
Member slenderness
Test data
EN 1993-1-4 buckling curve
Elastic buckling curve
λ LT

S.AFSHAN et al.
16
REFERENCES
[1] EN 1993-1-4, Eurocode 3: Design of Steel Structures – Part 1–4: General Rules –
Supplementary Rules for Stainless Steels, European Committee for Standardization, Brussels,
2006.
[2] EN 1990, Eurocode – Basis of Structural Design, European Committee for Standardization,
Brussels, 2002.
[3] Afshan S., Francis F., Baddoo N.R. and Gardner L., “Reliability analysis of structural stainless
steel design provisions”, Journal of Constructional Steel Research, 114, 293-304, 2015.
[4] Sedlacek G. and Kraus O., “Use of safety factors for the design of steel structures according to
the Eurocodes”, Engineering Failure Analysis, 14 (3), 434–441, 2007.
[5] Groth H.L. and Johansson R.E., “Statics of the mechanical strength of stainless steels – sheet”,
Proceedings of Nordic Symposium on Mechanical Properties of Stainless Steel, Sweden, 1990.
[6] Leffler B., “A statistical study of the mechanical properties of hot rolled stainless steel”,
Proceedings of Nordic Symposium on Mechanical Properties of Stainless Steel, Sweden, 1990.
[7] Outokumpu, Standard Cr–Ni stainless steels, Tech. Rep. 1197 EN-GB, Sweden, 2005.
[8] Outokumpu, Standard Cr–Ni–Mo stainless steels, Tech. Rep. 1198 EN-GB, Sweden, 2005.
[9] Outokumpu, Duplex stainless steel, Tech. Rep. 1008 EN-GB:6, Sweden, 2008.
[10] EN 10088-4, Stainless Steels Part 4: Technical Delivery Conditions for Sheet/Plate and Strip of
Corrosion Resisting Steels for Construction Purposes, European Committee for
Standardization, Brussels, 2009.
[11] Byfield M.P. and Nethercot D.A., “An analysis of the true bending strength of steel beams”,
Proceedings of the Institution of Civil Engineers – Structures and Buildings, 128, 188–197,
1988.
[12] Baddoo, N.R. and Gardner, L., Final report. ECSC project – development of the use of stainless
steel in construction, Tech. Rep. RT810, Contract No. 7210 SA/842. The Steel Construction
Institute, UK, 2000.
[13] AISC, Design Guide 27: Structural Stainless Steel, American Institute of Steel Construction,
2013.
[14] Gardner L. and Theofanous M., “Discrete and continuous treatment of local buckling in
stainless steel elements”, Journal of Construction Steel Research, 64 (11), 1207–1216, 2008.
[15] Gardner L. and Nethercot D.A., “Experiments on stainless steel hollow sections – part 1:
material and cross-sectional behaviour”, Journal of Constructional Steel Research, 60 (9),
1291–1318, 2004.
[16] Theofanous M. and Gardner L., “Testing and numerical modelling of lean duplex stainless steel
hollow section columns”, Engineering Structures, 31 (12), 3047–3058, 2009.
[17] Afshan S. and Gardner L., “Experimental study of cold-formed ferritic stainless steel hollow
sections”, Journal of Structural Engineering ASCE, 139 (5), 717–728, 2013.
[18] Gardner L., Talja A. and Baddoo N.R., “Structural design of high-strength austenitic stainless
steel”, Thin-Walled Structures, 44 (5), 517–528, 2006.
[19] Young B. and Liu Y., “Experimental investigation of cold-formed stainless steel columns”,
Journal of Structural Engineering ASCE, 129 (2), 169–176, 2003.
[20] Liu Y. and Young B., “Buckling of stainless steel square hollow section compression
members”, Journal of Constructional Steel Research, 59 (2), 165–177, 2003.
[21] Young B. and Lui W.M., “Tests of cold-formed high strength stainless steel compression
members”, Thin-Walled Structures, 44 (2), 224–234, 2006.
[22] Young B. and Lui W.M., “Behaviour of cold-formed high strength stainless steel sections”,
Journal of Structural Engineering ASCE, 131 (11), 1738–1745, 2005.

S.AFSHAN et al.
17
[23] Rasmussen K.J.R. and Hancock D.A., “Design of cold-formed stainless steel tubular members.
I: columns”, Journal of Structural Engineering ASCE, 119 (8), 2349–2367, 1993.
[24] Kuwamura H., “Local buckling of thin-walled stainless steel members”, Steel Structures, 3 (3),
191–201, 2003.
[25] Huang Y. and Young B., “Material properties of cold-formed lean duplex stainless steel
sections”, Thin-Walled Structures, 54, 72–81, 2012.
[26] Saliba N. and Gardner L., “Cross-section stability of lean duplex stainless steel welded I:-
sections”, Journal of Constructional Steel Research, 80, 1–14, 2013.
[27] Young B. and Hartono W., “Compression tests of stainless steel tubular members”, Journal of
Structural Engineering ASCE, 128 (6), 754–761, 2002.
[28] Burgan B.A., Baddoo N.R. and Gilsenan K., “Structural design of stainless steel members –
comparison between Eurocode 3, part 1.4 and test results”, Journal of Construction Steel
Research, 54 (1), 51–73, 2000.
[29] Bardi F. and Kyriakides S., “Plastic buckling of circular tubes under axial compression – part I:
experiments”, International Journal of Mechanical Sciences, 48 (8), 830–841, 2006.
[30] Mirambell E. and Real E., “On the calculation of deflections in structural stainless steel beams:
an experimental and numerical investigation”, Journal of Construction Steel Research, 54(1),
109–133, 2000.
[31] Talja A. and Salmi P., “Design of stainless steel RHS beams, columns and beam-columns”,
Tech. Rep. 1619, VTT Building Technology, Finland, 1995.
[32] Gardner L. and Nethercot D.A., “Experiments on stainless steel hollow sections – part 2:
member behaviour of columns and beams”, Journal of Construction Steel Research, 60 (9),
1319–1332, 2004.
[33] Zhou F. and Young., “Tests of cold-formed stainless steel tubular flexural members”, Thin-
Walled Structures, 43 (9), 1325–1337, 2005.
[34] Theofanous M. and Gardner L., “Experimental and numerical studies of lean duplex stainless
steel beams”, Journal of Constructional Steel Research, 66 (6), 816–825, 2010.
[35] Rasmussen K.J.R. and Hancock D.A., "Design of cold-formed stainless steel tubular members.
II: beams”, Journal of Structural Engineering ASCE, 119 (8), 2368–2386, 1993.
[36] Theofanous M., Saliba N., Zhao O. and Gardner L., “Ultimate response of stainless steel
continuous beams”, Thin-Walled Structure,s 83, 115–127, 2010.
[37] Real E., “Aportaciones al estudio del comportamiento en flexión de estructuras deacero
inoxidable” (Ph.D. thesis) Departamento de Ingeniería de la Construcción, UPC-ETSECCP,
Spain, 2001.
[38] Kiymaz G., “Strength and stability criteria for thin-walled stainless steel circular hollow section
members under bending”, Thin-Walled Structures, 43 (10), 1534–1549, 2005.
[39] Talja A. “Test report on welded I and CHS beams, columns and beam-columns”, Tech. Rep,
Technical Research Centre of Finland (VTT), Finland, 1997.
[40] Theofanous M., Chan T.M. and Gardner L., “Structural response of stainless steel oval hollow
section compression members”, Engineering Structures, 31 (4), 922–934, 2009.
[41] Ala-Outinen T., Stainless steel in fire (SSIF). Work package 3: members with class 4 cross-
sections in fire, Tech. Rep. RFS-CR-04048, The Steel Construction Institute, UK, 2007.
[42] SCI, Tests on stainless steel materials, Tech. Rep. SCI-RT-251. The Steel Construction
Institute, UK, 1991.
[43] Bredenkamp P.J. and van den Berg D.A., “The strength of stainless steel built-up I-section
columns”, Journal of Construction Steel Research, 34 (2–3), 131–144, 1995.
[44] van Wyk M.L., van den Berg D.A. and van der Merwe P., The lateral torsional buckling
strength of doubly symmetric stainless steel beams, Tech. Rep. MD-58. Faculty of Engineering,
Rand Afrikaans University, 1990.