reliability assessment on member of supply chain based on ... 15031j12.pdf · metrics are essential...
TRANSCRIPT

Abstract— The crude palm oil supply chain is important for
the other supply chains, which is the upstream of
pharmaceutical industry, food industry, and energy industry.
This research is focused on the analysis reliability
Performance by failure model. Performance measures and
metrics are essential for effectiveness and efficiency and
increase the organization competitiveness. This paper applied
the Supply Chain Operation Reference Model (SCOR Model)
for calculating the failure likelihood indexes (FLIs) by
Analytical Hierarchy Process (AHP) and then calculate the
failure index by Fault Tree Analysis (FTA) based on SCOR
performance. Finally, the Failure Index will be converted to
the Reliability Index. The calculation showed 42 values of
failure likelihood indexes (SCOR performance level 2), 10
values of failure indexes (SCOR performance level 1), 5
values of failure indexes (performance attribute) and 2 values
of failure indexes (external failure and internal failure). The
maximum failure indexes of SCOR performance level1 was
Upside Adaptability and maximum failure indexes of SCOR
performance attribute was agility. That are low reliability
index.
Keywords— reliability Performance, Supply Chain
Operation Reference (SCOR), Fault tree Analysis (FTA),
Analytical Hierarchy Process (AHP)
I. INTRODUCTION
HE supply chain performance was become one of the most
frequently discussed topics in business literature.
Performance measurement describes the feedback or
information on activities with respect to meeting customer
expectations. Performance Measurement can be defined as the
process of quantifying the efficiency and effectiveness of
action [1]. Effectiveness refers to the extent to which customer
requirements are met, while efficiency is a measure of how
economically the firm’s resources are utilized when providing
Kittichai Athikulrat , Department of Industrial Engineering. Faculty of
Engineering / King’s Mongkut’s Unversith of Technology North Bangkok, Thailand. Email id: [email protected].
Vichai Rungreanganun,. Department of Industrial Engineering. Faculty of
Engineering / King’s Mongkut’s Unversith of Technology North Bangkok, Thailand. Email id: [email protected].
Sompoap Talabgaew, Department of Teacher Training in Mechanical
Engineer / King Mongkut’s University of Technology North Bangkok, Bangkok Thailand. Email id : [email protected].
a given level of customer satisfaction. The core purpose of a
performance measurement system (PMS) is for quantifying
the efficiency and/or effectiveness of action. Performance
assessment has become a key research area in academia and in
industry. However monitoring and improvement are achieved
when the operations are in process or finished so the
improvements are delayed. Supply chain reliability system
(PMS) is for quantifying the efficiency and/or effectiveness of
action. Performance assessment has become a key research
area in academia and in industry. However monitoring and
improvement were achieved when the operations are in
process or finished so the improvement are delay. Supply
chain reliability that is the performance measurement can be
diagnose before operating start. In order to obtain high
efficiency and effectiveness in supply chain management,
supply chain must have a high reliability as guarantee.
Reliability has now become an important performance
measure for evaluation supply chain Wang Jian and Guohua
Chen [2] and Jin liu [3]. Supply Chain Reliability (SCR) can
be defined as the probability of the chain meeting mission
requirements to provide the required supplies to the critical
transfer points within the system Thomas MU. [4].
To achieve supply chain reliability a number of
researchers have devoted their efforts toward developing
models to describe the elements and activities of a supply
chain. There are some models such as multi stage-supply
chain model [5], economic model[6] deterministic model[7],
simulation model [8] and stochastic model [9]. Varshney et al.
[10] proposed a more general link-capacity model to have
multiple states with different capacities in each state. Jin Liu
[11] presented a relatively new graphical construct called
meta-graph. Ni Wang and Jye-Chyi Lu [12] focused on
developing reliability models for large-size logistics systems
to approximate store location & demand data. Valery .L and
Vladislav V [13] proposed the evaluation of the reliability of
supply chain by failure model.
This article defines the reliability of the supply chain’s
member as the reliability index of enterprise. The impact of its
change on the overall reliability of the supply chain. It
examines the node enterprise in the supply chain, using the
crude palm oil enterprises as the background. The palm oil
industry is vital to many industries. It is an upstream of others
supply chain such as the pharmaceutical industry, food
industry and energy industry in Thailand. The crude palm oil
is a member of the palm oil supply chain. This paper studies
Reliability Assessment on Member of Supply
Chain Based on SCOR Performance and Fault
Tree Analysis
Kittichai Athikulrat, Vichai Rungreanganun, and Sompoap Talabgaew
T
International Journal of Computer Science and Electronics Engineering (IJCSEE) Volume 3, Issue 2 (2015) ISSN 2320–4028 (Online)
107

and assess the reliability index of the crude palm oil
enterprises in Chum Porn province in Thailand.
.
II. RESEARCH METHODOLOGY
Fig.1 Research Methodology
This research methodology was presented as Fig.1 It is
summarized as follows:
Step 1 .serepee f n etceleS : Experts who best understand
the target system are selected. Each expert is required to have
professional experience or knowledge in a relevant field
[14],[15]. In this study, the researcher was interviews the
association of crude palm oil mill to determine the criteria of
selection the experts and apply the Analysis Hierarchy Process
(AHP) to find the expert of crude palm oil mill in Chum Porn
province. The Analysis Hierarchy Process (AHP) developed
by Saaty [16] is a multi-criteria decision method for complex
problems, in which both qualitative and quantitative aspects
are considered. There are many areas where AHP is applied,
such as economics, flexible manufacturing systems and
subjective probability estimation [17]. It has created a
voluminous work of literature by various researchers;
additionally, its mechanism is known to many experts. A
detailed description of this method is given in [18]. AHP is
based on a user’s experience and judgment and its results are
objective [16] and realistic [19]. In general, people are better
at making relative comparisons as opposed to absolute
judgments [20]; the creation of the relative comparisons is the
basic principle behind AHP. An intrinsic and useful by
product of AHP is an index of consistency, which provides
information on the severity of the numerical and transitive
consistency violations [18]. If consistency ratio (CR)
suggested by Saaty [16] is above 0.1, the person making the
judgment should seek additional information, re-examine the
data used in constructing the scale, and then make a new
judgment. However, it is not absolute standard and can be
changed according to circumstances. There have been a
number of studies on the quantification of subjective judgment
or the elicitation of subjective probabilities using AHP [16] –
[24].
Step 2. Weight the relative importance on SCOR by AHP :
This step, researcher set up the SCOR Performance to
Hierarchy diagram (see Fig. 3.) and then, the expert provided
important of the all pairs for each level except SCOR
performance level2. They judged the importance scale based
on Table I. These results are also expressed with the matrix.
The consistency is also checked.
Step 3. Rate the relative likelihood of a pair SCOR
Performance level 2 on each level 1 : This step, The expert
judged the rating scale based on Table II. The executed this
rating for all pairs of SCOR Performance level2 on each
level1. The results are expressed with the matrix from AHP.
Whenever an expert finishes a rating, consistency is checked
through AHP. If the consistency is unsatisfactory, the expert
must execute the rating again.
TABLE I SCALE OF RELATIVE IMPORTANCE USED IN THE PAIR WISE
COMPARISONS OF AHP
Comparative Judgment
Scale of relative
importance
and are equally important
is moderately more important
is strongly more important than
is very strongly more important than
is extremely more important than
Intermediate values between two adjacent
judgment
1
3
5
7
9
2,4,6,8
The most general objective
of the decision problem
Decision attribute1 Decision attribute2 Decision attribute n
Decision attribute1 Decision attribute2 Decision attribute n
Goal
Attributes
Alternative
Fig.2 An example form of decision elements in AHP
Step 4.Calculate failure Likelihood Indexes (FLIs): The
FLIs of each SCOR performance level 2 are calculated via
AHP using the result from the rating and weighting step.
1. Selection of Experts.
2. Weight the relative importance on SCOR by AHP
3. Rate the relative likelihood on SCOR Level2
4. Calculate failure Likelihood Indexes.
5. Calculate failure Index on SCOR Performance by Fault
Tree Analysis.
6. Convert failure Index to Reliability Index.
International Journal of Computer Science and Electronics Engineering (IJCSEE) Volume 3, Issue 2 (2015) ISSN 2320–4028 (Online)
108

TABLE II
SCALE OF RELATIVE LIKELIHOOD USED IN THE PAIRWISE COMPARISONS OF
SCOR PERFORMANCE LEVEL 2
Comparative Judgment
Scale of relative
likelihood
and are equally likely
is moderately more likely than
is strongly more likely than
is very strongly likely than
is extremely more likely than
Intermediate values between two adjacent
judgments
1
3
5
7
9
2,4,6,8
SCOR Performance
External Internal
Reliability Responsiveness Agility Cost Asset Management Eff
R1.1
R2.1 R2.2
Level 1
Level 2
Attribute 2
Attribute 1
Fig. 3 SCOR Performance Hierarchy
Step 5.Calculate failure Index on SCOR performance by
Fault Tree Analysis : This step applied the FTA for calculated
the failure Index, The model of SCOR Performance will be
structured by the method of Fault Tree Analysis (see Fig. 4)
The failure Index evaluated using the FLIs by FTA in Eq. (1)
and (2)
External Internal
Relia
bility
Resp
on
ses
Agility
Co
st
Asse
ts
Perfe
ct O
rder
Fu
llfillmen
t
Ord
er
Fu
llfillmen
t
Cy
cle tim
e
Upsid
e
Fle
xib
ility
Upsid
e
Adap
tability
Dow
nsid
e
Adap
tability
To
tal Co
st to
Serv
e
Cash
to C
ash
cy
cle
time
Retu
rn o
n fix
asse
ts
Retu
rn o
n
work
ing C
apita
l
SCOR
Performance
level2
level2
level2
P(x) P(x) P(x)
Fig. 4 The structure of SCOR performance by FTA
The output fault events of lower and intermediate logic
gates such as OR and AND. The occurrence probability of the
OR gate output fault event is given by Dhillon [25]
( ) ∏ * ( )+ (1)
Where:
( ) is the OR gate output fault event, , occurrence
probability;
n is the total number of input fault event;
( ) is the probability of occurrence of OR gate input
fault event ; for i = 1,2,3,….,n
Step 6. Convert SCOR Performance failure Index to SCOR
Performance Reliability
Index : This step is calculate the Reliability index for node
enterprise by (2)
(2)
III. RESULT
The paper takes the crude palm oil industry as background
for research reliability of the supply chain enterprises
A. Result from selection of Experts.
From the interview result, the researcher analysis the
criteria for selecting the experts and applies the important,
Using the AHP to find the expert of crude palm oil mill in
Chum Porn province and then check the consistency. We get
one crude palm oil mill manager.
B. Results from weight the relative importance on
SCOR performance
This time the researcher interviewed the expert individually,
to give the importance by using AHP in Expert Choice
Program, by comparing each pair on each level of SCOR
performance hierarchy. It would stop when the Consistency
Ratio (CR) was equal to 0.1 or less, in each group pair, as in
Fig. 5 and 6
Fig. 5 Metric table importance Level1 on agility attribute of the crude
palm oil mill
Fig. 6 The weight of Level1 on Agility attribute of the crude palm oil
mill
International Journal of Computer Science and Electronics Engineering (IJCSEE) Volume 3, Issue 2 (2015) ISSN 2320–4028 (Online)
109
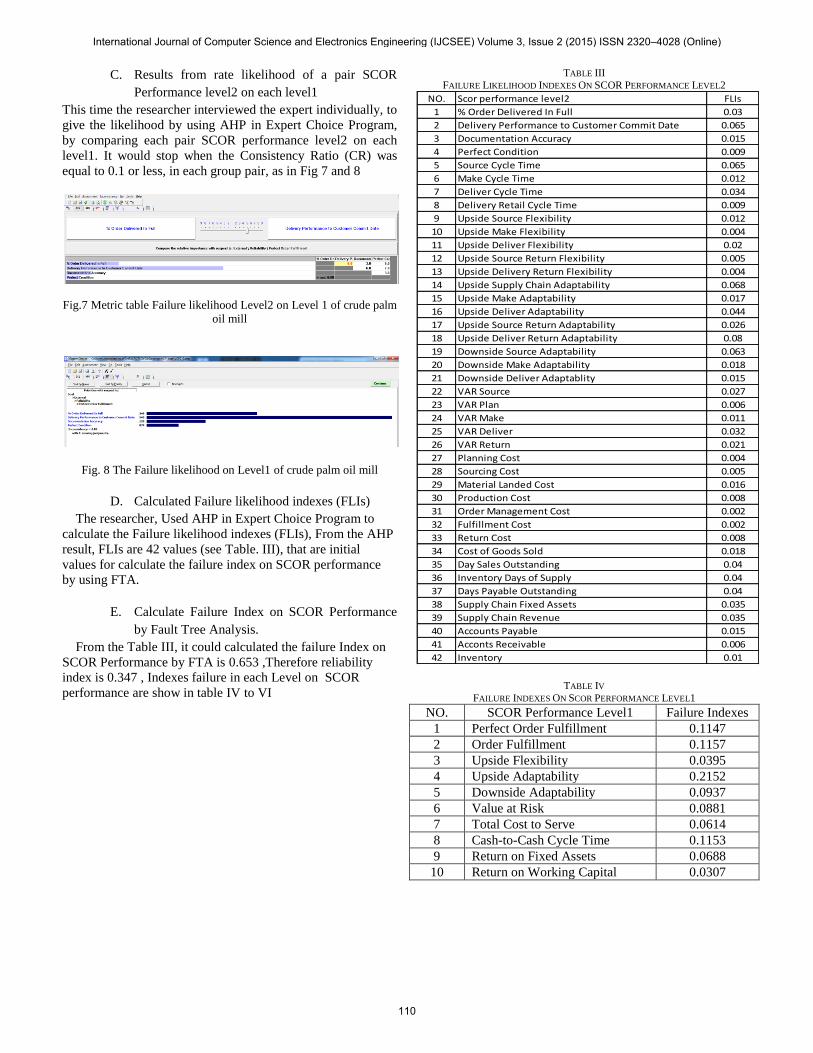
C. Results from rate likelihood of a pair SCOR
Performance level2 on each level1
This time the researcher interviewed the expert individually, to
give the likelihood by using AHP in Expert Choice Program,
by comparing each pair SCOR performance level2 on each
level1. It would stop when the Consistency Ratio (CR) was
equal to 0.1 or less, in each group pair, as in Fig 7 and 8
Fig.7 Metric table Failure likelihood Level2 on Level 1 of crude palm
oil mill
Fig. 8 The Failure likelihood on Level1 of crude palm oil mill
D. Calculated Failure likelihood indexes (FLIs)
The researcher, Used AHP in Expert Choice Program to
calculate the Failure likelihood indexes (FLIs), From the AHP
result, FLIs are 42 values (see Table. III), that are initial
values for calculate the failure index on SCOR performance
by using FTA.
E. Calculate Failure Index on SCOR Performance
by Fault Tree Analysis.
From the Table III, it could calculated the failure Index on
SCOR Performance by FTA is 0.653 ,Therefore reliability
index is 0.347 , Indexes failure in each Level on SCOR
performance are show in table IV to VI
TABLE III
FAILURE LIKELIHOOD INDEXES ON SCOR PERFORMANCE LEVEL2
NO. Scor performance level2 FLIs
1 % Order Delivered In Full 0.03
2 Delivery Performance to Customer Commit Date 0.065
3 Documentation Accuracy 0.015
4 Perfect Condition 0.009
5 Source Cycle Time 0.065
6 Make Cycle Time 0.012
7 Deliver Cycle Time 0.034
8 Delivery Retail Cycle Time 0.009
9 Upside Source Flexibility 0.012
10 Upside Make Flexibility 0.004
11 Upside Deliver Flexibility 0.02
12 Upside Source Return Flexibility 0.005
13 Upside Delivery Return Flexibility 0.004
14 Upside Supply Chain Adaptability 0.068
15 Upside Make Adaptability 0.017
16 Upside Deliver Adaptability 0.044
17 Upside Source Return Adaptability 0.026
18 Upside Deliver Return Adaptability 0.08
19 Downside Source Adaptability 0.063
20 Downside Make Adaptability 0.018
21 Downside Deliver Adaptablity 0.015
22 VAR Source 0.027
23 VAR Plan 0.006
24 VAR Make 0.011
25 VAR Deliver 0.032
26 VAR Return 0.021
27 Planning Cost 0.004
28 Sourcing Cost 0.005
29 Material Landed Cost 0.016
30 Production Cost 0.008
31 Order Management Cost 0.002
32 Fulfillment Cost 0.002
33 Return Cost 0.008
34 Cost of Goods Sold 0.018
35 Day Sales Outstanding 0.04
36 Inventory Days of Supply 0.04
37 Days Payable Outstanding 0.04
38 Supply Chain Fixed Assets 0.035
39 Supply Chain Revenue 0.035
40 Accounts Payable 0.015
41 Acconts Receivable 0.006
42 Inventory 0.01
TABLE IV
FAILURE INDEXES ON SCOR PERFORMANCE LEVEL1
NO. SCOR Performance Level1 Failure Indexes
1 Perfect Order Fulfillment 0.1147
2 Order Fulfillment 0.1157
3 Upside Flexibility 0.0395
4 Upside Adaptability 0.2152
5 Downside Adaptability 0.0937
6 Value at Risk 0.0881
7 Total Cost to Serve 0.0614
8 Cash-to-Cash Cycle Time 0.1153
9 Return on Fixed Assets 0.0688
10 Return on Working Capital 0.0307
International Journal of Computer Science and Electronics Engineering (IJCSEE) Volume 3, Issue 2 (2015) ISSN 2320–4028 (Online)
110

TABLE V
FAILURE INDEXES ON SCOR PERFORMANCE ATTRIBUTE II
NO. SCOR Performance Attribute II Failure Index
1 Reliability 0.1147
2 Responsiveness 0.1157
3 Agility 0.3125
4 Cost 0.0614
5 Assets Management Eff. 0.2014
TABLE VI
FAILURE INDEX OF SCOR PERFORMANCE ATTRIBUTE I
NO. SCOR Performance Attribute I Failure Index
1 External Facing 0.4617
2 Internal Facing 0.3547
IV. DISCUSSION
Table IV to VI indicated the failure indexes of SCOR
performance Level1 and performance attribute. The maximum
value of failure index of SCOR performance metric level1 in
Table IV is 0.2152 (Upside adaptability). This value affects
the next level on SCOR Performance hierarchy. The
maximum value of failure index of the performance attribute
II in Table V. is 0.3125 (Agility attribute). The maximum
value of failure index on Performance attribute I in Table VI.
is 0.4617 (External Facing). Therefore, improvement of the
SCOR Performance Level1 will affect the failure index to the
next level and affect the failure index to the top level.
V. CONCLUSION
In this study it was found that the Failure likelihood
Indexes (FLIs) from the interview of the expert who was
involved with the crude palm oil industry which was presented
in the form of giving importance weight in each level of
supply chain performance except level 2, which level2 giving
the failure likelihood, could lead to calculating the failure
index and then using the FTA to calculate the failure index on
SCOR performance constructed. Failure indexes should be
considered in each level of the SCOR performance to the top
level. Therefore this index can help to indicate any
performance improvement. The reliability index of enterprise
was converted from the failure index. At the same time the
reliability of member enterprises of the supply chain impact on
the overall supply chain reliability (SCR). Further study, based
on the system reliability engineering cloud extend the supply
chain reliability.
ACKNOWLEDGMENT
Thank you to those experts who offered their comments,
tie and opinions. I appreciated their help. My thanks also to
those who participated in the comparison interviews in
Analytic Hierarchy Process
REFERENCES
[1] A. D. Neely, J. F. Mills, M. J. Gregory, and K. W. Platts, ―Performance measurement system design–a literature review and research agenda,‖
International Journal of Operations and Production Management, Vol. 15, No. 4, pp. 80–116, 1995.
[2] WANG Yong-Jian ,CHEN Guo-hua. ―Reliability based supply chain
Construction,‖ International journal of Industrial Engineering and
Management, pp.72-74, 2004. [3] J. Liu, J. Li, J Y. Zhao. ―The research on reliability of supply chain
based on meta,‖ The Fourth International Conference of Control and
Automation, pp. 80-82, 2003. [4] M.U. Thomas, ―Supply Chain Reliability for Contingency Operation,‖
The proceeding of reliability and maintainability Symposium, pp. 61-67,
2002. [5] B. M. Beamon, ―Supply chain design and analysis: Models and
methods,‖ International Journal of Production Economics, Vol.55 no.3,
pp. 281–294,1998. [6] D. P. Christy, & J. R. Grout, ―Safeguarding supply chain relationships,‖
International Journal of Production Economics,Vol.36, pp. 233–242,
1994. [7] V. T. Voudouris, ―Mathematical programming techniques to
debottleneck the supply chain of fine chemical industries,‖ Computers
Chem. Eng, Vol.20, pp.1269-1274, 1996. [8] D. R. Towill, ―Supply chain dynamics,‖ International Journal of
Computer Integrated Manufacturing, Vol4, no.4, pp. 197–208, 1991.
[9] S. Tzafestas, and G. Kapsiotis,. ―Coordinated control of manufacturing/supply chains using multi-Level techniques,‖.Computer
Integrated Manufacturing System, Vol. 7, no.3. pp.206–212, 1994
[10] P. K. Varshney, A. R. Joshi, and P. L. Chang, ―Reliability modeling and performance evaluation of variable link-capacity networks,‖ IEEE
Transactions on Reliability, vol. 43, pp. 378–382, 1994.
[11] J. Liu, J. Li and J. Zhao, ―The Research on Supply Chain Reliability based on Meta-graphs‖, The Fourth International Conference on
Control and Automation, pp. 849-853, 2003. [12] N. Wang, J. Lu, ―Reliability Modeling in Spatially Distributed Logistics
Systems‖, IEEE Transactions on reliability, vol. 55, no. 3, pp.525-534,
2006. [13] Valery. L and Vladislav. L , ―The evaluation of the reliability of Supply
chain: Failure Mode.” Proceedings of the 14International Conference
Reliability and Statistics in Transportation and Communicatio, pp. 41–42, 2014
[14] T. Saaty, ―The analytic hierarchy process," New York: McGraw-Hill
Inc.; 1980. [15] F. Zahedi, ―The analytic hierarchy process—a survey of the method and
its applications,‖ Interfaces ,Vol.16, no.4, pp.96–108, 1986.
[16] TL. Saaty, ―Priority setting in complex problems,‖ IEEE Transaction on Engineering Management,Vol.30, no.3, pp.140–55, 1983.
[17] R. Yager, ―An eigenvalue method of obtaining subjective probabilities,‖
Behavioral Sciences, Vol.24, pp.382–3877, 1979. [18] T. Saaty ―Decision making for leaders, the analytical hierarchy process
for decision in a complex world,‖ Wadsworth, 1982.
[19] R. Jensen, ―Scenario probability scaling—an eigenvector analysis of elicited scenario odds ratios,‖ Vol.13, no.6, pp.489–98. 1981
[20] R. Jensen, R. Spencer, ―Matrix scaling of subjective probabilities of
economic forecasts,‖ Economic Letters. Vol.20, pp.221–5, 1986. [21] M. Tavana, D. Kennedy, and B. Modebbi, ―An applied study using the
analytic hierarchy process to translate common verbal phrases to
numerical probabilities,‖ Journal of Behavior Decision Making, Vol.10, pp.133–50, 1997.
[21] K. Park, ―Human reliability analysis: analysis, prediction and prevention
of human errors,‖ Netherlands: Elsevier Science Publishers Co.; 1987. [22] I. Millet, W. Wedley, ―Modeling risk and uncertainty with the analytic
hierarchy process,‖ Journal of Multi-criteria Decision Analysis , Vol.11,
pp.97–102, 2002.
[23] M. Tavana, ―A subjective assessment of alternative mission
architectures for the human exploration of Mars at NASA using
multicriteria decision making,‖ Computer & Operation Research Vol.31, pp.1147–1164, 2004.
[24] E. Rosenbloom, ―A probabilistic interpretation of the final rankings in
AHP‖. European Journal of Operation Research, Vol.96, pp.371–378, 1996.
[25] B.S. Dhillon, ―Failure Mode and Effects Analysis,‖ Microelectronics and
Reliability, Vol.32, pp. 719-731, 1992.
International Journal of Computer Science and Electronics Engineering (IJCSEE) Volume 3, Issue 2 (2015) ISSN 2320–4028 (Online)
111