reliability-based validation of partial safety …
TRANSCRIPT

CCC 2008 - Challenges for Civil Construction
Torres Marques et al. (Eds)
© FEUP, Porto, 2008
RELIABILITY-BASED VALIDATION OF PARTIAL SAFETY FACTOR FOR FRP REINFORCED CONCRETE
Raffaello Fico, Andrea Prota, Iunio Iervolino and Gaetano Manfredi Department of Structural Engineering (DIST)
University of Naples Via Claudio 21, 80125 Naples, Italy
e-mail: [email protected], web page: http://www.dist.unina.it/
Keywords: Calibration, Design, FRP, Safety factors.
Summary: A reliability-based calibration of partial safety factors for the design of concrete structures reinforced with fiber reinforced polymer (FRP) bars was applied to assess the reliability levels of the Italian provisions CNR DT 203/2006. 1 INTRODUCTION
Many existing design guidelines for reinforced concrete (RC) structures using fiber reinforced polymers (FRP) as internal reinforcement follow the limit state design approach using partial safety factors to attain the structural safety, predominantly by modifying the corresponding guidelines for steel RC structures. This is the same philosophy used in the new Italian guidelines CNR DT 203/2006[1], “Guide for the Design and Construction of Concrete Structures Reinforced with Fiber-Reinforced Polymer Bars”, recently issued by the Italian Research Council (CNR). Here a reliability-based assessment has been performed in order to evaluate the reliability levels of the ultimate limit state (ULS) design according to the Italian guidelines and particularly that of partial safety factor for FRP bars.
2 BACKGROUND The establishment of a limit states-based design framework for FRP RC structures is becoming
more and more needful since despite the growing popularity of composites they are still perceived as being less reliable than conventional construction technologies, such as steel, concrete, masonry, and wood, where design methods, standards, and supporting databases already exist (Ellingwood[2]). If several reliability research applications on externally bonded FRP structures have been carried out in literature (Plevris et al.[3]; Ellingwood[2],[4]; Okeil et al.[5],[6]; Monti and Santini[7]; Frangopol and Recek[8]; Di Sciuva and Lomario[9]; Spitaleri and Totaro[10]), the research in the field of internal FRP RC structures is still scarce.
La Tegola[11] re-examined from a probabilistic point of view the effective distributions of actions to be adopted for the design of FRP RC structures at both ultimate limit state (ULS) and serviceability limit states (SLS): higher values of strength and lower values of Young’s modulus compared to steel imply that the design of FRP RC structures will be influenced almost exclusively by the SLS, whereas actual steel codes consider the same distribution of actions for the SLS and, amplified, for the ULS. Neocleous et al.[12] evaluated the reliability levels of two GFRP RC beams for the flexural and shear failure mode, concluding that the design of such members should be based on the attainment of the desired failure mode hierarchy by applying the appropriate partial safety factors. Pilakoutas et al.[13] examined the effect of design parameters and especially of FRP partial factor on the flexural behavior of over-reinforced FRP RC beams, concluding that the desired mode of flexural failure is not attained by the application of partial factors alone, but it is necessary to apply limits on the design parameters considered by the models adopted to predict the design capacity. He and Huang[14] combined the
CCC 2008: R. Fico, A. Prota, I. Iervolino and G. Manfredi
2
Monte Carlo simulation procedure with the Rackwitz–Fiessler method to assess the reliability levels of the provisions for flexural capacity design of ACI 440.1R-03 and ISIS guidelines. The assessment indicated that the provisions in both guidelines are rather conservative and that the reliability index changes dramatically when failure mode is switched from concrete crushing to FRP rupture, but within either failure mode, the reliability index does not vary significantly with respect to the balanced reinforcement ratio. Kulkarni[15] developed resistance models for FRP RC decks and girders designed using ACI 440.1R-06 guidelines, showing that the cross sectional properties seem not to be major factors affecting the structural reliability, whereas concrete strength, load effects and reinforcement ratio of FRP reinforcement play a significant role on the structural reliability of members.
3 OBJECTIVES The main objectives of the proposed research project were
1. Assess the reliability levels of the Italian provisions CNR DT 203/2006[1], by following some of the most significant approaches proposed in literature.
2. Provide a consistent background for the calibration of the partial safety factor for FRP bars used in the CNR DT 203/2006[1].
4 PROVISIONS ON FLEXURAL CAPACITY DESIGN According to the CNR-DT 203/2006[1], that strictly follows the approach of the limit states semi-
probabilistic method, in compliance with the classical style of Eurocodes, the conventional serviceability and the corresponding levels of the design loads shall be considered according to the current building codes (D.M.LL.PP. 09/01/1996[16] or Eurocode 2[17]).
The design value, dX , of the generic strength and/or strain property of a material, in particular of an FRP bar, can be expressed as follows:
XX ηγ
= kd
m
(1)
where kX is the characteristic value of the property being considered, η is a conversion factor accounting for special design issues, and γm is the material partial factor. According to ultimate limit states, the partial factor γm for FRP bars, denoted by γ f , shall be set equal to 1.5, whereas for (SLS), the value to be assigned to the partial factor is γ =f 1. The partial factor γ =c 1.6 prescribed by the referenced building codes shall be assigned for concrete.
The design of FRP-RC members for flexure is analogous to the design of steel reinforced concrete members. Both concrete crushing and FRP rupture are acceptable failure modes in governing the design of FRP-RC members provided that strength and serviceability criteria are satisfied.
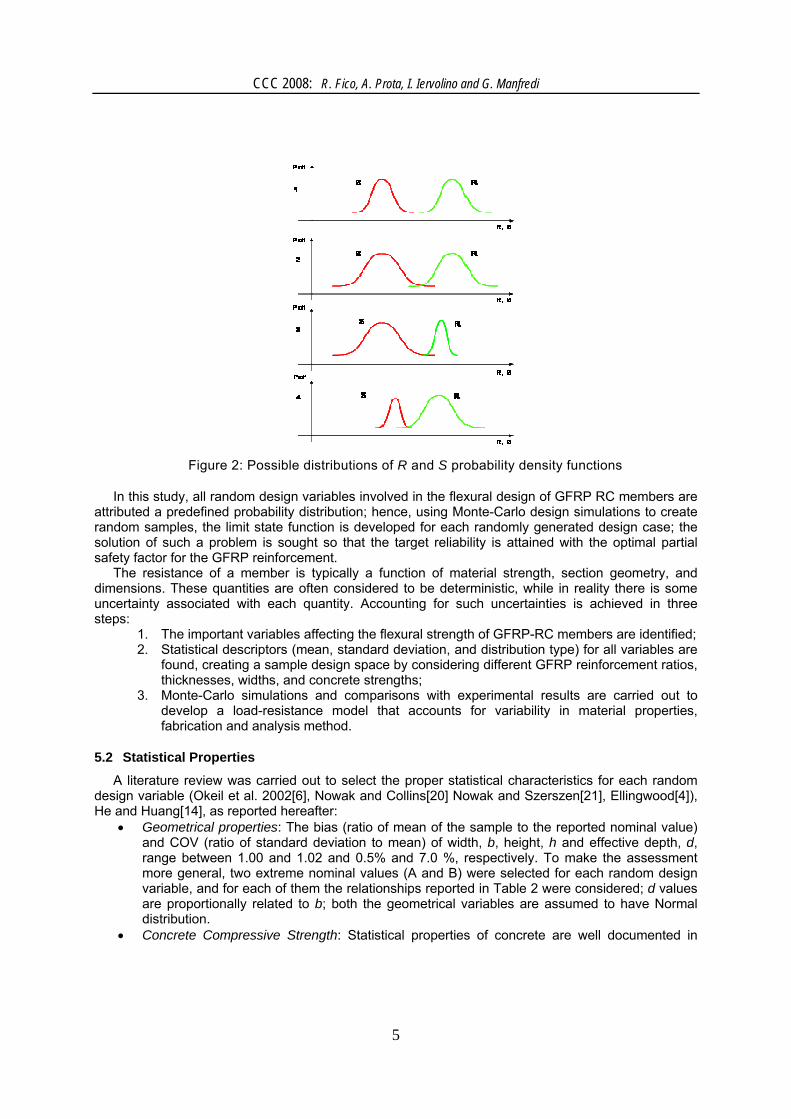
With reference to the illustrative scheme shown in Figure 1, two types of failure may be accounted for, depending upon whether the ultimate FRP strain (area 1) or the concrete ultimate compressive strain (area 2) is reached.

CCC 2008: R. Fico, A. Prota, I. Iervolino and G. Manfredi
3
d
d
h
1
b
A f
x
cu
fd
2
1
ε
ε
neutral axis position
Figure 1: Failure modes of FRP RC section
Failure occurring in area 1 is attained by reaching the design strain in the FRP bars: any strain diagram corresponding to such failure mode has its fixed point at the limit value of εfd, defined as the design strain of FRP bars. The dashed lines indicate that with respect to the fixed point εfd the concrete strength ranges between zero and εcu.
Failure occurring in area 2 takes place due to concrete crushing, while the ultimate strain of FRP has not been attained yet. The dashed lines indicate that with respect to the fixed point εcu the FRP strength ranges between zero and εfd.
Moreover, according to the current Italian building code, design at ULS can be conducted by assuming a simplified distribution of the normal stresses for concrete (“stress block”), for elements whose failure is initiated either by the crushing of concrete or rupture of the FRP bars.
5 RELIABILITY ANALYSIS
5.1 Reliability Index
The aim of the reliability analysis of a cross-section is to quantify the failure probability reflecting the uncertainties associated with the resistances and loads. This section focuses on the reliability analysis of flexural simply supported GFRP-RC beams (further analyses on slabs are reported by Fico[18]; in particular, a reliability-based assessment of partial safety factors has been applied to assess the reliability levels of the flexural design equations as given by the CNR-DT 203/2006[1] guidelines, reported hereafter.
In probability-based Load and Resistance Factor Design (LFRD) the structural performance is defined by a limit state function, which can be generally expressed as:
=( ) 0G X (2)
where X is the vector of resistance or load random variables. In general, the limit state function can be a function of many variables, X=(X1,X2,…,Xm) representing dimensions, material properties, loads and other factors such as the analysis method. Generally, the safety of a structural component is represented in terms of its resistance (R) and load effects (S), which can be expressed in the limit state function as the difference between the random resistance of the member, R, and the random load effect acting on the member, S:
= −G R S (3)
if G>0 the structure is safe, otherwise it fails. Therefore, the probability of failure, Pf, is equal to:
CCC 2008: R. Fico, A. Prota, I. Iervolino and G. Manfredi
4
f Pr ( 0)P R S= − ≤ (4)
Since R and S are treated as random variables, the outcome G will also be a random variable. It is often convenient and easy to measure the structural safety in terms of the reliability index,
β, defined such that the probability of failure is:
β= Φ −f ( )P (5)
Φ being the standard normal cumulative-distribution function, whereas β is related to the order of magnitude of fP .
Indicative values of fP for some typical failure modes in fifty years are: • − −= ÷5 7
f 10 10P for ULS with no warning (brittle failure); • − −= ÷4 5
f 10 10P for ULS with warning (ductile failure); • − −= ÷2 3
f 10 10P for SLS with large elastic deformations or undesirable cracking.
Indicative values of β are shown in Table 1, in correspondence of fP values (BS EN 1990:2002[19]):
Table 1: β vs Pf for Normal-type distribution
β Pf1,282 10-1 2,326 10-2 3,09 10-3 3,719 10-4 4,265 10-5 4,753 10-6 5,199 10-7
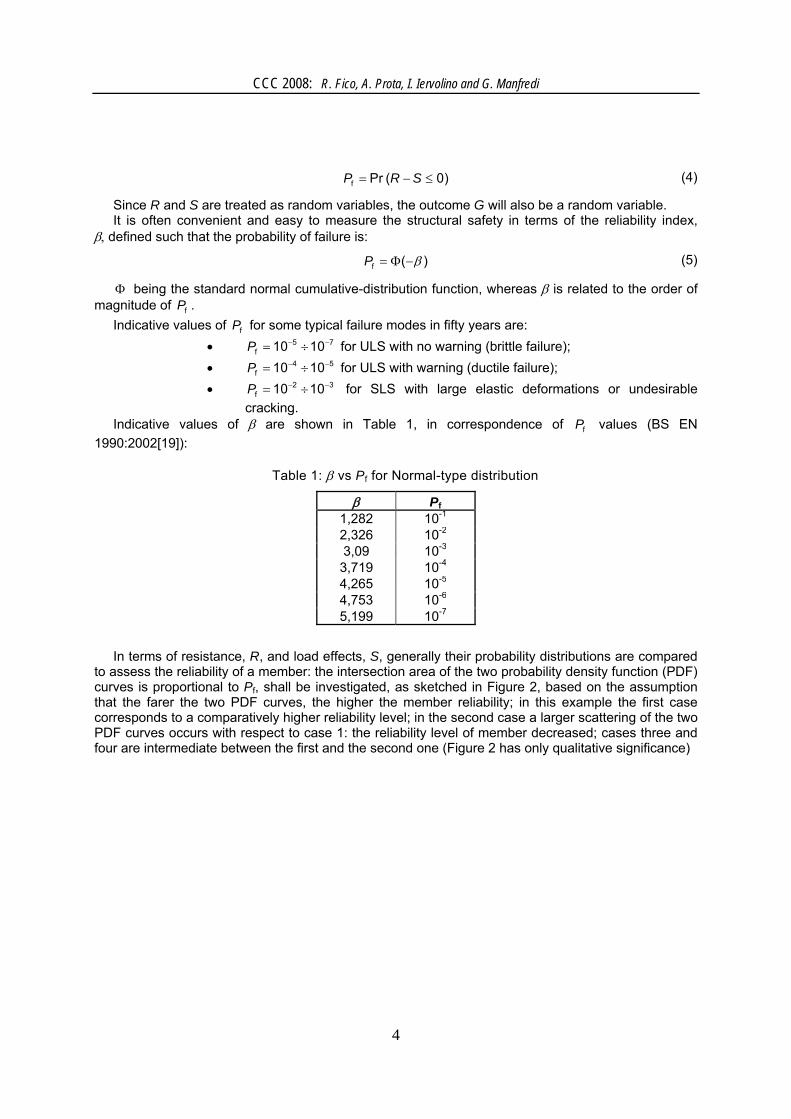
In terms of resistance, R, and load effects, S, generally their probability distributions are compared to assess the reliability of a member: the intersection area of the two probability density function (PDF) curves is proportional to Pf, shall be investigated, as sketched in Figure 2, based on the assumption that the farer the two PDF curves, the higher the member reliability; in this example the first case corresponds to a comparatively higher reliability level; in the second case a larger scattering of the two PDF curves occurs with respect to case 1: the reliability level of member decreased; cases three and four are intermediate between the first and the second one (Figure 2 has only qualitative significance)
CCC 2008: R. Fico, A. Prota, I. Iervolino and G. Manfredi
5
Figure 2: Possible distributions of R and S probability density functions
In this study, all random design variables involved in the flexural design of GFRP RC members are attributed a predefined probability distribution; hence, using Monte-Carlo design simulations to create random samples, the limit state function is developed for each randomly generated design case; the solution of such a problem is sought so that the target reliability is attained with the optimal partial safety factor for the GFRP reinforcement.
The resistance of a member is typically a function of material strength, section geometry, and dimensions. These quantities are often considered to be deterministic, while in reality there is some uncertainty associated with each quantity. Accounting for such uncertainties is achieved in three steps:
1. The important variables affecting the flexural strength of GFRP-RC members are identified; 2. Statistical descriptors (mean, standard deviation, and distribution type) for all variables are
found, creating a sample design space by considering different GFRP reinforcement ratios, thicknesses, widths, and concrete strengths;
3. Monte-Carlo simulations and comparisons with experimental results are carried out to develop a load-resistance model that accounts for variability in material properties, fabrication and analysis method.
5.2 Statistical Properties
A literature review was carried out to select the proper statistical characteristics for each random design variable (Okeil et al. 2002[6], Nowak and Collins[20] Nowak and Szerszen[21], Ellingwood[4]), He and Huang[14], as reported hereafter:
• Geometrical properties: The bias (ratio of mean of the sample to the reported nominal value) and COV (ratio of standard deviation to mean) of width, b, height, h and effective depth, d, range between 1.00 and 1.02 and 0.5% and 7.0 %, respectively. To make the assessment more general, two extreme nominal values (A and B) were selected for each random design variable, and for each of them the relationships reported in Table 2 were considered; d values are proportionally related to b; both the geometrical variables are assumed to have Normal distribution.
• Concrete Compressive Strength: Statistical properties of concrete are well documented in

CCC 2008: R. Fico, A. Prota, I. Iervolino and G. Manfredi
6
Ellingwood et al.[22], and Nowak and Szerszen[21] and summarized in Table 2; two nominal values A and B were considered. The random variable describing the compressive strength of concrete, fc, is assumed to be normally distributed.
• Tensile Strength of GFRP Bars: The tensile strength of GFRP reinforcement is assumed to follow the Weibull distribution; this assumption is well established in the literature (Okeil et al.[6]) and has been verified experimentally through tests of composite specimens with different size and stress distribution. Data on the statistical properties of GFRP bars have been taken into account (see Table 2) according to the values suggested by Pilakoutas et al.[13]; only one nominal value was considered.
Table 2: Statistical properties of main variables
Design Variable
Minimum Nominal Value (A)
Mean µ & Standard
Deviation σ
Bias & COV (%)
Maximum Nominal Value (B)
Mean µ & Standard
Deviation σ
Bias & COV (%)
Probability Distribution
µ=bA+2.54 1 µ=bB+2.54 1 Base b [mm] bA
σ=3.66 1.8 bB
σ=3.66 0.7 Normal
µ =dA-4.70 1 µ=dB-4.70 1 Effective Depth d
[mm] 0.8·hA
σ=12.70 5.4 0.95·hB
σ=12.70 0.9 Normal
µ=27.97 1.4 µ=46.16 1 Concrete Strength fck
[MPa] 20.67
σ=2.85 10 41.34
σ=1.94 4 Normal
µ=810 1 GFRP Strength ffk
[MPa] 743.4
σ=40.5 5
Ef (GFRP bars) = 45 GPa Weibull
5.3 Sample Design Space
Developing the load-resistance models for FRP-RC members requires to investigate a wide range of realistic parameters in the design space. Two extreme nominal values (A and B) were selected for each random design variable (b, d, fc) as reported in Table 3, as well as thirty ratios of ρf/ρfb, ρf being the reinforcement ratio of FRP bars ( f f ( )A bdρ = ), and ρfb the corresponding balanced value, defined as:
ερ
ε ε⋅ ⋅
=⋅ +
ck cufb
fk cu fk
0.85( )
ff
(6)
where εcu is the maximum concrete compressive strain. The thirty ratios ranged from 0.1 to 2.7, with steps of 0.1 (with the exception of values 0.95, 1.25 and 1.35). Depending on ρf/ρfb 1 the concrete crushing (ρf/ρfb>1) or the FRP rupture (ρf/ρfb<1) is determined.
A design space made of 23·30=240 design cases was thus defined.
Table 3: Nominal Values of Random Variables
Design Variable
Minimum Nominal Value (A)
Maximum Nominal Value (B)
b [mm] 200 500 d [mm] 240 1425
fck [MPa] 23.28 42.97

CCC 2008: R. Fico, A. Prota, I. Iervolino and G. Manfredi
7
5.4 Resistance Models for Flexural Capacity of FRP-RC Members
As the flexural capacity of an FRP-RC member depends on the material and cross sectional properties, which are random design variables, its flexural capacity, MR, is a random variable as well. Three main categories of possible sources of uncertainty can be identified when considering the nominal strength rather than the actual (random) strength (Ellingwood[2]):
• Material properties (M): the uncertainties associated with material properties are uncertainties in the strength of the material, the modulus of elasticity (eventually), etc;
• Fabrication (F): these are the uncertainties in the overall dimensions of the member (generally much less uncertain than materials) which can affect the cross-sectional area, the moment of inertia, etc.
• Analysis (P): the uncertainty resulting from the specific method of analysis used to predict behavior (i.e. model uncertainty).
Each of these uncertainties has its own statistical properties; i.e. bias, COV, and distribution type; an exhaustive investigation on this aspect can be found elsewhere (Fico[18]); in particular, the uncertainty due to the analysis method yields significant effects on the probability of failure and consequently on the reliability index.
5.5 Used Load Model
Dead loads (D) and live loads (L) often acting on FRP RC members of civil structures are the two load categories considered in this study.
The dead load considered in design is the gravity load due to the self weight of the structure; it is normally treated as a Normal random variable in literature (Okeil et al.[6], Nowak and Collins[20], Ellingwood et al.[22], La Tegola[11]); because of the control over construction materials, it is assumed that the accuracy to estimate dead loads is higher compared to that of live loads. The works considered in this study induced to adopt a bias, λD, of 1.0 and a coefficient of variation, VD , of 10 %.
The live loads, L, represent the weight of people and their possessions, furniture, movable equipments, and other non permanent objects; the area under consideration plays an important role in the statistical properties of live loads, since the magnitude of load intensity decreases as the area contributing to the live load increases. The studies considered herein led to assume a bias, λD, equal to 1.0 and a COV, VL, equal to 25%; a Gumbel-type distribution was chosen to represent the live loads. Table 4 summarizes the statistical properties considered for dead and live loads.
Table 4: Statistical properties for dead loads and live loads
Load Bias COV (%) Distribution Type Dead (D) 1.05 10 Normal Live (L) 1 25 Gumbel
6 PROCEDURE The LRFD codes (D.M.LL.PP. 09/01/1996[16]; Eurocode 2[17]) specify a strength equation in the
following format:
φ γ≥ ∑n Qi iR Q (7)
where the nominal resistance of a structural member, Rn, is reduced by a resistance factor, φ, while the nominal applied loads, Qi, are increased by the load factors, γ Qi .
The values of φ and γ Qi are set to ensure that members designed according to this design equation have a low probability of failure that is less than a small target value.
The Standard Codes referenced in this study (D.M.LL.PP. 09/01/1996[16]; Eurocode 2[17])
CCC 2008: R. Fico, A. Prota, I. Iervolino and G. Manfredi
8
prescribe that the following relationship shall be applied in case of flexure:
γ≥ ∑rd Qi iM Q (8)
where rdM is the design flexural capacity of member, computed as a function of the concrete design strength, γ=cd ck cf f , and of the GFRP reinforcement design strength, η γ= ⋅ ⋅fd a fk f0.9f f . In other words the resistance factor φ turns into material safety factors herein, namely γ c and γ f .
To evaluate the reliability index of the designed GFRP RC beams, in this study the limit state function consists of three random variables, flexural resistance, Mr, applied bending moment due to dead load effects, MD, and applied bending moment due to live load effects, ML:
= − +r D L r D L( , , ) ( )G M M M M M M (9)
the statistical properties of MD and ML for building loads are discussed earlier in this chapter, whereas the load demands are computed with the design equation of the current guidelines (CNR-DT 203/2006[1]). Assuming a defined ratio of L DM M , it is possible to derive the applied moment value, for example =L D 1M M , that replaced in equation:
γ γ+ =D D L L rdM M M (10)
gives γ γ γ γ+ = + =D D L L D L rd( ) ( )M M M or:
γ γ= =
+rd
D LD L
MM M
(11)
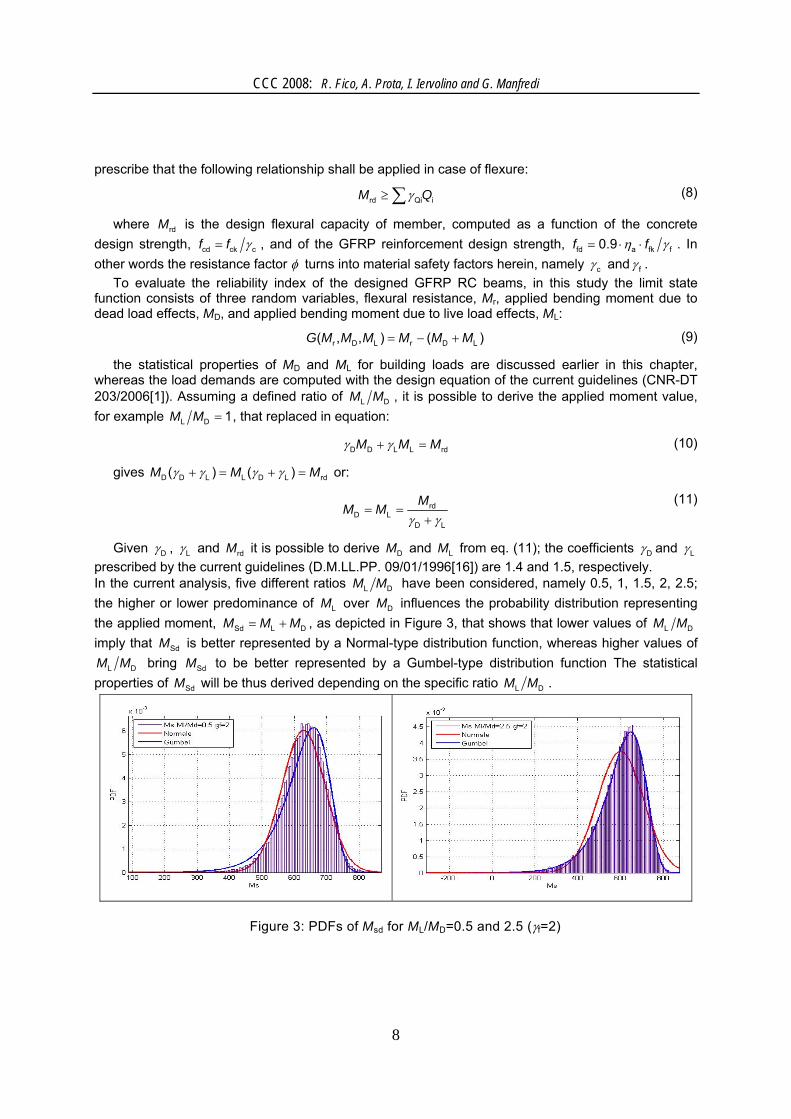
Given γD , γL and rdM it is possible to derive DM and LM from eq. (11); the coefficients γD and γL prescribed by the current guidelines (D.M.LL.PP. 09/01/1996[16]) are 1.4 and 1.5, respectively. In the current analysis, five different ratios L DM M have been considered, namely 0.5, 1, 1.5, 2, 2.5; the higher or lower predominance of LM over DM influences the probability distribution representing the applied moment, Sd L DM M M= + , as depicted in Figure 3, that shows that lower values of L DM M imply that SdM is better represented by a Normal-type distribution function, whereas higher values of
L DM M bring SdM to be better represented by a Gumbel-type distribution function The statistical properties of SdM will be thus derived depending on the specific ratio L DM M .
Figure 3: PDFs of Msd for ML/MD=0.5 and 2.5 (γf=2)

CCC 2008: R. Fico, A. Prota, I. Iervolino and G. Manfredi
9
The statistical properties of rM are obtained employing the Monte-Carlo sampling already explained, computing for the randomly extracted values the flexural capacity according to the ULS design.
Finally the reliability index is computed for the design cases assumed in function of both L DM M and γf; secondly, the uncertainties due to factors M, F and P are taken into account as well. It must be highlighted that the reliability index will be investigated in two different ways, in compliance with the research works available in literature (see § 2), namely by distinguishing the two possible failure modes or not. In the first case, two further types of classification can be used, that is considering the characteristic or the design values of materials.
7 RESULTS AND DISCUSSION Following the procedure explained in the previous paragraph, the reliability index has been initially
computed for each of the 240 design cases related to beams, by varying the ratios L DM M and ρf/ρfb. The partial safety factor for FRP reinforcement suggested in the CNR-DT203/2006[1], γf=1.5, has been considered initially.
The diagram reported in Figure 4 allows deducing the following remarks, regardless of the specific ratio L DM M :
• for design cases corresponding to ρf/ρfb<0.5, the reliability index β is nearly constant and then independent of the reinforcement ratio;
• for design cases corresponding to 0.5<ρf/ρfb<0.9, the reliability index β predominantly increases when the reinforcement ratio increases;
• when 0.9<ρf/ρfb<1.0, the reliability index β slightly decreases when the reinforcement ratio increases;
• for design cases corresponding to 1.0<ρf/ρfb<2.5 the reliability index β decreases when the reinforcement ratio increases, until a constant value for ρf/ρfb>2.5;
Summarizing, different zones can be identified, depending on ρf/ρfb: two edge zones of low, steady values of β corresponding to under-reinforced (ρf/ρfb<0.5) and over-reinforced sections (ρf/ρfb>2.5); a central zone with the maximum values of β corresponding to the balanced failing sections (ρf/ρfb∼1), where the materials are best exploited and then with the highest structural reliability values; and two transition zones with β variable going from under- or over-reinforced sections to balanced failing sections.
456789
101112131415
0 0,5 1 1,5 2 2,5
ρ f/ρ fb
β
ML/MD=2.5ML/MD=2ML/MD=1.5ML/MD=1ML/MD=0.5
Figure 4: Trend of β vs ρf/ρfb and ML/MD (γf=1.5)
However, the reliability index is significantly influenced by the reinforcement ratio ρf/ρfb and by the

CCC 2008: R. Fico, A. Prota, I. Iervolino and G. Manfredi
10
specific design cases taken into account, which means by the mechanical and geometrical properties considered; nevertheless, β is strongly variable within the design space considered, ranging from 4.5 to 12.2.
The dependence of the reliability index on γ f for the 240 design cases has been assessed for the five ratios ML/MD (1200 design cases overall); a mean value of β, β0, was plotted in function of γ f , as shown in Figure 5-a:
The two failure modes curves intersect in two points, corresponding to γ =f 1.08 ( β =0 6.4 ) and γ =f 1.65 ( β =0 8.3 ), which can be deemed as optimum points, since they correspond to uniform reliability. It is believed that for the 1200 design cases considered the value of γ f to be preferred is γ =f 1.08 , since it reduces the GFRP reinforcement strength less than the other one and together it corresponds to a satisfactory level of safety of member, being β β> =0 min 5 (Pf=10-7), that can be deemed as the threshold value for flexural RC members at ULS (see Table 1). Nevertheless, it can be also observed that points with γ =f 1.5 correspond to an over-conservative level of safety ( β >0 7.5 ).
It must be underlined that the classification proposed to plot β0 vs γf, obtained by considering the ratios ρf/ρfb accounting for the characteristic values of material strengths, turns into the plot of Figure 5-b when accounting for the design values of materials strengths: no failure mode switch takes place, concrete failures only occur for γ< <f1 1.6 and within this range the concrete failures do not depend on γ f , since the concrete ultimate compressive strain is reached (which is not dependent on the FRP strength). Nevertheless, the optimum value of γ =f 1.04 found with this classification is very close to that derived before ( γ =f 1.08 ), whereas points with γ =f 1.5 correspond to a level of safety of FRP failing case ( β =0 8.0 ) higher than those failing by concrete crushing ( β ∼0 6.4 ), which can be deemed a good result, since the ductile failure mode occurs more likely.
5,50
6,00
6,50
7,00
7,50
8,00
8,50
9,00
9,50
10,00
11,11,21,31,41,51,61,71,81,92
γ f
β 0
Concrete failure
FRP failure
a) ffk,fck
5,5
6,0
6,5
7,0
7,5
8,0
8,5
9,0
9,5
10,0
11,11,21,31,41,51,61,71,81,92
γ f
β 0
Concrete failure
FRP failure
b) ffd,fcd
Figure 5: β0 vs γf for all ML/MD ratios and all ρf/ρfb
6 CONCLUSIONS A reliability-based calibration of partial safety factors has been applied to assess the reliability
levels of the ultimate limit state (ULS) flexural design suggested by the Italian guidelines CNR-DT 203/2006[1]. 240 FRP-RC beams have been virtually designed to cover a wide design space considering an appropriate set of random design variables (cross-sectional dimensions, concrete strengths and FRP reinforcement ratios) used to develop resistance models for FRP-RC members. Monte-Carlo simulations have been performed to determine the variability in material properties and

CCC 2008: R. Fico, A. Prota, I. Iervolino and G. Manfredi
11
fabrication processes; whereas experimental data reported in literature have been used to quantify the variability related to the analysis method. A structural reliability analysis has been conducted based on the established resistance models and load models obtained from literature. The reliability index, β, computed for all FRP-RC beams for five ratios of live load to dead load moments, has been assessed in different hypotheses, namely depending on ρf/ρfb, ML/MD, γ f , and on the uncertainty effects due to material properties (M), fabrication process (F) and analysis method (P); the following conclusions can be drawn:
1. The research work carried out is strictly dependent on the specific design cases taken into account; although a wide range of design cases has been covered and statistical properties available in literature have been assigned to design variables. More thorough and refined results will be attained with the research growth in the field of composites.
2. Regardless of member type (beams or slabs) and specific design considered, five different zones can be identified, depending on ρf/ρfb: two edge zones of low, steady values of β corresponding to under-reinforced (ρf/ρfb<0.5) and over-reinforced sections (ρf/ρfb>2.5); a central zone with the maximum values of β corresponding to the balanced failing sections, where the materials are best exploited and then with the highest structural reliability values; and two transition zones with β variable going from under- or over-reinforced sections to balanced failing sections.
3. For the 1200 design cases related to beam-type members (240 design cases by 5 ratios ML/MD) the value of γ f to be preferred is γ =f 1.1, as it slightly reduces the GFRP reinforcement strength and together it corresponds to a satisfactory level of safety of the member ( β β= > =0 min6.4 5 at ULS). Nevertheless, it can be also observed that points with γ =f 1.5 (current value proposed in the CNR-DT 203/2006[1]) correspond to a good level of safety ( β ≥0 7.5 ), although the limitation on the strength of FRP reinforcement can be considered too penalizing and cost-ineffective. Similar conclusions are derived if considering a different classification of results, depending on the design values of materials strengths rather than on the corresponding characteristic values;
4. When accounting for M, F and P, regardless of the design space selected, the trend of the reliability index vs γ f is similar to that obtained without the contribution of the three factors; yet a general reduction in the reliability level is observed.
5. This study focuses exclusively on the flexural behavior of GFRP-RC beams and assumes that the other modes of failure such as shear failure and bond failure do not control the design. Similar kinds of research should be conducted for other modes of failure; likewise, it would be worth to extend this research study to other types of reinforcement (i.e. carbon and aramid FRP).
REFERENCES [1] CNR-DT 203/2006. “Guide for the Design and Construction of Concrete Structures Reinforced
with Fiber-Reinforced Polymer Bars” National Research Council, Rome, Italy, 2006; [2] Ellingwood, B. R., 2003, Toward Load and Resistance Factor Design for Fiber-Reinforced
Polymer Composite structures, Journal of Structural Engineering, Vol. 129, No. 4, pp.449-458; [3] Plevris, N., Triantafillou, T. C., and Veneziano, D., 1995, “Reliability of RC members strengthened
with CFRP laminates”, Journal of structural engineering, ASCE; [4] Ellingwood, B. R., 1995, Toward load and resistance factor design for fiber-reinforced polymer
composite structures, Journal of structural engineering, ASCE; [5] Okeil, A. M., El-Tawil, S., and Shahawy, M. (2001). "Short-term tensile strength of CFRP
laminates for flexural strengthening of concrete girders" ACI Struct. J., 98(4), 470–478; [6] Okeil, A., El-Tawil, S., and Shahawy, M., 2002, “Flexural Reliability of Reinforced Concrete Bridge

CCC 2008: R. Fico, A. Prota, I. Iervolino and G. Manfredi
12
Girders Strengthened with CFRP Laminates”, Journal of Bridge Engineering, Vol.7, No. 5, pp. 290-299;
[7] Monti, G., and Santini, S., 2002, “Reliability-based Calibration of Partial Safety Coefficients for Fiber-Reinforced Plastic”, Journal of Composites for Construction, Vol. 6, No. 3, pp. 162-167;
[8] Frangopol, D. M., and Recek, S., 2003, “Reliability of fiber-reinforced composite laminates plates”, Journal of Probabilistic Engineering Mechanics, Vol. 18, pp. 119-137;
[9] Di Sciuva, M., Lomario, D., 2003, “A Comparison between Monte Carlo and FORMs in Calculating the Reliability of a Composite Structure”, Journal of Composite Structures, Vol. 59, pp 155-162;
[10] Spitaleri, G., and Totaro, N., 2006, “Calibration of Resistance Factors for FRP Flexural Strengthening of RC Beams in the European Format”, 2nd International fib Congress, June 5-8, 2006 - Naples, Italy;
[11] La Tegola, A., 1998, Actions for Verification of RC Structures with FRP Bars, Journal of Composites for Construction;
[12] Neocleous, K., Pilakoutas, K., and Waldron, P., 1999, “Structural reliability for fibre reinforced polymer reinforced concrete structures”. Proceeding of the 4th International Symposium on Fibre Reinforced Polymers for Reinforced Concrete Structures, p. 65–74;
[13] Pilakoutas, K., Neocleous, K., and Guadagnini, M., “Design philosophy issues of fibre reinforced polymer reinforced concrete structures”. Journal of Composites for Construction, ASCE 2002;6(3):154–61;
[14] He, Z., and Huang, Y., 2006, “Reliability assessment of flexural capacity design for FRP-reinforced concrete”, Engineering Structures, Article in Press;
[15] Kulkarni, S., 2006, “Calibration of flexural design of concrete members reinforced with FRP bars”, Thesis for Master of Science in civil engineering. Graduate Faculty of the Louisiana State University and Agricultural and Mechanical College;
[16] D.M.LL.PP. 09/01/1996. 1996. “Norme tecniche per il calcolo, l’esecuzione ed il collaudo delle strutture in cemento armato, normale e precompresso e per le strutture metalliche”, Rome, Italy;
[17] EN 1992-1-1 Eurocode 2 “Design of concrete structures - Part 1-1: General rules and rules for buildings”, 2004;
[18] Fico, R., 2007, “Limit States Design of Concrete Structures Reinforced with FRP Bars”, PhD Thesis, Univ. of Naples, Italy, 167 p.
[19] BS EN 1990:2002, Eurocode. Basis of structural design British-Adopted European Standard, 27-Jul-2002 / 118 p.;
[20] Nowak A. S., and Collins K. R., “Reliability of Structures”, McGraw-Hill. 2000; [21] Nowak A.S., Szerszen M.M., 2003, “Calibration of Design Code, for Buildings (ACI318): Part 1 -
Statistical Models for Resistance”, Structural Journal, ACI, Vol.100, No.3, pp. 377-382; [22] Ellingwood B., Galambos T.V., MacGregor J.G., Cornell C.A., 1980, “Development of a
probability based load criterion for American national standard A58 building code requirements for minimum design loads in buildings and other structures”, Special Publication 577, Washington (DC, USA): US Department of Commerce, National Bureau of Standards;