reliability for tantalum capacitors - avx corporation · · 2016-09-03... 3d control charts •...
TRANSCRIPT
Reaching the Highest Reliability for Tantalum
Capacitors
James Bates, Marc Beaulieu, Michael Miller, Joseph Paulus AVX Corporation
ABSTRACT Weibull reliability assessment has been used for characterization of tantalum capacitors for many decades driven by MIL standards. Over time major improvements have been made in process, material, testing, equipment and other process control.
Is Weibull still the best fit for today's technology and Hi-Rel applications?
A new approach is needed since the current Weibull grading to assure reliability has deficiencies, in particular, the need for early life failures and the potentially damaging application of excessive voltage during the burn-in in an effort to maximize the Weibull acceleration factor.
This paper will discuss modifications to the existing burn-in process, techniques for DC leakage screening, and improvements in process monitoring. These modifications improve the consistency of the resultant product DC leakage as well as eliminating the potential for field-induced dielectric damage. The result: tantalum capacitors that deliver the best performance in zero failure tolerance applications.
BACKGROUND – TANTALUM CAPACITOR RELIABILITY:
It has been well established that the presence of impurities in the tantalum anode create disruptions in the Ta2O5 dielectric. These disruptions, in addition to those created by other manufacturing-induced defects, can result in elevated leakage current, parametric leakage instability, or catastrophic dielectric breakdown. The occurrence of these non-homogenous defects can be reduced through material and process controls, and practically eliminated with the implementation of appropriate testing regimens.
After the elimination of the non-homogenous defect portion of the population, there still remain a number of homogenous defects, parametrically represented by leakage current and phenomenologically represented by electron traps [1]. The robustness of the dielectric can be characterized as either a resistance to catastrophic dielectric failure or as parametric leakage stability. Both characterizations can be modeled, at least initially, using the thermochemical model championed by McPherson and corroborated by Teverovsky [2,3]. A key conclusion from the thermochemical model is the potential susceptibility of the Ta2O5 dielectric to time-dependent dielectric breakdown, potentially accelerated by an inappropriate application of burn-in voltage.
The need to control both manufacturing-induced defects and those defects intrinsic to the capacitor population is addressed with the Q-Process, incorporating the following elements:
• Process Monitoring: 3D Control Charts • 125°C, Voltage-Optimized Burn-In • Statistical Screening at Various Temperatures, Pre/Post Burn-In • Enhanced Inline Reflow Conditioning • Maverick Lot Identification • Product Level Designator
PROCESS MONITORING: 3D CONTROL CHARTS
The reduction of non-homogenous defects through material and process control requires accurate monitoring of relevant processing, in particular the identification of special cause events. Traditional SPC charts fail to accurately characterize normal process variability since they are incorrectly based on within-batch variability instead of batch-to-batch variability.
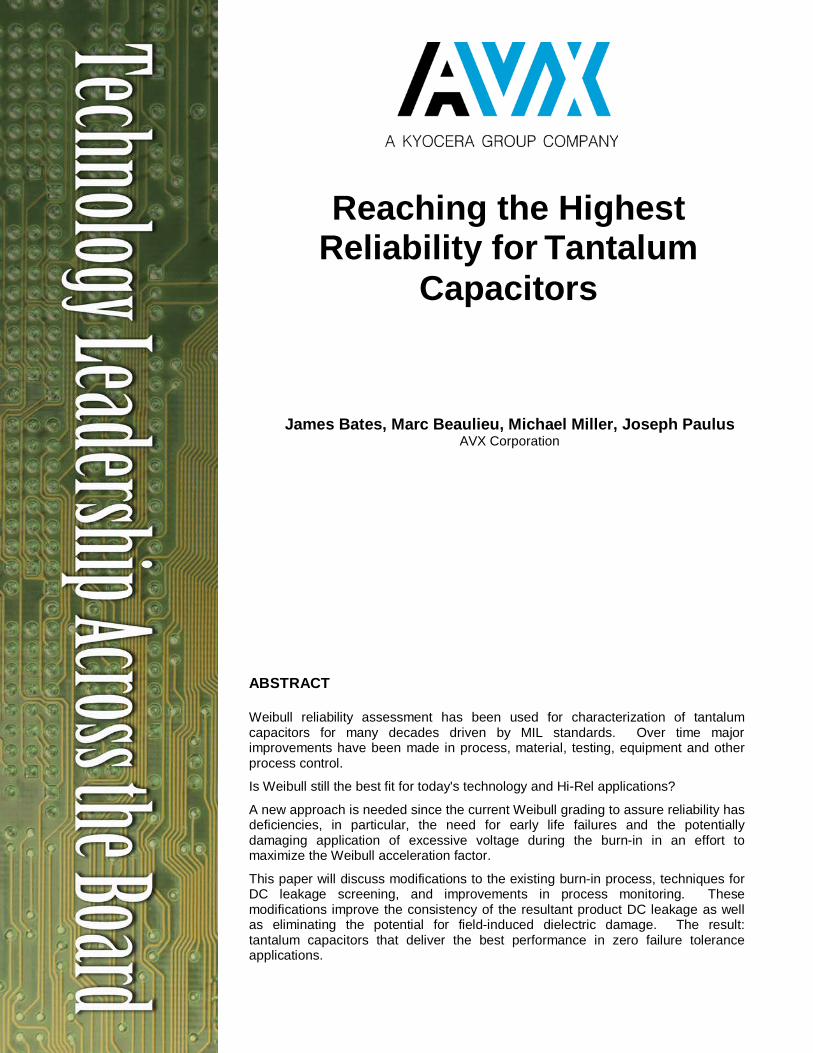
Traditional SPC charts incorrectly use the within-batch sigma (based off the centerline on the sigma chart) in the control limit calculations in the batch-to-batch chart (the X-bar chart). This typically results in the pattern illustrated in chart 1:
Chart 1
The calculated control limits on the X-bar chart are not representative of the plot points. In this example, the control limits are very tight. This clearly indicates that the within-batch variability is much smaller than the batch-to-batch variability. If these charts are used to control the process, the operators and engineers are simply chasing normal process variation and can’t focus on special cause events because the majority of batches are “out of control”.
IMPLEMENTING 3D CONTROL CHARTS
Using two charts to track the variability provides a more accurate representation of the true process variation:
• moving-range chart for batch-to-batch variability
• sigma chart for the within-batch variability
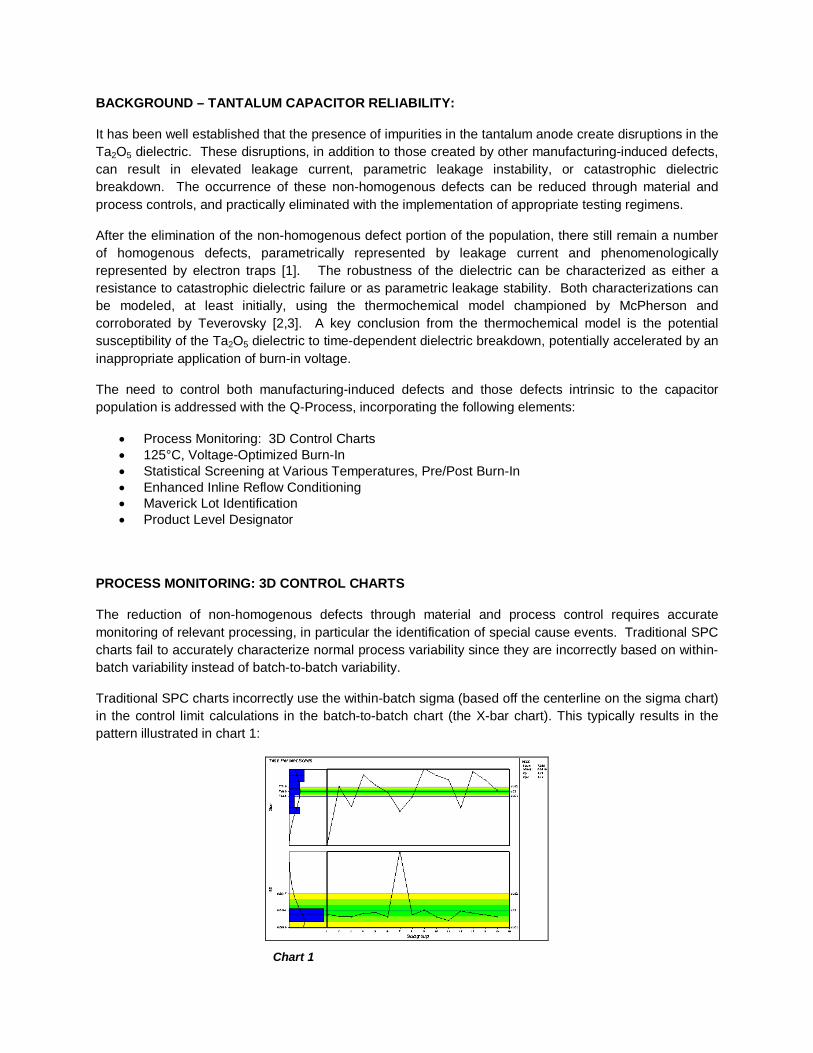
AVX now uses the centerline of the batch-to-batch moving-range chart in the calculations for the batch-to-batch X-bar chart. (Chart 2) shows the same data with the additional moving-range chart and the correct control limits on the X-bar chart. The top chart is now treated as an individuals chart - IX.
The Moving R chart displays the batch-to-batch variability and the S (within) chart displays the within-batch variability. Control limits on the top chart are based off the Moving R centerline.
The vertical lines on the IX chart’s plot points represent the within-batch variability. Note that the within-batch variability of batch #7 is much higher than the others. This variability is limited to within the batch and does not show up as a special cause on the IX chart or the Moving R chart.
In the manufacture of tantalum capacitors there are many cases where both within subgroup and between subgroup sources of variability need to be monitored. Once the appropriate control charts are implemented on the manufacturing floor, both production and engineering can focus on special cause events. These special cause events are the key drivers for continuous improvement. Once a special cause event is identified, then root cause investigations can begin. Each root cause investigation identifies areas where either the process can be optimized or product or process enhancements can take place. Examples of some of these product/process enhancements while developing the Q-Process:
Chart 2
1. Tighter Anode Pressing Control
2. SPC Monitored and Controlled Sintering
3. MES-Controlled and SPC-Monitored Formation Equipment
4. MES-Controlled MnO2 Deposition Systems
5. Saw Optimization
6. Individual Part Stability Testing
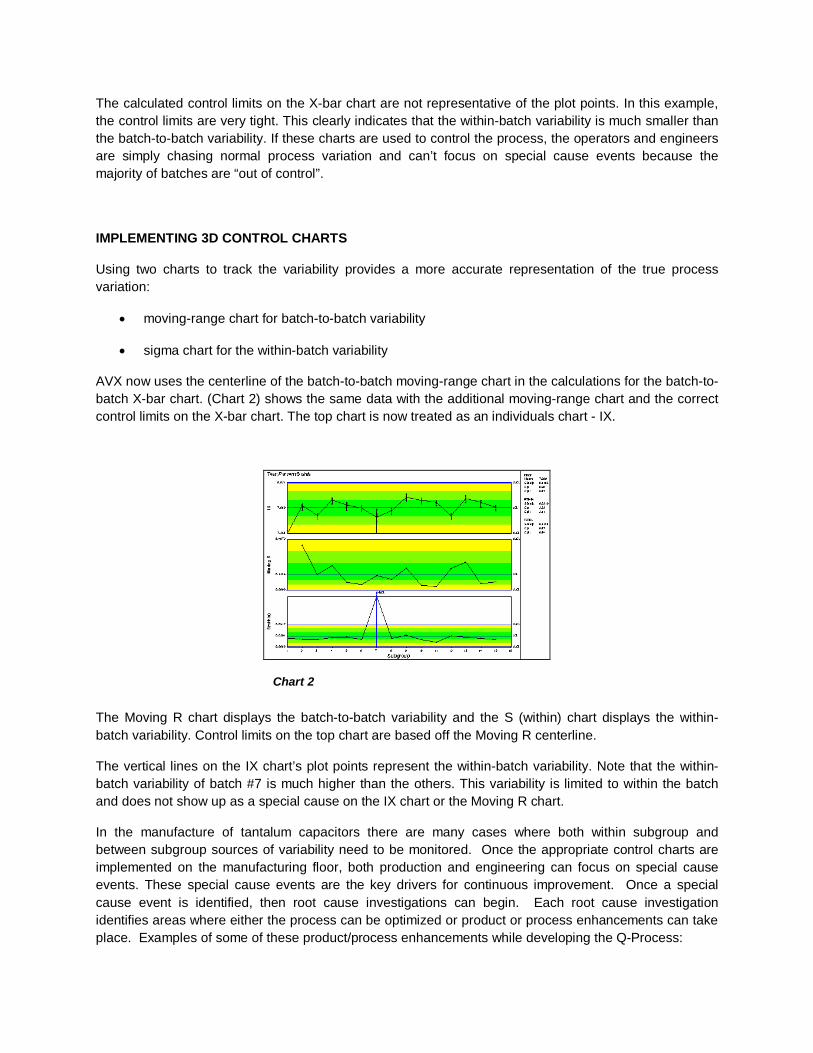
The result of these improvements include but are not limited to tighter and lower DCL performance with less special cause variation (chart 3).
OPTIMIZED BURN-IN
The burn-in process accomplishes two primary functions through the accelerated aging process induced by applied temperature and voltage:
• Component healing and defect isolation • Destabilization of “maverick” defects
Certain defects, not removed through pre burn-in statistical screening, will become enhanced through the accelerated aging, that response characterized by a significant parametric increase in DC leakage. These previously undetected defects will now exhibit DC leakage uncharacteristic of the rest of the component population and can then be removed by post burn-in statistical screening.
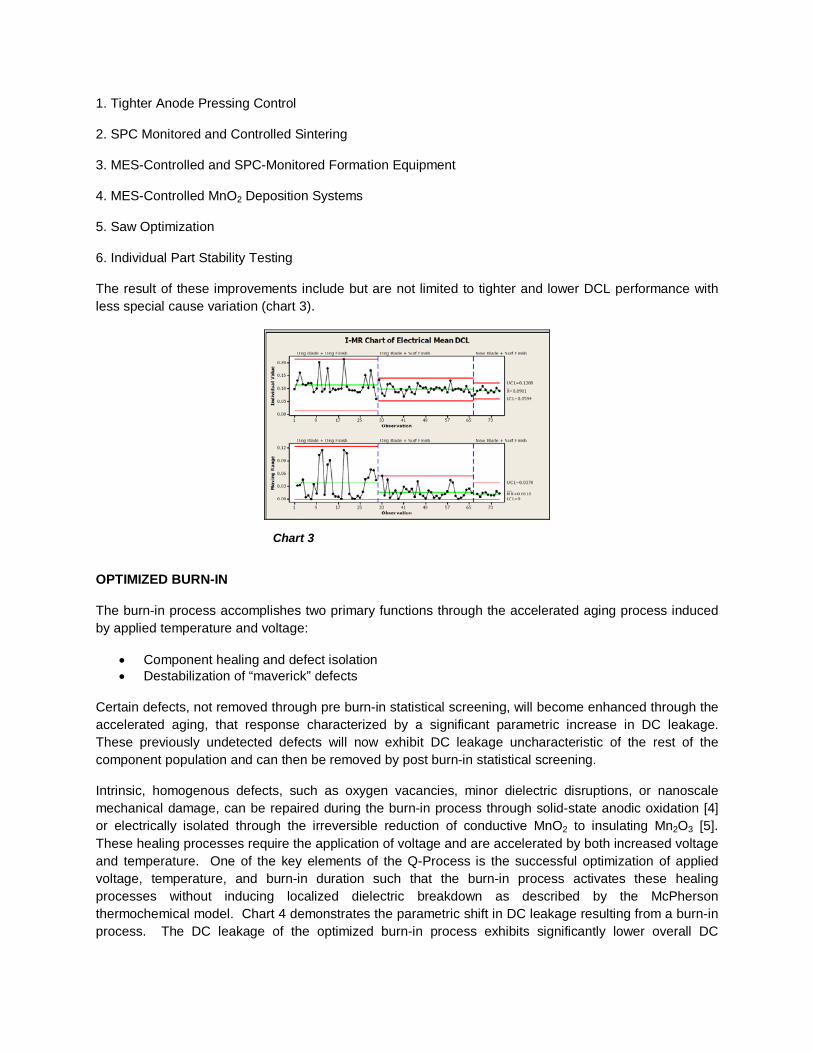
Intrinsic, homogenous defects, such as oxygen vacancies, minor dielectric disruptions, or nanoscale mechanical damage, can be repaired during the burn-in process through solid-state anodic oxidation [4] or electrically isolated through the irreversible reduction of conductive MnO2 to insulating Mn2O3 [5]. These healing processes require the application of voltage and are accelerated by both increased voltage and temperature. One of the key elements of the Q-Process is the successful optimization of applied voltage, temperature, and burn-in duration such that the burn-in process activates these healing processes without inducing localized dielectric breakdown as described by the McPherson thermochemical model. Chart 4 demonstrates the parametric shift in DC leakage resulting from a burn-in process. The DC leakage of the optimized burn-in process exhibits significantly lower overall DC
Chart 3
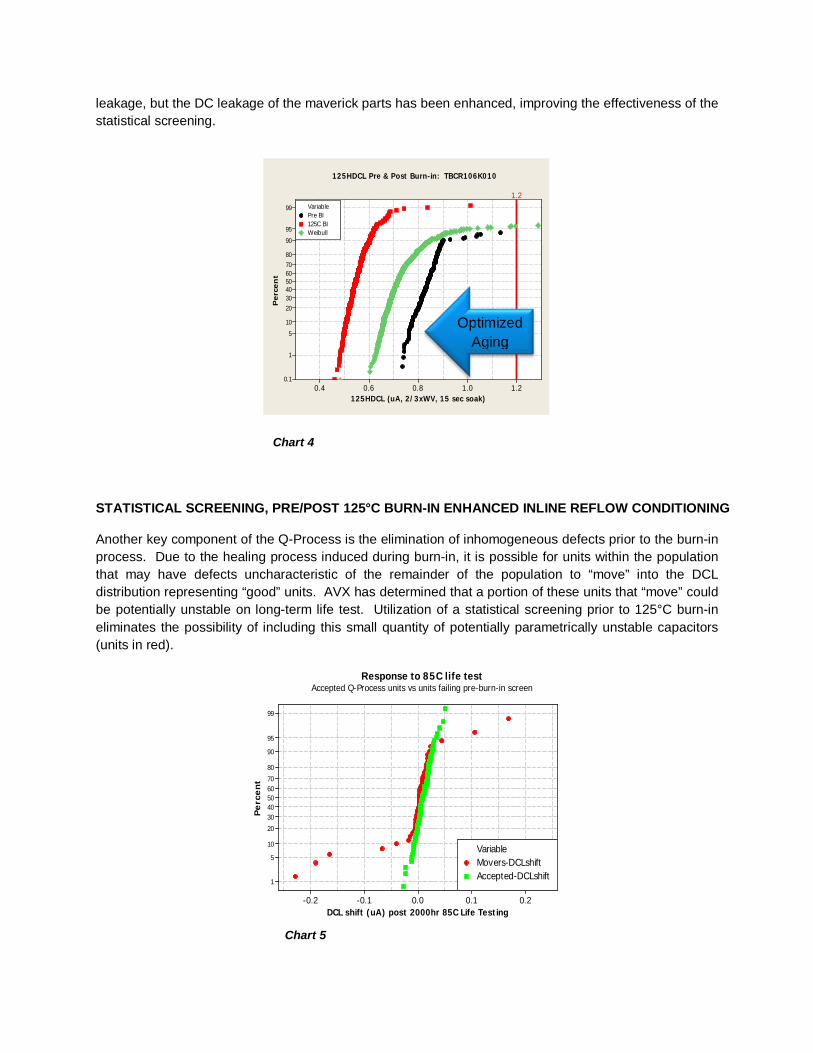
leakage, but the DC leakage of the maverick parts has been enhanced, improving the effectiveness of the statistical screening.
STATISTICAL SCREENING, PRE/POST 125°C BURN-IN ENHANCED INLINE REFLOW CONDITIONING
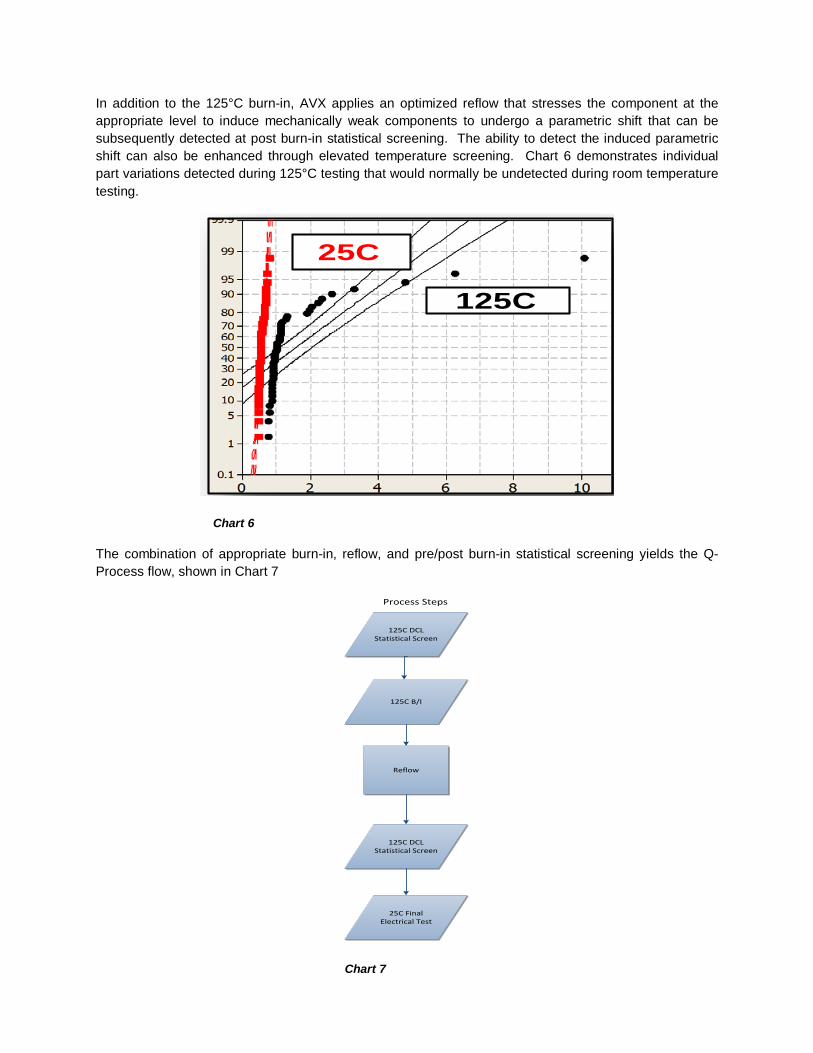
Another key component of the Q-Process is the elimination of inhomogeneous defects prior to the burn-in process. Due to the healing process induced during burn-in, it is possible for units within the population that may have defects uncharacteristic of the remainder of the population to “move” into the DCL distribution representing “good” units. AVX has determined that a portion of these units that “move” could be potentially unstable on long-term life test. Utilization of a statistical screening prior to 125°C burn-in eliminates the possibility of including this small quantity of potentially parametrically unstable capacitors (units in red).
0.20.10.0-0.1-0.2
99
95
90
80
7060504030
20
10
5
1
DCL shift (uA) post 2000hr 85C Life Testing
Pe
rce
nt
Movers-DCLshiftAccepted-DCLshift
Variable
Response to 85C life testAccepted Q-Process units vs units failing pre-burn-in screen
1.21.00.80.60.4
99
95
90
80706050403020
10
5
1
0.1
125HDCL (uA, 2/3xWV, 15 sec soak)
Perc
en
t
1.2
Pre BI125C BIWeibull
Variable
125HDCL Pre & Post Burn-in: TBCR106K010
Optimized Aging
Chart 4
Chart 5
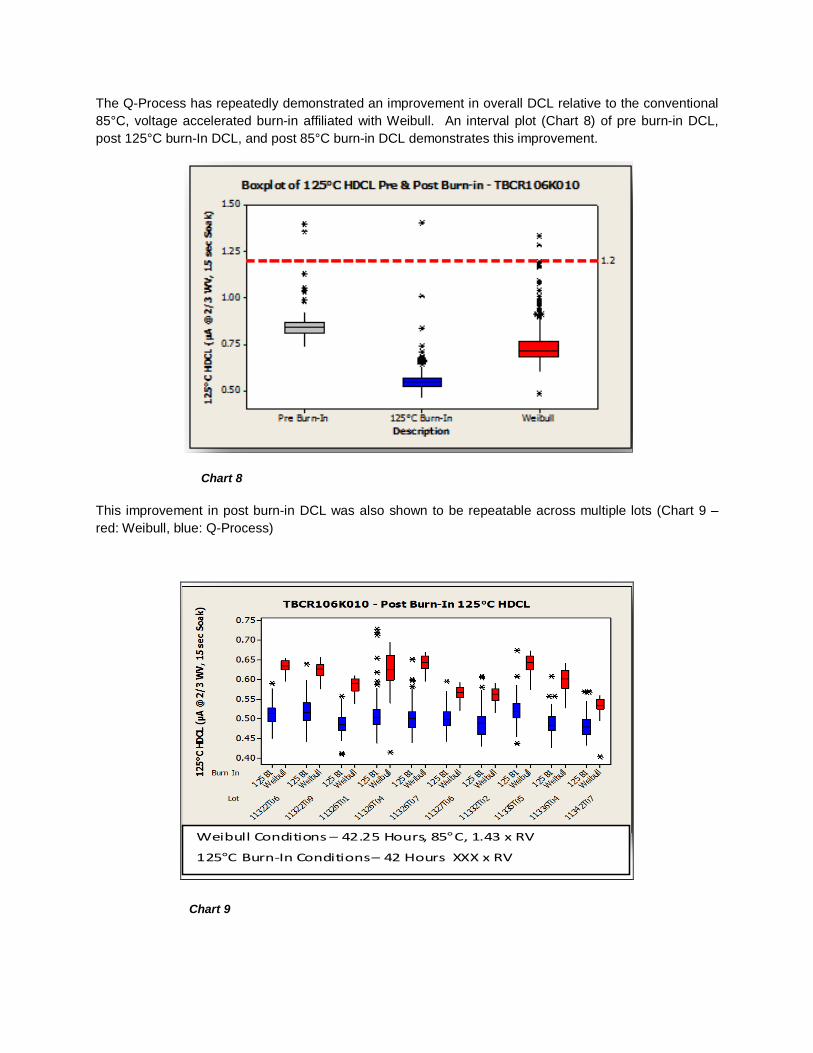
In addition to the 125°C burn-in, AVX applies an optimized reflow that stresses the component at the appropriate level to induce mechanically weak components to undergo a parametric shift that can be subsequently detected at post burn-in statistical screening. The ability to detect the induced parametric shift can also be enhanced through elevated temperature screening. Chart 6 demonstrates individual part variations detected during 125°C testing that would normally be undetected during room temperature testing.
25C
125C
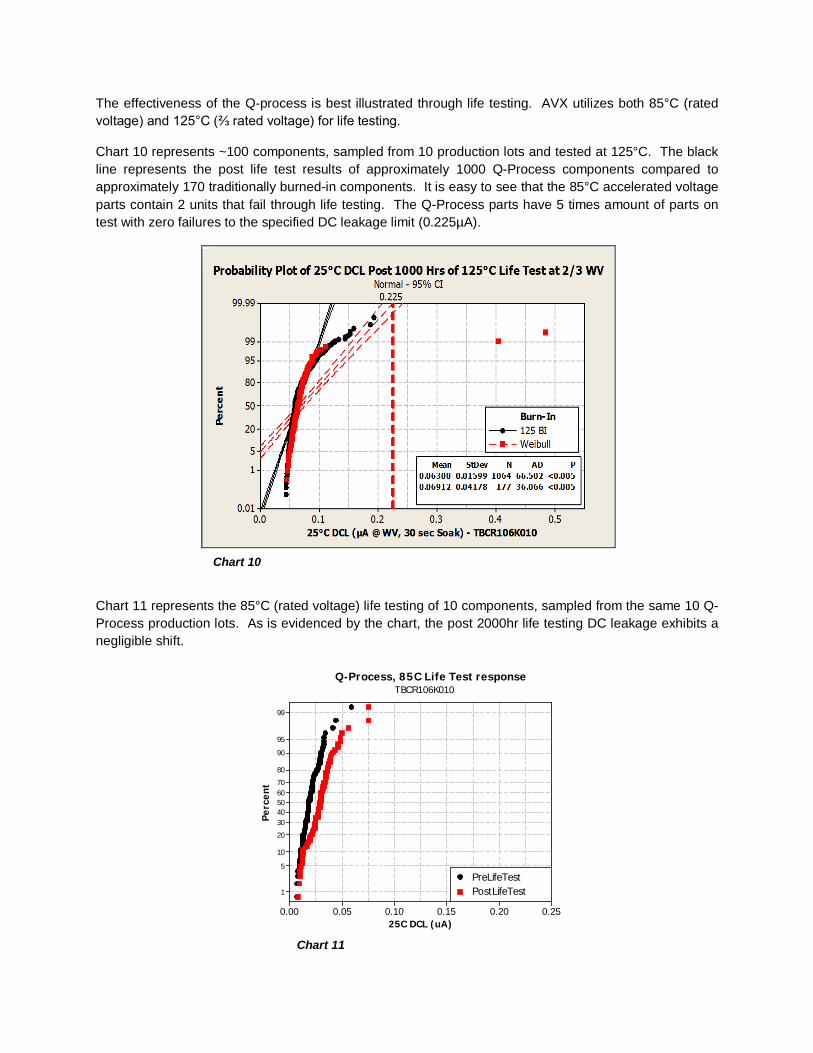
The combination of appropriate burn-in, reflow, and pre/post burn-in statistical screening yields the Q-Process flow, shown in Chart 7
125C B/I
125C DCLStatistical Screen
25C Final Electrical Test
Process Steps
Reflow
125C DCLStatistical Screen
Chart 6
Chart 7
The Q-Process has repeatedly demonstrated an improvement in overall DCL relative to the conventional 85°C, voltage accelerated burn-in affiliated with Weibull. An interval plot (Chart 8) of pre burn-in DCL, post 125°C burn-In DCL, and post 85°C burn-in DCL demonstrates this improvement.
This improvement in post burn-in DCL was also shown to be repeatable across multiple lots (Chart 9 – red: Weibull, blue: Q-Process)
Weibull Conditions – 42.25 Hours, 85°C, 1.43 x RV
125°C Burn-In Conditions – 42 Hours XXX x RV
Chart 8
Chart 9
The effectiveness of the Q-process is best illustrated through life testing. AVX utilizes both 85°C (rated voltage) and 125°C (⅔ rated voltage) for life testing.
Chart 10 represents ~100 components, sampled from 10 production lots and tested at 125°C. The black line represents the post life test results of approximately 1000 Q-Process components compared to approximately 170 traditionally burned-in components. It is easy to see that the 85°C accelerated voltage parts contain 2 units that fail through life testing. The Q-Process parts have 5 times amount of parts on test with zero failures to the specified DC leakage limit (0.225µA).
Chart 11 represents the 85°C (rated voltage) life testing of 10 components, sampled from the same 10 Q-Process production lots. As is evidenced by the chart, the post 2000hr life testing DC leakage exhibits a negligible shift.
0.250.200.150.100.050.00
99
95
90
80
7060504030
20
10
5
1
25C DCL (uA)
Perc
ent
PreLifeTestPostLifeTest
Q-Process, 85C Life Test responseTBCR106K010
Chart 10
Chart 11
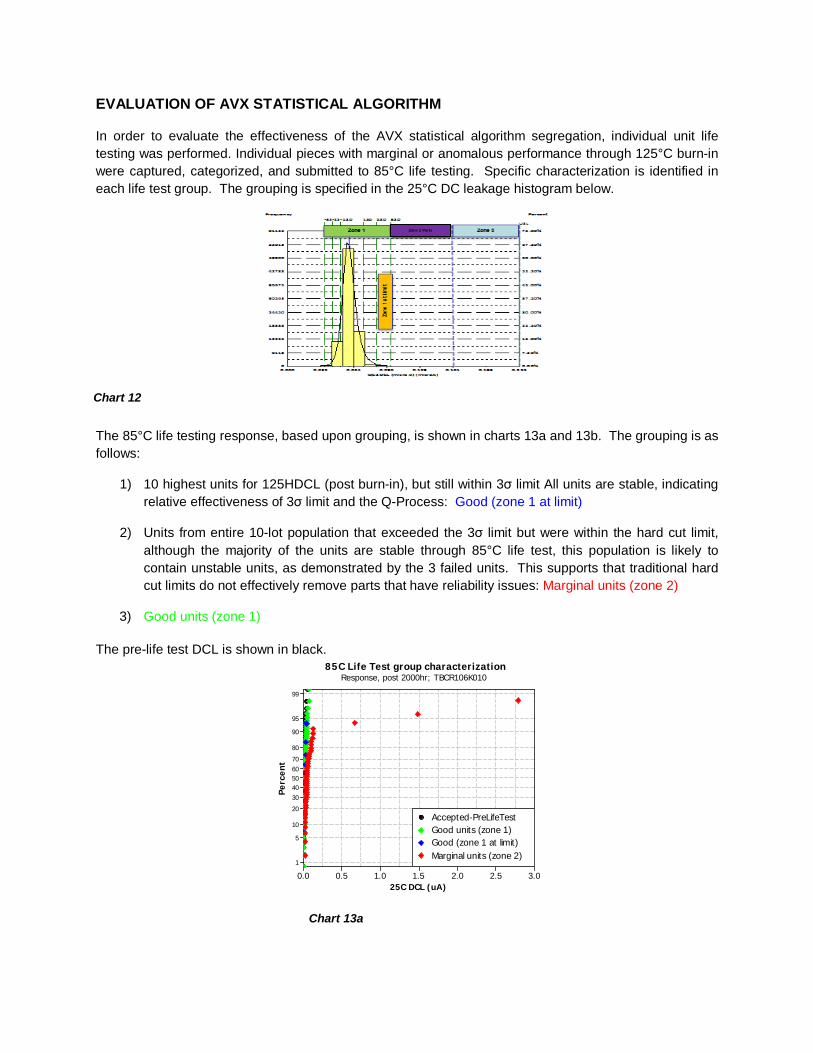
EVALUATION OF AVX STATISTICAL ALGORITHM
In order to evaluate the effectiveness of the AVX statistical algorithm segregation, individual unit life testing was performed. Individual pieces with marginal or anomalous performance through 125°C burn-in were captured, categorized, and submitted to 85°C life testing. Specific characterization is identified in each life test group. The grouping is specified in the 25°C DC leakage histogram below.
The 85°C life testing response, based upon grouping, is shown in charts 13a and 13b. The grouping is as follows:
1) 10 highest units for 125HDCL (post burn-in), but still within 3σ limit All units are stable, indicating relative effectiveness of 3σ limit and the Q-Process: Good (zone 1 at limit)
2) Units from entire 10-lot population that exceeded the 3σ limit but were within the hard cut limit, although the majority of the units are stable through 85°C life test, this population is likely to contain unstable units, as demonstrated by the 3 failed units. This supports that traditional hard cut limits do not effectively remove parts that have reliability issues: Marginal units (zone 2)
3) Good units (zone 1) The pre-life test DCL is shown in black.
3.02.52.01.51.00.50.0
99
95
90
80
7060504030
20
10
5
1
25C DCL (uA)
Perc
ent
Accepted-PreLifeTestGood units (zone 1)Good (zone 1 at limit)Marginal units (zone 2)
85C Life Test group characterizationResponse, post 2000hr; TBCR106K010
Zone 2 Parts
Chart 12
Chart 13a
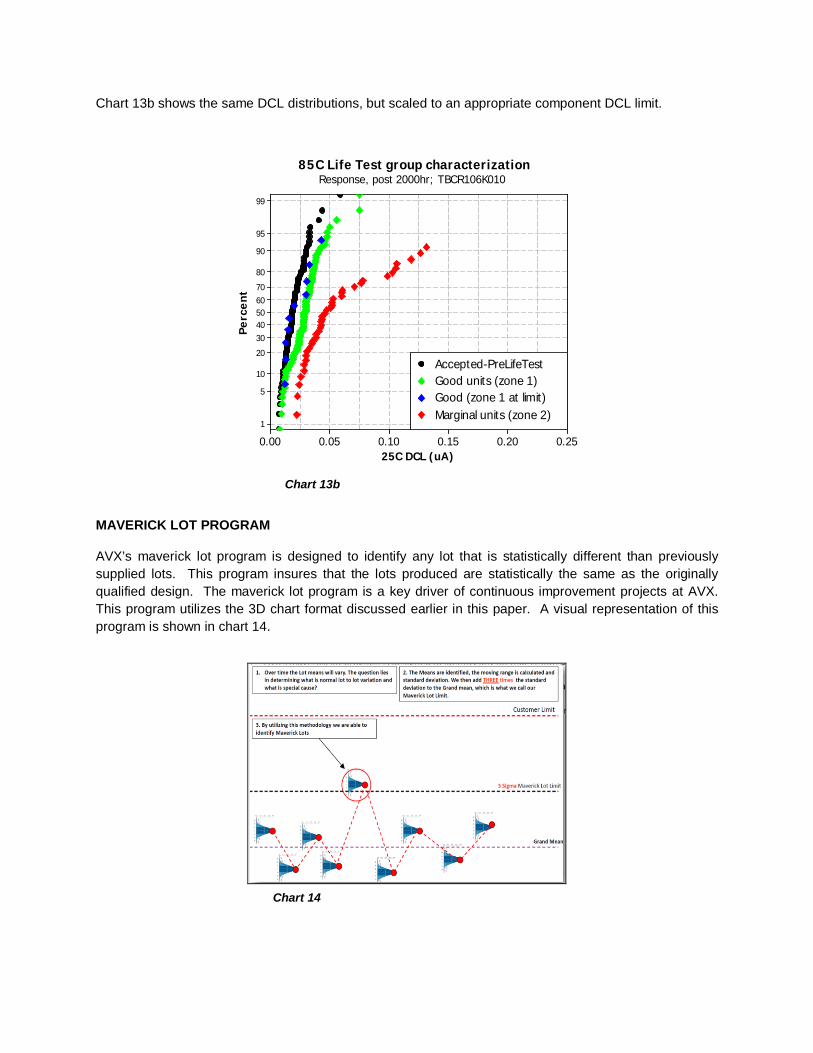
Chart 13b shows the same DCL distributions, but scaled to an appropriate component DCL limit.
0.250.200.150.100.050.00
99
95
90
80
7060504030
20
10
5
1
25C DCL (uA)
Perc
ent
Accepted-PreLifeTestGood units (zone 1)Good (zone 1 at limit)Marginal units (zone 2)
85C Life Test group characterizationResponse, post 2000hr; TBCR106K010
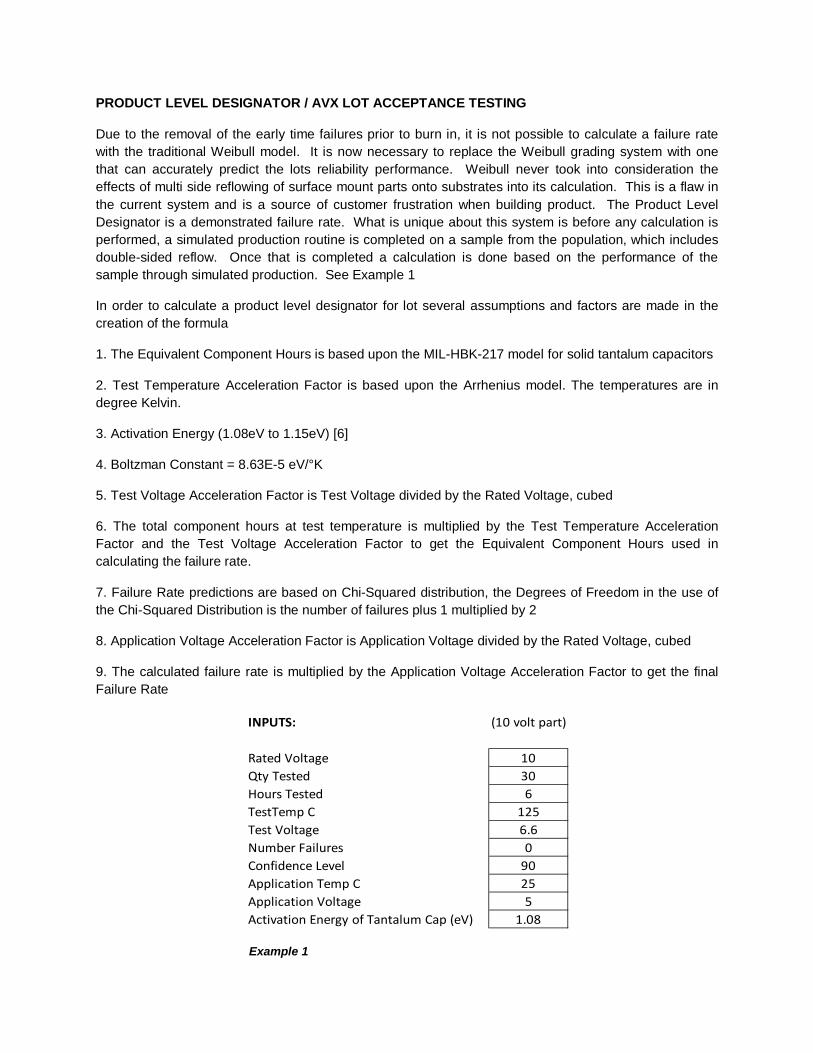
MAVERICK LOT PROGRAM
AVX’s maverick lot program is designed to identify any lot that is statistically different than previously supplied lots. This program insures that the lots produced are statistically the same as the originally qualified design. The maverick lot program is a key driver of continuous improvement projects at AVX. This program utilizes the 3D chart format discussed earlier in this paper. A visual representation of this program is shown in chart 14.
Chart 13b
Chart 14
PRODUCT LEVEL DESIGNATOR / AVX LOT ACCEPTANCE TESTING
Due to the removal of the early time failures prior to burn in, it is not possible to calculate a failure rate with the traditional Weibull model. It is now necessary to replace the Weibull grading system with one that can accurately predict the lots reliability performance. Weibull never took into consideration the effects of multi side reflowing of surface mount parts onto substrates into its calculation. This is a flaw in the current system and is a source of customer frustration when building product. The Product Level Designator is a demonstrated failure rate. What is unique about this system is before any calculation is performed, a simulated production routine is completed on a sample from the population, which includes double-sided reflow. Once that is completed a calculation is done based on the performance of the sample through simulated production. See Example 1
In order to calculate a product level designator for lot several assumptions and factors are made in the creation of the formula
1. The Equivalent Component Hours is based upon the MIL-HBK-217 model for solid tantalum capacitors
2. Test Temperature Acceleration Factor is based upon the Arrhenius model. The temperatures are in degree Kelvin.
3. Activation Energy (1.08eV to 1.15eV) [6]
4. Boltzman Constant = 8.63E-5 eV/°K
5. Test Voltage Acceleration Factor is Test Voltage divided by the Rated Voltage, cubed
6. The total component hours at test temperature is multiplied by the Test Temperature Acceleration Factor and the Test Voltage Acceleration Factor to get the Equivalent Component Hours used in calculating the failure rate.
7. Failure Rate predictions are based on Chi-Squared distribution, the Degrees of Freedom in the use of the Chi-Squared Distribution is the number of failures plus 1 multiplied by 2
8. Application Voltage Acceleration Factor is Application Voltage divided by the Rated Voltage, cubed
9. The calculated failure rate is multiplied by the Application Voltage Acceleration Factor to get the final Failure Rate
INPUTS: (10 volt part)
Rated Voltage 10Qty Tested 30Hours Tested 6TestTemp C 125Test Voltage 6.6Number Failures 0Confidence Level 90Application Temp C 25Application Voltage 5Activation Energy of Tantalum Cap (eV) 1.08
Example 1
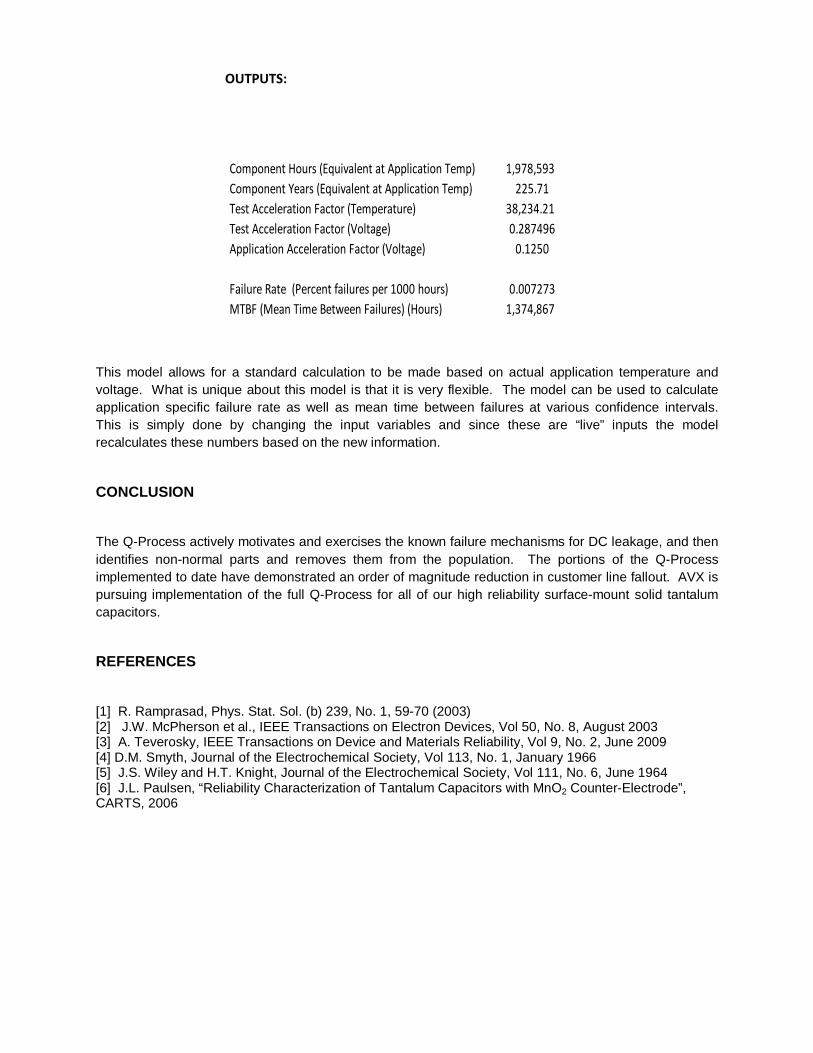
Component Hours (Equivalent at Application Temp) 1,978,593Component Years (Equivalent at Application Temp) 225.71Test Acceleration Factor (Temperature) 38,234.21Test Acceleration Factor (Voltage) 0.287496Application Acceleration Factor (Voltage) 0.1250
Failure Rate (Percent failures per 1000 hours) 0.007273MTBF (Mean Time Between Failures) (Hours) 1,374,867
This model allows for a standard calculation to be made based on actual application temperature and voltage. What is unique about this model is that it is very flexible. The model can be used to calculate application specific failure rate as well as mean time between failures at various confidence intervals. This is simply done by changing the input variables and since these are “live” inputs the model recalculates these numbers based on the new information.
CONCLUSION
The Q-Process actively motivates and exercises the known failure mechanisms for DC leakage, and then identifies non-normal parts and removes them from the population. The portions of the Q-Process implemented to date have demonstrated an order of magnitude reduction in customer line fallout. AVX is pursuing implementation of the full Q-Process for all of our high reliability surface-mount solid tantalum capacitors.
REFERENCES
[1] R. Ramprasad, Phys. Stat. Sol. (b) 239, No. 1, 59-70 (2003) [2] J.W. McPherson et al., IEEE Transactions on Electron Devices, Vol 50, No. 8, August 2003 [3] A. Teverosky, IEEE Transactions on Device and Materials Reliability, Vol 9, No. 2, June 2009 [4] D.M. Smyth, Journal of the Electrochemical Society, Vol 113, No. 1, January 1966 [5] J.S. Wiley and H.T. Knight, Journal of the Electrochemical Society, Vol 111, No. 6, June 1964 [6] J.L. Paulsen, “Reliability Characterization of Tantalum Capacitors with MnO2 Counter-Electrode”, CARTS, 2006
OUTPUTS: