reliability testing of power devices - power · pdf file— residential pv — solar...
TRANSCRIPT

Andras Vass-Varnai
Product manager
Reliability Testing ofPower Devices
October 16, 2014

© 2014 Mentor Graphics Corp. Company Confidential
www.mentor.com
Overview
Short introduction to the industrial challenges in powerelectronics
Brief theoretical overview of power cycling testing andthermal transient testing
Experimental examples
Overview of the MicReD Industrial Power Tester 1500A

© 2014 Mentor Graphics Corp. Company Confidential
www.mentor.com
Insulated Gate Bipolar Transistors (IGBT) /Power Electronics Applications
Motor drives— Commercial motor drives— Motor drives discrete— Motor drives modules— Motor drives IPM
UPS— UPS discrete— UPS modules
PhotoVoltaic inverters— Commercial PV— Residential PV— Solar farms
Electric Vehicles/Hybrids— PHEV/EV— Full HEV— Mild HEV— Micro HEV— EV/HEV charging stations
3
Railway traction— Rail traction inverters— Rail auxiliary inverters
Wind turbines— Wind turbine >1MW— Residential/commercial
wind turbines
Industrial applications— Welding— Other industrial
Consumer applications— Induction heating— DSC–DSLR camera flash— Air conditioner— Washing machine— Microwave oven— Flat panel (LCD/PDP)— Lighting supplies— Other home appliances
Others— Other power supplies
(SMPS)— Automotive ignition— Marine propulsion— Medical applications— Defibrillators— Avionics converters— Heavy duty vehicles— Grid –T&D
Classification by Yole Développement

© 2014 Mentor Graphics Corp. Company Confidential
www.mentor.com
IGBT Market Forecast by Segment
4
$0B
$1B
$2B
$3B
$4B
$5B
$6B
$7B
2011 2012 2013-E 2014-E 2015-E 2016-E 2017-E 2018-E
Others
Consumer applications
Industrial applications
Wind turbines
Rail traction
EV/HEV (+chargers)
PV inverter
UPS
Motor drives
Source: Yole Developpement - IGBT Markets & Application Trends, 2013

© 2014 Mentor Graphics Corp. Company Confidential
www.mentor.com
IGBT technology trend –Power densities are increasing
Siemens User Meeting, June 20145

© 2014 Mentor Graphics Corp. Company Confidential
www.mentor.com
Focus on Power Electronics Module Reliability
6
Examples:— Hybrid & electric vehicle (EV)— Railway traction applications –
30+ year expected lifetime— Reusable energy production,
e.g., wind turbines, solar
10’s of thousands to millions ofcycles required
Issue is thermally induceddegradations due to powercycling & heat— Wire bond degradation— Metallization layer mismatch— Solder fatigue— Die and substrate cracks

© 2014 Mentor Graphics Corp. Company Confidential
www.mentor.com
300 Amp IGBT Module
7
Failure
© 2014 Mentor Graphics Corp. Company Confidential
www.mentor.com
Vulnerable areas of a typical power device
8
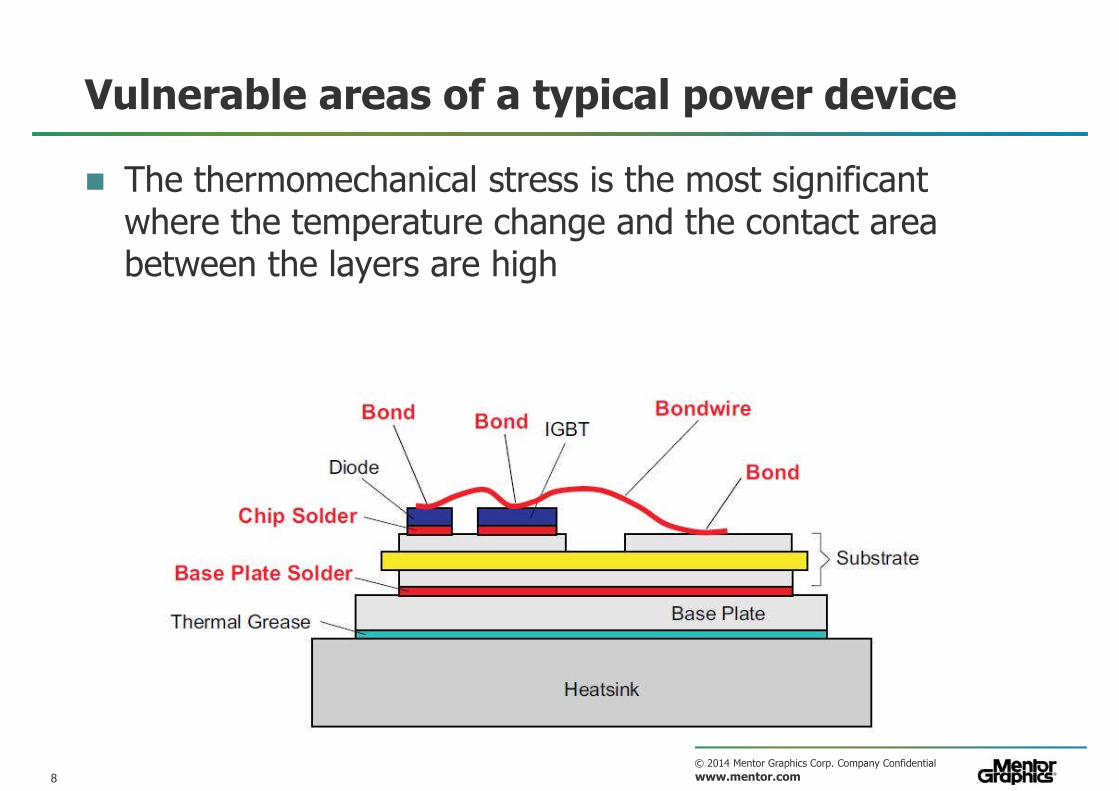
The thermomechanical stress is the most significantwhere the temperature change and the contact areabetween the layers are high
© 2014 Mentor Graphics Corp. Company Confidential
www.mentor.com9
Vulnerable areas of a typical power device
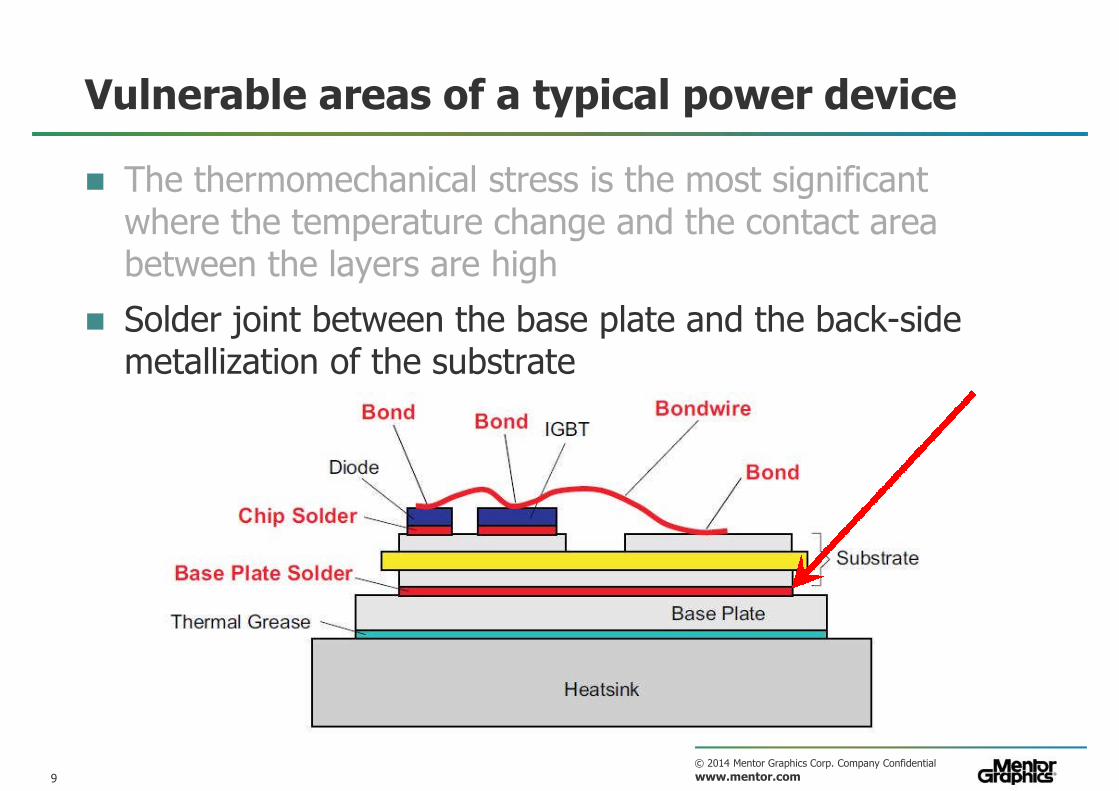
The thermomechanical stress is the most significantwhere the temperature change and the contact areabetween the layers are high
Solder joint between the base plate and the back-sidemetallization of the substrate

© 2014 Mentor Graphics Corp. Company Confidential
www.mentor.com10
Vulnerable areas of a typical power device
The thermomechanical stress is the most significantwhere the temperature change and the contact areabetween the layers are high
Die attach – There was extensive research in this fieldtowards better materials and processes

© 2014 Mentor Graphics Corp. Company Confidential
www.mentor.com11
Vulnerable areas of a typical power device
The thermomechanical stress is the most significantwhere the temperature change and the contact areabetween the layers are high
Bond wires - Small area but high temperature swing andCTE mismatch make it vulnerable

© 2014 Mentor Graphics Corp. Company Confidential
www.mentor.com
Traditional Power Cycle Failure Testing
Traditional Process:— Run set number of power cycles— Take to lab and test for failure— Repeat power cycling/lab testing
cycle until failure— Take to lab and determine
reason for failure
Power Cycle IGBTModule
Lab Test IGBT forFailure
Determine Causeof Failure- Visual
- Sonic/Xray- Dissection
Issues:— Repetitive cycle/lab test process =
long times— No “real time” indication of failure
in progress – only post mortem— Failure cause requires lab analysis
– typically internal to package
Repeat Process
12

© 2014 Mentor Graphics Corp. Company Confidential
www.mentor.com
MicReD Industrial Power Tester 1500AProcess
3 phase equipment(22kW)
UPS
Highcurrent
COLDPLATE
SAFETY BOX
Cold Plate
DUT
Power grid
T3SterMeasurement
PowerCycling
Three 500A Power Sources
Touch Screen &T3Ster Software
Structure Function
Setup &Control
13
© 2014 Mentor Graphics Corp. Company Confidential
www.mentor.com
T3Ster-Generated Structure Functions
14
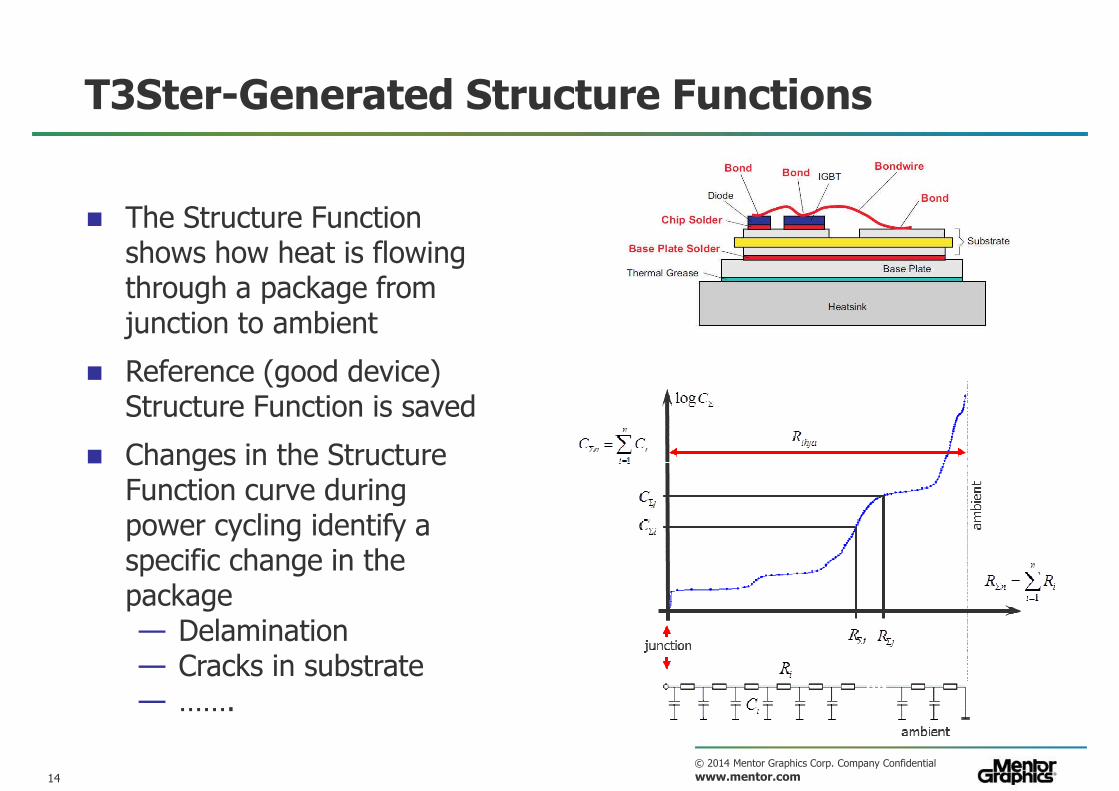
The Structure Functionshows how heat is flowingthrough a package fromjunction to ambient
Reference (good device)Structure Function is saved
Changes in the StructureFunction curve duringpower cycling identify aspecific change in thepackage— Delamination— Cracks in substrate— …….
© 2014 Mentor Graphics Corp. Company Confidential
www.mentor.com
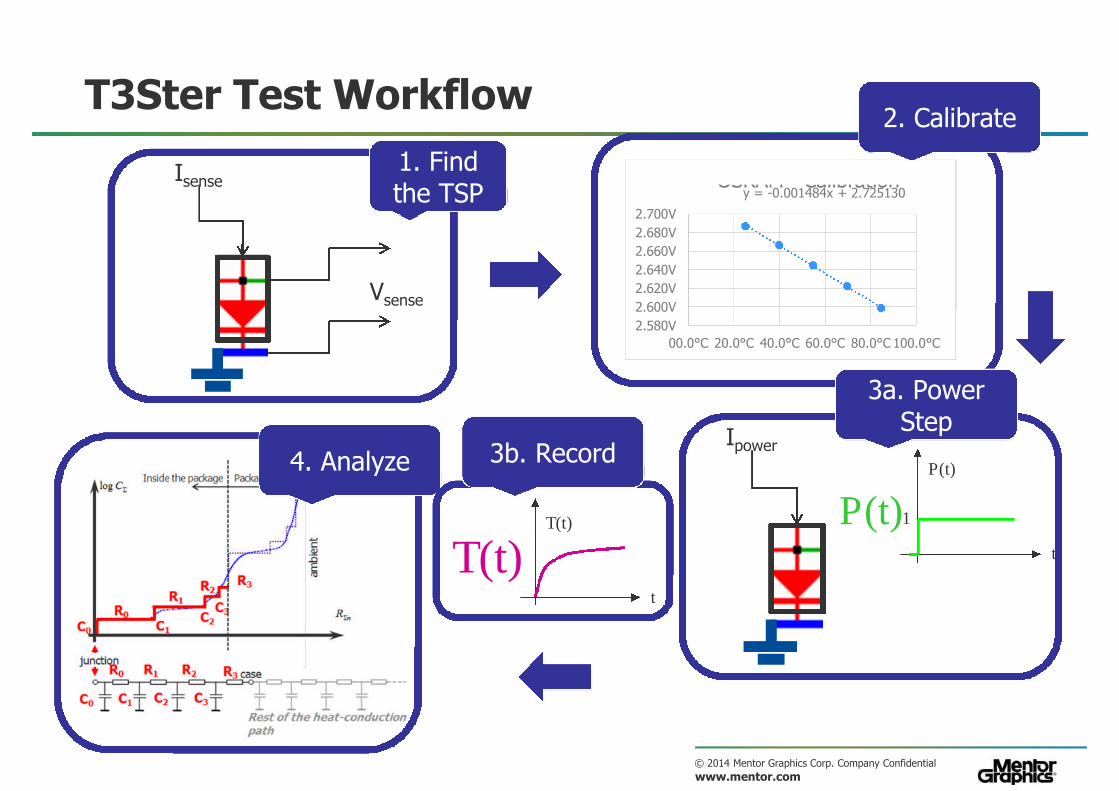
4. Analyze
T3Ster Test Workflow
Vsense
Isense1. Findthe TSP y = -0.001484x + 2.725130
2.580V
2.600V
2.620V
2.640V
2.660V
2.680V
2.700V
00.0°C 20.0°C 40.0°C 60.0°C 80.0°C 100.0°C
OSRAM - Calibration
2. Calibrate
Ipower
t
1
P(t)
P(t)
3a. PowerStep
t
T(t)
T(t)
3b. Record
© 2014 Mentor Graphics Corp. Company Confidential
www.mentor.com
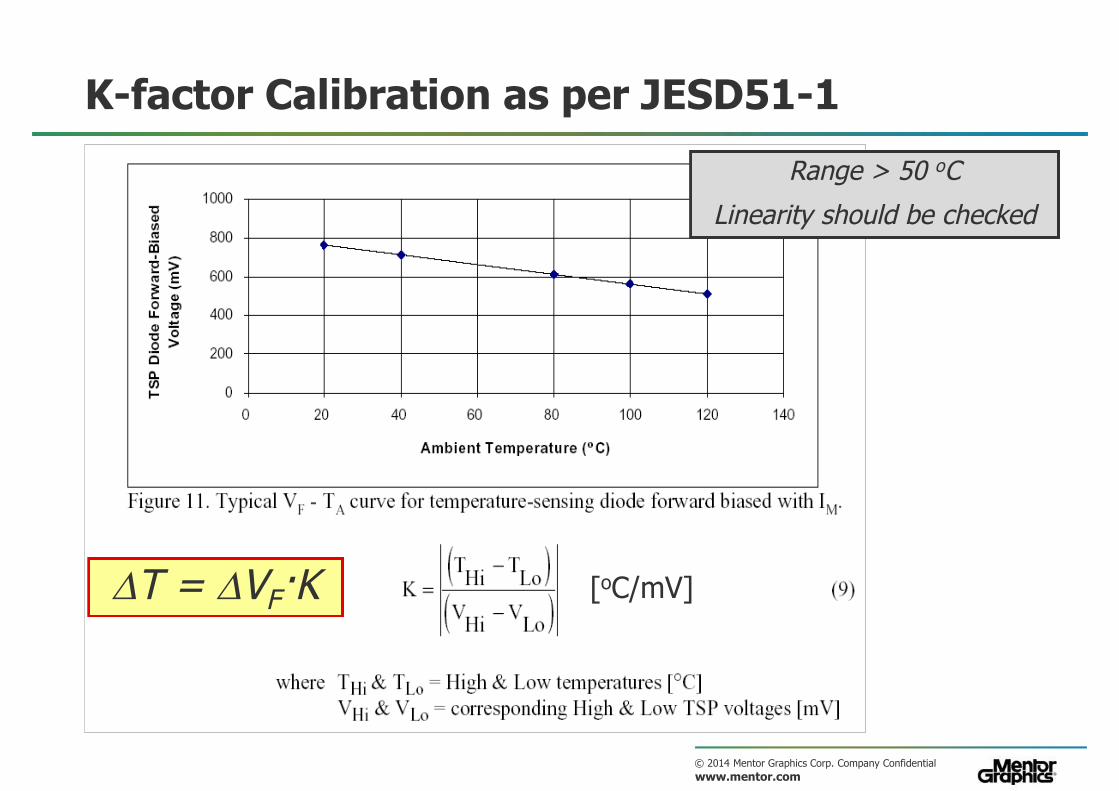
K-factor Calibration as per JESD51-1
T = VF·K [oC/mV]
Range > 50 oC
Linearity should be checked

© 2014 Mentor Graphics Corp. Company Confidential
www.mentor.com
Thermal transient measurementsusing T3Ster
Device parameters are used as a thermometer
The change of the forward voltage (TSP – temperaturesensitive parameter) should be carefully calibrated againstthe change of the temperature (see JEDEC JESD51-1 andMIL-STD-750D)
JEDEC JESD51-1 compliant test setup

© 2014 Mentor Graphics Corp. Company Confidential
www.mentor.com
T3Ster: What does it do?
P
TRthJA
T
t
T2
T1
ΔT
P1
P2
t
P
ΔP Thermal transientresponse curve as
measured by T3Ster
final steady-state
log t time
T temperature rise
initial steady-state
Due to switching the power, temperature changes:
Switch the power on (or off) in steady state and wait for the other steady state tooccur.While waiting for reaching the other steady-state, measure (record) the realtransient continuously, as it takes place.

© 2014 Mentor Graphics Corp. Company Confidential
www.mentor.com
Real-time measurement of the transient
T3Ster: What does it do?
Thermal transientresponse curve as
measured by T3Ster
final steady-state
log t time
T temperature rise
initial steady-state
Can start at 1μs!
Up to 65000 sample points
Very high signal-to-noise ratio
with high accuracy & data density
Due to switching the power, temperature changes:
Switch the power on (or off) in steady state and wait for the other steady state tooccur.While waiting for reaching the other steady-state, measure (record) the realtransient continuously, as it takes place.

© 2014 Mentor Graphics Corp. Company Confidential
www.mentor.com
The clever part is the T3Ster-Master analysis software:— Response curve is processed
— Resulting graphs show– Thermal capacitances
of internal features ofthe package (die, slug, etc.)
– Thermal resistancesbetween these featuresplus spreading resistancein these materials
— These are theStructure Functions
– cumulative– differential
Capacitances
Resistances
Cumulative
Differential
T3Ster: How does it work?

© 2014 Mentor Graphics Corp. Company Confidential
www.mentor.com
Structure Functions:The Key to Understanding Thermal Structure
Cumulative Structure Function
Thermal impedance measured isconverted into a one-dimensionalintegral thermal resistance, heatcapacity of the heat-spread path:
Base
Grease
Die attach
R
C
Chip
Cold-plate
Base
Chip
Die attachJunction
Grease
Simplified Thermal Model
21

© 2014 Mentor Graphics Corp. Company Confidential
www.mentor.com
Experiment I. – Setup and parameters
Sample 0-3
Iload 25 A
P ~200 W
ΔT ~100 °C
Control Mode const. I
THeating 3 s
TCooling 10 s
P
T
t(s)3 13 16 26
Devices mounted on temperature controlledcold plate
Base plate temperature: 25oC
Targeted junction temperature: 125oC
Constant current regardless of the voltagechange
Transient test after every 200 power cycles
22

© 2014 Mentor Graphics Corp. Company Confidential
www.mentor.com
Experiment I. – Results 1.
All devices failed after approx. 40,000 power cycles
Broken bond-wires and burnt areas on the chip surface observed
In fact all IGBTs ultimately failed due to the overheating and damageof the gate-oxide:
23

© 2014 Mentor Graphics Corp. Company Confidential
www.mentor.com
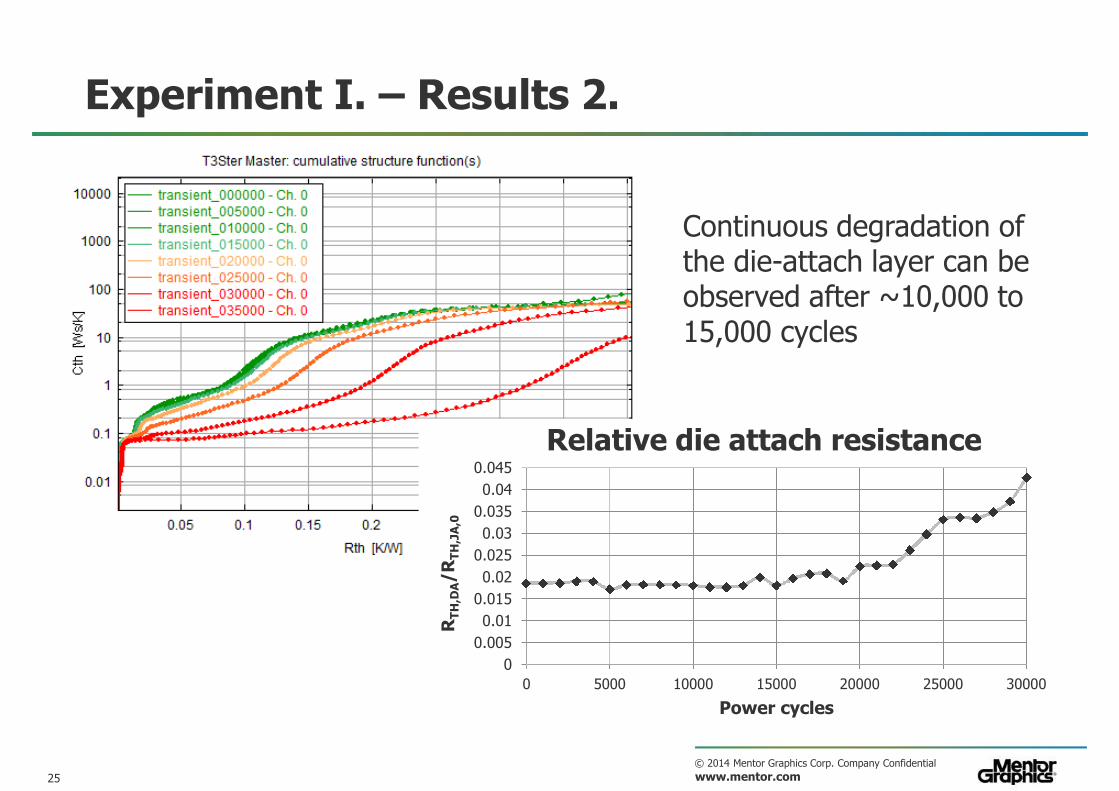
Experiment I. – Results 2.
Continuous degradation ofthe die-attach layer can beobserved after ~10,000 to15,000 cycles
24
© 2014 Mentor Graphics Corp. Company Confidential
www.mentor.com
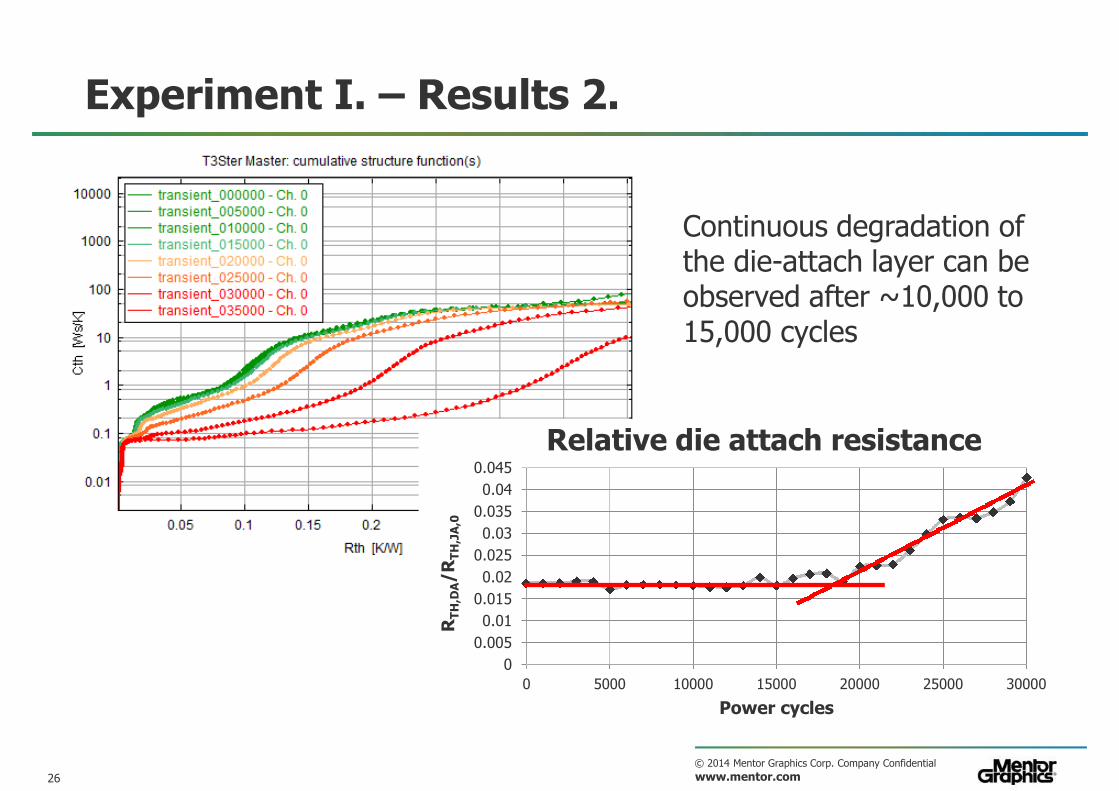
Experiment I. – Results 2.
Continuous degradation ofthe die-attach layer can beobserved after ~10,000 to15,000 cycles
0
0.005
0.01
0.015
0.02
0.025
0.03
0.035
0.04
0.045
0 5000 10000 15000 20000 25000 30000
RT
H,D
A/R
TH
,JA
,0
Power cycles
Relative die attach resistance
25
© 2014 Mentor Graphics Corp. Company Confidential
www.mentor.com
Experiment I. – Results 2.
0
0.005
0.01
0.015
0.02
0.025
0.03
0.035
0.04
0.045
0 5000 10000 15000 20000 25000 30000
RT
H,D
A/R
TH
,JA
,0
Power cycles
Relative die attach resistance
Continuous degradation ofthe die-attach layer can beobserved after ~10,000 to15,000 cycles
26
© 2014 Mentor Graphics Corp. Company Confidential
www.mentor.com
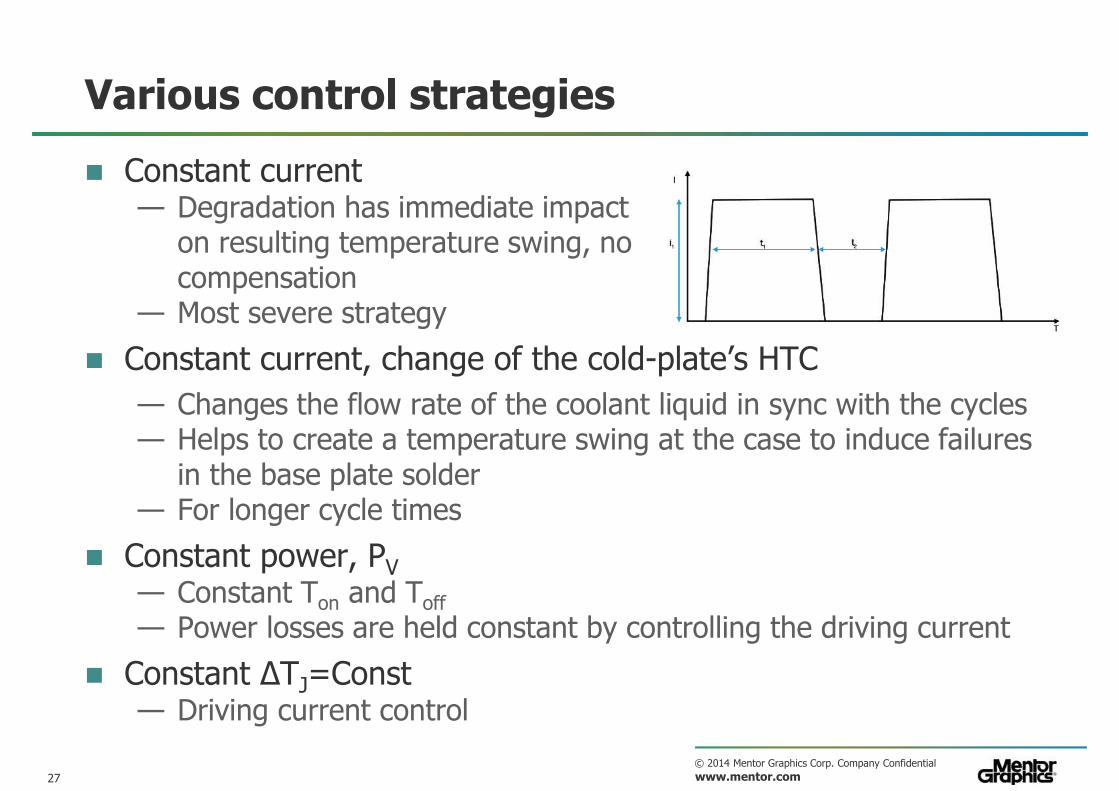
Various control strategies
Constant current— Degradation has immediate impact
on resulting temperature swing, nocompensation
— Most severe strategy
Constant current, change of the cold-plate’s HTC
— Changes the flow rate of the coolant liquid in sync with the cycles— Helps to create a temperature swing at the case to induce failures
in the base plate solder— For longer cycle times
Constant power, PV
— Constant Ton and Toff
— Power losses are held constant by controlling the driving current
Constant ΔTJ=Const— Driving current control
27

© 2014 Mentor Graphics Corp. Company Confidential
www.mentor.com
Experiment II. – Setup and parameters
Devices mounted on temperature controlledcold plate
Base plate temperature: 25oC
Targeted junction temperature change : 105oC
Various control strategies*
Transient test after every 250 power cycles
Number of additional parameters monitored continuously: Icycle, P, Von, Vhot,Vcold, Thot, Tcold, ΔTJ, ΔTJ/P
IGBT1 IGBT2 IGBT3
Iload 68 A 64.4 A 65 A
P 240 W 233 W 246 W
ΔTJ 105 °C 105 °C 105 °C
*Control Mode const. I const. P const. ΔTJ
THeating 3 s
TCooling 17 s
28
© 2014 Mentor Graphics Corp. Company Confidential
www.mentor.com
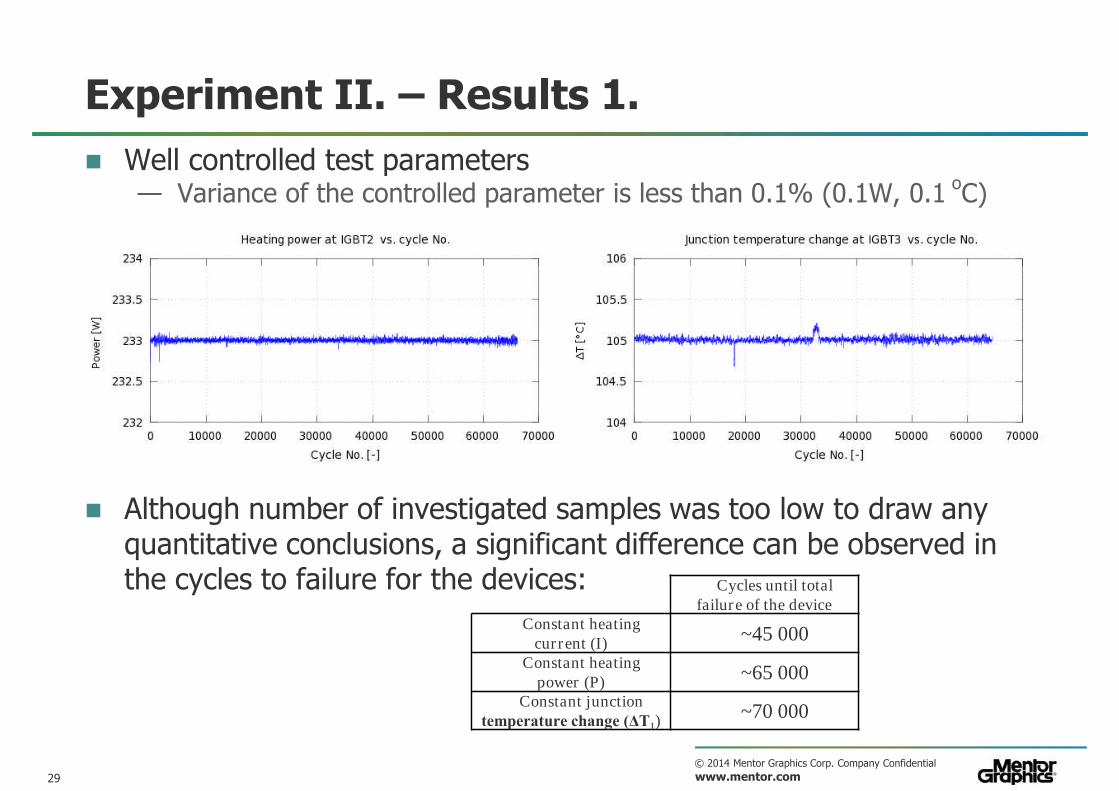
Experiment II. – Results 1.
Well controlled test parameters— Variance of the controlled parameter is less than 0.1% (0.1W, 0.1
oC)
Although number of investigated samples was too low to draw anyquantitative conclusions, a significant difference can be observed inthe cycles to failure for the devices: Cycles until total
failure of the deviceConstant heating
current (I)~45 000
Constant heatingpower (P)
~65 000
Constant junctiontemperature change (ΔTJ)
~70 000
29

© 2014 Mentor Graphics Corp. Company Confidential
www.mentor.com
Experiment II. – Results 2.
No sign of degradation in the heat flow path – variation of Rth is below 0.5%
Steep sections can be seen in the forward voltage of the diode at high currentlevel - these steps are indicative of bond wire damage/breakage
30

© 2014 Mentor Graphics Corp. Company Confidential
www.mentor.com
Introducing the Industry-Unique MicReDIndustrial Power Tester 1500A
31

© 2014 Mentor Graphics Corp. Company Confidential
www.mentor.com
Introducing the Industry-Unique MicReDIndustrial Power Tester 1500A
Industrial implementation of Mentor’sindustry-unique MicReD T3Ster technology
Provides fully automated power testing /cycling
Simple touch-screen user interface
For MOSFET, IGBT and generic two-poledevices – up to 3 simultaneously
Records diagnostic information during test:— Current, voltage and die temperature sensing— “Structure Function” identifies changes /
failures in package structure
Supports package development, reliabilitytesting, and batch checking of incoming partsbefore production
Touch Screen Controls
Structure Function
Power Tester 1500A
32

© 2014 Mentor Graphics Corp. Company Confidential
www.mentor.com
Industry-Unique MicReD Industrial PowerTester 1500A
A simple process:— Connect devices— Set up device and cycling project— Run power cycles— “Structure Function” shows failure in
progress— Process is complete
The MicReD Industrial Power Tester 1500A:— Leverages MicReD’s industry-proven T3Ster
technology– Laboratory-precision accuracy
— Shortens total testing time up to 10x— Unique Structure Function diagnoses
degradation and causes of failure in “real time”— Enables multiple sample testing— Touch-screen interface enables quick setup and
use by both specialists and productionpersonnel
33

© 2014 Mentor Graphics Corp. Company Confidential
www.mentor.com