reliability thermal management - sandia...
TRANSCRIPT

Photos placed in horizontal position with even amount of white space
between photos and header
Sandia National Laboratories is a multi-program laboratory managed and operated by Sandia Corporation, a wholly owned subsidiary of Lockheed Martin Corporation, for the U.S. Department of Energy’s National Nuclear Security Administration under contract DE-AC04-94AL85000. SAND NO. 2011-XXXXP
Reliability Thermal Management Kenneth M. Armijo

Overview Heat Transfer & Thermal Management
Modes for Electronic Design: Conduction, Convection & Radiation
Inverter Thermal Considerations Thermally Sensitive Electronics
Passive vs. Active Cooling Solar Gain & Thermal Gain
Shading & Topology Temperature Sensing & Controls
Derates & Aging/Failure Modes
2
Natural Convection
(Incropera and Dewitt, 2002)

Accelerated Testing Thermal cycling
Determines the ability of parts to resist extremely low and high temperatures, as well as their ability to withstand cyclical extremes. Stress resulting from cyclical thermo-mechanical loading accelerates fatigue failures.
Humidity Freeze This test serves as a mechanical strength test to ensure the reliability of a
device/system from failure due to stress and water ingress
High Temperature Operating Bias (HTOB) It consists of subjecting the parts to a specified bias or electrical stressing, for a
specified amount of time, and at a specified high temperature.
3

Thermal Design Considerations Critical Thermal Management Components
IGBT’s/MOSFET’s (Flicker et. al, 2012)
Latch-Up Bond Lift-Off
Capacitors
Direct Active Cooling Issues Dust, Salt Build-Up and Fouling
Conjugate Heat Transfer Derate Operation
4
(Saddik, 2013)
(http://www.sma.de) (Saddik, 2013)

Power Electronics Greater Number of Layers Increases Rth with
Standard Configurations Capable of Thermal Dissipation Densities Up to 250-300 W/cm2
Power Cycling Degradation Impacts Material Degradation and Micro-Fracturing
CTE Mismatch Impacts
5
(Leslie et. al., 2013)

6
Current Work Evaluating Heat Transfer Capability of Binary Mixture Working Fluids to Improve Heat Exchanger Performance Propylene-Glycol (PPG)/Water Ethanol/Water Pure Components
Alternative Adhesives Durability/ Performance Evaluation
Heat Exchanger Cooling Plate
At 101Pa

Equilibrium Phase Diagrams for Binary Mixtures For low-concentration binary mixtures, Marangoni Effect potentially and likely
responsible for Increased Temperature and Heat transfer at low alcohol, x1 concentrations (Armijo & Carey, 2010, 2012 & 2013).
Marangoni Effect (Previous Slide): Mass transfer due to mixture surface tension & concentration gradients. High surface tension fluids pull more strongly than those with lower surface tension
More volatile alcohols have lower surface tension than water. Region with lower alcohol concentration (greater surface tension) will pull on
surrounding fluid more strongly than a region with higher alcohol concentration (lower surface tension).
Preferential evaporation of the more volatile component occurs at the thinner, higher surface-tension l-v interface facilitating fluid motion over a heated surface.
Ex. Of low-conc alcohol/water Mixture Boiling
Equilibrium Phases of Mixtures

Heat Transfer & Boiling Boiling Curve of a Fluid - A transition diagram depicting the different
phases of heat transfer as bubble nucleation increases with superheat Provides the phase-change processes of heat transfer from a heat surface (or
wall, “w”) and a liquid (“sat”), for a given heat flux q”. The Critical Heat Flux (CHF) condition is the point where dryout occurs, whereby
the heat surface begins to be severely covered by vapor and heat transfer becomes exceedingly limited.
Superheat ≡ The temperature gradient between the heated wall temperature and the saturation temperature of the bulk fluid
q” ≡ the heat flux that passes between the heated surface and the bulk fluid

Flow Heat Transfer Modeling • V.P. Carey (2008) as there are no direct heat transfer correlations for flow
boiling at varying mixture concentration 𝑞𝑞𝑡𝑡𝑡 = 𝑞𝑞𝑁𝑁 + 𝑞𝑞𝐶𝑁Liquid-vapor phase change analytical mixture models
• PPG/Water Mixtures E.V. McAssey & S.G. Kandlikar [2000]
Volatility Parameter: A relative measure of Mass Diffusion: Total Heat Transfer Coeff: 𝛼𝑡𝑡𝑡 = 𝛼𝑁𝑁2 + 𝛼𝐶𝑁2 1 2⁄ 𝑞𝑞 = 𝛼𝛼Δ𝑇
Heat Transfer Coeff.: 𝛼𝐶𝑁 = 1.136𝐶𝐶−0.9 1 − 𝑥1 0.8𝛼𝑙 + 667.2𝐵𝐶0.7 1 − 𝑥1 0.8𝐹𝐷,𝑙𝛼𝑙
Mass Diffusion factor: 𝐹𝐷 = 0.678 1 + 𝐶𝑝,𝑙
Δℎ𝑙𝑙
𝜅𝐷12
1 2⁄𝑥1,𝑠 − 𝑦1,𝑠
𝑑𝑑𝑑𝑑1
−1
Convection Number: 𝐶𝐶 = 𝜌𝑣 𝜌𝑙⁄ 0.5 1 − 𝑥1 𝑥1⁄ 0.8
Bond Number: 𝐵𝐶 = 𝑔 𝜌𝑙−𝜌𝑙 𝑑𝑑2
𝜎
• Ethanol/Water Mixtures General Correlation b 𝑞𝑞𝑁𝑁 = 𝛼𝑙 𝑇𝑤 − 𝑇𝑙 ,
𝑞𝑞𝐶𝑁 = 𝜇𝑙ℎ𝑙𝑣𝑔 𝜌𝑙−𝜌𝑙
𝜎
1 2⁄𝑃𝑃𝑙
−𝑠 𝑟⁄ 𝐶𝑝,𝑙 𝑑𝑤−𝑑𝑠𝑠𝑠 𝑃𝑙𝐶𝑠𝑠ℎ𝑙𝑙
1 𝑟⁄

Literature Work on Flow Boiling
(Propylene Glycol/Water) • S.M. Bajorek & S. Schnelle (2001)
A mixture concentration of x1=0.3 (through a smooth tube) had the lowest surface temperatures and higher surface heat flux results
Further experimentation found the lowest mixture superheat for a mixture conc. of x1=0.227 through a smooth tube o However, large conc. also found low superheat values, up to a concentration of x1 = 0.77
However, data suggests the heat transfer coefficient, α could increase further with decreasing x1 beyond x1=0.3.
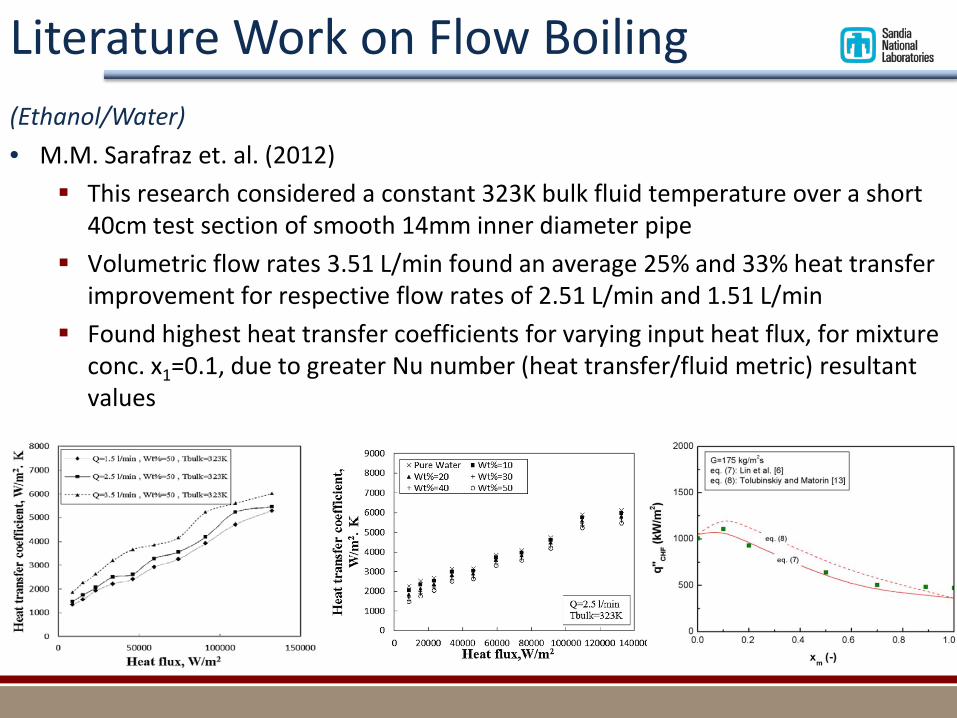
Literature Work on Flow Boiling (Ethanol/Water) • M.M. Sarafraz et. al. (2012)
This research considered a constant 323K bulk fluid temperature over a short 40cm test section of smooth 14mm inner diameter pipe
Volumetric flow rates 3.51 L/min found an average 25% and 33% heat transfer improvement for respective flow rates of 2.51 L/min and 1.51 L/min
Found highest heat transfer coefficients for varying input heat flux, for mixture conc. x1=0.1, due to greater Nu number (heat transfer/fluid metric) resultant values

Rifled Tubing vs. Smooth Tubing To improve the heat transfer rate from the heated wall to the flowing bulk
fluid, rifled tubing designs have demonstrated increased turbulence. S.M. Bajorek and J. Schnelle (2002):
The increased internal surface area was found to improve the heat transfer coefficient as the convection effective area (Nu number) was greater than that of a smooth tube.
For an PPG/water, x1=0.3 concentration an approximate 39% heat transfer coefficient improvement was observed using the Turbo Bill over a smooth pipe

Solar Gain & Thermal Gain
Thermal gain from solar radiation in an object, space or structure, which increases with the strength of the sun, and with the ability of any intervening material to transmit or resist radiation.
FEA/CFD Impact Analysis of Internal Comps.
Radiative Energy Balance:

Spatial Site Data Analysis Nearest Neighbor interpolation algorithms – Adapted from Sibon [1981]

Normalized Parametric Analysis – Adapted from Haeberlin and Beutler [1995], was adapted based on IEC standard 61724 [1998]
Performance Ratios

Parameters Being Implemented in Analysis
• Environmental Param’s and Inverter Temperatures • Cabinet Temperature • Line Reactor Temperature • Inverter Ambient Temperature • Ambient Pressure • POA and Horiz. Pyranometer Irradiance • Wind Velocity • Wind Direction
• Inverter Performance • VARS • Ground Current • DC Bus Voltage
• Performance Ratio’s • (DC/AC) / Irradiance • (DC/AC) / Cabinet Temp. • Coolant Temp. / Irrandiance • Line Reactor Temp. / Irradiance • Coolant Temp. / AC Power • Coolant Temp. / DC Power
• Other Analysis I am Considering • Gradient Analysis: 1. Across the Site, 2. Across the Skid • Skid-Level Solar Gain/Thermal Gain Analysis, wrt. To Transformer • Inverter Ambient Temperature • Analysis performed 3 Days prior to failures • Parametric Analysis of Cloudy vs. Clear Day and vs. Season: (Spring, Summer, Fall, Winter) • Performance Ratio: AC / POA Insolation
Haeberlin and Beutler [1995] Analytical Parameters
𝐶𝐶𝐶𝐶𝐶𝐶𝐶𝐶𝐶𝐶 𝐸𝐸𝐶𝑃𝐸𝑦 𝐿𝐶𝐿𝐿 = 𝐷𝐶𝑃𝑡𝑤𝑃𝑃 − 𝛼𝐶𝑃𝑡𝑤𝑃𝑃# 𝑂𝑂𝐶𝑃𝐶𝐶𝐶𝐸𝐸 𝐷𝐶𝑦𝐿

Transient Thermal Lag
Transient Time Lag (Avg. ~3.5 minute)
96 Hr. Day
Transient time variation accounting with measurements that vary differently with time Moving average algorithm based on Spearman “Best-fit” correlation coefficient [1973] FEA Analysis will later be implemented for more accurate Time Factor Correction
A transient thermal lag was found between peaks of irradiance and respective external inverter ambient temperatures. The time lag was not consistent for all inverter failure dates and prior 3-Day data, across all blocks
and skids.

Shading Studies Shading variations, due either to clouds, soiling, etc., can influence
DC power spikes which can have failure implications on inverters Performance studies will include:
Shading magnitude
Shading patterns – Shading coverage factor: 𝑆 = %𝐴𝑆𝑆𝑠𝑑𝑆𝑑𝐴𝑇𝑇𝑠𝑠𝑙
Cloud lensing and ramp rate evaluation

Thermal Arc-Fault Research Arc-fault events arise due to PV cabling degradation & other reliability issues. Investigate arc-faults with arcing power in the 50-150 W range to determine the potential
for low power arcs to establish fires and to determine appropriate AFCI trip times for these arcs.
Analysis was performed with experimental tests and numerical simulations of arc-faults in close proximity to three polymer materials common in PV systems, e.g., nylon, PET, and polycarbonate.
19
Photos placed in horizontal position with even amount
of white space between photos
and header
Photos placed in horizontal position with even amount of white space
between photos and header
Sandia National Laboratories is a multi-program laboratory managed and operated by Sandia Corporation, a wholly owned subsidiary of Lockheed Martin Corporation, for the U.S. Department of Energy’s National Nuclear Security Administration under contract DE-AC04-94AL85000. SAND No. 2011–XXXXP.
20
Thank You

Extra Slides
21

• In general, to determine the onset of any bubble nucleation (micro boiling), system thermodynamic conditions must allow for the critical radius of a bubble to be reached, where a bubble’s interface will be stable enough not to collapse or burst, within the respective bounds prescribed by the following equation by Carey (2010):
• The radius of curvature (shown graphically in Fig. 1) of a nucleated bubble, rc is determined from
thermodynamic properties of the heated wall surface, “w” and bulk fluid conditions within the bounds of the thermal boundary layer (denoted by “sat”), with the liquid and vapor states denoted by “l” and “v” respectively, and the subscript “fluid” refers to thermodynamic conditions that satisfy y> δt
𝑃𝑐, 𝑚𝑚𝑚𝑃𝑐, 𝑚𝑚𝑑
=𝛿𝑡4
1 −𝜃𝑠𝑚𝑡𝜃𝑤
+− 1 −
𝜃𝑠𝑚𝑡𝜃𝑤
2
−12.8𝜎𝑇𝑠𝑚𝑡 𝑃𝑙𝜌𝑣ℎ𝑙𝑣𝛿𝑡𝜃𝑤
where: δt ≡ Thermal Boundary Layer Thickness, θw ≡ Tw-Tbulk, θsat ≡ Tsat-Tbulk , σ ≡ Surface Tension, ρ ≡ Density, hlv ≡ Latent Heat, P ≡ Pressure, T ≡ Temperature
2𝑃𝑐𝛿𝑡 𝑚𝑚𝑚
≤2𝑃𝑐𝛿𝑡
≤2𝑃𝑐𝛿𝑡 𝑚𝑚𝑑
(Fig. 1):
Criteria for the Onset of Boiling

• To use the analytical models, thermodynamic properties for the mixture have to be determined, which need to be developed for these particular mixtures:
• Binary Mixture Properties Activity Coefficients, α provide a metric for assessing a properties departure from an ideal
mixture, or one that does not have linearly-varying properties. o Currently using ideal mixture properties where the activity coefficient: γ=1 for computing
thermodynamic properties
• Current Work: Accurate Novel Saturation Pressure/Temperature Property Correlation Development Propylene Glycol/Water Binary Mixture
o Margules Method/Wilson Method of Activity Coefficient Determination
o Method by A.C. Compostizo et. al. (2001) o P* ≡ Spinodal Temp, γ ≡ surface tension, κ ≡ isothermal compressibility factor, V ≡ Molar Volume
𝑃𝑡𝑡𝑡 = 𝑥1𝛼1𝑃1 + 𝑥2𝛼2𝑃2
ln𝛼𝑘
Ex. For Saturation Pressure:
Thermodynamic Properties

• For PPG/Water mixtures, heat transfer experimentation has been conducted for limited mixture concentrations and system pressures.
• E.V. McAssey & S.G. Kandlikar (2000) Low surface heat flux variation between various mixture concentrations was found for for wall temps lower
than 150°C. For single (liquid only) phase fluids: Investigators used x1=0.5, and found little heat transfer coeff. Variation at
low system pressures Slightly larger superheat values were found for significant increases in mass flow, however the inlet
temperatures were higher than that of the current AE heat exchanger system Model predictions had superheat inaccuracies of approximately ~40% were found at the higher tested system
pressure of 205kPa, versus ~18% for the lower 129kPa system pressure.
Flow Boiling Literature

• For Ethanol/Water mixtures, heat transfer experimentation has been conducted for limited mixture concentrations and system pressures.
• B.R. Fu et. al. (2012) Increasing CHF values were found for increasing mass flow rates The highest critical heat flux was found for a low ethanol/water concentration of x1=0.1
o Subsequent research found the highest Ma number, and the highest heat transfer coefficient, for a mixture concentration of x1=0.1
Boiling hysteresis was observed in heat transfer coefficient experimentation, whereby delayed boiling occurred
Literature Work on Flow Boiling (Ethanol/Water)

Tube Turbo Bill Literature Results (w/ Propylene-Glycol/Water)
• S.M. Bajorek & S. Schnelle (2001)

Tube Turbo Bill Literature Results (w/ Propylene-Glycol/Water)
• S.M. Bajorek & S. Schnelle (2001)

Tube Turbo Bill – Other Mixtures • Despite lower α values for lower PPG/water concentration ratios using the Turbo Bill design,
ethylene-glycol/water mixtures, studied by S.M. Bajorek and j. Schnelle (2002), found heat transfer improvement over their respective smooth tube tests for concentrations greater than x1 = 0.2.
• This study however did not evaluate ethanol/water mixtures, and to date little literature evidence suggests that any exists for this binary mixture.

29
(Smet et. al., 2011) JED ____


Accelerated Testing HALT – Highly Accelerated Life Testing Stress tests not meant to simulate the field environment, but find weaknesses in design Stresses are stepped up to well beyond the expected field environment until “fundamental limit of the technology” is reached General Procedures for HALT Testing:
1. Attach thermocouples, & monitor line input Vac, output Vdc, and other signals. 2. Perform temperature cycling 3. Perform functional test 4. Determine root cause of any failures, implement corrective action (if required), and repeat test
(if required).
32