remedial action report: record of preparation, review, …. ii. operable unit background a record of...
TRANSCRIPT

Remedial Action Report
Record of Preparation, Review, and Approval
Harbor Island Superfund Site
Lockheed Shipyard Sediment Operable Unit
Excavation and Containment of Contaminated Sediments
This report has been prepared in accordance with EPA OSWER Directive 9320.2-09Aand will be used, along with the Construction Completion Report, as a basis for thisreport.
RA ReportPrepared
By:Signature
Name/Title
Date
ApprovedBy:
Signature
Name/Title
Date y z-J

REMEDIAL ACTION REPORT
LOCKHEED SHUIPYARD SEDIMENT OPERABLE UNITHARBOR ISLAND SUPERFUND SITE
SEATTLE WASHINGTON
EPA CERCLIS ID NUMBER
I. Introduction
Harbor Island is located approximately one mile southwest of downtown Seattle, in KingCounty, Washington, and lies at the mouth of the Duwamish River on the southern edgeof Elliott Bay (see Location Map - Figure 1). The island is man-made and has been usedfor industrial purposes since about 1912. The island is approximately 430 acres in sizeand is bordered by the East Waterway and West Waterway of the Duwamish River andby Elliott Bay to the north. Major features of Harbor Island, including the locations of theTodd and Lockheed shipyards, are shown in the Vicinity Map, Figure 2.
Prior to 1885, the area that is currently Harbor Island consisted of tideflats and a rivermouth delta with some piling-supported structures. Initial construction of the island -began between 1903 and 1905 when dredging of the East and West waterways and themain navigational channel of the Duwamish River occurred. Dredged sediment wasspread across the present island area to form a fill 5 to 15 feet thick. This dredgedsediment was later covered with soil and demolition debris from Seattle regrade projects.
Since its construction, the island has been used for commercial and industrial activities.Major activities have included ocean and rail transport operations, bulk petroleumstorage and transfer, a secondary lead smelter, metal fabrication, and shipbuilding andrepair. Warehouses, laboratories, and office buildings also have been located on theisland. The Harbor Island Superfund Site was listed on the National Priorities List (NPL)in 1983, due to the release of lead from a secondary lead smelter on the island, as wellas the release of other hazardous substances from other industrial operations on theisland.
The Harbor Island Superfund Site is divided into seven operable units: (1) the petroleumstorage tank facilities operable unit (OU), (2) the Soil/Groundwater OU, (3) the LockheedShipyard OU, (4) the Lockheed Shipyard Sediment Operable Unit (LSSOU)1, (5) theTodd Shipyard Sediments Operable Unit (TSSOU), (6) the East Waterway SedimentOU, and (7) the West Waterway Sediment OU. The Lockheed Shipyard SedimentOperable Unit (LSSOU) includes nearshore sediments at Lockheed Shipyard out to theedge of the steep slope of the West Waterway, which occurs at approximately the minus
At the time of the ROD, Todd and Lockheed Shipyard Sediment Operable Units were part of the ShipyardsSediments Operable Unit (SSOU). EPA created the Lockheed and Todd Shipyard Sediment Operable Units from theSSOU because they have different remedial issues that are better addressed as separate OUs.

Vicinity Map
0 2000SSSSSSSS^Scale in Feet
4000
HAKTCROWSER7852-01
Figure 7=6
10/03FDAR

Vicinity Map Harbor IslandSediment Operable Unit
Todd ShipyardSediment Operable Unit-
^— Tank FarmOperable Unit
Lockheed Shipbuilding andConstruction Yard No. 1
Lockheed ShipyardNo. 1 SedimentOperable Unit
3000
Scale in Feet
IN>
CO
to00
6000
0 2500
Scale in Feet
5000
Note: Base map prepared from USGS 7.5 minute quadrangle map ofSeattle South, Washington, dated 1973.
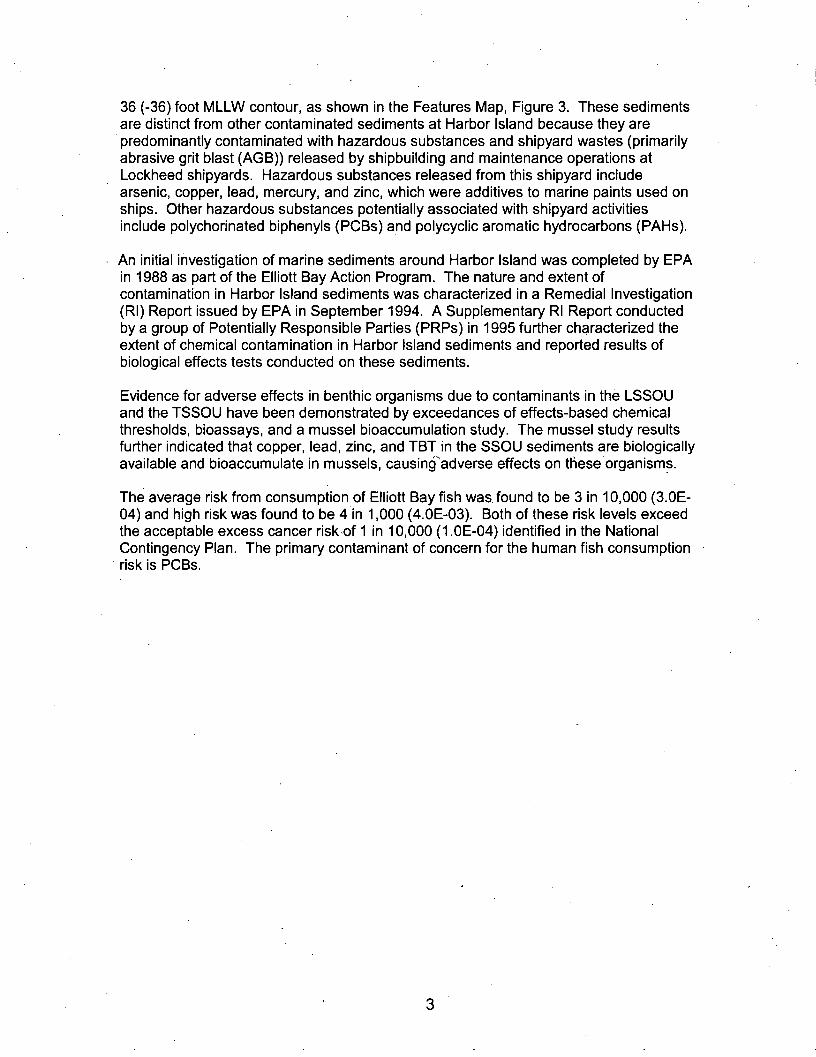
36 (-36) foot MLLW contour, as shown in the Features Map, Figure 3. These sedimentsare distinct from other contaminated sediments at Harbor Island because they arepredominantly contaminated with hazardous substances and shipyard wastes (primarilyabrasive grit blast (AGB)) released by shipbuilding and maintenance operations atLockheed shipyards. Hazardous substances released from this shipyard includearsenic, copper, lead, mercury, and zinc, which were additives to marine paints used onships. Other hazardous substances potentially associated with shipyard activitiesinclude polychorinated biphenyls (PCBs) and polycyclic aromatic hydrocarbons (PAHs).
An initial investigation of marine sediments around Harbor Island was completed by EPAin 1988 as part of the Elliott Bay Action Program. The nature and extent ofcontamination in Harbor Island sediments was characterized in a Remedial Investigation(Rl) Report issued by EPA in September 1994. A Supplementary Rl Report conductedby a group of Potentially Responsible Parties (PRPs) in 1995 further characterized theextent of chemical contamination in Harbor Island sediments and reported results ofbiological effects tests conducted on these sediments.
Evidence for adverse effects in benthic organisms due to contaminants in the LSSOUand the TSSOU have been demonstrated by exceedances of effects-based chemicalthresholds, bioassays, and a mussel bioaccumulation study. The mussel study resultsfurther indicated that copper, lead, zinc, and TBT in the SSOU sediments are biologicallyavailable and bioaccumulate in mussels, causincfadverse effects on these organisms.
The average risk from consumption of Elliott Bay fish was found to be 3 in 10,000 (3.0E-04) and high risk was found to be 4 in 1,000 (4.0E-03). Both of these risk levels exceedthe acceptable excess cancer risk of 1 in 10,000 (1.0E-04) identified in the NationalContingency Plan. The primary contaminant of concern for the human fish consumptionrisk is PCBs.

Site Features Map
WESTDUWAMISH WATERWAY
PIER 11
Atlantic RichfieldCompany
Note:1. Base map prepared from drawing provided by Hartman Consulting Corp. titled "Lockheed
Yard", dated September 2,1997.2. Piling information based on drawing by Foster Wheeler Environmental Corporation W"Piling Information" dated February 25, 1998.3. Contours are shown relative to MLLW, Port of Seattle Datum.
0 120
EScale in Feet
240
Not to Scale
Outer LSSOU Boundary(-36 Feet MLLW)
MHHW (11.35 Feet MLLW)
Approximate Location of Property Line
Bulkhead
Pierhead Line
Inner Harbor Line
Top of Bank
- Upland Areas Requiring Long-Term CapMonitoring and Maintenance (ICF Kaiser 1995)
Pier or Shipway Structure
Approximate Pile Locations
Approximate Location of Rail Spur
HAKTCROWSER7852-01
3
10/03
FDAR

II. Operable Unit Background
A Record of Decision for the Lockheed shipyard sediments and the Todd shipyardsediments was issued in November 1996. The chemicals of concern (COCs) for thesediments at each shipyard included arsenic, copper, lead, mercury, zinc,polychlorinated biphenyls, total low molecular weight polynuclear aromatichydrocarbons, total high weight heavy polynuclear aromatic hydrocarbons and tributyltin.An Adminstrative Order on Consent (AOC) for Remedial Design was approved on July16, 1997. Later, two Explanation of Significant Differences (ESDs) for the LSSOU wereissued in February 2002 and March 2003, respectively, to amend the ROD.
The remedy described in the ROD for the LSSOU included:
(1) dredging to remove shipyard waste and contaminated sediments exceedingthe cleanup screening level (CSL) of the State of Washington SedimentManagement Standards (SMS);(2) capping contaminated sediments exceeding the sediment quality standards(SOS) of the SMS;(3) identification of acceptable disposal options;(4) specification of design criteria for acceptable habitat and to prevent futurerecontamination; and(5) institution of long-term monitoring and maintenance of the remedy.
The ROD also identified eight remedial design objectives which are to:
(1) identify sediment contamination exceeding the CSL and SQS;(2) conduct confirmatory biological effects tests (optional);(3) characterize dredged sediments;(4) evaluate armoring of any caps;(5) conduct habitat inventory;(6) evaluate potential disposal sites;(7) evaluate physical separation technologies for shipyard waste; and(8) determine the extent of dredging under-pier sediments.
Additionally, the ROD notes that "(t)he extent of dredging of contaminated sedimentsand waste under piers at.... Lockheed Shipyard will be determined during remedialdesign based on cost, benefit and technical feasibility."
Subsequent to the ROD, pre-remedial design studies for the Lockheed ShipyardSediment Operable Unit have better defined the nature and extent of contamination.This sediment characterization has been further used by EPA to determine the mosttechnically feasible, cost-effective approach for implementing the dredge and capremedy. During this pre-remedial design phase, EPA has also developed definitions for"shipyard waste", including definitions for AGB and shipyard debris. The more detaileddescription of the remedy and associated definitions were documented in an ESD, datedFebruary 12, 2002.
Specifically, the ESD required the following remedial action:
1. In the Slope Area of the LSSOU (referred to as the under-pier, shipway, andenclosed areas in the ESD):

(a) remove the shipway pier and decking; remove or modify pilings tothe maximum extent practicable so as not to compromise thestability of the existing bulkhead or existing slope but to permit dredgingand capping as defined below;(b) remove any shipyard debris that will impede dredging activities orcompromise the integrity of the cap to be placed in these areas;(c) dredge AGB to a sufficient depth to accommodate the cap withoutany loss of the present water column;(d) dredge all sediments exceeding CSL to a depth sufficient depthto accommodate the cap without any loss of the present water column;(e) cover all sediments exceeding SQS with a cap that shall physicallyand chemically contain and confine contaminants of concern; and(f) dispose of contaminated dredged material at an appropriate uplandlandfill.
2. In the Channel Area of the LSSOU (referred to as the open-water areas inthe ESD):
(a) remove any shipyard debris that will impede dredging activities orcompromise the integrity of the cap to be placed in these areas;(b) dredge all sediments exceeding SQS; and(c) dispose of contaminated dredged material at an appropriate uplandlandfill.
A second ESD was issued on March 2, 2003. The primary purpose of the second ESDwas to establish West Waterway confirmational numbers (WWCN) for some of theCOCs. See Table 1 for the WWCN by selected COCs. These numbers were used todistinguish contaminants characteristic of the West Waterway from contaminationassociated shipyard operations at the point where the two operable units (OUs) met andcould also be used in determining potential future recontamination. See Appendix A foran explanation of how these numbers were developed and were to be used. TheWWCNs will be referred to henceforth as the West Waterway 90th percentile numbers(WW90N).

Table 1 -- West Waterway Confirmational Numbers
> > West
Contaminant
...
RGBs ...-.
Tributyltin ___..., ._~
Mercury "-; .:-: -
Waterway Confirmational Numbers for Certain: : Chemicals ofXipncern : - 4 : •
SQS (mg/kg)
12 toe
not available
0.41 dw
CSL (mg/kg)
65 toe
not available
0.59 dw
ConfirmationalNumber
39 (mg/kg) toe591 ug/kg dw
76 (mg/kg) toe1 335 ug/kg dw
1.34 (mg/kg) dw

III. Design Activities
In an Administrative Order on Consent (AOC) signed with EPA on July 16, 1997,Lockheed Martin agreed to perform the remedial design (RD) for implementing theremedy in conformance with the ROD as modified by the two ESDs. The RD wasapproved in parts. The RD for:
demolition was approved on July 2, 2003First season dredging and capping was approved on October 25, 2003Second season dredging, capping and habitat enhancement on May 25,2004.
To meet objectives of the ESD, the following criteria were utilized in the remedial designfortheLSSOU:
• Replace the existing deteriorated bulkhead wall so the upland soils will remainstable during and after remedial activities, including the following:
- Pier and timber bulkhead removal; and- Dredging adjacent to the bulkhead.
• Remove all existing pier structures including timber piling and portions of theexisting shipway structures from aquatic areas of the site while maintaining thestability of the site.• Dredge contaminated sediments from the channel and slope areas of theLSSOU while maintaining stable slopes and critical habitat elevations:
- Design the dredge prisms and constructed slopes such that they will beconstructible;- In the Channel Area, remove the depth of sediment exceeding SQScriteria and construct a berm to support the Slope Area and maintaincritical habitat elevation;- Perform post-dredge sediment verification sampling and analysis toconfirm achievement of SQS in the Channel Area; and- In the Slope Area, limit changes in the post-remediation of critical habitatelevations (i.e , between -4 to 8 feet MLLW) from that of the existingcondition while accommodating a 5-foot-thick cap.
• Construct an on-site mitigation area:- Habitat losses resulting from the partial filling of the South Shipway willbe mitigated by creation of intertidal habitat by excavation of the uplandportion of Pier 10.
• Cap the Slope Area such that the cap will provide the following:- Isolation of the underlying contaminated sediments;- Protection of the isolation portion of the cap from bioturbation anderosional forces; and- A final cap surface that is habitat compatible.
IV. Construction Activities
A Consent Decree for remedial action was approved on July 23, 2003. Remedial Actionwas implemented in two phases. Phase 1 was completed on March 10, 2004 andPhase 2 was completed on February 4, 2005. The first phase of remedial constructionefforts were focused on pier demolition and dredging of contaminated sediments. Thesecond phase consisted of dredging contaminated sediments, capping and habitatenhancement.
PHASE IMobilization. Site mobilization began in early July 2003 with installation of temporaryfencing, construction trailers, and associated infrastructure. Stockpile areas for treatedwood debris from demolition were constructed. Debris booms were placed in the waterto contain floating debris.
Demolition. Demolition began on July 18, 2003. All pier and shipway decking wasremoved concurrently with the removal of pilings using a vibratory hammer attached to acrane mounted on a barge or a crawler crane equipped with a vibratory hammer workingfrom the shore to remove nearshore piling.
Wood debris was either placed on a barge which was unloaded on site into a stockpilearea or transported by land-based equipment to the stockpile. In the stockpile, thedebris was crushed to the maximum allowed size for eventual transportation via 48-footsteel containers to the Waste Management landfill in Arlington, Oregon.
Visual monitoring of water quality was conducted during demolition and sheet-pilebulkhead construction.
Demolition was essentially completed in 14 weeks. The debris stockpile area wasdismantled the following week.
Bulkhead Construction. Construction of the sheet-pile bulkhead began immediatelybegan immediately after demolition. Typically, demolition of the existing bulkhead wascompleted just ahead of the sheet-pile installation crew. Finishing the new sheet-pilebulkhead included forming and pouring a steel-reinforced concrete pile cap, which oftentook place well after the steel sheets were driven. All bulkhead construction work wascompleted in 22 weeks. Monitoring the new bulkhead for movement was conducted bysurveys and no significant movement was detected.
Contingency Area Sampling. Sediment sampling was conducted along the perimeterof the OU to ensure that the OU boundaries were adequately defined. The samplingwas accomplished on November 24 and 25, 2003. Based on the results of thesampling, EPA determined that the OU boundaries adequately defined the extent ofcontamination associated with the LSSOU.
First Season Dredging. Prior to beginning dredging, an uplands facility for offloadingdredged sediment from materials barges, stockpiling it to promote dewatering, andloading the sediment on to rail cars (gondolas) was constructed. The following weekexcavation of sediments in the beach areas commenced using standard uplandearthwork equipment/This work was done at low tides. Dredged (excavated) debris and
8
sediments were transported by truck to the dewatering and stockpile area in the formerSouth Shipway. These materials were transported and loaded into the gondolas usingfront-end loaders. Dredging using upland equipment continued periodically. Dredgingwas undertaken using a shallow to deep pattern in order to capture any material thatwould become unstable and slide down the slope.
The presence of hard material, debris, and broken off or buried piling made the use of aclosed environmental bucket infeasible. A 3.5-cubic-yard digging bucket was thereforeused. Upland separation was used to segregate much of the debris from the sedimentwaste stream. The debris became a separate waste stream which was shipped out bytruck. The degree to which the sediments would dewater varied over the course of theproject and was impacted by rainfall. On some occasions the dredged materials werevery dark and granular and dewatered well. However, in many cases the sedimentswere finer-grained and did not dewater enough to allow effective handling and shipping.In those instances, diatomaceous earth was added directly to the gondolas to controlwater.
On January 29, 2004, sediment grab samples were taken in accordance with the FieldSampling Plan in three of the 17 sediment management units (SMUs) in the OpenChannel Area. Observations were made of redeposited material in the grab samplesand exceedances of many of the COCs at levels of up to five times the SOS wheremeasured. Based on these unfavorable initial results, additional samples were obtainedon February 6 and 11 using shallow core tubes to better understand the initial failure tomeet SOS. Both redeposited material from dredging and in-place material that was ofshipyard origin proved to have elevated levels of specific COCs compared to therequired SQS for the COCs. Consequently, the Open Channel Area did not meet therequirements of the ROD and ESDs and further dredging during the second dredgeseason was required.
Table 3 summarizes the total tons of material disposed as a result of demolition anddredging activities. Approximately 74,000 tons of the 1197,064 total tons disposed werefrom dredged sediments and debris only.
.Hydrographic single-beam and multibeam surveys were conducted before, during, andfollowing dredging. These surveys documented the volume of material removed,provided a general idea of the depth of the interim cap and served as the basis foradditional dredge design in the second construction season.
Interim Cap. Following the termination of dredging, a thin layer (approximately 4inches) of coarse sand was placed over the entire LSSOU. This material amounted toapproximately 8,290 tons. The material was intended to limit any movement ofcontaminated fine materials as well as to protect marine life from any harm due toexposure to COCs until dredging could resume after the end of the in-water work closurewindow. Work window closures define the construction season for in-water work andgenerally preclude work from February 15 to August 15, depending on the area andnature of construction. A diver survey was conducted to document the thickness andcoverage of the interim cap. Overall coverage from 2 to over 4 inches of interim cap wasconfirmed. Cap materials were sampled for chemistry to assure they would notcontribute to any COCs as well as for grain size. Any work conducted after February 14was subject to a requirement that the LSSOU be periodically checked for the presenceof protected juvenile salmon using approved beach-seining methods. In the event more

than a certain number of protected fish were observed, all in-water work would bestopped. A few protected species were observed and no interruption to operations wasnecessary.
Focused Feasibility Study. Before, the start of the second season of dredging aFocused Feasibility Study was conducted to evaluate the dredging methodologies usedthe first dredging season and to evaluate other methodologies that could be used moresuccessfully during the second dredging season. Many options for second seasondredging in the Open Channel Area were evaluated and compared in the FocusedFeasibility Study. Alternative 3, Mechanical Dredging with Optional Enhanced NaturalRecovery (ENR), was recommended as the best remedial alternative. ENR is,the application of a relatively thin layer, usually approximately 10 cm. of sand or otherfine grained material to the top surface of a contaminated surface. ENR is anacceptable remedy when information shows that the top 10 cm of surface will meet theSQS within 10 years of application through bioturbation of the clean and contaminatedlayers. As additional sediment is deposited on the mixture through natural processes,the exposure to marine organisms is further reduced.
PHASE IISecond Season Dredging. To reduce to an absolute minimum the potential forredeposition of dredged materials, a three-step operational approach was adopted.First, any identified debris areas would be dredged to clear the debris using a standarddigging bucket. Second, an initial dredge pass using the same bucket would be madeover the entire operable unit to remove the bulk of the contaminated material and anyremaining debris, leaving behind a final layer less than one-foot thick. The final passwould use an environmental bucket to dredge the final, relatively thin layer and anyredeposited material from the initial debris clearing and first-pass dredging. The finalpass would be dredged to the native material because analytical data from coresindicated that contamination extended to native material and that the native material wasclean. At times, scrapping the top of the native material with the environmental bucketwas necessary to remove residual contaminated material left behind after the final pass.
The dredging contractor proceeded to dredge the first pass utilizing a 5-cubic yarddigging bucket. This operation took place in a southern to northern pattern with the firstpass beginning on October 19, 2004 and being completed on October 28, 2004. Thematerials were brought to the surface, held just above the surface in order to allow thewater to drain from the bucket, and placed in a materials barge equipped to dewater thesediments. The barge typically was filled within two to three days. It was left mooredover the work area to allow for farther drainage overnight. The following morning thebarge was towed over to Terminal 25 for unloading and shipment to an upland disposalfacility. Straw bales were placed around the open end of the barges to filter theescaping water from the sediments and a filter liner was installed on the inside perimeterwooden bulkhead. Any damage to the fabric was repaired immediately to ensurecontinuous compliance with the BMPs.
Water quality monitoring was accomplished through both visual observation and testingfor turbidity, temperature, dissolved oxygen, total suspended solids and COCs. Noexceedances of compliance criteria were noted throughout the operation.
Progress surveys were taken by the contracted survey group on October 20, 22, 25, 27,and 29. The primary purpose was not only to determine the depths being achieved but
10

also to determine whether any "sloughing" had occurred. In general, the depthsobserved during dredging were identical with those measured by the progress surveyand no significant sloughing was identified.
The second dredging pass utilized a 6-cubic-yard closed environment bucket and, onceagain, the work began at the southern end of the project and proceeded northward. Thiseffort began on October 30, 2004 and was initially completed on November 12, 2004.During Weeks 3 and 4, qualitative sediment sampling was conducted with a small grab-sampling device. The results indicated in nearly all cases that native materials wereencountered, indicating redeposition was not likely to be a problem.
At various times during the second-pass operations, sediment samples were taken usingcomposite cores to determine whether the second-pass dredging operations wereadequate in the removal of undesirable sediments. These progress samples were takenon November 4,10 and 11. It was determined from further analytical testing of individualprogress sample cores that several areas were in need of further dredging in order toreach the required SQS. These areas were targeted in consultation with the EPA anddredged to a predetermined depth based on results of cores, or refusal, which evercame first. Refusal was targeted as the underlying native sand which was clean (basedon analytical chemistry) and relatively hard, assuring a clean surface. This work tookplace on November 13, 16, 18, 19, and 21.
A final round of progress samples were taken using a van Veen grab sampler at variouslocations on November 22 to document the condition of the sediments following finaldredging in the targeted areas. The chemical results were analyzed. EPA made thedetermination that a best effort had been made to dredge to the SQS and that furtherdredging probably would not result in removing the material causing exceedances of theSQS in the few areas that it existed.
A total of eight sediment samples were collected from, the post-dredge surface of thechannel area (SMAs 1-7) to evaluate compliance with the design criteria. All analyticalresults were compared to the SQS chemical criteria to evaluate compliance. Out of 248chemical analytical results, from eight samples, three samples exceeded the SQS forPCBs only. Three other samples out of eight or 30 analytical results out of 248,exceeded the SQS for a combination of COCs. Therefore, a total of 33 of 243 analyticalresults failed the SQS. The following table summarizes the nature and locations ofexceedances and the corresponding remedial action.
Table 2 - Nature and Locations of Exceedances and the Corresponding RemedialAction
.-» • • - - — - :
-oampltng. - • _ - - • . • - •
- Locations :r-
SED-200
SED-201
SED-202
SED-203
- ~^f\^~f* !• ~ fl "A • ~"oUo Compliance criteria •... . ... ' . :_:. . :_-•:.. .-—:.::... - . . . - . . :-.,-
PCBs- 12 mg/kg toe
PCBs- 130 ug/kgdw
As - 57 mg/kg toeLPAH - 370 mg/kg toe
- A — •• Q • |£ —~ -•••-• ocuiipimy KesuitS' *-- : •-• -:-'-'•'-"• -•-••- • • • - = •
1 3 mg/kg toe
146. 5 ug/kgdw
no exceedances
As - 73.4 mg/kg toeLPAH- 1620 mg/kg toe
Kemeaiai_^ ......Decision
pass
ENR
pass
ENR
11

SED-204
SED-205
SED-206
SED-207
HPAH - 960 mg/kg toePCB - 12 mg/kg toe
As - 57 mg/kg toeCu - 370 mg/kg toeZn - 960 mg/kg toeHg - 0.41 mg/kg dwPCB - 12 mg/kg toe
PCB - 12 mg/kg toe
As - 57 mg/kg toeCu - 370 mg/kg toeZn - 960 mg/kg toeHg - 0.41 mg/kg dw
LPAH - 370 mg/kg toe
HPAH -1937 mg/kg toePCB - 21 mg/kg toe
As - 1 27 mg/kg toeCu - 829 mg/kg toeZn -585 mg/kg toe
Hg -0.618 mg/kg dwPCB - 20 mg/kg toe
no exceedances
PCB - 18 mg/kg toe
As - 1 39 mg/kg toeCu - 553 mg/kg toeZn- 91 2 mg/kg toeHg - 1.32 mg/kg dw
LPAH -1341 mg/kg toe
ENR
pass
pass
ENR
The remedial action for portions of the channel area, represented by samples SED 201,203, 204 and 207, that failed to meet the clean up numbers was the addition of 4 to 6inches of sand to the sediment surface, namely Enhanced Natural Recovery. Areaswhere there was an exceedance of PCBs only, no action was taken because theexceedances were minor and were below the 95th percentile WWCN for PCBs.
A final multibeam survey for the entire site was taken on November 22, which was usedas the baseline survey for the capping effort. Results indicated that targeted dredgedepths were met or exceeded. The final quantity of dredged sediment, soil and debrisdelivered to the two upland disposal facilities was 106,320.50 tons. Table 3 summarizesby material type and quantity all material disposed at upland disposal facilities.
Table 3 - Total Tons of Demolition and Dredged Sediments and Debris byDisposal Route
;is: zrrDredging and Disposal /Events; ~=r-?
First Construction Season ~
Dredge and Debris Disposal by Rail
Soil and Dredge Disposal by Truck
Creosote Treated Wood Disposal by Bins
Wood Salvage for Reuse
Concrete Recycle
Concrete w/Rebar Recycle
Steel Recycle
-~ Weight in Tons ~
85,096
1,118
10,660
205
121
1,113
36
Notes .: L : ±
864 RailCars
442 Bins
12

.-.-. • . • • . .•.-.: .-.-.-. -,-. ^UDIOIal . - : : : : : : . : : :
Dredge and Debris Disposal by Barge
Rock and Soil Disposal by Truck
Creosote Treated Wood Disposal by Bins
Sample Disposal by Bin
Subtotal_ _ = _ — r-_ _ -T-ifj,! - ~~ ~
— — - j^. — -lUldl „ _„ „
: yo,o4y
=- -- -•• - - . . . . ._
21,107
586
21
1
21715;;
— -MQ nfiA--:— -•-"- -119,1104 ._• . . - •
- •— •--••
15 Barges
1 Bin
1 Roll Off
:-" — ^- -•-•::.=:-
. . . . . - . . . .
Waterway Capping- Employing Marine Equipment. The waterway capping effort inthe areas deeper that approximate elevation 0 feet MLLW commenced on November 23,2004 and was completed on February 3, 2005. Initially a toe buttress of riprap wasplaced from south to north along the western boundary of the slope area of the project.This material was Glacier Product #7360 and was placed from November 23 toDecember 1, 2004 with the exception of Station 14+17 to 15+9.1, which was placed onDecember 21, 2004. After the buttress was in place, the first layer of attenuationmaterial consisting of gravely sand, Glacier Product #7180, was placed at approximately1 -foot thickness. Due to an agreement with the EPA, the entire site was not done atonce, but rather in 2 sections, in order to help provide erosion of the attenuation layer bycurrents for a long period of time. This effort commenced on December 2, 2004 and wascompleted on December 4, 2004. A diver survey on December 5 was conducted tocheck for uniform coverage and stability of the material on the slope with favorablefindings of at least one-foot of a relatively uniform thickness. No indications of sliding orother accumulation were noted. Final quantities utilized are shown in Table 5 of thisreport.
The second lift of gravely sand attenuation material was then placed to achieve thedesired 2-foot-minimum thickness. This operation began on December 6, 2004 and wascompleted on December 9, 2004. The second layer was also targeted to construct thedesigned 2:1 slope. To accomplish this slope, additional material was applied in specificareas. Multibeam progress surveys were completed on November 27 and 29 as well asDecember 1, 5, and 8 to document the placement of gravely sand attenuation material.Survey results indicated that application rates and methods were effectively meetingdesign grades and thicknesses.
The rig then moved back to Station 0+16 at the southern project boundary and beganapplication of the required minimum of 1-foot of angular filter rock. This material wasTitan Rock Product #5QS 1A. This application began on December 10, 2004 and wascompleted on December 11, 2004. A multibeam progress survey was completed onDecember 12 to document the filter placement, which was indicated to be uniform and ofthe intended one-foot thickness.
Again, the rig returned to Station 0+16 and began placement of the required 2-footminimum of armor rock (riprap) on top of the filter rock. This operation began onDecember 14, 2004 and was completed on December 22, 2004. Except for the top layer
13
of habitat mix, which was scheduled to be applied at the end of the project, this ripraplayer completed the cap construction using waterway equipment for the south half of theproject.
By late December the cap application in the shallow areas, using upland equipment wascompleted (less habitat enhancement materials) for the southern half of the project.
The northern half of the cap installation, using marine equipment, began on December24, 2004 with the installation of the first 1-foot-thick pass of attenuation layer material.This was completed on December 29. A multibeam progress survey on December 30tracked attenuation material placement in the north as well as the recently-completedsouthern riprap layer. On January 2, a diver survey was conducted to check for uniformcoverage and stability of the first pass. The sand was found to be uniformly distributedwith the appropriate thickness and showed no signs of stuffing or raveling on the slope.
The second-pass layer of attenuation material was then installed from December 30through January 6,2005. This pass completed the minimum 2-foot layer thickness targetand provided the necessary 2:1 slope through the application of additional material inselected areas. As previous, a multibeam progress survey on January 6 documentedthis effort. Application of the northern half of the filter layer commenced on January 10and concluded on January 12, 2005. On January 6, a multibeam progress surveydocumented northern filter placement. The placement of the armor rock (riprap) over thefilter layer in the northern half of the site began on January 13, 2005 and was completedon January 24, 2005 as documented in a multibeam progress survey that day. Theapproved habitat mix, Glacier Product #7123, was tested for appropriate chemicalparameters and placement of the product began on January 25, 2005. The material wasplaced in variable thicknesses based on depth as per approved plans over the entirecap area recently placed by the marine equipment. In addition, in the Pier 11 area thematerial was placed on the beach area since this area was not readily accessible byupland equipment. The habitat mix application was completed on the February 2.
A final multibeam survey of the completed cap, including habitat mix as placed by ^marine equipment, was completed on February 8, 2005.
Waterway Capping - Employing Upland Equipment and Methods. The beachportion of the waterway cap in the elevations shallower than approximately 0 feetMLLW commenced on December 8, 2004 and was completed on January 14, 2005.The majority of the work was accomplished during two low-tide cycles at night(December 8 through 17 and January 6 through 14). The cap was placed utilizingupland equipment and methods (i.e., loaders, dozers, and a Telebelt mobile conveyorsystem which placed the attenuation layer) with BMPs strictly enforced. The cap in thisarea utilized the alternative cap design on slopes of 51-1:1 V. This alternative designconsisted of 2 feet of attenuation material overlain by 3 feet of cobbles to serve as ageotechnical/armor layer. All slopes steeper than 5H:1 Vwere constructed using thestandard cap design. These areas included all the slopes immediately adjacent to thebulkhead. Final quantities utilized are shown in Table 5 of this report.
The attenuation material consisting of gravely sand, approved Glacier Product #7180was placed from approximate Stationing 0+16 to 7+50 (south to north) from December 8through December 14 and from 15+50 to 7+50 (north to south) between January 5 andJanuary 10, 2005. This material was placed to the full height required to meet a
14

minimum of 2 feet. A relatively simple system was employed to ensure the material metthe 2-foot thickness requirement. Prior to placing material, a series of grade stakes weredriven into the beach and flagging was tied 2' 4" above the existing grade. The Telebeltoperator was stationed on the beach to observe placement of the material and was ableto move the belt using remote control to place the required material to bury the flagging.The 3-foot-thick geotechnical/armor layer, consisting of a rounded gravel/cobble mix,Washington Rock Product #040B, was then applied while the latter stages of theattenuation material were still being applied further up the beach. This effort began onDecember 11 and was completed on December 16, 2004 at Stationing 0+16 to 7+50(south to north) and on January 8 through January 14, 2005 for Stationing 15+50through 7+50 from north to south. A system similar to the attenuation material wasemployed to insure the 3-foot-thickness geotechnical/armor layer was placed. Gradestakes were driven into the existing attenuation layer and flagging attached 3 feetabove existing grade. A small bulldozer then graded the material from the supply pointnear the bulkhead or upland supply area down the beach to cover the flagging at eachgrade stake. The southern portion of the boundary rock (riprap) was placed onDecember 13 followed by the sheet-pile wall armor rock (riprap) from December 14through December 17, 2004 from south to north. Simple measurements of area coveredand intended height provided confirmation that riprap was placed according to plans.These were confirmed by tracking delivered versus used quantities.
The northern portion of the boundary rock was placed on January 11, 2005 followed bythe sheet-pile armor rock (riprap) being installed from January 11 to January 15, 2005and again installed from north to south.
Quality-assurance topographic surveys, using standard upland survey equipment andmethods, were taken for the first portion of the placement on December 6,9,11, and 14.Topographic surveys were taken for the second portion on January 7,9,11, and 14. Afinal survey was taken over the entire beach portion of the waterway on February 28during a low-tide period. The final survey figures indicate that within the uncertainties ofthe surveys and construction methods employed, cap construction met the designparameters.
Approved habitat-mix materials were then applied using upland equipment during lowtides to elevations -3 feet MLLW and shallower in the beach application. In addition tothe originally-specified habitat mix, the two additional habitat mix materials were used,Glacier's #7180 (same as the attenuation layer) and Washington Rock's Pit RunProduct #020. These were applied in a 1 -foot thick layer over the top of thegeotechnical layer material. Grade stakes were driven into the geotechnical/armor layerand flagging was attached one foot above existing grade. The appropriate habitat mixfor each area of the site was then placed by a small bulldozer from the supply point nextto the shoreline down the beach to cover the flagging on the graded stakes. In addition,the required 1 cubic foot per lineal foot "feeder" berms were installed. This effort, for theentire site, was accomplished from south to north between January 13 and February 3,2005. Final waterway capping material placement quantities can be seen in Table 5.
15
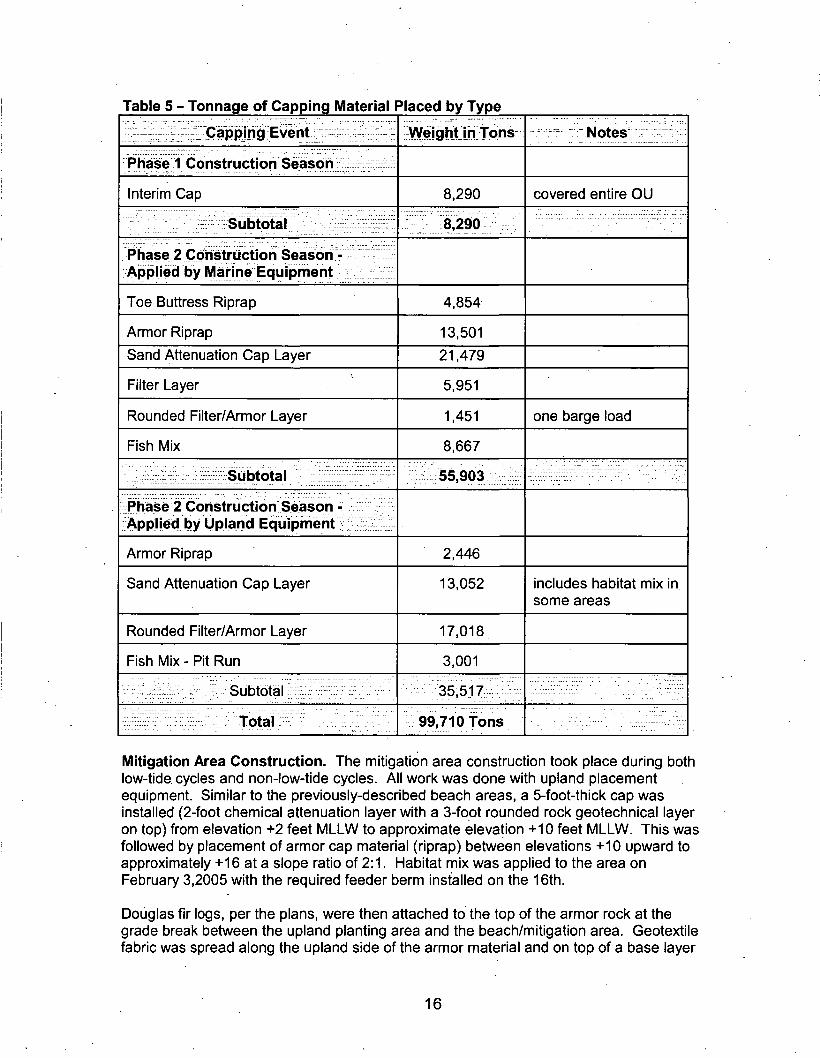
Table 5 - Tonnage of Capping Material Placed by Type.;-\ •-.... -i. .._.._. • : : - - : - ; ~tl".:.~-".. .1'. • : -. • •--
•"• --— : -± -~ Capping Event .:;":—' v ^
Interim Cap
-:--- Subtotal :i
Phase 2 Construction Season - ~Applied by Marine Equipment ' " ;
. . -- -• • .. .-. -- . . _
Toe Buttress Riprap
Armor Riprap
Sand Attenuation Cap Layer
Filter Layer
Rounded Filter/Armor Layer
Fish Mix
_ - ._- . Qnhtntal
Phase 2 Construction Season -Applied by Upland Equipment
Armor Riprap
Sand Attenuation Cap Layer
Rounded Filter/Armor Layer
Fish Mix - Pit Run
" . . - . . . . Ci ihtntal '.'•'.-- ' • ' - ' • • - ' • " ... : ....
.:"••.".-• . " . : • " -.--• - . Totai;;^'::: • .•.-"•^•^~-
.-.- --• — — .— _— ; ; ••• -
Weight Lin Tons
8,290. .
8,290
4,854
13,501
21,479
5,951
1,451
8,667
f\f\ Qfll -. . . . ..-93,9UO .. .......
2,446
13,052
17,018
3,001
qc c-iy
99,710 Tons
•_.. ;_• _ - • - . - • . :._• i-:_
r Notes "
covered entire OU
one barge load
. •-• .. .; •.•„• ii_ • .;••.: . . . .• .. .'. .::,;. • . .
includes habitat mix insome areas
:...::". .:.:':.. " . • " --- -"."."..'.. ' M ' . : ... - - - - - ; - .
Mitigation Area Construction. The mitigation area construction took place during bothlow-tide cycles and non-low-tide cycles. All work was done with upland placementequipment. Similar to the previously-described beach areas, a 5-foot-thick cap wasinstalled (2-foot chemical attenuation layer with a 3-foot rounded rock geotechnical layeron top) from elevation +2 feet MLLW to approximate elevation +10 feet MLLW. This wasfollowed by placement of armor cap material (riprap) between elevations +10 upward toapproximately +16 at a slope ratio of 2:1. Habitat mix was applied to the area onFebruary 3,2005 with the required feeder berm installed on the 16th.
Douglas fir logs, per the plans, were then attached to the top of the armor rock at thegrade break between the upland planting area and the beach/mitigation area. Geotextilefabric was spread along the upland side of the armor material and on top of a base layer
16

of rounded rock in the planting area to preclude the loss of material from the plantingarea. This work was completed on February 10 and 11, 2005.
Following completion of the earthwork, the remainder of the Mitigation Area (the plantingarea) was constructed per the Habitat Mitigation Plan. Woody debris obtained from theUS Army Corps of Engineers was placed and secured in the upper beach area. Topsoilmaterial (50/50 garden mix from Palmer Coking Coal Co.) was brought in for the plantingarea and placed on February 15 and 18. Planting mix (Steerco from Sawdust SupplyCo.) was brought in on February 18 and installed. Plantings were completed onFebruary 22,2005.
17
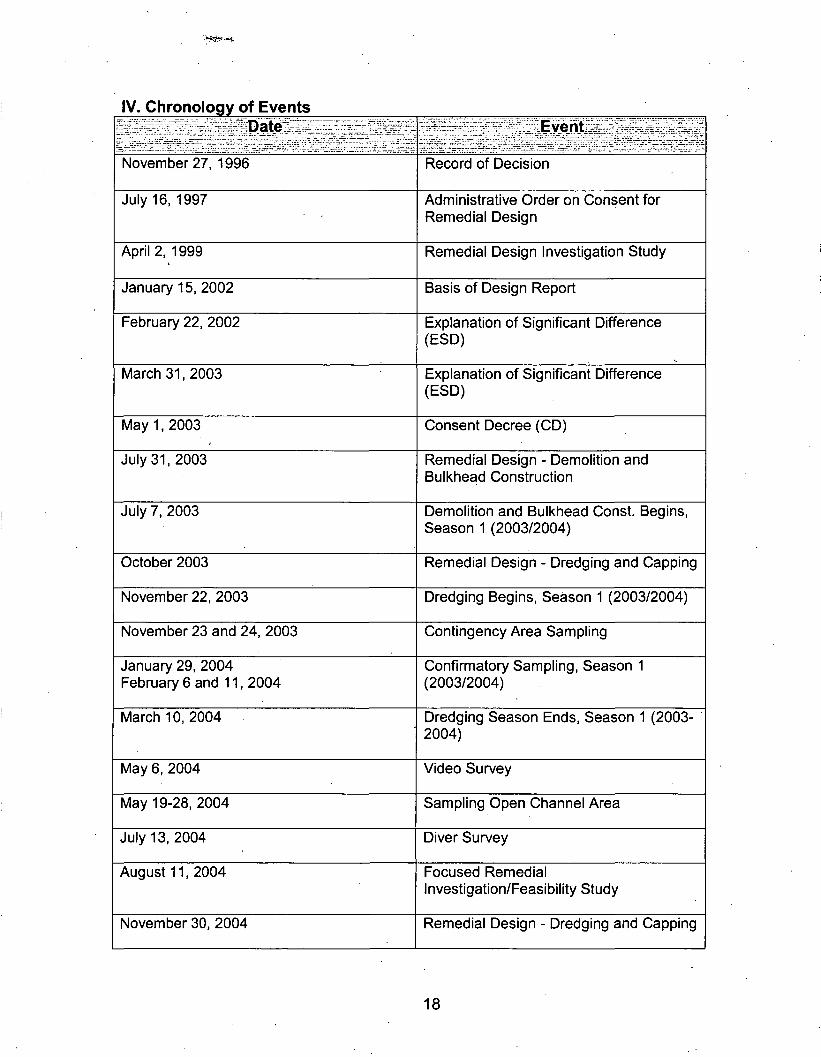
IV. Chronology of Events
November 27, 1996
July 16, 1997
April 2, 1999
January 15, 2002
February 22, 2002
March 3 1,2003
May 1,2003
July 31, 2003
July 7, 2003
October 2003
November 22, 2003
November 23 and 24, 2003
January 29, 2004February 6 and 1 1 , 2004
March 10, 2004
May 6, 2004
May 19-28, 2004
July 13, 2004
August 11, 2004
November 30, 2004
;?P[S: :: yj ^
Record of Decision
Administrative Order on Consent forRemedial Design
Remedial Design Investigation Study
Basis of Design Report
Explanation of Significant Difference(ESD)
Explanation of Significant Difference(ESD)
Consent Decree (CD)
Remedial Design - Demolition andBulkhead Construction
Demolition and Bulkhead Const. Begins,Season 1 (2003/2004)
Remedial Design - Dredging and Capping
Dredging Begins, Season 1 (2003/2004)
Contingency Area Sampling
Confirmatory Sampling, Season 1(2003/2004)
Dredging Season Ends, Season 1 (2003-2004)
Video Survey
Sampling Open Channel Area
Diver Survey
Focused RemedialInvestigation/Feasibility Study
Remedial Design - Dredging and Capping
18

October 22, 2004
October 22, 2004
November 10, 11 ,22,2004
December 3, 2004
December 1-3,2004
November 23, 2004
February 4, 2005
March 7, 2005
April 1,2005
September 8, 2005
September 28,2006
Proposed Slope Cap Design ModificationTech. Memo
Dredging Begins, Season 2 (2004/2005)
Confirmatory Sampling, Season 2(2004/2005)
Toe of Slope Sampling and Analysis Plan
Toe of Slope Core Samples Taken
Capping Begins, Season 2 (2004/2005)
Capping Completed, Season 2(2004/2005)
Final Remedial Action Inspection
Demobilization Completed
Construction Completion Report
Operation, Maintenance and MonitoringPlan
19
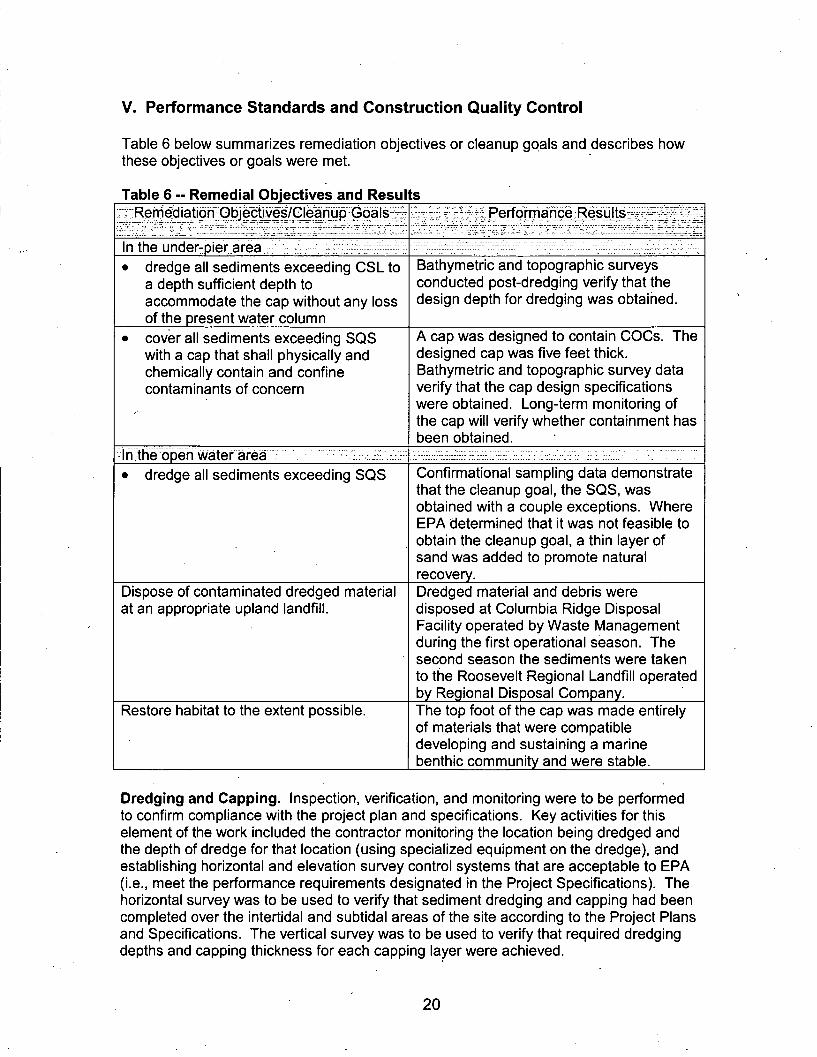
V. Performance Standards and Construction Quality Control
Table 6 below summarizes remediation objectives or cleanup goals and describes howthese objectives or goals were met.
Table 6 -- Remedial Objectives and Results"^Remediation ObjectivesVGIeahup-Goalsr--.:.._,. :. .-.- .-.,-- :: -,--~.--:--^— ---^.-^^-^--^-^-^^
In the under-pier area '- -"• ----- --• • • • " - - - • • •••• dredge all sediments exceeding CSL to
a depth sufficient depth toaccommodate the cap without any lossof the present water column
• cover all sediments exceeding SQSwith a cap that shall physically andchemically contain and confinecontaminants of concern
In the open water area i :;:_/:::::::-• dredge all sediments exceeding SQS
Dispose of contaminated dredged materialat an appropriate upland landfill.
Restore habitat to the extent possible.
-;Si -s±i£ Peff6?m§nce;Results ;; 4MX:~i.>-v~ -r---- - . = .*•=:=, =-—:-.-- ~-~ .--_>^= .. — ;_... .-..v- : - .i-
Bathymetric and topographic surveysconducted post-dredging verify that thedesign depth for dredging was obtained.
A cap was designed to contain COCs. Thedesigned cap was five feet thick.Bathymetric and topographic survey dataverify that the cap design specificationswere obtained. Long-term monitoring ofthe cap will verify whether containment hasbeen obtained.
Confirmational sampling data demonstratethat the cleanup goal, the SQS, wasobtained with a couple exceptions. WhereEPA determined that it was not feasible toobtain the cleanup goal, a thin layer ofsand was added to promote naturalrecovery.Dredged material and debris weredisposed at Columbia Ridge DisposalFacility operated by Waste Managementduring the first operational season. Thesecond season the sediments were takento the Roosevelt Regional Landfill operatedby Regional Disposal Company.The top foot of the cap was made entirelyof materials that were compatibledeveloping and sustaining a marinebenthic community and were stable.
Dredging and Capping. Inspection, verification, and monitoring were to be performedto confirm compliance with the project plan and specifications. Key activities for thiselement of the work included the contractor monitoring the location being dredged andthe depth of dredge for that location (using specialized equipment on the dredge), andestablishing horizontal and elevation survey control systems that are acceptable to EPA(i.e., meet the performance requirements designated in the Project Specifications). Thehorizontal survey was to be used to verify that sediment dredging and capping had beencompleted over the intertidal and subtidal areas of the site according to the Project Plansand Specifications. The vertical survey was to be used to verify that required dredgingdepths and capping thickness for each capping layer were achieved.
20

Survey reference points and base stations were to be staked and maintained by thecontractor until dredging and capping have been completed. Permanent surveymarkers were to be left in place for the purposes of long-term monitoring of the slopearea cap and sedimentation in the channel excavation area. Both land-based andhydrographic survey methods were used. The methods and performance standards forsurveys are described in detail in the Project Specifications. Further information isprovided in the contractors Hydrographic and Survey Plan provided as an attachment tothe Remedial Action Work Plan. A key goal of the Construction and Quality AssurancePlan was to assure that the surveys adequately verify compliance with the design andspecifications.
Confirmational monitoring for the dredging also included collection and analysis ofsediment samples in the open channel area to confirm attainment of cleanup numbers,the SQS. See Section IV, Second Dredging Season for more information.
Inspection and monitoring of off-site transport of materials being disposed was to includeconfirmation that any containers loaded at the site were closed and protected fromspilling or leaking, counts of the containers leaving the site, and measurement of theweight or volume of material disposed at the landfill. When an off-site transloadingfacility was used, some of these responsibilities will be the transloading facility operators.Waste management is further discussed in Section 5.4 of the Remedial Action WorkPlan.
There was also confirmatory sampling performed to verify chemical levels in the cappingmaterials. This sampling and the performance standards are discussed in Chapter 6.0of the Remedial Action Work Plan. Data validation was performed on selected data asper the Remedial Action Work Plan.
A summary of dredging quality-control and project progress records for Phases I and IIare shown in Tables 7 and 8, respectively. In general, the records indicate thatimprovements in dredging equipment and methods employed during the secondconstruction season were instrumental in largely achieving the SQS in the OpenChannel Area. Redeposition was likely eliminated as an issue due to the use of debrisclearing, two-pass dredging, and an environmental bucket for the second pass. Theconcurrent use of upland and marine equipment allowed the schedule to be met andprovided for a simple and reliable method of constructing a multi-layered cap. Waterquality exceedances beyond background conditions were minimal during bothconstruction seasons.
Water Quality Monitoring and Management. Water quality monitoring was to beconducted for the following major construction phases:
• Bulkhead replacement• Pier demolition• Dredging• Capping• Barge dewatering• Upland sediment dewatering
21
This monitoring effort was to provide information and document the potential effects ofthe construction activities on the environment in accordance with the Water QualityCertification. Visual monitoring was to be combined by monitoring with instruments.Monitoring stations including reference stations, mixing zones, and points of compliancewere established for each activity. A tiered monitoring schedule of intensive, routine,and discontinued monitoring was established based on the length of time theconstruction had been ongoing without an exceedance of the compliance criteria.Temperature, dissolved oxygen, turbidity, salinity, and total suspended solids werestandard monitoring parameters. COCs were periodically sampled and analyzed basedon the monitoring schedule. Reporting and notification procedures were established for.routine and non-routine operational situations.
BMPs were specified for each construction operation and included visual monitoring ofany plumes along with BMP inspection and documentation. In-water BMPs includedprohibition of work during work-closure periods; inspections to preclude the introductionof foreign materials to the waterway; the use of certain types of demolition, dredging,and capping equipment; the use of booms and silt curtains to contain debris andsuspended material; and specifications for dewatering sediments.
The results of water quality monitoring were, with very limited exceptions, within thecompliance criteria. On a few occasions, analytical chemistry results indicatedexceedances of the ambient water quality standard for copper. When compared toreference values obtained outside the area of operations, the copper values were nearlyidentical, indicating no contribution from the construction activities. On one occasion,when an exceedance for turbidity was noted for upland sediment dewatering, it wasattributed to nearby dredging that was well within the dredging mixing zone. On oneoccasion, very low levels of dissolved oxygen were measured which were shown to bean equipment malfunction which was repaired. Daily water quality reports wereprepared and weekly summary reports were completed and included in the weeklyconstruction activity reports.
Disposal. The contractor was to conduct regular inspections of all liners, stockpilecovers, and other containment structures to ensure adequate containment, protectionfrom erosion, and use of BMPs (including upland operations during Phase I). Anydeficiencies in the containment barrier integrity were to be noted along with thecorrective actions taken to repair or replace the liner. A Contingency Plan wasdeveloped as part of the RAWP to describe procedures to control and report spills orreleases of contaminated materials, fuels, and other chemical products in use at the site.The dredging contractor, waste management contractor, and/or T-25 facility operatorwere to provide written documentation for all materials shipped for off-site landfilldisposal. Truck weight tickets or barge displacement calculations indicating tonnagereceived and weekly reports were to be provided. Written documentation was to alsoinclude a complete accounting of the reuse, recycling, or disposal of all other materialsremoved during construction and demobilization. A summary of disposal quality controland project progress records for Phases I and II are shown in Tables 7 and 8,respectively.
22

I
Table 7 -- Summary of Phase 1 QA/QC Activities
pagel
Phase IIAppendix AA.1A.2A.3Appendix BB.1B.2Appendix CC.1Appendix 0D.1D.2D.3D.4D.5D.6D.7D.BD.9Appendix EE.1E.2Appendix FF.1Appendix GG.1G.2Appendix HH.1H.2H.3H.4H.5
TABLE 10 - QA/QC AND PROJECTPROGRESS REFERENCE TABLE
Daily QA/QC DocumentationUpland Daily DiariesWaterway Daily DiariesUpland Compaction TestingProject PhotographsPhotographic LogPhotographsDeviation from Original Plans/Specs.Cap De_sjgn Memo of 1 0/22/2004Analytical Test DataImported Material and Other Test ResultsMay 2004 Contingency Area Test ResultsOpen Channel Composite Cores ResultsPost Dredge Added Core AnalysesRedredge Grab SamplesPost Dredge Samples (Summary of D.3-D.5)Slope Toe Composite Core ResultsConfirmation Sample ResultsData Validation ReportAir Quality MonitoringHart Crowser Monitoring ResultsTRC Badge ResultsWater Quality MonitoringMCS Environmental Monitoring ResultsEPA OversightWeekly Summary ReportsWeekly Meeting MinutesActivity Implementation PlansSediment Dredging and Materials HandlingDiving PlanRemaining Piling Removal PlanWaterway Capping PlanUpland Capping Plan
Demolition
XX
XX
XX
X1
BulkheadConstruction
X
X
XX
X
XX
Dredge OpenChannel Area
XX
XX
XXXXXXX
XX
X
XX
X
Dredge SlopeArea
XX
XX
XX
X
XX
X
Cap Slope AreaWaterway Equip.
XX
XX
X
X
X
XX
XXX
Cap Slope AreaUpland Equip.
XX
XX
X
X
X
XX
X
X
23
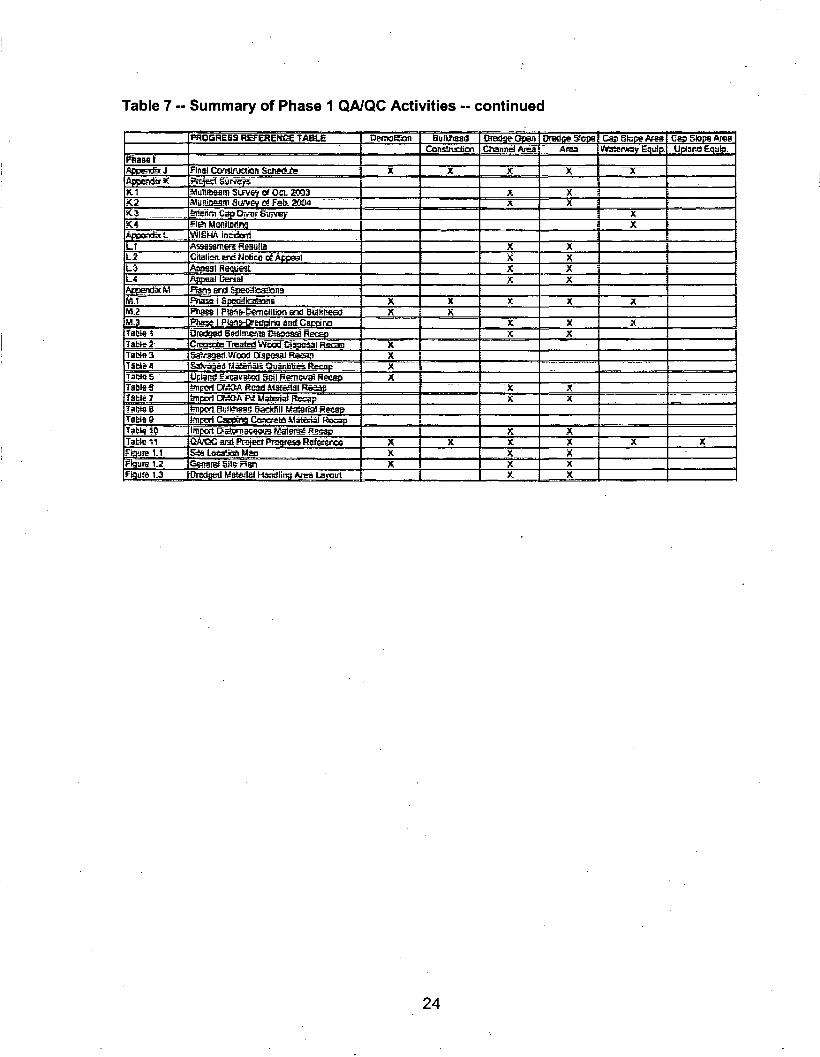
Table 7 -- Summary of Phase 1 QA/QC Activities -- continued
PfcaBolAflLCi'Jtt J
Apse****M•(.2K.3SC4AppcsKhxLL11-5L3L4AppenctaMM.I««M.3T3619*TafclsJTable 3Title 4Tads 5Table eTable?Tae^BTebleSTafcls 10Table *1Figure 1.1Figure 1 JF&iife 1 J
«TOBHE5S RS=ERENC£ TAS.E
Final O£rtJifiJ36fl Sche€iraPscjwi S«K??5.^uRii>9im Sifvey tf Oa. 2CO3AlUBifieSfll SlA-V&y 0* Fab. 2CSMfenciim t i Dr.-nt S~ane?Fits* MsiiiBrfrgWlSkn. inJiJunAss8ssn!«r« fiesullaCftalicn ax Mcbce G^ AppealAiEisal Pe^wstAsoeal terJaJJ1^ sr3 SuecScailonBPnaa 1 Sco^EsfikHis««» 1 Pims-Demeiilion end BdtsfieaaPhasi 1 Plans-l>ctfnina ami CapdraQredged Sadimerns tHsooss? RecsjiCraKOE Treated Wood Disposal Rscaasa?/3gsa Wood Cspcaal FtesanS rapod Matefials Quanlilies Recap :
ucii'iW M.«T3i'Btea sai R«?ncws nececatpcrt Df cw. Reed Msfslal R*sapimjx^ Cf*JA PS MatEJia) RecapSng<jn gi;H?aB5 Baeklill Kalensfl RecapIfflcoil CfiSpang ConcreU Matfeial RgcapImccft Bstomswco ^aisfS Ra»£QAi QC arjt Prcject Progress RefcfgrcsStt Lata'JSi MSIlateral Site RanOredjted Macejlel Hftrdlins Area lavaut
DerroBSon
X
XX
X
XXX
XXX
BulXJisaiJCons&ucijQn
X
XX
X
OredgeOpanChannel Area
X
>:X
XXXX
X
XX
XX
XXXXX
Dredge S%OBArcu
X
XX.
XXXX
X
XX
XX
XXXXX
CasStapsAfesvr»3!er*ay Equip.
X"
XX
X
A'
X
Cs> slope AreeUpland Equfei.
X
24

Table 8 - Summary of Phase II QA/QC Activities
11;Pha»fl•ApjwSi* A!A.t1A,3
(A.J
'AsaendiX §
.8.1
|B.2
lApoantiii C
F1
iAppendx D
JIMU?10.3
!D,«D.S0.6D7D.B
rD.9
iA»WS!XEf.1j£,2Appendix FF-l
AWSRflxG
iS-lG2ABPBiifllJiHR1H.2K3
iH.4H,S
ApnendUlAppendix J-J.Ij.2J.3cL*AppengL* K
fROCAESS ftfef&IKt E t-ABLE
DaRr OAiUC DocurtantaftmUpland Dsly DarieaWstewsy pgiy BairnUpland CcenpaoJai T«draPrajea kiaiftESpjaFftMogr«»Ec wgfTKEOgraETSOevlatlcn ffwn Orient R -/Spec3.Cap D?sgn nKmo at 1CU22/HKW
feiatfUcffl T«st Datafenpcried Katenef aid Olt-ff Tea R«utj
May SIM CSanflns«f.s» A«a T«t RssUteOpen OsmeJ CcmpMSs Ceres ReaJtjPod Crwjo AMAJ cere Are^ysesftrtrSdgc Grab SnmptU
POM Of«49s satass (6uifKtis« «f o.s-u.sjSJciE Toe Compcsao Ore RasaHsCcnfinnrtlDn Sarnie ResiiltsQalaVdiAtUCTiRcctrt
WrQuaU/MorttwstaHan Crenraer ManfeiringResiltaTOG Badge RssiBs'iVate' Quality MmtarinflfvlCS Emrsflmanlgl (A^nScririg ResultsEPA Ch* l3htWS*(F Sminaiy RewlsWeeklF .WesUigj MjnulesActwity lirtplamersalinn RsrsSsdimcrl Dredging end Mddals Hsnd&aDkM§ RlBftfJirnasrag Perg Rsnwvsl PlsiWatcnray Cswing PienUclsraj CaEFlna Hsi
Final &y*riHSran Scha^eReject Survey
Prartfl Suwsr Retort•fojcS Cross Sccbcrs
Project Ftn» "ToKar&H .Ptsjecl Rras hnoasi Qrai Q;SS18 ef Wahirtqtcn Uw AtSwrtiadon
DQnuiidcn
XX
XX
XX
1
X
.
EXdtasdCcreeueliefl
X
X
Xx
X
XX
X
^MAju OpenChzrneJ A-'*a
XX
XX
XXXXX
XX
X
X
X
XX
X
X
XX
JJrackie Slcpe
Ana
XX
XX
XX
X
XX
X
X
XL_ *
Gap Sriipe Area
WatenwarE«£x
XX
XX
X
X
X
XX
XXX
X
XXXXX
Cop Sop* Are-;
UclamJ Eow.
XX
XX
X
X
X
XX
X
X
X
X .XXX
25
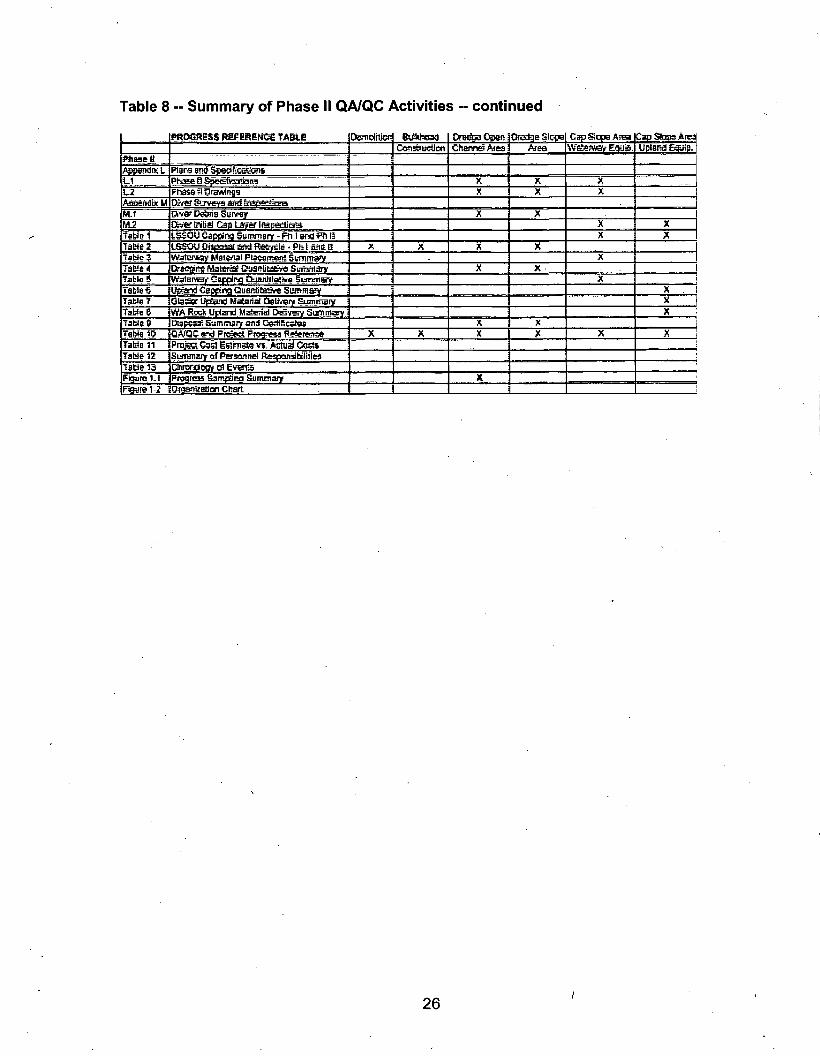
Table 8 - Summary of Phase II QA/QC Activities - continued
PROGRESS RSfeSEHCe TABLE CapScjBArea lap SOSH AreaAiee
WiraeH
Phaie 8 Soet-fkotEinaU! PfdS«?l DrawingstaendixHtt.1tA2 D=v6? Ifilifl Cap Ur/er Ir periicTa
LS5CKJ caceirg gtmsnarr - Ffi I end Fti 15LSSOU Obposai rod fter*th! • Ph= ( anif B
Table?X
Tat-to*jSrSYl Caeci'rfl QuanBteEve Summary
Tablo 7 Glacsf Uffg-Tj Maeand Dalr.-giy ELprunjiyTable 6 WA Rtck UfXmd Mifeiid DBVEV StmmsvTables Dapc?* Summary and C9,*Sficsta£TaftrtIC QiVQC s?d Prases Progfsa Rs««TaMe 11TnWe 12 Siarensiy of Pesannei Responitclilltalatte 13 emrt EvertsFigure 1_t
26
VI. Final Inspections and Certifications
Remedial activities were conducted as planned and cleanup goals were obtainedfor the remedial action. EPA conducted a final inspection on March 7, 2005. The finalinspection concluded that construction had been completed in accordance with theremedial design plans and specifications and did not result in the development of apunch list for the remedial action.
27

VII. Operation and Maintenance Activities
The remedial activities for the LSSOU that are subject to this OMMP are:
• Dredging of contaminated sediments in the 3.2 acre Open Channel Area;• Placement of Enhanced Natural Recovery (ENR) material in about 1.2 acres of the
Open Channel Area;• Construction of the Under-Pier Area permanent-cap consisting of two areas:
• Slope Area from the rock buttress at about -30- to -4-feet Mean LowerLow Water (MLLW; 3 acres); and
• Beach Area from about-4-to+12-feet MLLW (2 acres);• Construction of the Mitigation Area (0.25 acres outside the LSSOU);• Construction of the Riparian Area (2,500 square feet outside the LSSOU).
The goals of the OMMP are to ensure that the remedial actions continue to beprotective of human health and the environment. The specific goals of the OMMP are toensure that:
• The sediment cap continues to isolate toxic concentrations of previouslyidentified chemicals of concern (COCs) in the underlaying sediments frommarine biota and other biological receptors; and
• The sediment cap and the previously dredged open channel area do notbecome recontaminated with COCs from the underlying sediments orfrom the uplands adjacent to the LSSOU.
Integrity of the capped areas is fundamental to achieving these objectives. Cap integritydepends on maintaining the designed cap thickness to avoid potential contaminantreleases, and to attain the specific performance standards discussed below. To ensurecap integrity, the OMMP includes the following:
• Physical Integrity Monitoring. Physical integrity monitoring will ensurethat erosion is not occurring to the extent that it would compromise the abilityof the cap to physically isolate contaminated sediments from environmentalreceptors. Hydrographic and topographic monitoring are planned to detecterosion.
• Surface Sediment Quality Monitoring. Sediment quality monitoring willbe conducted to confirm that toxic concentrations of contaminants are notmoving upward to the top of the cap via groundwater or other transportmechanisms and that previously dredged sediments are not beingcontaminated. Sediment sampling of the top 10 cm of sediment is planned.
Verification that upland source control is in place and functioning according to specifiedstandards and that the cap is functioning as designed are also vital to accomplishing thegoals of the OMMP water. To ensure these, the OMMP includes the following:
• Upland Groundwater Monitoring. Data from the Lockheed Martin Yard 2Upland Groundwater Monitoring Program will be provided by Lockheed Martin forinclusion in the annual OMMP Reports. This data will provide information about
28

groundwater quality along the shoreline relative to the established RAOs for theUpland OU monitoring program and to support the certification for the LSSOUremedy that adequate upland source control efforts have been achieved suchthat sediment recontamination will not occur.
Monitoring results will be used to determine whether project objectives are being met, orwhen contingency measures are needed to address deficiencies noted. See 9 for asummary of monitoring tasks for the LSSOU.
Table 9 -- Summary of Monitoring in Each Remedial Area
igggg fjWs;:':' /" i .-'i I-.'u :":":-. u ~ £-"£_"
SrSr -ijiLT - : -5i=\--=.. =.= r-. f?!-: -. _
:Opeh;^:;; :;;^QfianjieJ: .-;:::Area -?-:: ;:2:-siGjap^r S[o~pe;i:Areaiz;±i±±^Gap]-;-; -";:::Beach:Area:*Oap~^;£-v;MitigatiQli;;-'Afea""~"""'::—-Riparlarv;;--^r:Area>:±s±"S :Ppland^"--^GrpAjSdwaterr_Monitoring^ :
-Visual and ^_^- PhotogTa ph ic^-= ~^= — =__- — -- — —-_ _r -~ - ^ — ^~ —_
X
X
X
HydrpgraphicF
.-JCL\_ " -J7. _~tO-=, "-"„
-„_- -~^ ~ i.r ixr,~ -==._-~- — ~~~= r-r :£^-_
X
rjopographicif
_— r — rr —-- ~rr
•^ _TT^. _ _
-S^~ -~~--z -£r=:-j
X
X
ZSediment^"Samples"51
&ri<ir~~--'£:~sGhe'mistry.
X
X
X
rGrpunclwater^Monitoring"- ""-and - ~ •- ~ ~=^Cfiemistryr^ :
X
29
VIII. Summary of Project Costs
As shown in Table 10, actual project costs were about $20 million versus estimatedcosts of approximately $12 million for Strategy 18C in the ESD. The ROD cost estimatewas only $4.5 million, but was based on only addressing the Open Channel Area. Directcomparisons by line item are difficult because the ESD estimating system and the actualproject cost accounting system did not use all of the same elements. This is notunusual; for instance, an estimate would typically contain a contingency item whileproject spending does not provide for procurement of anything but goods and services.The ESD estimate has a line item for contractor overhead and profit of $1.23 million,which is apportioned among the various contractor items in the project accountingsystem.
There was a nearly $2 million difference between the ESD estimate and the actualbulkhead construction cost. The ESD assumed the wood bulkhead would be repairedwhile the entire bulkhead required demolition and replacement. Similarly the ESDestimate for demolition is less than the actual by $1.6 million. Significantly moredemolition was required for the wood bulkhead and additional pilings that wereencountered, which increased the cost. While dredge volumes were approximately 20percent or more above those anticipated, this does not account for the 176 percentincrease of actual above estimate. The presence of extensive amounts of debris as wellas areas of extremely hard digging conditions due to shipyard wastes having beenconsolidated or fused with corrosion products combined to reduce dredging productionby half for a significant portion of the project. The unit rates in the estimate were typicallysignificantly less than actual rates. Two mobilizations to the project were required aswell. Disposal costs were $4.6 million as compared to an estimate of $2.85 million.There was no provision for disposal of treated wood in the ESD estimate, whichaccounted for $0.6 million of this difference. Unit disposal costs in the ESD were $42 percubic yard while actual costs were approximately 50 percent greater due to the difficultyof handling and dewatering these materials.
Actual capping costs were $2.4 million versus the estimated $0.89 million forapproximately the same amount of material. Direct cost comparisons are complicatedby the use of upland delivery and application methods for a portion of the cap in additionto the introduction of cap materials such as pit run, filter material, and cobbles that werenot anticipated in the ESD. Unit rates for actual costs were about 30 percent above theestimated values. Costs for construction management and administration were about $2million more than estimated in the ESD. This was a larger and more complicated projectthan originally envisioned when the ESD estimate was prepared. With the addition of acompletely new bulkhead, the construction management was much more intense andwas complicated by the failure of the old sheet-pile bulkhead. Nearly every projectcomponent was complicated by unanticipated field condition which required additionalmanagement and administrate efforts. The length of the project was likely longer thananticipated so the greater level of effort was also maintained over a longer time period.
30
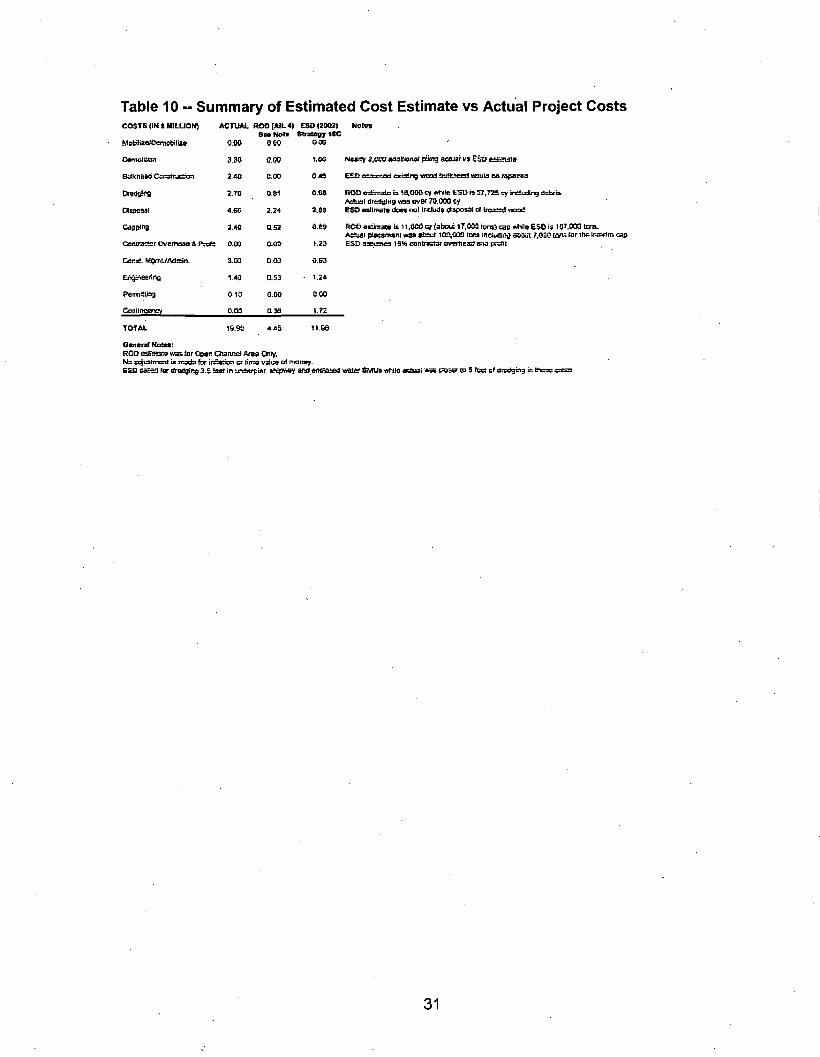
Table 10 - Summary of Estimated Cost Estimate vs Actual Project CostsCOSTS (IN « MILLION) ACTUAL ROD [AIL 4)
8 HI Not.M=titiZB,'Oentsti!i» 0.90 O.CO
D«mclfron
Bui knew: Ccnstrjs?on
Credsirg
OiBpoul
Capp)n«
Gaanxan Owm-M & rate
Cae . uqmufamlrL
EAJriiiSrg
Perilling
Conum^ney
330
J.40
J.TO
4.60
2.40
D.CKI
3.00
1.«J
010
0.00
&.CQ
0,00
081
J.I4
052
OXE>
DOQ
aw
o.w
033
ESO(2COItSUjlcyy HC
ace
i.«
0<9
o.w
2-43
4.69
1.23
0.53
• 1 i*
C.CO
1.J7
TOTAL 16.90
Otneni Notet:ROD eaiiraw vis ar Cp»r. Cfumraa Ana Onv.No sc^slmenl ia mvla for ir£*::an cr litr a vsluv
Nwify J.fito iEiaBBiuu piling aaujl vi Eso earns:*
eBsumfld exiting vnod biilfchrrrt uould
ROD Uit iiatc o ia.000 cy wHIc E5D n 57,72 cy ifrtirtfig defcri*Aetual oreaslRg was over 70.000 cyE€& gstiinat9 dov» no) inclwfo tfnfy" cf ii
ROD ocimaoi ii I l.flCO cy (stc« 17.&M Itnj) j i «WI? ESO ie 107,00) tra.piw«MiTii •» oKui 100,000 tori iiuiuisftj siDm 7,000 t&K far ids ir.ffifim cap
ESO nSLrm 18W fgntraRiK ovntnsa aa cnftl
ESO ca r. tffffaay sea encoded -*qtar gr us •*t3ie acoa! *«5s faua" CD 5 fee cf
31

IX. Observations and Lessons Learned
Demolition and Bulkhead Construction. During demolition and bulkheadconstruction, problems were encountered with piling removal creating relatively localizedinstability. Vibratory removal of piling, especially in very dense arrays typical ofshipways, produces a large amount of energy which liquefies sediments to someextent. In addition, removal of piling creates voids, further reducing stability. In theshipways, the piling were often driven touching one another and several instances ofpulling two or even three piling were noted when the jaws of the vibratory hammer wereclosed.
When this removal activity was conducted near existing structures such as sheet-pilebulkheads, they were subject to movement or leaning. In the case of the old sheet-pilebulkhead, about 50 feet of the bulkhead failed through leaning several feet. Thisstructure was extremely corroded, especially at the mudline, and had lost essentially allthe wall thickness from corrosion, spalling of corrosion products, and subsequentadditional corrosion of the newly-exposed surfaces. In addition, the tie backs were madeof steel which had corroded through in two cases.
This structure was marginally stable prior to demolition of the immediately-adjacent northshipway, so it is not surprising that the bulkhead failed. Another, less-dramatic, exampleoccurring in the south shipway. In this case, the new bulkhead was driven but theconcrete pile cap was not constructed prior to demolition in the adjacent south shipway.Some deflection of the new bulkhead was noted, at which point demolition was stoppeduntil the situation could be addressed. For structures that were in place, it wasrecommended that no piling removal be conducted within 50 feet and that monitoring formovement be undertaken. For the remainder of the bulkhead, the recommendation wasto alter the demolition/construction sequence so the demolition would be completedahead of the bulkhead construction. This method did raise an issue with erosion sincethe previous sequence provided for the sheets to be driven prior to removing theremnant existing bulkhead. To address this potential, a temporary wall of largeinterlocking concrete "Ecology Blocks" was constructed to protect the shoreline betweenwhen the old bulkhead was removed until the steel sheets could be driven.
Dredge Design and Operations. Several problems became apparent during Phase Idredging which contributed to an initial failure to achieve SQS in the Open ChannelArea. All manner of debris such as pipe, hoses, cables, concrete, and steel was mixedin with the target sediments, making dredging more disturbing to the sediment bed thananticipated. Debris caused resuspension of sediment and/or loss of sediments from thebucket due to failure to fully close and the large number of cycles required to removedebris. This situation was likely made worse by the presence of very hard, consolidatedsandblast grit or fused metallic wastes in several areas. In addition, pile tips wereencountered that had been historically broken off at or near the mudline and buried bysubsequent waste deposition. These often were present on the slope area and wereeither worn away by repeated bucket closures or pulled in their entirety. This processcomplicated dredging to desired grades and greatly disturbed these areas, with theresulting resuspension of material which may have moved down slope into the OpenChannel Area to some extent. The initial approach to dealing with debris was to conducta debris clearing pass using a digging bucket deployed to just scrape the surface of thesediment bed. While a large quantity of debris was removed, this operation assumed
32-

that all debris was present at or within a foot or two of the bed surface. An examinationof the physical deposition process of shipyard wastes would argue with this assumption,in fact debris would be expected to either be present throughout the dredge cut or beeven more prevalent at deeper cut depths due to its relatively higher density comparedto sediments. Two critical decisions were made early in the Phase I dredging processthat made prompt resolution of the debris problem more difficult; an environmentalbucket would not be up to the mechanical rigors of the dredging environment and arelatively small, 3.5-cubic-yard standard bucket would be used. A larger digging bucketwould weigh considerable more and thus provide a more aggressive digging action withrelatively fewer cycles required to clear debris or achieve desired cut depths. If thislarger bucket were used to nearly achieve depths, the final cut would have relatively lesslarge debris and would be able to be addressed with an environmental (closed) bucket.This set of equipment and associated operational practices was employed during thesecond season in the Open Channel Area with much better results. A series of testdredge cuts prior to decisions about dredge and cap design and equipment selectionmay have provided an early warning of this problem.
In a related item, the interface of the Slope and Open Channel Areas was approximatelyat the pierhead line and was designated as the border between sediments that wererequired to meet SQS in the Open Channel Area and sediments that were to be cappedin the Slope Area. A significant amount of dredging was done in this area with mixedresults relative to meeting SQS as this area was the most likely to receive redepositionmaterial and/or material moving downslope. Short of cutting back the entire Slope Areaand substantially reducing the post-cap desired habitat elevations, the area was subjectto capping at the toe of the slope. During both dredging and capping, the accuracy andusefulness of hydro graphic surveys was an issue. Much of the work subject to surveytook place on a relatively steep slope and single-beam surveys were not as useful asmultibeam surveys due to relatively small errors in single-beam hydrographic methodsbeing magnified by the slope. Multibeam surveys provided more accurate andreproducible data and were used exclusively for nearly the entire second season. Theonly exception to their relative utility was in the case of riprap surfaces, which were aproblem due to their uneven nature. With the application offish mix which filled the voidspaces and provided a smoother top surface the multibeam surveys were once againaccurate and reproducible.
Capping. Refinements to the original cap design were possible due to taking a closerlook at armor rock requirements. It turns out that riprap was not required on gentlerbeach slopes, which greatly reduced the need for large quantities of riprap and allowedupland construction equipment and methods to be employed in the beach area.Substitution of a 3-foot-thick cobble/gravel mix for the one-foot of geotechnical filter layersupporting an additional 2 feet of riprap allowed for adequate armoring and did notreduce the environmental efficacy of the cap. Simultaneous cap construction usingmarine and land equipment was possible with independent and parallel material supply.This reduced costs and greatly reduced the required schedule which allowed the timelycompletion of the project well within the in-water construction window.
33
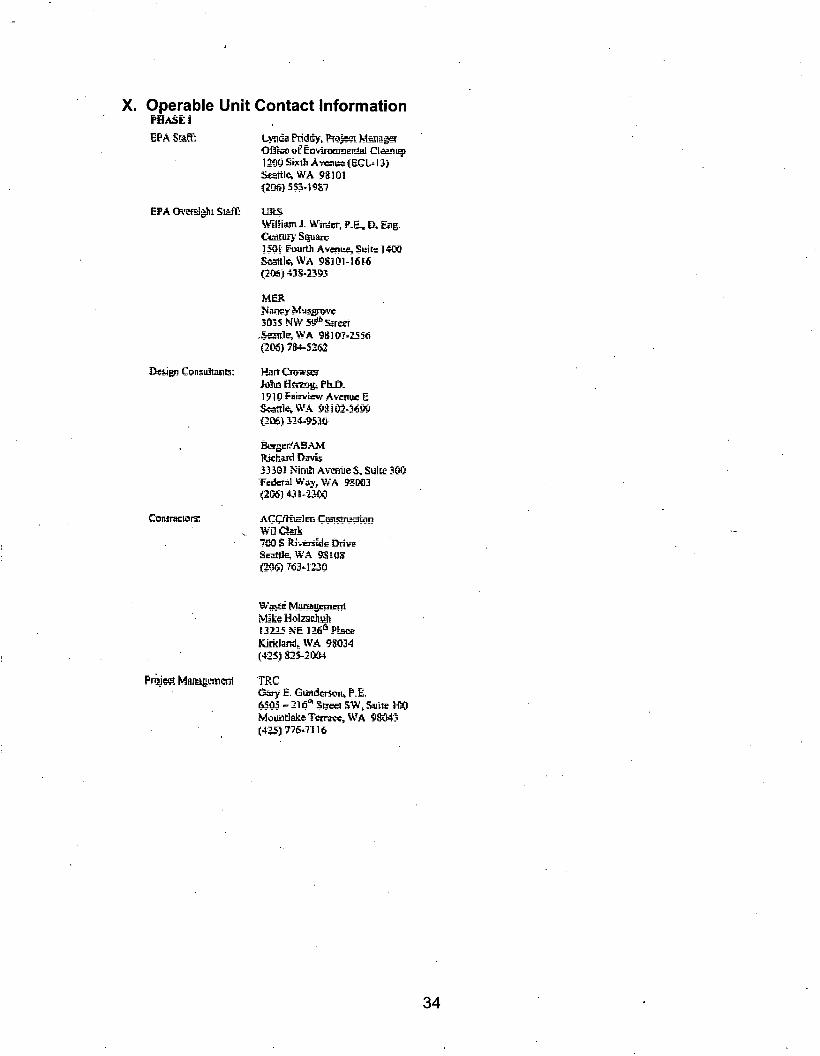
X. Operable Unit Contact InformationPflASEi
EPA StafC Lynos Pnds>\ Prajst Manage?f Edvircnraenial
SialT-
9S101
CoiuraclDrs:
ussWilliam J. ft-jitirr, P.E^ D. Eng.
1SH FisiriJi Avenue, SuiteSeattle WA 98101-1616(206) A3S-
MER
tle, WA 9810/=155<i<2&i} 78^-5262
1910 Fairview Avenue gStsttlev WA 9*103-3699(206) 121=9530
Rkhwd Davis333S1 Nirnti AvefiueS. SulK 300Federal Way, WA 93003
wlCiai74M S SJv^ratde DriveSenate, WA SSIOS
MikeHoIssJmh832125 NE ]2*6FbceKitklare), WA 9SJ34
TRCfiary E. <jli?iiSdfSOi\ P.E.6503 - 216° Sires SWh
(415577&--7S16
34

PHASE u
EPA Slafll
EPA Oversight Siai!:
Sams as far rhase E
Ken FelSowt, P.E.1 2-3 1 Frya? A^ue, ?O Bon 469
^ WA
Daites, Olmsted £. FygJcvand, luc,Gregory L Hartiuan^ P.E.tOTftS Silveidale WflyNW, Suite ZOtSilvcrdak, WA 983*3 -( J60) 692-7345
Landau AE3Ociase>
130 Second Aveeue SEdmonds, WA SS02D
Stcvea f. Branaoa, ? J-.reeS9820J
Regksial
100] SW KlicHw Way, Suite 10?SratfeWA<^I2S) 292-2525
35

36
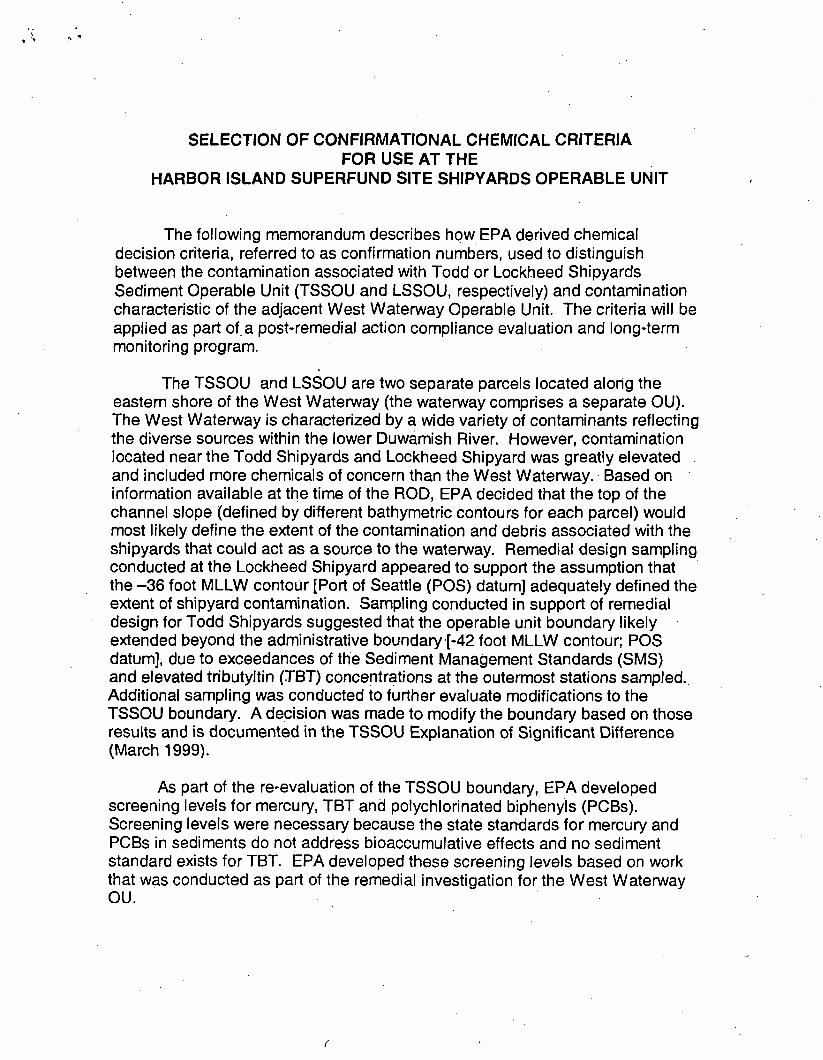
SELECTION OF CONFIRMATIONS. CHEMICAL CRITERIAFOR USE AT THE
HARBOR ISLAND SUPERFUND SITE SHIPYARDS OPERABLE UNIT
The following memorandum describes how EPA derived chemicaldecision criteria, referred to as confirmation numbers, used to distinguishbetween the contamination associated with Todd or Lockheed ShipyardsSediment Operable Unit (TSSOU and LSSOU, respectively) and contaminationcharacteristic of the adjacent West Waterway Operable Unit. The criteria will beapplied as part of,a post-remedial action compliance evaluation and long-termmonitoring program.
The TSSOU and LSSOU are two separate parcels located along theeastern shore of the West Waterway (the waterway comprises a separate OU).The West Waterway is characterized by a wide variety of contaminants reflectingthe diverse sources within the lower Duwamish River. However, contaminationlocated near the Todd Shipyards and Lockheed Shipyard was greatly elevatedand included more chemicals of concern than the West Waterway. Based oninformation available at the time of the ROD, EPA decided that the top of thechannel slope (defined by different bathymetric contours for each parcel) wouldmost likely define the extent of the contamination and debris associated with theshipyards that could act as a source to the waterway. Remedial design samplingconducted at the Lockheed Shipyard appeared to support the assumption thatthe -36 foot MLLW contour [Port of Seattle (POS) datum] adequately defined theextent of shipyard contamination. Sampling conducted in support of remedialdesign for Todd Shipyards suggested that the operable unit boundary likelyextended beyond the administrative boundary [-42 foot MLLW contour; POSdatum], due to exceedances of the Sediment Management Standards (SMS)and elevated tributyltin (TBT) concentrations at the outermost stations sampled.Additional sampling was conducted to further evaluate modifications to theTSSOU boundary. A decision was made to modify the boundary based on thoseresults and is documented in the TSSOU Explanation of Significant Difference(March 1999).
As part of the re-evaluation of the TSSOU boundary, EPA developedscreening levels for mercury, TBT and polychlorinated biphenyls (PCBs).Screening levels were necessary because the state standards for mercury andPCBs in sediments do not address bioaccumulative effects and no sedimentstandard exists for TBT. EPA developed these screening levels based on workthat was conducted as part of the remedial investigation for the West WaterwayOU.

An extensive literature review was conducted on the bioaccumulativeeffects of these three contaminants as part of the West Waterway OUinvestigations (EVS 1999). A tissue screening level for TBT was derived fromliterature values for use in site-specific bioaccumulation tests. Laboratorybioassays were then conducted to evaluate the bioaccumulation of TBT inbenthic invertebrates (EVS, 1999). In addition, fish and shellfish samples werecollected from the Duwamish Waterway for tissue analysis to support a humanhealth and ecological risk assessment (EVS, 1999). Only limitedbioaccumulation was observed in the laboratory studies and organism tissuesdid not exceed the tissue screening level associated with deleterious effects (i.e.,mortality, reduced growth, or impaired reproduction) derived from the literature.Further, the results of the risk assessment suggested that sedimentconcentrations in the West Waterway represent minimal threat to human healthfrom ingestion of seafood that may be exposed to West Waterway contaminants.
The ROD clearly states that the SQS be achieved within the OU in theopen water surface sediments (and to the extent practicable in the under pierand shipway surface sediments); however, EPA was concerned that strictapplication of the SQS at the boundary may lead to remediation of the WestWaterway (or Elliott Bay) sediments in the vicinity of the shipyards that arecharacterized by chemicals at concentrations above the SQS, but notnecessarily related to shipyard sources. In addition, no sediment standard existsfor TBT; thus determining the extent of contamination is more difficult.
To better understand the distribution of contaminants in light of theremedies under development at each of the shipyard operable units, EPA usedinterpolation technology to "map" concentrations of all chemicals of concernthroughout the West Waterway, the TSSOU and the LSSOU. The resultingmaps show a pattern of contamination throughout the area that shows thatshipyard contamination is generally confined within the existing OU boundaries.However, there were some exceptions where possible contamination outside butcontiguous with TSSOU or LSSOU boundaries was indicated. EPA recognizesthat this mapping technique does not identify exact locations or magnitude ofcontamination; however, the trends indicated that the administrative boundarychosen for the site may not entirely encompass site-related contamination and afew data points associated with recent investigations further support thiscontention. The maps are attached.
In order to confirm that shipyard-related contamination has beenaddressed with the implementation of the remedies for each parcel, EPA haselected to use a combination of the SMS chemical criteria and chemicalconcentrations that are characteristic of West Waterway conditions todifferentiate between contamination characteristic of the West Waterway andcontamination associated with the shipyard.
Page 2 of 4

EPA retained the screening levels for the three bioaccumulants: mercury,TBT, and PCBs, described above, as criteria to be used to distinguish betweenthe contamination associated with Todd or Lockheed shipyards as a source ofcontamination and contamination characteristic of West Waterway. Thesescreening levels are based on a non-parametric metric (percentiles) becausechemical data are not normally distributed (an assumption that needs to be metfor creating arithmetic means or upper confidence limits). The SupplementalRemedial Investigation, the West Waterway TBT study, and the TSSOU Phase1B samples located outside the OU boundary) were used to calculate the 90thpercentile for the Shipyards OU contaminants of concern (COCs), which includearsenic, copper, mercury, lead, zinc, low molecular weight polycyclic aromatichydrocarbons (LPAHs) and high molecular weight PAHs (HPAHs),polychlorinated biphenyls (PCBs) and TBT. Only those stations that werelocated in the West Waterway, but are not part of the SSOUs were included.These values were then compared to the SMS cleanup screening levels (CSLs)for the purpose of selecting values that could be used for post-RA confirmationalsampling (Table 1).
For the majority of the COCs (all metals except mercury, and LPAHs andHPAHs) the associated 90th percentile value is well below the CSL, suggestingthat if the CSL was exceeded at the Shipyards OU boundary for a given COC,then that chemical would more likely be representative of Shipyards OUsediments. Mercury is elevated well above the CSL throughout the WestWaterway, such that the state standard would not be able to distinguish betweenShipyards OU and West Waterway OU sediments. However, the WestWaterway conditions may be more indicative of an acceptable risk to humansand ecological receptors, based on the risk assessment results given that thestate standard does not address bioaccumulative effects. PCBs within the WestWaterway are generally below their respective CSL. No standard exists for TBT;therefore the 90th percentile of the West Waterway data set was considered themost effective criterion for distinguishing between shipyard and waterwaysediments. In addition, the West Waterway risk assessment suggests that risksrelated to TBT exposure are within an acceptable range.
The values listed in Table 1 represent the confirmation numbers that willbe applied as part of the post-RA compliance evaluation and as part of long-termmonitoring. The evaluation process (how these numbers will be used and whatdecisions they may trigger) will be documented in a separate memorandum.
Page 3 of 4

':'
X
1
II:: .
lit
\(
I
1
|F
i:"
<:
m
tliteci
Arli
"IIel
*l)p
PA
P/3S
41
Gl
m
tti
£i
perf ;
I
ft:|::
d-l
:•
B
s
Jty
iflfesffllli
ell
;i-;s•••::::|::-::i':'.:
f: :•':•::•: :::: ::;:;:::•:::::.:•:
!:-.:;.!i:.:
:.: : :;::;>i::'-:
::::-:
*;ni.•if: S
-. *:*:*; :;:>>•::::.
:>;•••:•"-:•: : : :•: :
oac
Itin
*
:::::-:o:
;;:xi;:.
::::>vv
;;::;;;;•
:-:;!';;•:
: :.:.:.: : :•: :;:
si;S;:;S
••: ::>•:::::>:::
••;••:•::•;.
cum
;M:;:;
M " :•: "
.: •:.":-!:: •
SS-SiS^i sgE
ifll ltiiilfil HIiWa^P|y|9pfiii|BiHBftfeSi27 mg/kg dw
230mg/kgdw
255 mg/kg dw
355 mg/kg dw
1 02 mg/kg tocn
806 mg/kg tocn
uWiSlIilil35 mg/kg tocn(500 ug/kg dw)
76 mg/kg tocn(1335 ug/kg dw)
1 .34 mg/kg dw
'SMiHB&lM-:0cre|ningl||i|l|
97 mg/kg dw
390 mg/kg dw
530 mg/kg dw
960 mg/kg dw
780 mg/kg tocn
5300 mg/kg tocn
65 mg/kg tocn(1,000 ug/kg dw)
not available
0.59 dw
BIlllllllIllEIGpnf j|matiorp f||
97 mg/kg dw
390 mg/kg dw
530 mg/kg dw
960 mg/kg dw
780 mg/kg tocn(13 mg/kg dw)
5300 mg/kg tocn(69 mg/kg dw)
llllilllli|;llll!
35 mg/kg tocn(500 ug/kg dw)
76 mg/kg tocn(1335 ug/kg dw)
1.34 mg/kg dw
dw = dry weighttocn = total organic carbon normalized* low molecular weight polynuclear aromatic hydrocarbons** high molecular weight polynuclear aromatic hydrocarbons
Page 4 of 4

Calculation of West Waterway Screening Levels
Station
ToddTS-36TS-37TS-38TS-43
WWTBT-01TBT-02TBT-03TBT-04TBT-05TBT-06TBT-07TBT-08TBT-10TBT-11TBT-13TBT-14TBT-16TBT-17TBT-18TBT-19TBT-20TBT-21TBT-22TBT-23TBT-24TBT-25TBT-27TBT-28TBT-30
SRIWW-01WW-02WW-03WW-04WW-05WW-06WW-07WW-08WW-09WW-10WW-11
Arsenic
mg/kg
Copper
mg/kg
Lead
mg/kg
Mercury
mg/kg're-Remedial Design Investigations • — <
19151212
166126143173
TBT Bioaccum StudyMAMAMAMANAMANANANANANANANANANANANANANANANANANANANA
NANANANANANANANANANANANANANANANANANANANANANANANANA
1491078182
NANANANANANANANANANANANANANANANANANANANANANANANANA
0.80.40.80.9
NANANANANANANANANANANANANANANANANANANANANANANANANA
Supplemental Remedial Investigation10
12.213.127
14.615.4149.314.325
17.3
7712612420814916521486144186230
5992862351091976852
. 102245161
0.260.360.381.470.610.560.370.180.650.820.69
Zinc
mg/kg
•ty\C«i,466164186166
NANANANANANANANANANANANANANANANANANANANANANANANANA
145175157350185392171121190278220
PCBS
ug/kgOW
2. 10 f307375324247
NANANANANANANANANANANANANANANANANANANANANANANANANA
244205126400229182161179230332502
PCBs
mg/kg TOCN
eXW-1 12.5
22.220.921.3
NANANANANANANANANANANANANANANANANANANANANANANANANA
9.49.86.018.29.27.07.39.913.520.817.9
TBT
ug/kgOW
7808407501600
31730540330680660670400
8130
11001100530560210450
3500610350510570310730690310
3201246641543623721810792890890445
TBT
mg/kg TOCN
31.749.748.4137.9
5.334.926.930.037.236.540.412.31.6
17.384.0
106.839.365.118.336.9
218.849.637.254.844.927.760.347.625.4
12.359.330.524.724.927.736.844.052.455.615.9
LPAHs
mg/kg TOCN
4060.772.166.4
NANANANANANANANANANANANANANANANANANANANANANANANANA
602.562.849.3120.091.666.733.048.962.760.226.7
HPAHs
mg/kg TOCN
328496496477
NANANANANANANANANANANANANANANANANANANANANANANANANA
805.8375.2303.81267.7420.0426.9194.8274.3416.5479.4188.9
TOC
percent
2.62.12.12.22.52.62.2
2.8
RECEIVED
M A R 1 2 Z 0 0 3 v
Environmental Cleanup Office
July02 WW master 3/10/2003
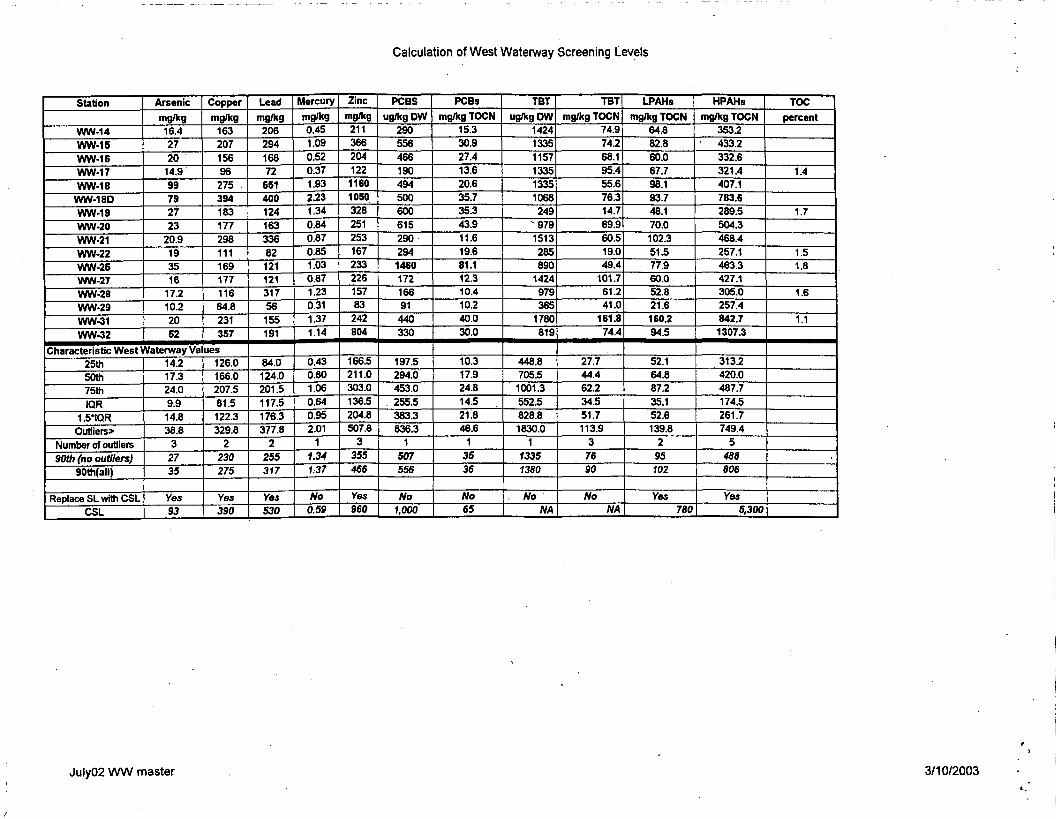
Calculation of West Waterway Screening Levels
Station
WW-14WW-15WW-16WW-17WW-18
WW-18DWW-19WW-20WW-21WW-22WW-26WW-27WW-28WW-29 1WW-31WW-32
Arsenic
mg/kg16.42720
14.9'99792723
20.9193516
17.210.22052
Copper
mg/kg16320715696
27539418317729811116917711664.8231357
Characteristic West Waterway Values25th50th I75thIQR
1.5'IQROutiiers>
Number of outliers90th (no outliers)
90th(all)
Replace SL with CSLCSL
14.217.324.09.914.838.8
32735
Yes93
126.0166.0207.581.5122.3329.8
2230275
Yes390
Lead
mg/kg20629416872
6514001241633368212112131756155191
84.0124.0 i201.5 1117.5176.3377.8
2255317
Yes530
Mercury
mg/kg0.451.090.520.371.932.231.340.840.870.851.030.871.230.311.371.14
0.430.801.060.640.952.01
11.34137
No0.59
Zinc
mg/kg21136620412211601050328251253167233226 115783
242804
166.5211.0303.0136.5204.8507.8
3355466
Ve£960
PCBS
ug/kgDW290556466190494500600615290294146017216691440330
197.5294.0453.0255.5383.3836.3
1507556
No1,000
PCBa
mg/kg TOCN15.330.927.413.620.635.735.343.911.619.681.112.310.410.240.030.0
10.317.924.814.521.846.6
13536
No65
TBTug/kgDW
142413351157133513351068249
"9791513285890
1424979365
1780819
448.8705.51001.3552.5828.81830.0
173351380
. NoNA
TBTmg/kg TOCN
74.974.268.195.455.676.314.769.960.519.049.4
101.761.241.0
161.874.4
27.744.462.234.551.7113.9
37690
NoNA
LPAHs
mg/kg TOCN64.882.860.067.798.193.748.170.0102.351.577.960.052.821.6160.294.5
52.164.887.235.152.6139.8
295102
Yes780
HPAHs
mg/kg TOCN353.2433.2332.6321.4407.1783.6289.5504.3468.4257.1463.3427.1305.0257.4842.71307.3
313.2420.0487.7174.5261.7749.4
5488806
Yes5,300
TOC
percent
1.4
1.7
1.51.8
1.6
1.1
July02 WW master 3/10/2003