remedial investigation remediation · pdf file2.2.1 field activities – landfill cap ......
TRANSCRIPT

PROJECT SITE:
BLUE ISLAND NORTHEAST MIXED-USE COMMERCIAL PARK VINCENNES AVENUE & 119TH STREET BLUE ISLAND, COOK COUNTY, ILLINOIS
LPC #0310245119 FORMER LANDFILL – WEST PARCEL
Parcel A: USEPA 2011 CLEANUP GRANT #BF00E00896A‐0 Revolving Loan Fund #BF00E965250-01-4
Parcel C: Revolving Loan Fund #BF00E965250-01-4 Parcel D: USEPA 2009 CLEANUP GRANT #BF00E91501‐1
Revolving Loan Fund #BF00E965250-01-4 Parcel E: Revolving Loan Fund #BF00E965250-01-4
PREPARED FOR:
CITY OF BLUE ISLAND 13051 SOUTH GREENWOOD AVENUE
BLUE ISLAND, ILLINOIS
PREPARED BY:
V3 COMPANIES
7325 JANES AVENUE WOODRIDGE, ILLINOIS 60517
630.724.9200
AUGUST 8, 2013
ILLINOIS SITE REMEDIATION PROGRAM
REMEDIAL INVESTIGATION, REMEDIATION OBJECTIVES REPORT
& REMEDIAL ACTION PLAN
RI, ROR and RAP V3 Companies • ii Blue Island Northeast Mixed-Use Commercial Park, Blue Island, IL August 2013
This report has been prepared by V3 Companies (V3), on behalf of the City of Blue Island (Remediation Applicant), in conformance with the requirements of 35 IAC Sections 740.425, 740.440, 740.445, and 740.450 for the purpose of documenting completion of the Remedial Investigation, Remediation Objectives Report and Remedial Action Plan, for the Remediation Site referred to as Blue Island Northeast Mixed-Use Commercial Park, IEPA BOL Site No. 0310245119.
Prepared by:
Kristine J. Wright
Environmental Scientist
Rachael K. Berthiaume, P.E., LEED AP
Project Engineer
Craig McCammack, P.G.
Senior Project Manager
Approved by:
Keith R. Oswald, P.E.
Director – Environment & Geosciences
RI, ROR and RAP V3 Companies • iii Blue Island Northeast Mixed-Use Commercial Park, Blue Island, IL August 2013
TABLE OF CONTENTS ......................................................................................................................................................................... 1
EXECUTIVE SUMMARY ............................................................................................. viii
1.0 INTRODUCTION .................................................................................................. 1 1.1 BACKGROUND ............................................................................................................. 1 1.2 REPORT ORGANIZATION ............................................................................................ 2 1.3 RECOGNIZED ENVIRONMENTAL CONDITIONS (RECs) ............................................ 3 1.4 IDENTIFIED DATA GAPS .............................................................................................. 5
2.0 SUPPLEMENTAL / REMEDIAL INVESTIGATION .............................................. 6 2.1 INVESTIGATION OBJECTIVES AND SAMPLING PLANS ........................................... 6
2.1.1 Landfill Cap Investigation ................................................................................... 6 2.1.2 Parcels A, E, D and C – Remedial Investigation / PCBs Delineation ................ 6
2.2 DOCUMENTATION OF FIELD ACTIVITIES .................................................................. 7 2.2.1 Field Activities – Landfill Cap ............................................................................. 7 2.2.2 Field Activities – Parcels A, E, D and C .............................................................. 8
2.3 INVESTIGATION RESULTS / ENDANGERMENT ASSESSMENT ................................ 9 2.3.1 Observed Subsurface Conditions ...................................................................... 9 2.3.2 Contaminants of Concern (COCs), Distribution / Nature of Contamination ...12
3.0 REMEDIAL OBJECTIVES EVALUATION ......................................................... 14 3.1 BASELINE TACO EVALUATION (PRE-REMEDIATION) .............................................14 3.2 BASELINE TACO CONDITIONS ..................................................................................16
3.2.1 Site COCs ............................................................................................................16 3.2.2 Migration Pathways, Receptors And Exposure Routes ...................................16 3.2.3 Groundwater Classification ...............................................................................17
3.3 TACO TIER 1 EVALUATION ........................................................................................17 3.3.1 REC 1: Historical Landfill Operations – Existing Landfill Cap .........................18
3.3.1.1 Soil Ingestion Exposure Route Evaluation – 95% UCLs ............... 21 3.3.1.2 Arsenic – 95% UCLs ......................................................................... 21
3.3.1.3 Lead – 95% UCLs.............................................................................. 23 3.3.1.4 Benzo(a)anthracene – 95% UCLs .................................................... 24
3.3.1.5 Benzo(a)pyrene – 95% UCLs ........................................................... 25 3.3.1.6 Benzo(b)flouranthene – 95% UCLs ................................................. 26 3.3.1.7 Dibenzo(a,h)anthracene – 95% UCLs ............................................. 27
3.3.1.8 Indeno(1,2,3-c,d)pyrene – 95% UCLs .............................................. 28 3.3.2 REC 1: Historic Landfill Operations – Landfill Materials ..................................29 3.3.3 REC 1: Historic Landfill Operations – Outside / Adjacent to Landfill ..............33 3.3.4 REC 2: Historical USTs / ASTs ...........................................................................34 3.3.5 REC 1: Historic Landfill Operations – Groundwater .........................................36 3.3.6 REC 1: Historic Landfill Operations – Indoor Inhalation ..................................36
3.4 TACO TIER 2 EVALUATION ........................................................................................37 3.5 TIER 3 EXPOSURE ROUTE EVALUATION .................................................................38
3.5.1 Groundwater Exposure Route Exclusion ..........................................................39 3.5.2 Impractical Remediation ....................................................................................40
3.6 REMEDIATION OBJECTIVES ......................................................................................43 3.7 PCBs RISK ASSESSMENT ..........................................................................................44
RI, ROR and RAP V3 Companies • iv Blue Island Northeast Mixed-Use Commercial Park, Blue Island, IL August 2013
4.0 REMEDIAL ACTION PLAN ............................................................................... 47 4.1 REMEDIATION GOALS ................................................................................................47 4.2 SOIL MANAGEMENT ZONE ........................................................................................48 4.3 SITE PREPARATION ...................................................................................................49 4.4 Parcel D: REC 2 – TPH Dig and Haul ..........................................................................49
4.4.1 Remediation Overview .......................................................................................49 4.4.2 Excavation and Soil Removal ............................................................................50 4.4.3 Remediation Verification Sampling ...................................................................50 4.4.4 Excavation Backfill .............................................................................................50 4.4.5 Post Remediation Monitoring ............................................................................50
4.5 ENGINEERED BARRIERS AND INSTITUTIONAL CONTROLS ..................................51 4.5.1 Engineered Barriers ............................................................................................51
4.5.1.1 Type I Engineered Barriers .............................................................. 51 4.5.1.2 Type II Engineered Barrier ............................................................... 53
4.5.2 Institutional Controls ..........................................................................................54 4.6 PCBs – MINIMUM 3-FEET THICK CLAY SOIL BARRIER ...........................................54
4.6.1 Remediation Overview – Cleanup Proposal......................................................54 4.6.2 Regulatory Considerations ................................................................................54 4.6.3 Maintenance of Clean Cover Soils as a Barrier ................................................55
4.7 LANDFILL GAS / INDOOR INHALATION RISK MITIGATION .....................................55 4.7.1 Construction of Buildings ..................................................................................55 4.7.2 Installation of Underground Utilities .................................................................55 4.7.3 Venting of Underground Utilities and Pavement Areas ...................................56
4.8 REMEDIAL ACTION COMPLETION REPORT (RACR) ...............................................56 4.9 NO FURTHER REMEDIATION (NFR) LETTER ............................................................56
5.0 CONCLUSIONS ................................................................................................. 57
6.0 LICENSED PROFESSIONAL ENGINEER AFFIRMATION ............................... 59
RI, ROR and RAP V3 Companies • v Blue Island Northeast Mixed-Use Commercial Park, Blue Island, IL August 2013
LIST OF FIGURES
Remedial Investigation
Figure 1.1 Site Location Map Figure 1.2 Site Vicinity Map Figure 1.3 Conceptual Site Model Schematic Figure 2.1 Soil Boring Location Map – 2010 Cap Investigation Figure 2.2 Soil Boring, Seep and Well Location Map – 2012 Remedial Investigation Figure 2.3 Groundwater Contour Map Figure 2.4 Tier 1 Soil Exceedances (SVOCs) – 2010 Cap Investigation Figure 2.5 Tier 1 Soil Exceedances (Metals) – 2010 Cap Investigation Figure 2.6 Tier 1 Soil Exceedances (VOCs) – 2012 Remedial Investigation Figure 2.7 Tier 1 Soil Exceedances (SVOCs) – 2012 Remedial Investigation Figure 2.8 Tier 1 Soil Exceedances (PCBs) – 2012 Remedial Investigation Figure 2.9 Tier 1 Soil Exceedances (Metals) – 2012 Remedial Investigation Figure 2.10 Tier 1 Groundwater Exceedances – Class II Groundwater
Remediation Objectives and Remedial Action Plan
Figure 3.1 Soil Boring Location Map – All Cap Data Figure 3.2 Soil Boring Location Map – Parcels A, E, D & C (No Cap Data) Figure 3.3 Soil Boring Location Map – All PCBs Data Figure 4.1 Parcel D – REC 2: Petroleum Impacts Remediation Figure 4.2 Soil Management Zone / Engineered Barrier Limits Figure 4.3 Proposed Engineered Barriers - Typical Cross-Sections Figure 5.1 Clay Cap / Proposed Barrier – PCBs
LIST OF TABLES
Remedial Investigation
Table 1.1 2010-2012 Investigations on West Parcel – Summary of Soil and Groundwater Tier 1 Exceedances
2010 Cap Investigation Table 2.1 Soil Analytical Results (VOCs) – 2010 Cap Investigation Table 2.2 Soil Analytical Results (SVOCs) – 2010 Cap Investigation Table 2.3 Soil Analytical Results (PCBs) – 2010 Cap Investigation Table 2.4 Soil Analytical Results (Pesticides) – 2010 Cap Investigation Table 2.5 Soil Analytical Results (Inorganics, Misc.) – 2010 Cap Investigation 2012 Remedial Investigation Table 2.6 Soil Analytical Results (VOCs) – 2012 Remedial Investigation Table 2.7 Soil Analytical Results (SVOCs) – 2012 Remedial Investigation Table 2.8 Soil Analytical Results (PCBs) – 2012 Remedial Investigation
RI, ROR and RAP V3 Companies • vi Blue Island Northeast Mixed-Use Commercial Park, Blue Island, IL August 2013
Table 2.9 Soil Analytical Results (Inorganics, Misc.) – 2012 Remedial Investigation Table 2.10 Surface Water (Ditch) Analytical Results (VOCs, PCBs, Inorganics) –
2012 Remedial Investigation Table 2.11 Surface Water (Ditch) Analytical Results (SVOCs) – 2012 Remedial
Investigation 2012 Remedial Investigation - Groundwater Table 3.1 Groundwater Analytical Results (VOCs, PCBs, Pesticides, Inorganics) Table 3.2 Groundwater Analytical Results (SVOCs) Table 3.3 Groundwater Analytical Results (Indoor Inhalation) Table 3.4 Groundwater Elevations
Remediation Objectives and Remedial Action Plan
Table 4.1 2006-2012 Investigations on West Parcel – Summary of Soil and Groundwater Tier 1 Exceedances
West Landfill Table 5.1 Soil Analytical Results (VOCs) – All Cap Data 2006-2010 for West Landfill Table 5.2 Soil Analytical Results (SVOCs) – All Cap Data 2006-2010 Investigation
for West Landfill Table 5.3 Soil Analytical Results (PCBs) – All Cap Data 2006-2010 Investigation for
West Landfill Table 5.4 Soil Analytical Results (Pesticides) – All Cap Data 2006-2010
Investigation for West Landfill Table 5.5 Soil Analytical Results (Inorganics, Misc.) – All Cap Data 2006-2010
Investigation for West Landfill Table 6.1 Groundwater Analytical Results (VOCs, PCBs, Pesticides, Inorganics) –
CSI and RI Data Table 6.2 Groundwater Analytical Results (SVOCs) – CSI and RI Data Parcel A, E, D, C Table 7.1 Soil Analytical Results (VOCs) – CSI and RI Data Table 7.2 Soil Analytical Results (SVOCs) – CSI and RI Data Table 7.3 Soil Analytical Results (Pesticides) – CSI and RI Table 7.4 Soil Analytical Results (Inorganics, Misc.) – CSI and RI Data Table 7.5 Soil Analytical Results (OM, Foc) – CSI and RI Data Table 8.1 Soil Analytical Results (PCBs) – Cap, CSI and RI Data for West Landfill
APPENDICES Appendix A Supplemental Sampling and Analytical Plan Appendix B Soil Boring & Well Construction Logs Appendix C Hydraulic Conductivity Test Data
RI, ROR and RAP V3 Companies • vii Blue Island Northeast Mixed-Use Commercial Park, Blue Island, IL August 2013
Appendix D Laboratory Analytical Reports
D.1 Lab Accreditation and Certification D.2 Laboratory Analytical Results
Appendix E Photographic Documentation Appendix F 95% UCL – Landfill Cap Calculations & Documentation
F.1 Arsenic UCLs F.2 Lead UCLs F.3 Benzo(a)anthracene UCLs F.4 Benzo(a)pyrene UCLs F.5 Benzo(b)fluoranthene UCLs F.6 Dibenzo(a,h)anthracene UCLs F.7 Indeno(1,2,3-c,d)pyrene UCLs
Appendix G Tier 2 Calculations
G.1 Supporting Information for Tier 2 RO Determination
G.2 Tier 2 Groundwater Modeling Input/Output Summary
G.3 Tier 2 Simulation Figure
G.4 Tier 2 Calculations
Appendix H Engineered Barrier - Geotextile Documentation
H.1 Geotextile Specifications
Appendix I Landfill Gas Observations
RI, ROR and RAP V3 Companies • viii Blue Island Northeast Mixed-Use Commercial Park, Blue Island, IL August 2013
EXECUTIVE SUMMARY Introduction V3 Companies has prepared this Remedial Investigation Report, Remediation Objectives
Report and Remedial Action Plan (RI/ROR/RAP) on behalf of the City of Blue Island, for the
Remediation Site referred to as the Blue Island Northeast Mixed-Use Commercial Park –
Western Parcels A, E, D and C (Site). The Site is located at the southeast corner of the
intersection of Vincennes Avenue and 119th Street, Blue Island, Illinois.
Background: The Site was enrolled in the Site Remediation Program (SRP) in in August 2006
to secure a “comprehensive” No Further Remediation (NFR) letter. In March 2010, V3
submitted a Comprehensive Site Investigation Report (CSI) for IEPA review. The CSI listed
several data gaps to be addressed as part of a supplemental investigation. V3 and the IEPA
Office of Site Evaluation (OSE) performed an environmental investigation of the landfill cap on
the western portion of the former landfilI and a remedial investigation to address the data gaps
listed in the CSI. This report addresses the investigations and TACO evaluation performed in
pursuit of a comprehensive NFR letter for the Site. In addition, this report also includes the
remedial action plan (RAP) to address impacts identified at the Site.
Report Organization: The report has been organized to initially present (Section 2.0) the results of investigations performed to address data gaps. It references appropriate areas of the report where additional data and passages related to the discussed activities are presented. This section also discusses additional site data not previously available within the CSIR. Section 3.0 updates the baseline conditions at the Site that were determined through the CSI. The later discussions establish ROs, and the areas requiring remediation and/or institutional controls to achieve site-specific ROs (Section 4.0). The following Recognized Environmental Conditions (RECs) have been previously identified at the Site and are grouped on the basis of their general operational, historic and/or physical nature.
REC 1 – Historical Landfill Operation
REC 2 – Historical ASTs/USTs
REC 3 – Historical Railroad Spurs
REC 4 – Adjoining Petroleum Storage and Use
This report addresses RECs 1 and 2 on the Western Parcel. RECs 3 and 4 have been
addressed under the CSI.
As part of the CSI, V3 identified the following data gaps:
Additional characterization of COCs within the landfill cap to determine whether it may
be used as an engineered (earthen) barrier to exclude exposure pathways. [Note: As
mentioned in Section 1.2, the investigation of the landfill cap on the Western Landfill
(which includes Parcels A, E, D and C) was completed in 2010; the findings will be
discussed later in this report.]
RI, ROR and RAP V3 Companies • ix Blue Island Northeast Mixed-Use Commercial Park, Blue Island, IL August 2013
Additional characterization of COCs within the landfill materials to satisfy the
requirements of 35 IAC 742.300 (Subpart C: Exposure Route Evaluation). As such,
TCLP RCRA metals, PCBs and total petroleum hydrocarbons (TPH) analyses, as well
as the delineation of potential free product was performed, as applicable to each
parcel.
Obtain additional data for Tier 2 / 3 analyses related to VOCs, PAHs and metals
detected in soils and/or groundwater, to help define closure strategies for various
areas of the Site.
As mentioned above, collect TPH samples from soil samples that display field
indications of potential petroleum saturation, to determine if soil attenuation capacity
has been exceeded.
Further define the extent and source of heavy staining and free product observed in
soil boring BI-GP-24 (Parcel D). Define the extent of benzene and xylenes present
above soil saturation limits in the vicinity of boring BI-GP-19 (Parcel A).
Determine if the abandoned sewer observed at boring BI-GP-22 (Parcel D, near boring
BI-GP-24) represents an off-site migration pathway.
Delineate the extent of TSCA level PCBs at boring BI-GP-21 (Parcel C).
Install additional monitoring wells inside and along the perimeter of the landfill to
further characterize potential groundwater impacts and flow at the Site. Conduct a
more thorough investigation and review of potential leachate seepage from the landfill
faces.
Supplemental / Remedial Investigation Based on an evaluation of available Site data, a Sampling Plan and Remedial Investigation /
PCBs Delineation (RI/D) Work Plan was developed to obtain the data necessary to accomplish
the following objectives:
Provide comprehensive analysis of the landfill cap,
Determine the extent of the landfill with more accuracy,
Subpart C: Exposure Pathway Evaluation. Provide additional analytical data to satisfy
the requirements of 35 IAC 742.300 (Subpart C: Exposure Route Evaluation), including
the TCLP analysis of RCRA metals, and to define associated remediation requirements.
TSCA PCBs Delineation. Vertically and horizontally delineate / define the extent of
TSCA level PCBs to, in conjunction with existing site characterization data and
anticipated end use plans, establish the basis for risk assessments and cleanup plans.
Per past discussions with USEPA Region 5, TSCA Remedial Program representatives,
vertical delineation by sampling intervals below and above known TSCA levels PCBs,
and horizontal delineation by sampling neighboring borings is required.
Free Product / Soil Saturation Limits. Delineate the extent of the heavy staining and
apparent free product observed in BI-GP-24 (Parcel D), and the extent of benzene and
xylenes present above soil saturation limits in the vicinity of BI-GP-19 (Parcel ‘A’) to
define associated remediation requirements.
RI, ROR and RAP V3 Companies • x Blue Island Northeast Mixed-Use Commercial Park, Blue Island, IL August 2013
Groundwater / Leachate. Define remediation requirements and allow the development
of site-specific remediation objectives, install and sample permanent and temporary
groundwater / leachate monitoring wells within the limits of the landfill and respective
parcels.
Perimeter Groundwater. Install and sample groundwater monitoring wells along the
perimeter of the landfill, with the following objectives:
– supplement existing perimeter well data to confirm that COCs are not migrating
beyond the limits of the Site;
– obtain the data needed, in conjunction with the aforementioned (and existing)
groundwater / leachate wells, to map groundwater surfaces within and adjacent
to the landfill; and
– obtain the data needed to further define remediation requirements and allow the
development of Tier 2 / 3 site-specific remediation objectives.
Seeps Evaluation. Perform additional visual site inspections to determine whether there is evidence of leachate seepage along the southern face of the former landfill. To demonstrate that COCs are not migrating beyond the limits of the Site, collect samples and perform analysis of leachate from seeps (if any identified), and/or obtain surface water samples from the drainage ditches along the southern face of the former landfill.
In April 2010, V3 performed the supplemental investigation to address data gaps identified in CSIR. In November-December 2012, and July 2013, V3 conducted the RI/D. The sampling included soil, leachate and groundwater, and analysis of varying COCs at multiple locations. In addition, a hydrologic investigation was conducted to determine groundwater flow and hydraulic conductivity.
The observed conditions of the supplemental investigation and the RI/D are summarized in
Section 2.4.
Remediation Objectives Evaluation The Remediation Objectives evaluation includes data collected through all of the site investigations, including the comprehensive site investigation, cap investigation and remedial investigation and PCBs delineation (RI/D). The first phase of a TACO evaluation is to determine if complete exposure routes exist pursuant to Illinois Administrative Code (IAC) 742.300 (Subpart C: Exposure Route Evaluation). Where a complete exposure pathway (source – transport – availability for exposure – receptor) does not exist, development of ROs for that exposure route is not required. An exposure route evaluation was accomplished on a constituent specific basis. The Site investigations indicate COCs are largely confined to the landfill limits and the horizontal and vertical extent of COCs has been generally determined. Evaluation of Site data indicates that conditions achieve the TACO Subpart C criteria for demonstrating that source material is present. The evaluation of Site data indicates the following:
Elevated TPH was identified at Parcel D (outside of the landfill limits). The extent is
delineated.

RI, ROR and RAP V3 Companies • xi Blue Island Northeast Mixed-Use Commercial Park, Blue Island, IL August 2013
– Apparent petroleum free product was observed in boring BI-GP-24 on Parcel D.
Total petroleum hydrocarbon (TPH) analysis was performed at this location
(sample depth of 10-12 feet) to determine if the soil attenuation capacity has
been exceeded. The concentration of TPH is 1,340 mg/kg, which is less than
soil attenuation capacity as specified by the conservative TACO default value of
0.2% (or 2,000 mg/kg) and the calculated site-specific Foc of 9,100 mg/kg.
– Parcel D – Soil sample BI-GP-318 (12-13) has a high TPH (23,000 mg/kg), which
will be addressed in the Remedial Action Plan, Section 4.0. A sample below it
from 15-16 feet has TPH concentration of 2,598 mg/kg which exceeds the
fractional organic carbon (Foc) default of 2,000 mg/kg for subsurface soils, but is
well below the calculated site-specific Foc of 9,100 mg/kg. Nearby sample BI-
GP-317 (15-16) contained TPH of 1189 mg/kg and screening of soils from
borings surrounding BI-GP-318 indicates that the area of elevated TPH is
isolated at boring BI-GP-318.
The soil saturation limit for benzene (870 mg/kg), ethylbenzene (400 mg/kg) and xylenes
(320 mg/kg) has been exceeded within the landfill materials.
– Parcel A: BI-GP-19 at 44-46 ft (benzene 881 mg/kg and xylenes 1130 mg/kg)
and BI-GP-304 at 53-55 ft (ethylbenzene 1100 mg/kg and xylenes 2300 mg/kg).
Screening of nearby boring BI-SB-01 did not indicate fuel hydrocarbon odors
(just septic odors), but did contain elevated PID readings.
– Parcel C: BI-GP-309 at 46-48 ft (ethylbenzene 520 mg/kg and xylenes 970
mg/kg). Nearby samples at BI-GP-308, BI-SB-07 and BI-GP-21 did not identify
VOCs above the soil saturation limit.
PCBs concentrations in excess of 50 parts per million were encountered in the following
location on the West Parcel.
– Concentrations of PCBs in BI-GP-21 (46-48) were 453 ppm. V3 delineated this
PCBs impact. Refer to Section 3.7.
Evaluation of Site data indicates that conditions in the RECs achieve the TACO Subpart C
criteria for demonstrating that source material is not present for the following categories:
No characteristics of reactivity have been identified (see Tables 5.5 and 7.4).
Soil does not exhibit pH values less than or equal to 2.0 or greater than or equal to 12.5
(see Tables 5.5 and 7.4).
There is no evidence of hazardous metals at the Site (see Tables 5.5 and 7.4).
As a result, pathway exclusion is allowable per IAC Section 742.300 (Subpart C: Exposure
Route Evaluation), once the aforementioned Subpart C exceptions are addressed, as discussed
in Section 3.5.2 and in the Remedial Action Plan (Section 4.0).
Site COCs: The site investigations include a delineation of the vertical and horizontal extent of COCs. The delineation of COCs was determined through subsurface investigations and analytical testing. The detected Site COCs include:
Soils: The predominant soil concerns are present within the landfill materials. Overall,
soil COCs are summarized as follows:

RI, ROR and RAP V3 Companies • xii Blue Island Northeast Mixed-Use Commercial Park, Blue Island, IL August 2013
– SVOCs (mainly PAHs), VOCs (limited chlorinated solvents and BTEX), PCBs,
and select heavy metals. These COCs are predominantly present within the
landfill materials.
– COCs within the landfill cap are less common, primarily consist of PAHs and
select heavy metals, and are present at relatively low concentrations. VOCs and
a single pesticide concentration are also present.
Groundwater / Leachate: VOCs, SVOCs (mainly PAHs), metals and PCBs were
identified in water collected from within the landfill limits (leachate), rather than from the
monitoring locations along the landfill perimeter. The perimeter groundwater wells only
identified three elevated metals concentrations.
Remediation Objectives: The following site ROs, along with necessary remedial measures (engineered barriers and dig and haul activities) and institutional controls, are proposed to exclude exposure pathways at the Site:
Tier 1 industrial-commercial and construction worker ROs for the soil inhalation and
soil ingestion exposure pathways;
Tier 2 soil component of the Class II groundwater ingestion, Tier 2 Class II direct
ingestion groundwater ROs and Tier 2 construction worker inhalation ROs.
– The City of Blue Island maintains a groundwater ordinance which prohibits the
use of groundwater for potable purposes. To exclude the groundwater ingestion
route, the ordinance, accepted by IEPA for use an institutional control, will be
invoked as a groundwater use restriction at the Site and potentially impacted off-
site areas, and will move the compliance point to and beyond the Site
boundaries.
Tier 3 groundwater pathway exclusion and impractical remediation evaluations.
Based on the approval of Tier 1, 2 and 3 evaluations and the implementation of the remedial
actions (engineered barriers and dig and haul activities) and the following institutional controls,
the Site can qualify for an NFR determination:
Restrict the property use to industrial-commercial;
Restrict all subsurface construction to qualified personnel (i.e., in accordance with applicable OSHA regulations) and provide notification to construction workers of site conditions as applicable to specified areas;
Provide pathway exclusion for the ingestion exposure route through maintenance of engineered barriers;
Require any existing or potential buildings located over the current extent of groundwater contamination to have a full concrete slab-on-grade floor or full concrete basement floor and walls with no sump(s);
Prevent the installation and/or use of potable wells and restrict groundwater usage at the Site, and in potentially impacted off-site areas, by using the City of Blue Island community-wide groundwater ordinance as an institutional control for excluding groundwater use.
RI, ROR and RAP V3 Companies • xiii Blue Island Northeast Mixed-Use Commercial Park, Blue Island, IL August 2013
Remedial Action Plan The RAP outlines the remedial actions intended to address the environmental issues associated
with the former Site operations. The primary remedial goals of the RAP include:
Remediate the exceedance of Subpart C source material criteria resulting from elevated
TPH concentrations at Parcel D, REC 2.
In accordance with past USEPA Region 5 discussions and the risk-based approval
process of 40 CFR 761.61(c), utilize the existing landfill cap to provide a minimum 3-feet
clay cover to address exposure risks results from PCBs present at depth within the
landfill materials.
Establish approved engineered barrier types that may be used to address TACO soil
ingestion exposure risks resulting from COCs other than PCBs; these barriers will
include both hard surfaces and prescriptive and “alternative” earthen barriers, and will be
used in varying capacities dependent on final land use plans.
Groundwater pathway exclusion using the City of Blue Island municipal groundwater
ordinance.
Mitigate LFG gas and indoor inhalation risks; the RAP provided herein lays out the
conceptual approach for addressing these concerns. Specific designs and BCTs to be
provided as amendment(s) to the RAP once respective land use plans are defined.
Parcel-specific land plans are not yet available. For the remedial actions that are dependent on
redevelopment, the RAP provides options for addressing the potential industrial-commercial
scenarios that are likely to occur.
Soil verification sampling will be performed following any soil removal. Following the installation of engineered barriers, a Remedial Action Completion Report (RACR) will be submitted to the IEPA SRP for Site closure. This report shall provide the basis for the RA’s pursuit of a “comprehensive” No Further Remediation (NFR) letter. [Note: In accordance with past discussions, cleanup and redevelopment of the Site will occur in phases. As a result, it’s anticipated that separate, and potentially Interim, RACRs may be submitted for specific parcels. It is likely that the RA will seek individual NFR Letters for separate parcels.]
RI, ROR and RAP V3 Companies • 1 Blue Island Northeast Mixed-Use Commercial Park, Blue Island, IL August 2013
1.0 INTRODUCTION V3 Companies has prepared this Remedial Investigation Report, Remediation Objectives
Report and Remedial Action Plan (RI/ROR/RAP) on behalf of the City of Blue Island, for the
Remediation Site referred to as the Blue Island Northeast Mixed-Use Commercial Park –
Western Parcels A, E, D and C (the “Site”). The Site consists of approximately 48 acres located
at the southeast corner of the intersection of Vincennes Avenue and 119th Street, Blue Island,
Cook County, Illinois (Figures 1.1 and 1.2). The RI/ROR/RAP has been developed in
conformance with the requirements of 35 Illinois Administration Code (IAC) Part 740 Section
740.420 and 740.425, Sections 740.440, 740.445 and 740.450 to accomplish the following:
Complete the presentation of site remedial investigation and characterization data;
Present remediation objectives (ROs) for soil and groundwater developed in accordance with 35 IAC Part 742 - Tiered Approach to Corrective Action Objectives (TACO);
Present the proposed remedial goals; and
Support closure of the Site through the Illinois EPA (IEPA) Site Remediation Program (SRP), and the Remedial Applicant’s pursuit of a “comprehensive” NFR letter for the parcels.
The scope of work was performed in accordance with a USEPA approved Quality Assurance Project Plan (QAPP), which V3 prepared on behalf of the City of Blue Island. The QAPP is the guiding document for Standard Operating Procedures (SOPs) related to field activities, equipment, and laboratory sample analysis. This report and the work performed as described herein were funded by the following resources:
Parcel A: USEPA 2011 Cleanup Grant #BF00E00896A‐0 and Revolving Loan Fund Cooperative Agreement # BF00E965250-01-4 Parcel C: Revolving Loan Fund Cooperative Agreement # BF00E965250-01-4 Parcel D: USEPA 2009 CLEANUP GRANT #BF00E91501-1 and Revolving Loan Fund Cooperative Agreement # BF00E965250-01-4 Parcel E: Revolving Loan Fund Cooperative Agreement # BF00E965250-01-4
1.1 BACKGROUND
The Site was enrolled in the SRP in August 2006. The purpose of the enrollment is to secure “comprehensive” No Further Remediation (NFR) letters for the Site. Currently, much of the Site is vacant or underutilized industrial land, while a portion is being utilized for commercial and light industrial operations. The planned reuse of the Site is retail (the northern frontage along 119th Street) and industrial (the balance of the Site). From June 2006 to August 2009, V3 performed several subsurface investigations at the Site, and compiled historical and site investigation data gathered by others. V3 submitted a Comprehensive Site Investigation Report (CSIR) to IEPA for review and comment in March 2010, following a pre-review meeting with IEPA on February 25, 2010. The purpose of the meeting was to discuss the CSIR findings, next steps and how the RA planned to move forward considering potential redevelopment phasing and related issues. IEPA provided comments to the CSIR in a letter dated April 27, 2010. The CSIR outlined data gaps to be filled during
RI, ROR and RAP V3 Companies • 2 Blue Island Northeast Mixed-Use Commercial Park, Blue Island, IL August 2013
subsequent remedial investigations, and IEPA review comments included some additional data requests at several Site locations. On January 21, 2011, V3 and the City of Blue Island attended a meeting with USEPA Region 5, TSCA Remedial Program representatives (Mr. Peter Ramanauskas and Mr. Jonathan Adenuga) to discuss requirements for the characterization and risk-based cleanup of TSCA level PCBs identified at several locations within the former landfill. In accordance with this discussion, the City of Blue Island has elected to address the identified PCB risks using the risk-based approval process under 40 CFR 761.61(c). As a result, this report is also being provided to USEPA Region 5 for comment related to the delineation and additional characterization of TSCA level PCBs. Further, since submittal of the CSIR, per discussions with IEPA and in order to address one of the data gaps noted within the CSIR, V3 and the IEPA Office of Site Evaluation (OSE) performed an environmental investigation of the landfill cap on the western portion of the former landfill. The data obtained from this 2010 investigation is being provided for IEPA review and comment as supplemental data within this Remedial Investigation and Remediation Objectives Report. At this time, the RA intends to move forward with the remediation of the Site on a priority, parcel by parcel basis. As such, the subject (and current priority) of the investigative activities within this report relate to Parcels A, C, D and E (Figure 1.2). In response to the data gaps noted within the CSIR, and IEPA and USEPA comments, a Remedial Investigation was performed in 2012–13. The results of this investigation are presented herein.
1.2 REPORT ORGANIZATION
The following sections of the report are organized in the following manner:
Section 2 – Supplemental / Remedial Investigation: Presents site characterization results for the landfill cap soil investigation performed on behalf of the City of Blue Island by V3 and the IEPA OSE. This section also provides results of the Supplemental / Remedial Investigation performed to delineate known impacts and address data gaps identified in the CSIR. Within Section 2.0, other sections are referenced where additional data and related activities are documented and presented. Section 3 – Remediation Objectives Evaluation: Provides a “pre-remediation” TACO evaluation, including a discussion of applicable exposure routes and related evaluations, and then discusses the Tier 1, 2 and 3 ROs selected for closure of the Site. The section briefly discusses those areas requiring active remediation to achieve specified site ROs. Section 4 – Remedial Action Plan: Summarizes the remediation methods and technologies proposed to achieve ROs at the Site. In addition, this section discusses in more detail the engineering and institutional controls proposed to exclude exposure routes. Section 5 – Conclusions: Summarizes the Site’s planned future use and the appropriateness of the Site investigation, proposed remediation objectives and exclusion of exposure routes as the basis for the receipt of an NFR letter for the Site.

RI, ROR and RAP V3 Companies • 3 Blue Island Northeast Mixed-Use Commercial Park, Blue Island, IL August 2013
Section 6 – Licensed Professional Engineer (LPE) Affirmation: Affirmation by the LPE directing the investigation of the Site.
1.3 RECOGNIZED ENVIRONMENTAL CONDITIONS (RECs)
The following summarizes the resulting Site RECs designated in the CSI, referenced to the Western Parcels:
REC 1 – Historical Landfill Operation: The Site was operated as an unregulated
landfill by Sexton from 1952-1966. A reported 3,129,000 cubic yards of mixed
municipal, commercial, and industrial waste of unknown origin was landfilled at the
Site during the tenure of Sexton. In addition, fill material of an unknown origin was
used was used to cap landfill materials after the landfill ceased operations. Leachate
of an unknown chemical composition may be impacting shallow groundwater adjacent
to the Site and an unknown amount of landfill gas has been produced.
For the sake of convenience, the site-specific investigation of REC 1 was broken into
the Western Parcels and Eastern Parcels, based on their locations relative to the
railroad that divides the two. Soil samples are divided within the landfill boundary
(landfill cap, landfill materials, native soil-bottom) and outside the landfill boundary
(adjacent native soil and fill material). Groundwater samples are also divided within
landfill boundary (leachate) and outside the landfill boundary (groundwater).
REC 2 – Historical ASTs/USTs: An iron crude oil tank (identified as not used), oil
pump, and crude oil underground tanks are depicted on the Vulcan Materials lot
(Parcel D) in a 1897 Sanborn Map. Additionally, a 40,000-gallon fuel oil tank and fuel
oil pump are located approximately in the same location in the Vulcan Material lot in a
1949 Sanborn Map. The tanks were located in an area that was not excavated for clay
materials or filled, so there is a possibility that impacts remain.
The Supplemental / Remedial Investigation discussed later in this report focuses on
RECs 1 and 2.
REC 3 – Historical Railroad Spurs: Railroad tracks are depicted on several Sanborn
maps and topographic maps between 1897 and 1953. It is common for waste oil and
herbicides containing hazardous chemicals and/or petroleum products to have been
applied to railroad tracks for dust control and to impede vegetative growth. In addition,
the wood used for tracks was typically treated with potentially hazardous chemicals.
The railroad spurs lie solely on Parcel D of the Site, and were sufficiently characterized
during the CSI. Therefore, REC 3 will no longer be treated as a stand-alone REC in
the Supplemental / Remedial Investigation.
REC 4 – Adjoining Petroleum Storage and Use: A 10,000-gallon diesel AST was
formerly located approximately 50 to 70 yards south of the Gallagher asphalt plant,
north of the current Vulcan Materials boundary. In addition, Sanborn maps indicate
that a filling station (gas station) was located just west of the Western Parcel from at
RI, ROR and RAP V3 Companies • 4 Blue Island Northeast Mixed-Use Commercial Park, Blue Island, IL August 2013
least 1958 until the mid-1970s. Also, a 550-gallon UST unrelated to the filling station
was located at the same property. The filling station was demolished in 2001/2002.
REC 4 is located north of Parcel D (outside of the Site limits). REC 4 was sufficiently characterized during the CSI and will no longer be treated as a stand-alone REC in the Supplemental / Remedial Investigation.
The designation of RECs in the CSIR was based on the following considerations:
Physical distribution of the Contaminants of Concern (COCs) in soil and groundwater
media;
Additional site characterization data requirements;
Characterization of any “source material/free product” areas;
Complete exposure routes and pathways;
Planned Future Use of Site Areas;
Pathway exclusion options;
Potential use of engineered barriers; and,
Potential Remedial Actions.
The following provides a general summary of the primary findings of the CSI:
The predominant environmental concerns at the Site are related to conditions
associated with the landfill materials placed within the former clay borrow pits on the
Eastern and Western Parcels, or activities such as petroleum product use and storage
that may have occurred adjacent to or within the former borrow pits. Issues include
isolated pockets of petroleum saturated soils or free product, isolated instances of
TSCA level PCBs and various other semi-volatile constituents and heavy metals.
The production and venting of landfill gas has been noted at the Site. Further, the
leachate present within the landfill contains varying COCs (metals, VOCs and SVOCs)
above Class II groundwater objectives.
However, the available groundwater monitoring results, and the geologic and
hydrologic observations made by V3 (and as noted within previous investigations),
indicate little evidence of off-site migration of contaminants, whether by groundwater,
leachate seepage or surface runoff. Further, the soil samples collected from native
soils underlying and adjacent to the landfill (hardpan) do not indicate the downward or
outward migration of COCs, and it appears the clay strata is functioning as an effective
containment barrier.
The full extent of the former landfill areas have been capped with clay soils of varying
thickness and origins. The cap is compacted and dense, and available analytical
sample results indicate the presence of COCs is limited, and that COCs are present in
relatively low concentrations.
Observations made during the Site Investigation, and a review of previous
investigations, suggest the cap is typically well over several feet thick across most of
the Site, and averages in excess of 6 feet thick. [Note: The CSIR indicates that the
minimum existing clay cap thickness is 2 feet. A closer review of existing site data, in
conjunction with site data collected since preparation of the CSIR, indicates that that
statement is erroneous and is hereby corrected here. The minimum cap thickness is
RI, ROR and RAP V3 Companies • 5 Blue Island Northeast Mixed-Use Commercial Park, Blue Island, IL August 2013
3.5 feet, and is located in an isolated portion of the northern most landfill extent of the
West Parcel.] Based on V3’s observations, the cap, particularly over the Western
Parcel, appears to be functioning as an effective containment barrier. The Eastern
Parcel has been subject to more subsidence and is currently poorly drained.
The more recent industrial use of the Site does not appear to have led to notable
environmental conditions. There are however, several areas outside the landfill limits
that contain “urban fill”. In these areas debris such as asphalt, concrete, brick, glass
and metal is more common and COCs such as PNAs are more prevalent.
A number of data gaps associated with RECs 1 and 2 were identified in the CSIR. As described in the following section, these data gaps became the focus of the Supplemental / Remedial Investigation as related to the Western Landfill and the parcels that are the subject of this report.
1.4 IDENTIFIED DATA GAPS
Based on the CSI results and data evaluation, and the review of Site historical data, V3
identified a number of data gaps to address in order to complete the characterization and TACO
evaluation of the Site. These data gaps are summarized as follows:
Additional characterization of COCs within the landfill cap to determine whether it may
be used as an engineered (earthen) barrier to exclude exposure pathways. [Note: As
mentioned in Section 1.2, the investigation of the landfill cap on the Western Landfill
(which includes Parcels A, E, D and C) was completed in 2010; the findings will be
discussed later in this report.]
Additional characterization of COCs within the landfill materials to satisfy the
requirements of 35 IAC 742.300 (Subpart C: Exposure Route Evaluation). As such,
TCLP RCRA metals, PCBs and total petroleum hydrocarbons (TPH) analyses, as well
as the delineation of potential free product was performed, as applicable to each
parcel.
Obtain additional data for Tier 2 / 3 analyses related to VOCs, PAHs and metals
detected in soils and/or groundwater, to help define closure strategies for various
areas of the Site.
As mentioned above, collect TPH samples from soil samples that display field
indications of potential petroleum saturation, to determine if soil attenuation capacity
has been exceeded.
Further define the extent and source of the free product observed in soil boring BI-GP-
24 (Parcel D). Define the extent of benzene and xylenes present above soil saturation
limits in the vicinity of boring BI-GP-19 (Parcel A).
Determine if the abandoned sewer observed at boring BI-GP-22 (Parcel D, near boring
BI-GP-24) represents an off-site migration pathway.
Delineate the extent of TSCA level PCBs at boring BI-GP-21 (Parcel C).
Install additional monitoring wells inside and along the perimeter of the landfill to further characterize potential groundwater impacts and flow at the Site. Conduct a more thorough investigation and review of potential leachate seepage from the landfill faces.

RI, ROR and RAP V3 Companies • 6 Blue Island Northeast Mixed-Use Commercial Park, Blue Island, IL August 2013
2.0 SUPPLEMENTAL / REMEDIAL INVESTIGATION The following subsections present the objectives and results of the Supplemental / Remedial Investigation performed to address data gaps identified previously in the CSIR, and restated in Section 1.4. Two supplemental site investigation programs were conducted following the completion of the CSIR:
Landfill Cap Investigation – 2010
Parcels A, E, D, and C - Remedial Investigation / PCBs Delineation – 2012/2013 A description of the objectives for each of these investigations is provided in the following section.
2.1 INVESTIGATION OBJECTIVES AND SAMPLING PLANS
2.1.1 Landfill Cap Investigation
A Supplemental Investigation (SI) Sampling and Analysis Plan was developed by V3 to address the data gaps described in Section 1.4. The objectives of the cap investigation included the following:
Provide comprehensive analysis of the landfill cap, and
Determine the extent of the landfill with more accuracy. In April 2010, V3, along with OSE, performed the investigation to address these data gaps. The sampling included soils and groundwater sampling of different analytes at multiple locations throughout the Site (see Figure 2.1). The results of supplemental sampling efforts are summarized in Table 1.1 and Tables 2.1 to 2.5 and Figures 2.4 to 2.5. The field activities relative to these investigations are discussed below. Geological conditions and the prior site-specific sampling plans are discussed in Sections 2.0 and 3.0 in the March 2010 CSIR submitted previously to the IEPA by V3.
2.1.2 Parcels A, E, D and C – Remedial Investigation / PCBs Delineation
The Remedial Investigation / PCBs Delineation (RI/D) Work Plan (Appendix A) was developed to address the data gaps summarized within Section 1.4, as they relate to the characterization of conditions at Parcels A, E, D and C, and as needed to develop site-specific remediation objectives, remedial action plans and PCBs cleanup proposals under 40 CFR 761.61(c). The RI/D Work Plan was submitted concurrently to the IEPA SRP and the Remediation and Reuse Branch of USEPA Region 5, for review and comment. The response letters prepared by IEPA SRP and USEPA Region 5 are also presented in Appendix A. The objectives of the RI/D are summarized as follows:
Subpart C: Exposure Pathway Evaluation. Provide additional analytical data to satisfy
the requirements of 35 IAC 742.300 (Subpart C: Exposure Route Evaluation), including
the TCLP analysis of RCRA metals, and to define associated remediation requirements.
TSCA PCBs Delineation. Vertically and horizontally delineate / define the extent of
TSCA level PCBs to, in conjunction with existing site characterization data and
anticipated end use plans, establish the basis for risk assessments and cleanup plans.
RI, ROR and RAP V3 Companies • 7 Blue Island Northeast Mixed-Use Commercial Park, Blue Island, IL August 2013
Per past discussions with USEPA Region 5, TSCA Remedial Program representatives,
vertical delineation by sampling intervals below and above known TSCA levels PCBs,
and horizontal delineation by sampling neighboring borings is required.
Free Product / Soil Saturation Limits. Delineate the extent of the apparent free product
observed in BI-GP-24 (Parcel D), and the extent of benzene and xylenes present above
soil saturation limits in the vicinity of BI-GP-19 (Parcel ‘A’) to define associated
remediation requirements.
Groundwater / Leachate. Define remediation requirements and allow the development
of site-specific remediation objectives, install and sample permanent and temporary
groundwater / leachate monitoring wells within the limits of the landfill and respective
parcels.
Perimeter Groundwater. Install and sample groundwater monitoring wells along the
perimeter of the landfill, with the following objectives:
– supplement existing perimeter well data to confirm that COCs are not migrating
beyond the limits of the Site;
– obtain the data needed, in conjunction with the aforementioned (and existing)
groundwater / leachate wells, to map groundwater surfaces within and adjacent
to the landfill; and
– obtain the data needed to further define remediation requirements and allow the
development of Tier 2 / 3 site-specific remediation objectives.
Seeps Evaluation. Perform additional visual site inspections to determine whether there
is evidence of leachate seepage along the southern face of the former landfill. To
demonstrate that COCs are not migrating beyond the limits of the Site, collect samples
and perform analysis of leachate from seeps (if any identified), and/or obtain surface
water samples from the drainage ditches along the southern face of the former landfill.
In November-December 2012, V3 conducted the RI/D at the Site to address the above objectives. Field activities included collecting soil and groundwater samples for a variety of analyses at multiple locations across Site and landfill seep samples from ditches along the southern and eastern toes of the landfill (Figure 2.2). Landfill gas measurements were obtained during boring advancement. In addition, a hydrologic investigation was conducted during this time to assess groundwater flow and hydraulic conductivity at the Site. Groundwater elevations and a groundwater contour map are shown on Figure 2.3. The results of the RI/D and previous sampling efforts are summarized in Table 1.1 and Tables 2.6 to 2.11 and 3.1 to 3.3. The field activities relative to these investigations are discussed below in Section 2.3.2. Geological conditions and the prior site-specific sampling plans are discussed in Sections 2.0 and 3.0 in the April 2010 CSIR, submitted previously to the IEPA by V3.
2.2 DOCUMENTATION OF FIELD ACTIVITIES
2.2.1 Field Activities – Landfill Cap
Soil borings were advanced by OSE on April 19 to 21, 2010 and on April 26 to 29, 2010, under
the supervision of V3’s site geologist, using direct push Geoprobe soil sampling methods. A

RI, ROR and RAP V3 Companies • 8 Blue Island Northeast Mixed-Use Commercial Park, Blue Island, IL August 2013
total of 115 soil samples were collected for chemical analysis from 114 boring locations (Figure 2.1). The borings were advanced to a maximum depth of 12 feet below ground surface (bgs). Geological conditions of cap soils were similar to those observed during the CSI. Please refer to Section 2.4 of this report, Section 2.0 of the March 2010 CSIR and the boring logs provided in this report (Appendix B) for details regarding subsurface conditions of the Site. Cap soil samples were analyzed for one or more of the following: VOCs, SVOCs, PCBs, Pesticides, total analyte list (TAL) metals and RCRA metals. The results of these sampling efforts are summarized in Table 1.1 and Tables 2.1 through 2.5.
2.2.2 Field Activities – Parcels A, E, D and C
Earth Solutions, Inc. (ESI) drilled soil borings and installed temporary and permanent groundwater monitoring wells in November – December 2012, under the supervision of V3’s site geologist. ESI employed hollow-stem auger drilling and sampling methods. Refer to Figure 2.1 and the Sampling and Analysis Plan (Table 1 of the RI/D Work Plan in Appendix A) with respect to the field activities described below.
A total of 19 soil borings were drilled across the Site. Six of these borings were
converted into permanent groundwater monitoring wells. Three of the wells were
installed outside the perimeter of the landfill, and three were installed on the parcels.
Two soil borings were originally proposed for Parcel D, and no wells. Based on field
observations, two additional borings were drilled at the southeast corner of Parcel D to
delineate heavily stained soils and free product encountered in this area. One additional
boring was drilled at the southeast corner of Parcel D to install a permanent perimeter
well, because the well proposed for the northeast corner of Parcel C could not be
installed due to the presence of landfill waste / debris.
Soil borings were advanced to a maximum depth of 60 feet below ground surface (bgs).
Monitoring wells were set up to 60 feet deep. Geological conditions were similar to
those observed during the CSI.
Temporary monitoring wells were installed in three borings on the parcels to collect
leachate samples for laboratory analysis.
Four potential landfill seep water samples were collected from the ditches along the toes
of the landfill boundary. Three were collected along the southern toe and one was
collected from the southeast toe. Samples were collected in November 2012 and
resampled in July 2013.
Soil and water samples were analyzed for one or more of the following families compounds: VOCs, TPH, SVOCs, PNAs, Pesticides, PCBs, RCRA metals, total analyte list (TAL) metals, TCLP RCRA metals, cyanide and pH. The results of these sampling efforts are summarized in Table 1.1, Tables 2.1 through 2.11 and Tables 3.1 through 3.3.
In November-December 2012 and July 2013, V3 performed a hydrologic investigation as part of the RI at the Site. The hydrologic investigation included the measurement of groundwater elevations to determine the direction and gradient of groundwater flow at the Site (Figure 2.3 and Table 3.4). Based on the elevations measured at the Site, groundwater at the Site flows to the south.
RI, ROR and RAP V3 Companies • 9 Blue Island Northeast Mixed-Use Commercial Park, Blue Island, IL August 2013
In addition, three pump tests were conducted in MW-15, MW-16 and MW-17 to obtain a representative hydraulic conductivity (K) estimate for the shallow saturated zone around the perimeter of the west landfill. Draw down and recovery analyses were performed to validate the test results. Prior to the pump tests, water levels and total well depth were measured to determine casing volume and zone of saturation. All three wells had been fully developed and purged prior to testing. A two-inch purge pump was inserted into the well to drawdown the water to the pump intake. After the pumping was terminated, a Level Troll 500 was quickly suspended to record the groundwater elevation of the recovery of the well was recorded. The post-processed data was imported into Aqtesolv 4.5 Pro for the Bouwer-Rice unconfined solution analysis. Early time data (e.g., data collected within the first minute of recovery) was judged most reliable data for curve fits. The curve fits were matched against the data in this time span using the Bouwer-Rice solution, and the K values were calculated. The hydraulic conductivity for MW-15 is K = 2.14 x 10⁻⁸ cm/sec, for MW-16 is K = 1.34 x 10⁻⁷ cm/sec and for MW-17 is K = 3.84 x 10⁻⁷ cm/sec, providing a representative (average) K value for the Site of 1.8 x 10⁻⁷ cm/sec. The well test data and Bouwer-Rice curve fit solutions are presented in Appendix C.
2.3 INVESTIGATION RESULTS / ENDANGERMENT ASSESSMENT
The Site investigation targeted the investigation of the two RECs:
REC 1: Historical Landfill Operations
REC 2: Historical ASTs/USTs
REC 1 includes all sub parcels within the West Parcel. REC 2 is located within Parcel D only. RECs 3 and 4 are effectively characterized and did not have any data gaps under the CSIR. The following sections summarize conditions associated with the RECs and the general findings of the Supplemental Investigation. The data is summarized in Table 1.1. For the analytical data tables, see Tables 2.1 to 2.5 for the 2010 cap investigation (soil), Tables 2.6 to 2.11 for the 2012 remedial investigation (soil), and Tables 3.1 to 3.3 for groundwater / leachate results.
2.3.1 Observed Subsurface Conditions
The following summarizes the subsurface conditions encountered during the field investigation, as organized for each REC. REC 1: Historical Landfill Operations As discussed in the March 2010 CSI, three basic “soil” units are present within the upper 60 feet
of the Site’s subsurface.
Fill (varied, silt and clay matrices typical)
Landfill Material (clay, wood, plastic, metal, paper)
Native Gray silty Clay with sand and gravel (underlying and beyond the landfill limits)
RI, ROR and RAP V3 Companies • 10 Blue Island Northeast Mixed-Use Commercial Park, Blue Island, IL August 2013
Fill - Fill at the Site can be further broken down into two primary categories: urban fill and
landfill “cap”.
Urban Fill – There are several locations at the Site that do not contain landfill
materials, but do contain varying depths of urban fill. These include:
– the northeastern portion of the West Parcel (east of Division Street), and
– the northwestern portion of the West Parcel (at the southeast intersection of
Vincennes Avenue and the Metra Rail).
The urban fill is variable, but typically consists of silty clay fill material containing
concrete, asphalt, metal scrap, glass, bricks, and gravel within the aforementioned
areas of the West Parcel. While certain areas have deeper and shallower zones,
this fill averages approximately 2 to 15 feet thick and is typical of urban areas.
Landfill Cap – Within the landfill area, clayey fill material was placed as a landfill cap.
The cap materials were intentionally placed, they are denser and more compact, and
they lack the common presence of debris typical of the aforementioned urban fill.
The thickness of the landfill cap ranges from 3.5 – 14 feet at the West Parcel.
The following observations pertain to the landfill cap soils:
Odors
A ‘creosote-like’ odor was observed in boring BI-GP-101 at 4 to 6 feet in the
northwest corner of Parcel A, and within the fill at Parcel H in borings BI-GP-158
and BI-GP-159, at 11 feet and 4 feet, respectively.
A petroleum odor with elevated PID readings was observed in Parcel A at BI-GP-
141 in the landfill debris at 7-9 feet, within Division Road at BI-GP-146 at 7-9
feet, within Parcel B at BI-GP-201 within the fill at 7.5 to 9 feet, and Parcel I BI-
GP-215 within the fill at 6.5-7.5 ft.
A paint thinner-like chemical odor was noted within Division Road in the fill at BI-
GP-153 from 6-8 feet.
Odors at the above locations and the noted depths do not appear to be a result
of onsite activities, but are more likely associated with the fill that was imported to
the site. Additionally, the locations of the odorous soils noted above appear to be
limited in extent since the described conditions were not observed in nearby
borings.
Staining / Visual Observations
Soil staining was observed at BI-GP-158 within a 4 inch seam of sand at 4 feet
deep within the fill at Parcel H. The staining at this location and depth is limited
in extent, and did not appear to be a result of onsite activities, but is more likely
associated with the fill that was imported to the site.
Landfill Material - The landfill material consists of loose, wet clay with glass, wood, metal and
paper. The “landfill material” is the soils and refuse that was used to backfill the former clay
excavation from 1952-1966. The landfill material is present to depths up to 60 feet bgs in the
West Parcel. In general, many borings that intersected the landfill materials contained a
decaying garbage odor, as well as occasional petroleum and solvent-like odors.
RI, ROR and RAP V3 Companies • 11 Blue Island Northeast Mixed-Use Commercial Park, Blue Island, IL August 2013
Native Clay - A dark, gray silty clay and silt with sand and gravel of the Wedron Formation is
observed in areas adjacent to the landfill and below the landfill materials at depths ranging from
17-61 feet bgs. This material is very hard and is often described as “hard pan”. Borings that
were advanced outside the limits of the landfill encountered this same unit beginning at
approximately seven feet bgs, and were overlain by gray and brown mottled silty clays.
Infrequent small, discontinuous sand and gravel seams have been observed at varying depths.
The infrequent lenses are generally several inches in thickness but can be as thick as two feet
(see boring BI-GP-17/MW-8).
Landfill Gas Observations: During the RI/D, landfill gas measurements were obtained during boring advancement via open hollow-stem auger. A GEM 2000 multi-gas monitor was used to measure methane, carbon dioxide and oxygen based on percentage of each gas. The observed measurements, along with readings observed at other boring locations advanced during prior investigations, are presented in Appendix I. The following observations are based on the current and historical landfill gas measurements:
Methane readings for perimeter well borings and borings outside of the landfill boundary (Parcel D) were less than 5%, and all readings but one were less than 0.5%.
Soil borings exhibiting methane readings are in all of the parcels within the landfill boundary.
The following areas and general depth intervals contain levels of methane at and above 10%. This is an arbitrary level chosen to illustrate the locations of methane pockets:
North-central portion of Parcel A from at 15’-55’.
South-central portion of Parcel B at 15’.
Central portion of Parcel C from 20’-50’.
North half of Parcel H from 5’-50’.
Northeast corner of Parcel I from 15’-30’.
Division Street adjacent to Parcels D and E from 10’-20’.
The general observations presented above are based on borings where methane readings were obtained. These data do not preclude the likelihood that elevated methane levels exist elsewhere within the landfill boundaries. REC 2: Historical ASTs/USTs (Parcel D) As mentioned above, REC 2 is located within Parcel D only, and the following summarized the conditions more specifically associated with Parcel D and this REC.
Fill Material and Native clay: The borings consisted of mottled silty clay fill with bricks, concrete and rubble to approximately 15-20 feet bgs underlain by brown and gray native silty clay with trace sand and gravel to the terminus of the boring.
Odors / Staining / Visual Observations: Elevated PID readings were observed most of the borings in REC 2. Petroleum odors were observed in the borings generally between 10 and 20 feet bgs.
Potential oil/free product: Observed in boring BI-GP-318 at 12 feet deep. Elevated PID readings and petroleum odors / staining were noted for the depth interval of 12-17 feet bgs.

RI, ROR and RAP V3 Companies • 12 Blue Island Northeast Mixed-Use Commercial Park, Blue Island, IL August 2013
Petroleum staining: Noted in the same depth interval (12-17 feet bgs) in borings BI-GP-312, BI-GP-317 and BI-GP-319.
2.3.2 Contaminants of Concern (COCs), Distribution / Nature of Contamination
The primary COCs at the Site during the supplemental investigations were identified and
confirmed through laboratory analysis. The exposure pathways of concern (see Table 1.1 for
summary) are discussed briefly below. A detailed Tier 1 TACO evaluation is provided along
with the CSI data as a whole in Section 3.3.
VOCs
Benzene, toluene, ethylbenzene and xylenes (BTEX), chlorobenzene and vinyl
chloride concentrations were identified above Tier 1 ROs in the landfill materials on
Parcels A, C and E well below the landfill cap depth. The cap soils did not contain
VOC exceedances.
Two locations on separate parcels contained isolated concentrations of ethylbenzene
and xylenes above soil saturation limits well below the landfill cap depth.
Petroleum odors were observed at multiple sample locations on multiple Parcels.
However, the impacts appear to be isolated at each general location well below the
landfill cap depth.
One or more BTEX constituents were detected in the leachate samples.
The source of VOCs are the former USTs/ASTs and historical disposal of waste
materials containing VOCs.
SVOCs
PAHs were mainly detected above Tier 1 ROs in soil, in addition to a few SVOCs
within the cap and landfill materials. The cap contains just PAHs.
PAHs were detected in the leachate samples.
The Tier 1 exposure pathways of concern include ingestion, construction worker
ingestion and inhalation, and the soil component of the groundwater ingestion route.
The source of SVOCs are the former USTs/ASTs and historical disposal of waste
materials containing SVOCs.
Metals
Metals were detected in excess of Tier 1 ROs within the cap, landfill materials,
leachate and groundwater samples. The metals include RCRA metals (arsenic,
barium, cadmium, chromium, lead, mercury, and selenium), aluminum, antimony,
copper, nickel, zinc, boron, vanadium and iron.
Three metals (aluminum, iron and lead) were identified in groundwater at
concentrations in excess of Tier 1 ROs around the outside of the landfill.
The Tier 1 exposure pathways of concern include soil ingestion and inhalation,
construction worker ingestion and inhalation, groundwater ingestion, and the soil
component of the groundwater ingestion route.
RI, ROR and RAP V3 Companies • 13 Blue Island Northeast Mixed-Use Commercial Park, Blue Island, IL August 2013
Metals concentrations / Tier 1 exposure pathway risks could not be fully evaluated at
some locations. The OSE sample analyses for the existing landfill cap did not
include pH or TCLP/SPLP analysis. However, to date hazardous characteristic
metals concentrations have not been identified at the Site.
Total Petroleum Hydrocarbons (TPH)
One location contained a high TPH (23,000 mg/kg), exceeding the soil attenuation
capacity of site soils. A sample below it from 15-16 has TPH of 2,598 mg/kg. This
location correlates with previous data at Parcel D and appears to be the result of
isolated historical petroleum product releases during operations.
Based on field observations (odors and visual soil discoloration) and analytical
testing results, the TPH impacts are isolated to an approximate depth of 12 to 16 ft
bgs, and within an approximate 1,000 square feet area surrounding the sample
locations.
PCBs
PCBs did not exceed Tier 1 ROs in the cap or in shallow soils where only a few
minor detections were noted.
PCBs above Tier 1 ROs at non-TSCA levels were isolated to the landfill materials at
depths of Parcel A, E,C and Division Street.
PCBs were detected in three leachate samples.
The source of PCBs is the historical disposal of waste materials in the landfill.
PCBs are further discussed in Sections 3.7 and 4.6.
Pesticides were not exceeded in soil, leachate or groundwater samples during the RI or cap investigations. Minor detections were noted in the soil.

RI, ROR and RAP V3 Companies • 14 Blue Island Northeast Mixed-Use Commercial Park, Blue Island, IL August 2013
3.0 REMEDIAL OBJECTIVES EVALUATION
The following sections establish the baseline conditions at the Site that were determined
through all of the site investigations, including the comprehensive site investigation, cap
investigation and remedial investigation (RI). The later discussions establish site ROs, and the
areas requiring active remediation to achieve ROs and/or provide for exposure pathway
exclusion where ROs are exceeded.
3.1 BASELINE TACO EVALUATION (PRE-REMEDIATION)
The identification of potential receptors and exposure pathways is an important component of
the investigation/remedial strategy for the Site because it allows for an evaluation and
determination of site-specific risk and ROs. Where no potential receptor is exposed to COCs at
a concentration exceeding TACO ROs, remedial actions are not required.
The initial step used to establish Site ROs was the development of a “baseline” TACO
evaluation. The objectives of this evaluation were limited to determining the following:
If known releases to the environment have resulted in residual concentrations of COCs
greater than TACO Subpart C criteria; and
If such residual concentrations represent unacceptable risk under Tier 1 or 2
The first phase of a TACO evaluation is to determine if complete exposure routes exist pursuant
to Title 35 of the Illinois Administrative Code (IAC) 742.300 (Subpart C: Exposure Route
Evaluation). Where a complete exposure pathway (source – transport – availability for
exposure – receptor) does not exist, development of ROs for that exposure route is not
required. An exposure route evaluation was accomplished on a constituent specific basis for
each REC. Before a potential exposure route can be eliminated from further consideration, the
following conditions must be satisfied:
1. The horizontal and vertical extent and constituent concentrations must be determined;
2. The sum total of organic constituent concentrations cannot exceed the soil attenuation
capacity as measured by the natural organic carbon fraction (foc) of the soil;
3. Non-aqueous phase liquids (NAPL) or free product must be removed to the maximum
extent practicable;
4. The concentration of any organic constituent cannot exceed the soil saturation limit;
5. The soil cannot be classified as a characteristic RCRA hazardous waste for reactivity,
corrosivity, or toxicity (RCRA metals only).
6. The concentration of any PCBs in soil shall not exceed 50 parts per million (ppm).
The Site investigations indicate COCs are largely confined to the landfill limits and the horizontal
and vertical extent of COCs has been generally determined. The following did not achieve
TACO Subpart C conditions for demonstrating source material is not present:
Elevated TPH was identified at Parcel D (outside of the landfill limits). The extent is
delineated.
RI, ROR and RAP V3 Companies • 15 Blue Island Northeast Mixed-Use Commercial Park, Blue Island, IL August 2013
– Apparent petroleum free product was observed in boring BI-GP-24 on Parcel D.
Total petroleum hydrocarbon (TPH) analysis was performed at this location
(sample depth of 10-12 feet) to determine if the soil attenuation capacity has
been exceeded. The concentration of TPH is 1,340 mg/kg, which is less than
soil attenuation capacity as specified by the conservative TACO default value of
0.2% (or 2,000 mg/kg) and the calculated site-specific Foc of 9,100 mg/kg.
– Parcel D – Soil sample BI-GP-318 (12-13) has a high TPH (23,000 mg/kg), which
will be addressed in the Remedial Action Plan, Section 4.0. A sample below it
from 15-16 feet has TPH concentration of 2,598 mg/kg which exceeds the
fractional organic carbon (Foc) default of 2,000 mg/kg for subsurface soils, but is
well below the calculated site-specific Foc of 9,100 mg/kg. Nearby sample BI-
GP-317 (15-16) contained TPH of 1189 mg/kg and screening of soils from
borings surrounding BI-GP-318 indicates that the area of elevated TPH is
isolated at boring BI-GP-318.
The soil saturation limit for benzene (870 mg/kg), ethylbenzene (400 mg/kg) and xylenes
(320 mg/kg) has been exceeded within the landfill materials.
– Parcel A: BI-GP-19 at 44-46 feet (benzene 881 mg/kg and xylenes 1130 mg/kg)
and BI-GP-304 at 53-55 feet (ethylbenzene 1100 mg/kg and xylenes 2300
mg/kg). Screening of nearby boring BI-SB-01 did not indicate fuel hydrocarbon
odors (just septic odors), but did contain elevated PID readings.
– Parcel C: BI-GP-309 at 46-48 ft (ethylbenzene 520 mg/kg and xylenes 970
mg/kg). Nearby samples at BI-GP-308, BI-SB-07 and BI-GP-21 did not identify
VOCs above the soil saturation limit.
PCBs concentrations in excess of 50 parts per million were encountered in Parcel D.
– Parcel D: Concentrations of PCBs in BI-GP-21 (46-48) were 453 mg/kg. V3
delineated this PCBs impact (refer to Section 3.7).
Evaluation of Site data indicates that conditions in the RECs achieve the TACO Subpart C
criteria for demonstrating that source material is not present for the following categories:
No characteristics of reactivity have been identified (see Tables 5.5 and 7.4).
Soil does not exhibit pH values less than or equal to 2.0 or greater than or equal to 12.5
(see Tables 5.5 and 7.4).
There is no evidence of hazardous metals at the Site (see Tables 5.5 and 7.4).
As a result, pathway exclusion is allowable per IAC Section 742.300 (Subpart C: Exposure
Route Evaluation), once the aforementioned Subpart C exceptions are addressed, as discussed
in Section 3.5.2 and in the Remedial Action Plan (Section 4.0).
A summary of soil and groundwater sample analysis results in which constituent concentrations
are above applicable TACO Tier 1 ROs (COCs) are provided in Table 4.1, which includes
combined analytical results obtained during the CSIR, cap investigation and remedial
investigation. Refer to Appendix D for complete analytical results. The following section
establishes the baseline TACO conditions at the Site, followed next by a summary of the TACO
Tier 1 evaluation.
RI, ROR and RAP V3 Companies • 16 Blue Island Northeast Mixed-Use Commercial Park, Blue Island, IL August 2013
3.2 BASELINE TACO CONDITIONS
The results of the CSI have established the baseline TACO conditions for the Site.
3.2.1 Site COCs
To obtain a Comprehensive NFR, the COCs being addressed are the Target Compound List
parameters (VOCs, SVOCs, PCBs/pesticides and Total Analyte List inorganics. The results of
all the investigations completed a delineation of the vertical and horizontal extent of COCs. The
delineation of COCs was determined through subsurface investigations and analytical testing.
The detected Site COCs include:
Soils: The predominant soil concerns are present within the landfill materials. Overall,
soil COCs are summarized as follows:
– SVOCs (mainly PAHs), VOCs (chlorobenzene, cis-1,3-dichloropropene, cis-1,2-
dichloroethylene, trichloroethylene, vinyl chloride, and BTEX), PCBs, and select
heavy metals. These COCs are predominantly present within the landfill
materials.
– COCs within the landfill cap are less common, primarily consist of PAHs and
select heavy metals, and are present at relatively low concentrations. VOCs and
a single pesticide concentration are also present.
Groundwater / Leachate: VOCs, SVOCs (mainly PAHs), metals and PCBs were
identified in water collected from within the landfill limits (leachate), rather than from the
monitoring locations along the landfill perimeter. The perimeter groundwater wells only
identified three elevated metals concentrations.
The analytical results obtained through the CSI, as supplemented during the cap investigation
and RI/D, were compared to the Tier 1 ROs of Title 35 of the Illinois Administrative Code (IAC)
Part 742, Tiered Approach to Corrective Action Objectives (TACO), effective February 15, 2007.
Further, analytical and physical site data were considered in accordance with 35 IAC Part 742,
Subpart C; Exposure Route Evaluations.
A summary of soil and groundwater sample analysis results in which constituent concentrations
are above applicable TACO Tier 1 ROs (e.g., the Site COCs) are provided in Tables 5.1
through 8.1. A summary of samples exceeding Tier 1 ROs is provided as Table 4.1.
3.2.2 Migration Pathways, Receptors And Exposure Routes
Existing and potential migration pathways that could transport contaminants off-site include
underground utilities that exit the property, groundwater, fugitive dust, and surface water runoff.
Utility Review and Potential Migration Pathway Evaluation
The location of utilities was discussed in the CSIR and additional data collected during the
investigation has not indicated any changes to the utility locations. V3’s additional field
reconnaissance of the Site observed no direct evidence of seeps, suggesting leachate seepage
is reasonably limited.
Potential Exposure Pathways and Receptors
RI, ROR and RAP V3 Companies • 17 Blue Island Northeast Mixed-Use Commercial Park, Blue Island, IL August 2013
The potential exposure pathways and receptors were discussed in the CSIR and additional data
collected during the investigations has not indicated any changes to the potential exposure
pathways and receptors.
3.2.3 Groundwater Classification
As discussed in the March 2010 CSIR and as shown from the hydraulic conductivity test, the
groundwater beneath the Site classifies as a Class II: General Resource Groundwater, in
accordance with Title 35: Environmental Protection, Subtitle F: Public Water Supplies, Chapter
I: Pollution Control Board Part 620b: Groundwater Classification.
3.3 TACO TIER 1 EVALUATION
To define the nature and extent of contamination at the Site, and evaluate possible transport of
contaminants, investigation analytical results were compared to Tier 1 ROs for
industrial/commercial land use and the construction worker scenario. The future use of the
property will be industrial/commercial or retail, and therefore the following exposure routes were
evaluated:
Soil ingestion for the industrial/commercial and construction worker receptor population,
Soil inhalation for industrial/commercial and construction worker receptor population,
Class II groundwater ingestion based on the migration potential of concentrations
detected in soils, and
Class II groundwater ingestion.
Where Tier 1 groundwater ingestion (and soil component of groundwater ingestion) ROs have
been exceeded, outside the limits of the landfill, TACO risk-based corrective action (RBCA)
equation R-26 simulations will be used to predict the distances from the COC sources
(represented by groundwater monitoring wells) required to achieve Tier 1 groundwater ROs.
Tier 2 ROs will only be used outside of the landfill limits. A Tier 3 groundwater pathway
exclusion will be used to address the interior landfill leachate samples, see Section 3.5. In
addition, a groundwater pathway exclusion is planned via use of the City of Blue Island
municipal ordinance prohibiting potable use of groundwater. Tier 1 groundwater exceedances
are compared to Class II Groundwater ROs for respective COCs. TACO equation R-12
simulations will also be used to determine Tier 2 soil component of the groundwater ingestion
ROs s may be applicable.
A summary of soil and groundwater samples in which concentrations are above applicable
TACO Tier 1 ROs is provided in Table 4.1. Details of analytical results are provided in Tables
5.1 through 8.1.
REC 1 was broken into the East and West Parcels. In addition, soil samples in the East and
West Parcels are divided between those collected within the landfill limits (landfill cap, landfill
materials, native soil-bottom) and those collected outside the landfill limits (adjacent native soil
and fill material) and are grouped by Sub-Parcel names. Groundwater samples are also divided
between those within the landfill limits (leachate) and those outside the landfill limits
(groundwater).
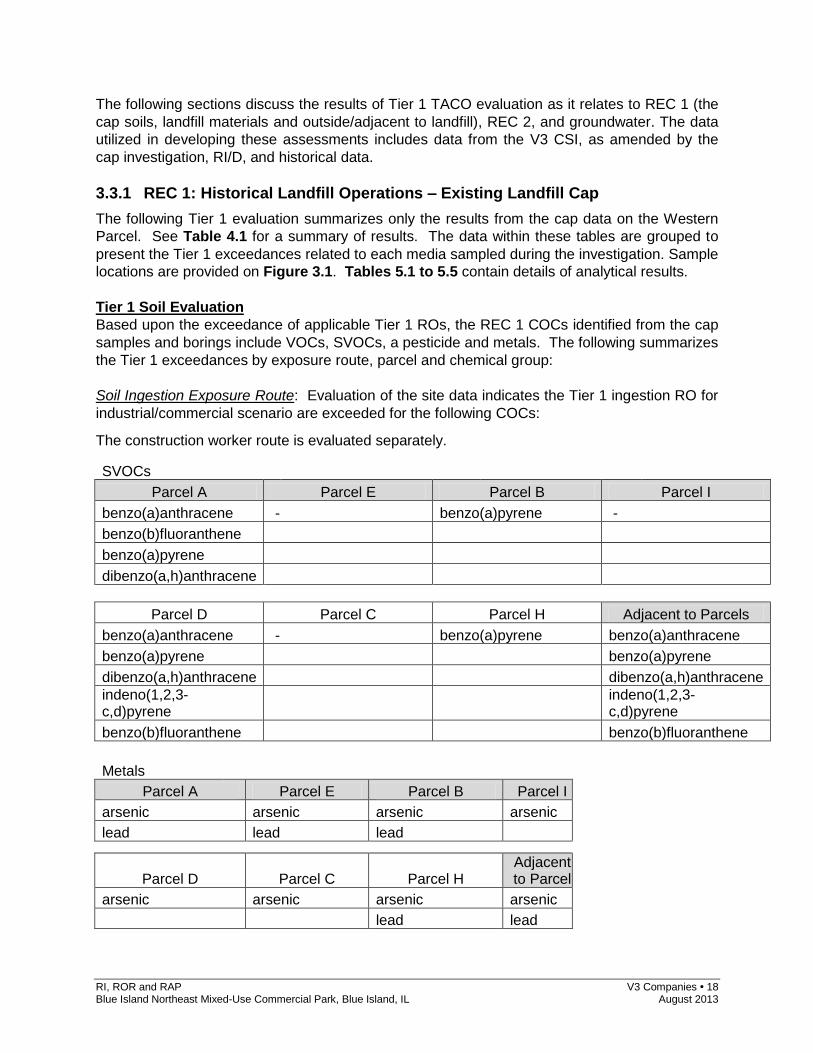
RI, ROR and RAP V3 Companies • 18 Blue Island Northeast Mixed-Use Commercial Park, Blue Island, IL August 2013
The following sections discuss the results of Tier 1 TACO evaluation as it relates to REC 1 (the
cap soils, landfill materials and outside/adjacent to landfill), REC 2, and groundwater. The data
utilized in developing these assessments includes data from the V3 CSI, as amended by the
cap investigation, RI/D, and historical data.
3.3.1 REC 1: Historical Landfill Operations – Existing Landfill Cap
The following Tier 1 evaluation summarizes only the results from the cap data on the Western
Parcel. See Table 4.1 for a summary of results. The data within these tables are grouped to
present the Tier 1 exceedances related to each media sampled during the investigation. Sample
locations are provided on Figure 3.1. Tables 5.1 to 5.5 contain details of analytical results.
Tier 1 Soil Evaluation
Based upon the exceedance of applicable Tier 1 ROs, the REC 1 COCs identified from the cap
samples and borings include VOCs, SVOCs, a pesticide and metals. The following summarizes
the Tier 1 exceedances by exposure route, parcel and chemical group:
Soil Ingestion Exposure Route: Evaluation of the site data indicates the Tier 1 ingestion RO for
industrial/commercial scenario are exceeded for the following COCs:
The construction worker route is evaluated separately.
SVOCs Parcel A Parcel E Parcel B Parcel I
benzo(a)anthracene - benzo(a)pyrene -
benzo(b)fluoranthene
benzo(a)pyrene
dibenzo(a,h)anthracene
Parcel D Parcel C Parcel H Adjacent to Parcels
benzo(a)anthracene - benzo(a)pyrene benzo(a)anthracene
benzo(a)pyrene benzo(a)pyrene
dibenzo(a,h)anthracene dibenzo(a,h)anthracene
indeno(1,2,3-c,d)pyrene
indeno(1,2,3-c,d)pyrene
benzo(b)fluoranthene benzo(b)fluoranthene
Metals Parcel A Parcel E Parcel B Parcel I
arsenic arsenic arsenic arsenic
lead lead lead
Parcel D Parcel C Parcel H Adjacent to Parcel
arsenic arsenic arsenic arsenic
lead lead

RI, ROR and RAP V3 Companies • 19 Blue Island Northeast Mixed-Use Commercial Park, Blue Island, IL August 2013
These SVOCs and metals will be evaluated further by statistical analysis, see Section 3.3.1.1.
Removal of the impacted soil or installation and maintenance of a barrier to exclude the
ingestion pathway would be required in the areas where the soil ingestion exposure route RO is
exceeded.
Soil Inhalation Exposure Route: Evaluation of the site data indicates the Tier 1 inhalation ROs
for the industrial/commercial scenario are exceeded for the following COCs:
Metals Parcel A Parcel E Parcel B Parcel I
- chromium - -
Parcel D Parcel C Parcel H - chromium -
Chromium inhalation is a particulate inhalation, so this can be addressed similar to an inhalation
exceedance.
Removal of the impacted soil or installation and maintenance of a barrier to exclude the
particulate inhalation pathway would be required in the areas where the soil inhalation exposure
route RO is exceeded.
Construction Worker Exposure Route: Evaluation of the site data indicates the Tier 1 ingestion
and/or inhalation ROs for the construction worker scenario are exceeded for the following
COCs:
SVOCs Parcel A Parcel E Parcel B Parcel I
- - - -
Parcel D Parcel C Parcel H Adjacent to
Parcels
naphthalene - - benzo(a)pyrene
benzo(a)pyrene naphthalene
Metals Parcel A Parcel E Parcel B Parcel I
antimony antimony mercury mercury
arsenic lead lead
lead mercury
mercury
Parcel D Parcel C Parcel H Adjacent to Parcels
mercury mercury mercury mercury
lead lead
chromium

RI, ROR and RAP V3 Companies • 20 Blue Island Northeast Mixed-Use Commercial Park, Blue Island, IL August 2013
Worker notification would be required in the areas where the construction worker exposure
route ROs are exceeded.
Soil Component of the Groundwater Ingestion Exposure Route: Evaluation of the site data
indicates the Tier 1 soil component of the Class II groundwater ingestion route RO is exceeded
for the following COCs:
VOCs
Parcel A Parcel E Parcel B Parcel I
- - - -
Parcel D Parcel C Parcel H Adjacent to Parcel
- - - cis(1,3)dichloropropene
SVOCs
Parcel A Parcel E Parcel B Parcel I
benzo(a)anthracene - - -
Parcel D Parcel C Parcel H Adjacent to Parcel
benzo(a)anthracene - - benzo(a)anthracene
benzo(b)fluoranthene dibenzo(a,h)anthracene
dibenzo(a,h)anthracene carbazole
dibenzofuran
Metals Parcel A Parcel E Parcel B Parcel I
antimony - - -
thallium lead
Parcel D Parcel C Parcel H - - lead
Pesticides
Parcel A Parcel E Parcel B Parcel I
- - - -
Parcel D Parcel C Parcel H
- - Alpha-HCH (alpha-BHC)
Based on these results, removal of the impacted soil, groundwater modeling (Tier 2) or a Tier 3
evaluation will be used to exclude the exposure pathway in the areas where the Class II soil

RI, ROR and RAP V3 Companies • 21 Blue Island Northeast Mixed-Use Commercial Park, Blue Island, IL August 2013
component to groundwater ingestion exposure route RO is exceeded. In addition, a
groundwater use restriction will be applied.
Groundwater sampling is not applicable to the cap, since it is mainly covering the landfill
materials, which includes leachate. See Section 3.3.2 for landfill leachate samples and
Section 3.3.5 for groundwater samples around the perimeter of the landfill.
3.3.1.1 Soil Ingestion Exposure Route Evaluation – 95% UCLs
The most prevalent COCs within the existing clay landfill cap include metals and PNAs. The most prevalent exposure concern is metals and PNAs soil concentrations in excess of applicable soil ingestion exposure route ROs. As a result, 95% Upper Confidence Limits (UCLs) were developed for the following COCs to evaluate whether statistically valid site-wide averages were compliant with applicable Tier 1 soil ingestion ROs:
Arsenic
Lead
Benzo(a)anthracene
Benzo(a)pyrene
Benzo(b)flouranthene
Dibenzo(a,h)anthracene
Indeno(1,2,3-c,d)pyrene To develop 95% UCLs, the sample results for each COC were divided into subsets by the following depth intervals: 0 – 3 feet bgs, 3 – 6 feet bgs, and 6 -9 feet bgs. UCLs were then calculated for each depth interval. Pursuant to IAC Part 742.225, a statistically valid approach for evaluating the average site-wide concentration of each respective COC was employed. The objective of the evaluation was to determine whether the 95% UCL developed for each COC from the site-wide (Western Parcel sample population) is less than the COC’s respective Tier 1 soil Ingestion RO. The following statistical procedures were employed:
Shapiro-Wilk Test of Normality.
Evaluation of the Upper Confidence Limit (UCL) on the mean at a 95% probability. Prior to calculating the site-wide average concentration, a Shapiro-Wilk Test of Normality was used to determine if the data set is normally distributed. V3 used USEPA statistical software package ProUCL, Version 4.1 to perform the Shapiro-Wilk Test on site-wide data. The details of the calculation are presented for each COC in the following paragraphs and within the data and calculation sheets provided in Appendix F.
3.3.1.2 Arsenic – 95% UCLs
Evaluation of the site data indicates that arsenic exceeds the Tier 1 ingestion ROs for industrial-commercial land use [i.e., the statewide background soils concentration: 13 mg/kg for metropolitan statistical areas (Section 742, Appendix A, Table G)] at multiple locations. The following paragraphs summarize the results of the statistical analysis of arsenic concentrations at the following depth intervals:

RI, ROR and RAP V3 Companies • 22 Blue Island Northeast Mixed-Use Commercial Park, Blue Island, IL August 2013
0 – 3 feet bgs
3 – 6 feet bgs
6 – 9 feet bgs 95% UCL: 0 – 3 feet bgs A data set of 50 sample analysis results was used for the calculations. The site-wide data for arsenic were not found to fit a discernible distribution, and as a result a nonparametric solution is recommended. The details of the 95% upper confidence limit (UCL) calculation are presented in the following paragraph and within the data and calculation sheets provided in Appendix F.1.
Mean of Detected: 12.61 mg/kg Maximum Detected: 67.4 mg/kg (Parcel A: sample location BI-GP-125) Minimum Detected: 3.34 mg/kg 95% UCL: 17.87 mg/kg
The calculated UCL of 17.87 mg/kg exceeds the Tier 1 RO of 13 mg/kg and Tier 1 compliance for this interval is not achieved. However, a UCL calculated by dropping the highest detected (outlier) concentration of 67.4, yields a UCL of 12.2 mg/kg, suggesting Tier 1 compliance is achievable. Calculation sheets for the UCL without the highest concentration are also provided in Appendix F.1. 95% UCL: 3 – 6 feet bgs A data set of 69 sample analysis results was used for the calculations. The site-wide data for arsenic were not found to fit a discernible distribution, and as a result a nonparametric solution is recommended. The details of the 95% upper confidence limit (UCL) calculation are presented in the following paragraph and within the data and calculation sheets provided in Appendix F.1.
Mean of Detected: 13.63 mg/kg Maximum Detected: 84.5 mg/kg (Parcel A: sample location BI-GP-114) Minimum Detected: 2.72 mg/kg 95% UCL: 19.46 mg/kg
The calculated UCL of 19.46 mg/kg exceeds the Tier RO of 13 mg/kg and Tier 1 compliance for this interval is not achieved. Additional UCLs calculations (generated by dropping the highest concentrations within the sample population) indicate that the 7 highest concentrations within this depth interval (ranging from 22.7 mg/kg to 84.5 mg/kg) would need to be dropped to obtain a UCL that achieves Tier 1 compliance, suggesting statistically addressing outliers or excavating “hotspot” locations within this depth interval may not be a feasible strategy. Calculation sheets for the UCLs without the highest concentrations are also provided in Appendix F.1. 95% UCL: 6 – 9 feet bgs A data set of 21 sample analysis results was used for the calculations. The site-wide data for arsenic were found to fit a normal distribution. The details of the 95% upper confidence limit (UCL) calculation are presented in the following paragraph and within the data and calculation sheets provided in Appendix F.1.
Mean of Detected: 10.63 mg/kg Maximum Detected: 16.2 mg/kg Minimum Detected: 6.00 mg/kg 95% UCL: 11.8 mg/kg
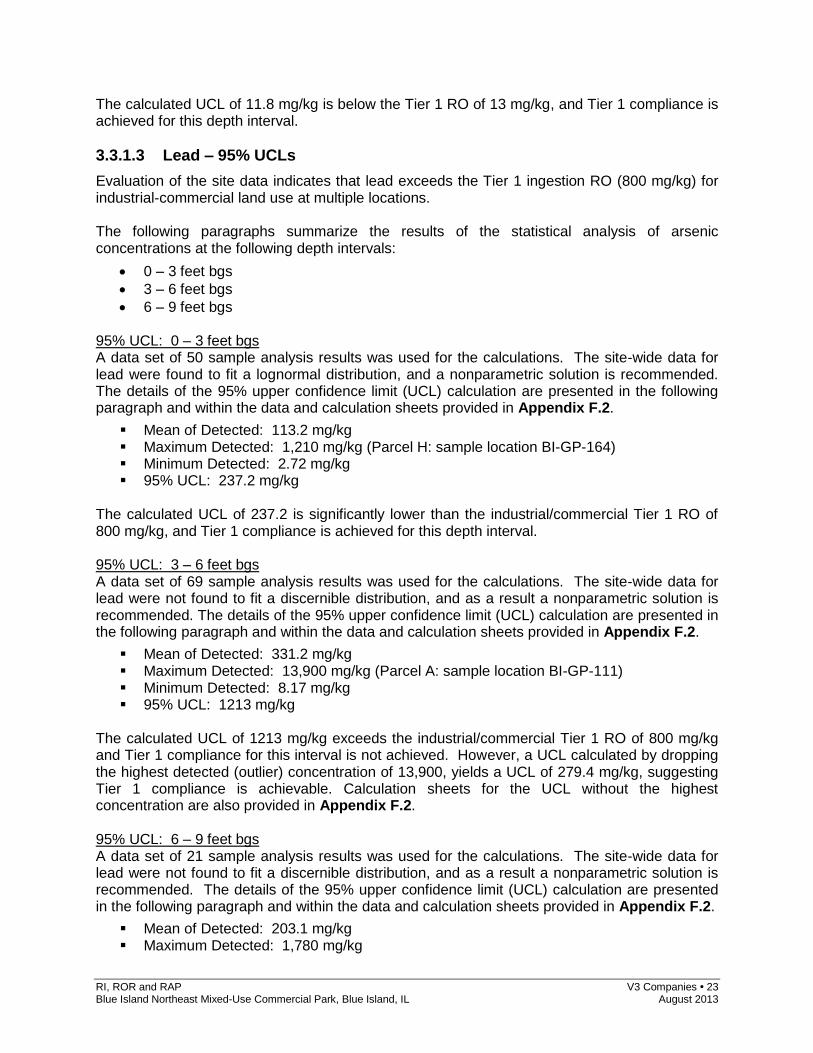
RI, ROR and RAP V3 Companies • 23 Blue Island Northeast Mixed-Use Commercial Park, Blue Island, IL August 2013
The calculated UCL of 11.8 mg/kg is below the Tier 1 RO of 13 mg/kg, and Tier 1 compliance is achieved for this depth interval.
3.3.1.3 Lead – 95% UCLs
Evaluation of the site data indicates that lead exceeds the Tier 1 ingestion RO (800 mg/kg) for industrial-commercial land use at multiple locations. The following paragraphs summarize the results of the statistical analysis of arsenic concentrations at the following depth intervals:
0 – 3 feet bgs
3 – 6 feet bgs
6 – 9 feet bgs 95% UCL: 0 – 3 feet bgs A data set of 50 sample analysis results was used for the calculations. The site-wide data for lead were found to fit a lognormal distribution, and a nonparametric solution is recommended. The details of the 95% upper confidence limit (UCL) calculation are presented in the following paragraph and within the data and calculation sheets provided in Appendix F.2.
Mean of Detected: 113.2 mg/kg Maximum Detected: 1,210 mg/kg (Parcel H: sample location BI-GP-164) Minimum Detected: 2.72 mg/kg 95% UCL: 237.2 mg/kg
The calculated UCL of 237.2 is significantly lower than the industrial/commercial Tier 1 RO of 800 mg/kg, and Tier 1 compliance is achieved for this depth interval. 95% UCL: 3 – 6 feet bgs A data set of 69 sample analysis results was used for the calculations. The site-wide data for lead were not found to fit a discernible distribution, and as a result a nonparametric solution is recommended. The details of the 95% upper confidence limit (UCL) calculation are presented in the following paragraph and within the data and calculation sheets provided in Appendix F.2.
Mean of Detected: 331.2 mg/kg Maximum Detected: 13,900 mg/kg (Parcel A: sample location BI-GP-111) Minimum Detected: 8.17 mg/kg 95% UCL: 1213 mg/kg
The calculated UCL of 1213 mg/kg exceeds the industrial/commercial Tier 1 RO of 800 mg/kg and Tier 1 compliance for this interval is not achieved. However, a UCL calculated by dropping the highest detected (outlier) concentration of 13,900, yields a UCL of 279.4 mg/kg, suggesting Tier 1 compliance is achievable. Calculation sheets for the UCL without the highest concentration are also provided in Appendix F.2. 95% UCL: 6 – 9 feet bgs A data set of 21 sample analysis results was used for the calculations. The site-wide data for lead were not found to fit a discernible distribution, and as a result a nonparametric solution is recommended. The details of the 95% upper confidence limit (UCL) calculation are presented in the following paragraph and within the data and calculation sheets provided in Appendix F.2.
Mean of Detected: 203.1 mg/kg Maximum Detected: 1,780 mg/kg

RI, ROR and RAP V3 Companies • 24 Blue Island Northeast Mixed-Use Commercial Park, Blue Island, IL August 2013
Minimum Detected: 10.1 mg/kg 95% UCL: 608.3 mg/kg
The calculated UCL of 608.3 is lower than the industrial/commercial Tier 1 RO of 800 mg/kg, and Tier 1 compliance is achieved for this depth interval.
3.3.1.4 Benzo(a)anthracene – 95% UCLs
Evaluation of the site data indicates that benzo(a)anthracene exceeds the Tier 1 ingestion RO (8 mg/kg) for industrial-commercial land use at multiple locations. The following paragraphs summarize the results of the statistical analysis of arsenic concentrations at the following depth intervals:
0 – 3 feet bgs
3 – 6 feet bgs
6 – 9 feet bgs 95% UCL: 0 – 3 feet bgs A data set of 45 sample analysis results was used for the calculations. The site-wide data for benzo(a)anthracene were not found to fit a discernible distribution, and a nonparametric solution is recommended. The details of the 95% upper confidence limit (UCL) calculation are presented in the following paragraph and within the data and calculation sheets provided in Appendix F.3.
Mean of Detected: 2.214 mg/kg Maximum Detected: 19 mg/kg Minimum Detected: 0.063 mg/kg 97.5% UCL: 5.027 mg/kg
The calculated UCL of 5.027 is lower than the industrial/commercial Tier 1 ingestion RO of 8 mg/kg, and Tier 1 compliance is achieved for this depth interval. 95% UCL: 3 – 6 feet bgs A data set of 68 sample analysis results was used for the calculations. The site-wide data for benzo(a)anthracene were not found to fit a discernible distribution, and a nonparametric solution is recommended. The details of the 95% upper confidence limit (UCL) calculation are presented in the following paragraph and within the data and calculation sheets provided in Appendix F.3.
Mean of Detected: 1.269 mg/kg Maximum Detected: 13 mg/kg Minimum Detected: 0.061 mg/kg 95% UCL: 2.02 mg/kg
The calculated UCL of 2.02 is lower than the industrial/commercial Tier 1 ingestion RO of 8 mg/kg, and Tier 1 compliance is achieved for this depth interval. 95% UCL: 6 – 9 feet bgs A data set of 21 sample analysis results was used for the calculations. The site-wide data for benzo(a)anthracene were not found to fit a discernible distribution, and as a result a nonparametric solution is recommended. The details of the 95% upper confidence limit (UCL) calculation are presented in the following paragraph and within the data and calculation sheets provided in Appendix F.3.
Mean of Detected: 8.253 mg/kg
RI, ROR and RAP V3 Companies • 25 Blue Island Northeast Mixed-Use Commercial Park, Blue Island, IL August 2013
Maximum Detected: 60 mg/kg (Parcel D: sample location BI-GP-182) Minimum Detected: 0.067 mg/kg 99% UCL: 38.35 mg/kg
The calculated UCL of 38.35 mg/kg exceeds the Tier RO of 8 mg/kg and Tier 1 compliance for this interval is not achieved. Additional UCLs calculations (generated by dropping the highest concentrations within the sample population) indicate that the 3 highest concentrations within this depth interval (ranging from 14 mg/kg to 60 mg/kg) would need to be dropped to obtain a UCL that achieves Tier 1 compliance, suggesting statistically addressing outliers or excavating “hotspot” locations within this depth interval may not be a feasible strategy. Calculation sheets for the UCLs without the highest concentrations are also provided in Appendix F.3.
3.3.1.5 Benzo(a)pyrene – 95% UCLs
Evaluation of the site data indicates that benzo(a)pyrene exceeds the Tier 1 ingestion RO (2.1 mg/kg) for industrial-commercial land use at multiple locations. The following paragraphs summarize the results of the statistical analysis of arsenic concentrations at the following depth intervals:
0 – 3 feet bgs
3 – 6 feet bgs
6 – 9 feet bgs 95% UCL: 0 – 3 feet bgs A data set of 45 sample analysis results was used for the calculations. The site-wide data for benzo(a)pyrene were not found to fit a discernible distribution, and as a result a nonparametric solution is recommended. The details of the 95% upper confidence limit (UCL) calculation are presented in the following paragraph and within the data and calculation sheets provided in Appendix F.4.
Mean of Detected: 1.556 mg/kg Maximum Detected: 13 mg/kg (Division Street: sample location BI-GP-210) Minimum Detected: 0.057 mg/kg 95% UCL: 2.784 mg/kg
The calculated UCL of 2.784 mg/kg exceeds the industrial/commercial Tier 1 RO of 2.1 mg/kg and Tier 1 compliance for this interval is not achieved. However, a UCL calculated by dropping the highest detected (outlier) concentration of 13 mg/kg, yields a UCL of 2.056 mg/kg, suggesting Tier 1 compliance is achievable. Calculation sheets for the UCL without the highest concentration are also provided in Appendix F.4. 95% UCL: 3 – 6 feet bgs A data set of 69 sample analysis results was used for the calculations. The site-wide data for benzo(a)pyrene were found to fit a lognormal distribution, and a nonparametric solution is recommended. The details of the 95% upper confidence limit (UCL) calculation are presented in the following paragraph and within the data and calculation sheets provided in Appendix F.4.
Mean of Detected: 1.005 mg/kg Maximum Detected: 9.8 mg/kg Minimum Detected: 0.055 mg/kg 95% UCL: 1.469 mg/kg
RI, ROR and RAP V3 Companies • 26 Blue Island Northeast Mixed-Use Commercial Park, Blue Island, IL August 2013
The calculated UCL of 1.469 is lower than the industrial/commercial Tier 1 RO of 2.1 mg/kg and Tier 1 compliance is achieved for this depth interval. 95% UCL: 6 – 9 feet bgs A data set of 21 sample analysis results was used for the calculations. The site-wide data for benzo(a)pyrene were not found to fit a discernible distribution, and as a result a nonparametric solution is recommended. The details of the 95% upper confidence limit (UCL) calculation are presented in the following paragraph and within the data and calculation sheets provided in Appendix F.4.
Mean of Detected: 6.436 mg/kg Maximum Detected: 47 mg/kg (Parcel D: sample location BI-GP-182) Minimum Detected: 0.067 mg/kg 99% UCL: 30.11 mg/kg
The calculated UCL of 30.11 mg/kg exceeds the industrial/commercial Tier 1 RO of 2.1 mg/kg and Tier 1 compliance for this interval is not achieved. However, a UCL calculated by dropping the 2 highest detected (outlier) concentrations of 47 and 29 mg/kg, yields a UCL of 1.752 mg/kg, suggesting Tier 1 compliance is achievable. Calculation sheets for the UCL without the 2 highest concentrations are also provided in Appendix F.4.
3.3.1.6 Benzo(b)flouranthene – 95% UCLs
Evaluation of the site data indicates that benzo(b)flouranthene exceeds the Tier 1 ingestion RO (8 mg/kg) for industrial-commercial land use at multiple locations. The following paragraphs summarize the results of the statistical analysis of arsenic concentrations at the following depth intervals:
0 – 3 feet bgs
3 – 6 feet bgs
6 – 9 feet bgs 95% UCL: 0 – 3 feet bgs A data set of 45 sample analysis results was used for the calculations. The site-wide data for benzo(b)fluoranthene were not found to fit a discernible distribution, and a nonparametric solution is recommended. The details of the 95% upper confidence limit (UCL) calculation are presented in the following paragraph and within the data and calculation sheets provided in Appendix F.5.
Mean of Detected: 1.664 mg/kg Maximum Detected: 14 mg/kg Minimum Detected: 0.069 mg/kg 95% UCL: 2.977 mg/kg
The calculated UCL of 2.977 is lower than the industrial/commercial Tier 1 RO of 8 mg/kg, and Tier 1 compliance is achieved for this depth interval. 95% UCL: 3 – 6 feet bgs A data set of 69 sample analysis results was used for the calculations. The site-wide data for benzo(b)fluoranthene were found to fit a lognormal distribution, and a nonparametric solution is recommended. The details of the 95% upper confidence limit (UCL) calculation are presented in the following paragraph and within the data and calculation sheets provided in Appendix F.5.
RI, ROR and RAP V3 Companies • 27 Blue Island Northeast Mixed-Use Commercial Park, Blue Island, IL August 2013
Mean of Detected: 1.027 mg/kg Maximum Detected: 10 mg/kg Minimum Detected: 0.056 mg/kg 95% UCL: 1.593 mg/kg
The calculated UCL of 1.593 is lower than the industrial/commercial Tier 1 RO of 8 mg/kg, and Tier 1 compliance is achieved for this depth interval. 95% UCL: 6 – 9 feet bgs A data set of 21 sample analysis results was used for the calculations. The site-wide data for benzo(b)fluoranthene were not found to fit a discernible distribution, and as a result a nonparametric solution is recommended. The details of the 95% upper confidence limit (UCL) calculation are presented in the following paragraph and within the data and calculation sheets provided in Appendix F.5.
Mean of Detected: 4.767 mg/kg Maximum Detected: 51 mg/kg (Parcel D: sample location BI-GP-182) Minimum Detected: 0.083 mg/kg 95% UCL: 27.74 mg/kg
The calculated UCL of 27.74 mg/kg exceeds the industrial/commercial Tier 1 RO of 8 mg/kg and Tier 1 compliance for this interval is not achieved. However, a UCL calculated by dropping the highest detected (outlier) concentration of 51, yields a UCL of 1.786 mg/kg, suggesting Tier 1 compliance is achievable. Calculation sheets for the UCL without the highest concentration are also provided in Appendix F.5.
3.3.1.7 Dibenzo(a,h)anthracene – 95% UCLs
Evaluation of the site data indicates that dibenzo(a,h)anthracene exceeds the Tier 1 ingestion RO (0.8 mg/kg) for industrial-commercial land use at multiple locations. The following paragraphs summarize the results of the statistical analysis of arsenic concentrations at the following depth intervals:
0 – 3 feet bgs
3 – 6 feet bgs
6 – 9 feet bgs 95% UCL: 0 – 3 feet bgs A data set of 45 sample analysis results was used for the calculations. The site-wide data for dibenzo(a,h)anthracene were found to fit a gamma and lognormal distribution, and as a result a nonparametric solution is recommended. The details of the 95% upper confidence limit (UCL) calculation are presented in the following paragraph and within the data and calculation sheets provided in Appendix F.6.
Mean of Detected: 0.588 mg/kg Maximum Detected: 2.3 mg/kg (Division Street: sample location BI-GP-210) Minimum Detected: 0.095 mg/kg 95% UCL: 0.318 mg/kg
The calculated UCL of 0.318 mg/kg is below the industrial/commercial Tier 1 RO of 0.8 mg/kg and Tier 1 compliance for this interval is achieved. A UCL calculated by dropping the highest
RI, ROR and RAP V3 Companies • 28 Blue Island Northeast Mixed-Use Commercial Park, Blue Island, IL August 2013
detected (outlier) concentration of 2.3, yields a UCL of 0.231 mg/kg. Calculation sheets for the UCL without the highest concentration are also provided in Appendix F.6. 95% UCL: 3 – 6 feet bgs A data set of 69 sample analysis results was used for the calculations. The site-wide data for dibenzo(a,h)anthracene were found to fit a gamma and lognormal distribution, and a nonparametric solution is recommended. The details of the 95% upper confidence limit (UCL) calculation are presented in the following paragraph and within the data and calculation sheets provided in Appendix F.6.
Mean of Detected: 0.27 mg/kg Maximum Detected: 1.3 mg/kg Minimum Detected: 0.013 mg/kg 95% UCL: 0.141 mg/kg
The calculated UCL of 0.141 is lower than the industrial/commercial Tier 1 RO of 0.8 mg/kg, and Tier 1 compliance is achieved for this depth interval. 95% UCL: 6 – 9 feet bgs A data set of 21 sample analysis results was used for the calculations. The site-wide data for dibenzo(a,h)anthracene were found to fit a gamma and lognormal distribution, and as a result a nonparametric solution is recommended. The details of the 95% upper confidence limit (UCL) calculation are presented in the following paragraph and within the data and calculation sheets provided in Appendix F.6.
Mean of Detected: 3.304 mg/kg Maximum Detected: 11 mg/kg (Parcel D: sample location BI-GP-182) Minimum Detected: 0.031 mg/kg 95% UCL: 2.373 mg/kg
The calculated UCL of 2.373 mg/kg exceeds the industrial/commercial Tier 1 RO of 0.8 mg/kg and Tier 1 compliance for this interval is not achieved. However, a UCL calculated by dropping the 2 highest detected (outlier) concentrations of 11 and 10 mg/kg, yields a UCL of 0.297 mg/kg, suggesting Tier 1 compliance is achievable. Calculation sheets for the UCL without the 2 highest concentrations are also provided in Appendix F.6.
3.3.1.8 Indeno(1,2,3-c,d)pyrene – 95% UCLs
Evaluation of the site data indicates that indeno(1,2,3-c,d)pyrene exceeds the Tier 1 ingestion RO (8 mg/kg) for industrial-commercial land use at multiple locations. The following paragraphs summarize the results of the statistical analysis of arsenic concentrations at the following depth intervals:
0 – 3 feet bgs
3 – 6 feet bgs
6 – 9 feet bgs 95% UCL: 0 – 3 feet bgs A data set of 45 sample analysis results was used for the calculations. The site-wide data for Indeno(1,2,3-c,d)pyrene were not found to fit a discernible distribution, and a nonparametric solution is recommended. The details of the 95% upper confidence limit (UCL) calculation are
RI, ROR and RAP V3 Companies • 29 Blue Island Northeast Mixed-Use Commercial Park, Blue Island, IL August 2013
presented in the following paragraph and within the data and calculation sheets provided in Appendix F.7.
Mean of Detected: 0.697 mg/kg Maximum Detected: 4.8 mg/kg Minimum Detected: 0.049 mg/kg 95% UCL: 1.013 mg/kg
The calculated UCL of 1.013 is lower than the industrial/commercial Tier 1 RO of 8 mg/kg, and Tier 1 compliance is achieved for this depth interval. 95% UCL: 3 – 6 feet bgs A data set of 69 sample analysis results was used for the calculations. The site-wide data for Indeno(1,2,3-c,d)pyrene were not found to fit a discernible distribution, and a nonparametric solution is recommended. The details of the 95% upper confidence limit (UCL) calculation are presented in the following paragraph and within the data and calculation sheets provided in Appendix F.7.
Mean of Detected: 0.504 mg/kg Maximum Detected: 3.4 mg/kg Minimum Detected: 0.05 mg/kg 95% UCL: 0.585 mg/kg
The calculated UCL of 0.585 is lower than the industrial/commercial Tier 1 RO of 8 mg/kg, and Tier 1 compliance is achieved for this depth interval. 95% UCL: 6 – 9 feet bgs A data set of 21 sample analysis results was used for the calculations. The site-wide data for Indeno(1,2,3-c,d)pyrene were found to fit a lognormal distribution, and as a result a nonparametric solution is recommended. The details of the 95% upper confidence limit (UCL) calculation are presented in the following paragraph and within the data and calculation sheets provided in Appendix F.7.
Mean of Detected: 4.762 mg/kg Maximum Detected: 28 mg/kg (Parcel D: sample location BI-GP-182) Minimum Detected: 0.066 mg/kg 99% UCL: 17 mg/kg
The calculated UCL of 17 mg/kg exceeds the industrial/commercial Tier 1 RO of 8 mg/kg and Tier 1 compliance for this interval is not achieved. However, a UCL calculated by dropping the highest detected (outlier) concentration of 28, yields a UCL of 5.367 mg/kg, suggesting Tier 1 compliance is achievable. Calculation sheets for the UCL without the highest concentration are also provided in Appendix F.7.
3.3.2 REC 1: Historic Landfill Operations – Landfill Materials
Samples collected from the landfilled material samples are often from the zone below the
seasonal water table, due to depth of observed contamination, and the characterization required
to satisfy TACO Subpart Criteria. However, leachate samples were also collected to evaluate
interior landfill conditions. For the evaluation of TACO soil exposure pathways, only that data
collected from above the landfill seasonal water table are used as described below.

RI, ROR and RAP V3 Companies • 30 Blue Island Northeast Mixed-Use Commercial Park, Blue Island, IL August 2013
Tier 1 Soil Evaluation
Based upon the exceedance of applicable Tier 1 ROs, the COCs identified from the landfill
materials samples and borings include VOCs, SVOCs, PCBs and metals. Samples collected
below the seasonal groundwater table are not included in the soil evaluation, but considered in
the groundwater / leachate evaluation. The following summarizes the Tier 1 exceedances by
exposure route, parcel and chemical group:
Soil Ingestion Exposure Route: Evaluation of the site data above the seasonal water table
indicates the Tier 1 ingestion RO for industrial/commercial scenario is exceeded for the
following COCs:
Refer to Section 3.1 for Subpart C soil saturation limit exceedances and TSCA PCBs below the
water table.
Metals Parcel A Parcel E
- -
Parcel D Parcel C
arsenic -
Arsenic will be evaluated further by statistical analysis, see Section 3.3.1.1. Removal of the
impacted soil or installation and maintenance of a barrier to exclude the ingestion pathway
would be required in the areas where the soil ingestion exposure route RO is exceeded.
Soil Inhalation Exposure Route: Evaluation of the site data above the seasonal water table
indicates the Tier 1 inhalation ROs for industrial/commercial scenario is not exceeded.
Construction Worker Exposure Route: Evaluation of the site data above the seasonal water
table indicates the Tier 1 ingestion and/or inhalation ROs for the construction worker scenario
are not exceeded.
Refer to Section 3.1 for Subpart C soil saturation limit exceedances and TSCA PCBs below the
water table.
Worker notification would be required in the areas where the soil inhalation exposure route RO
is exceeded.
Soil Component of the Groundwater Ingestion Exposure Route: Evaluation of the site data
above the seasonal water table indicates the Tier 1 soil component of the Class II groundwater
ingestion route RO is not exceeded.
Refer to Section 3.5.1 for a Tier 3 evaluation. In addition, a groundwater use restriction will be
applied.
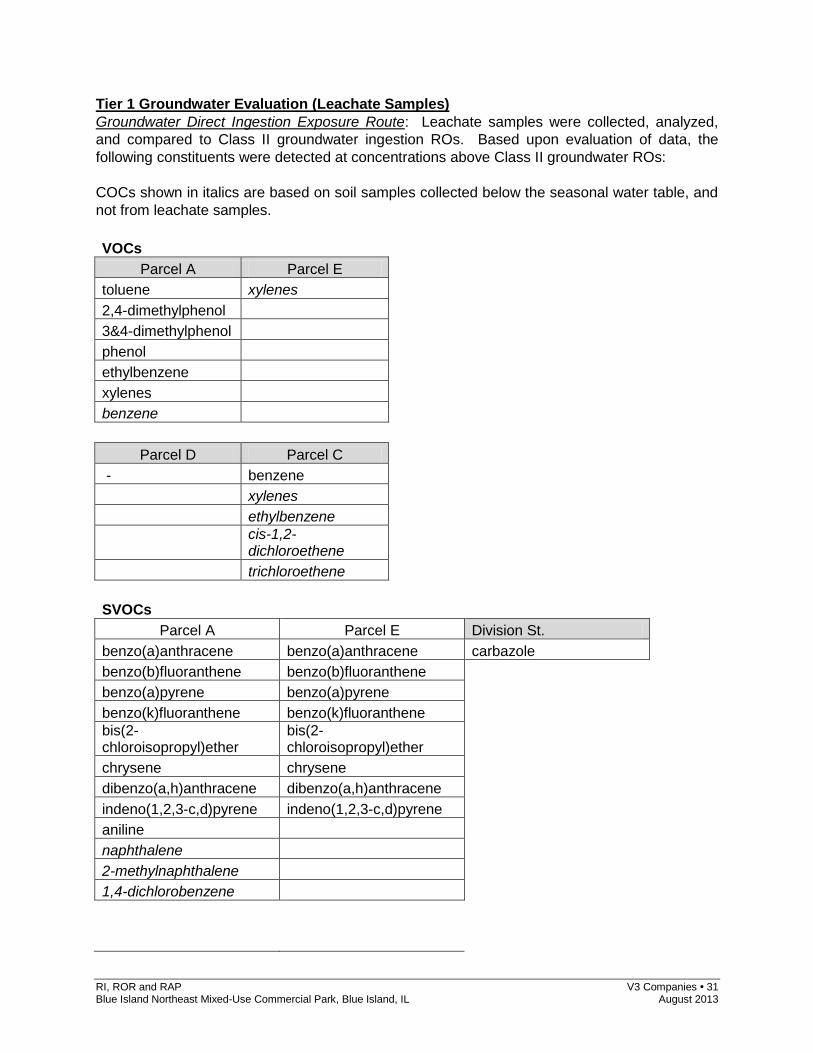
RI, ROR and RAP V3 Companies • 31 Blue Island Northeast Mixed-Use Commercial Park, Blue Island, IL August 2013
Tier 1 Groundwater Evaluation (Leachate Samples)
Groundwater Direct Ingestion Exposure Route: Leachate samples were collected, analyzed,
and compared to Class II groundwater ingestion ROs. Based upon evaluation of data, the
following constituents were detected at concentrations above Class II groundwater ROs:
COCs shown in italics are based on soil samples collected below the seasonal water table, and
not from leachate samples.
VOCs Parcel A Parcel E
toluene xylenes
2,4-dimethylphenol 3&4-dimethylphenol phenol ethylbenzene xylenes benzene
Parcel D Parcel C
- benzene
xylenes
ethylbenzene
cis-1,2-dichloroethene
trichloroethene
SVOCs Parcel A Parcel E Division St.
benzo(a)anthracene benzo(a)anthracene carbazole
benzo(b)fluoranthene benzo(b)fluoranthene
benzo(a)pyrene benzo(a)pyrene
benzo(k)fluoranthene benzo(k)fluoranthene
bis(2-chloroisopropyl)ether
bis(2-chloroisopropyl)ether
chrysene chrysene
dibenzo(a,h)anthracene dibenzo(a,h)anthracene
indeno(1,2,3-c,d)pyrene indeno(1,2,3-c,d)pyrene
aniline naphthalene
2-methylnaphthalene
1,4-dichlorobenzene
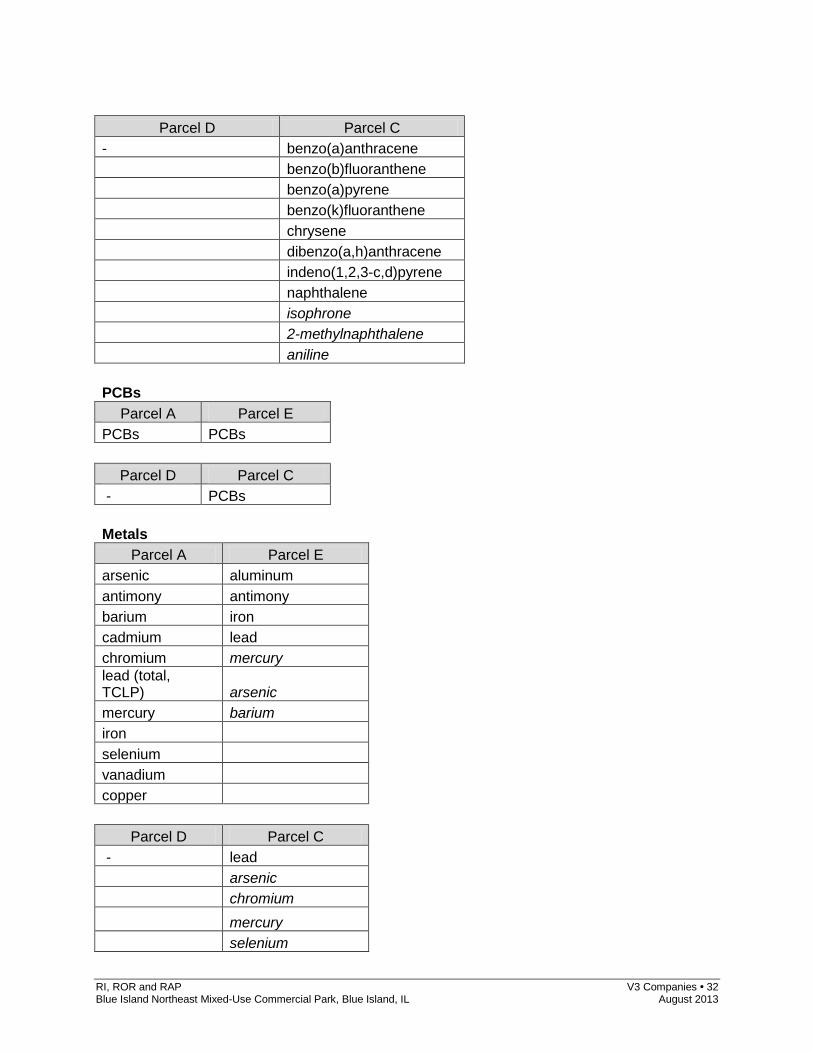
RI, ROR and RAP V3 Companies • 32 Blue Island Northeast Mixed-Use Commercial Park, Blue Island, IL August 2013
Parcel D Parcel C
- benzo(a)anthracene
benzo(b)fluoranthene
benzo(a)pyrene
benzo(k)fluoranthene
chrysene
dibenzo(a,h)anthracene
indeno(1,2,3-c,d)pyrene
naphthalene
isophrone
2-methylnaphthalene
aniline
PCBs Parcel A Parcel E
PCBs PCBs
Parcel D Parcel C
- PCBs
Metals Parcel A Parcel E
arsenic aluminum
antimony antimony
barium iron
cadmium lead
chromium mercury
lead (total, TCLP) arsenic
mercury barium
iron selenium vanadium copper
Parcel D Parcel C
- lead
arsenic
chromium
mercury
selenium
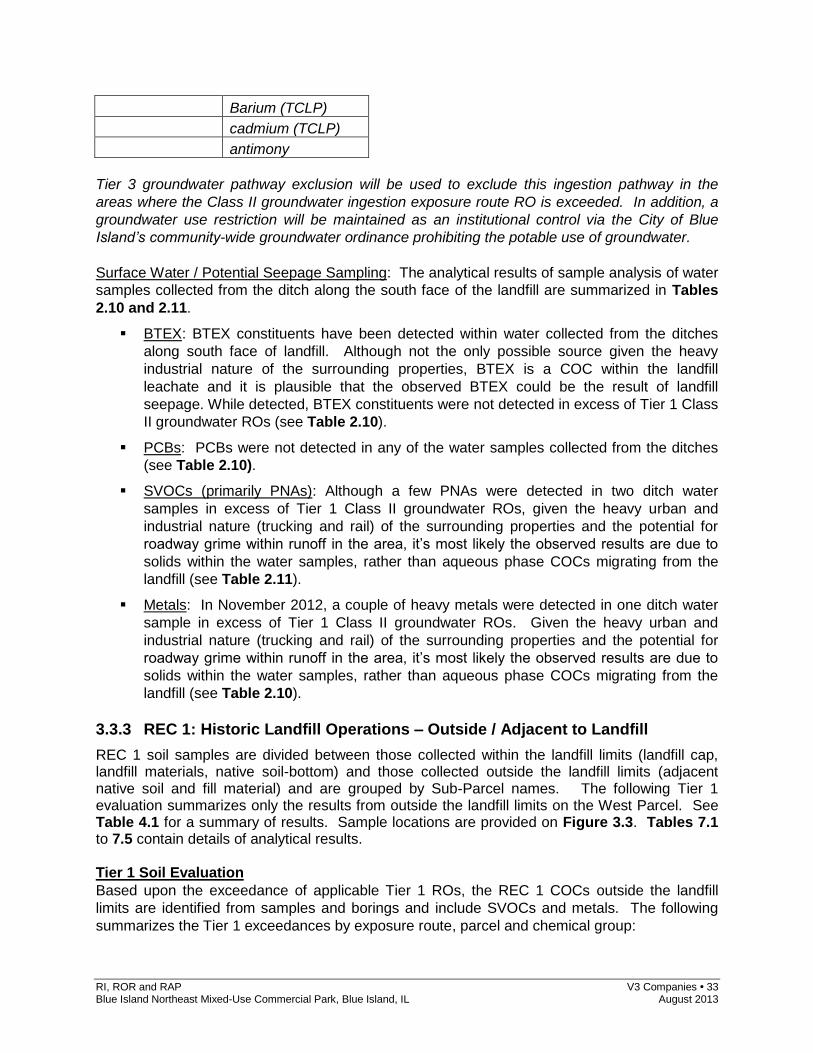
RI, ROR and RAP V3 Companies • 33 Blue Island Northeast Mixed-Use Commercial Park, Blue Island, IL August 2013
Barium (TCLP)
cadmium (TCLP)
antimony
Tier 3 groundwater pathway exclusion will be used to exclude this ingestion pathway in the
areas where the Class II groundwater ingestion exposure route RO is exceeded. In addition, a
groundwater use restriction will be maintained as an institutional control via the City of Blue
Island’s community-wide groundwater ordinance prohibiting the potable use of groundwater.
Surface Water / Potential Seepage Sampling: The analytical results of sample analysis of water
samples collected from the ditch along the south face of the landfill are summarized in Tables
2.10 and 2.11.
BTEX: BTEX constituents have been detected within water collected from the ditches
along south face of landfill. Although not the only possible source given the heavy
industrial nature of the surrounding properties, BTEX is a COC within the landfill
leachate and it is plausible that the observed BTEX could be the result of landfill
seepage. While detected, BTEX constituents were not detected in excess of Tier 1 Class
II groundwater ROs (see Table 2.10).
PCBs: PCBs were not detected in any of the water samples collected from the ditches
(see Table 2.10).
SVOCs (primarily PNAs): Although a few PNAs were detected in two ditch water
samples in excess of Tier 1 Class II groundwater ROs, given the heavy urban and
industrial nature (trucking and rail) of the surrounding properties and the potential for
roadway grime within runoff in the area, it’s most likely the observed results are due to
solids within the water samples, rather than aqueous phase COCs migrating from the
landfill (see Table 2.11).
Metals: In November 2012, a couple of heavy metals were detected in one ditch water
sample in excess of Tier 1 Class II groundwater ROs. Given the heavy urban and
industrial nature (trucking and rail) of the surrounding properties and the potential for
roadway grime within runoff in the area, it’s most likely the observed results are due to
solids within the water samples, rather than aqueous phase COCs migrating from the
landfill (see Table 2.10).
3.3.3 REC 1: Historic Landfill Operations – Outside / Adjacent to Landfill
REC 1 soil samples are divided between those collected within the landfill limits (landfill cap, landfill materials, native soil-bottom) and those collected outside the landfill limits (adjacent native soil and fill material) and are grouped by Sub-Parcel names. The following Tier 1 evaluation summarizes only the results from outside the landfill limits on the West Parcel. See Table 4.1 for a summary of results. Sample locations are provided on Figure 3.3. Tables 7.1 to 7.5 contain details of analytical results. Tier 1 Soil Evaluation
Based upon the exceedance of applicable Tier 1 ROs, the REC 1 COCs outside the landfill
limits are identified from samples and borings and include SVOCs and metals. The following
summarizes the Tier 1 exceedances by exposure route, parcel and chemical group:
RI, ROR and RAP V3 Companies • 34 Blue Island Northeast Mixed-Use Commercial Park, Blue Island, IL August 2013
Soil Ingestion Exposure Route: Evaluation of the site data indicates the Tier 1 ingestion RO for
industrial/commercial scenario are exceeded for the following COCs:
The construction worker route is evaluated separately.
SVOCs
Metals
benzo(a)pyrene arsenic
lead
These SVOCs and metals will be evaluated further by statistical analysis, see Section 3.3.1.1.
Removal of the impacted soil or installation and maintenance of a barrier to exclude the
ingestion pathway would be required in the areas where the soil ingestion exposure route RO is
exceeded.
Soil Inhalation Exposure Route: Evaluation of the site data indicates the Tier 1 inhalation ROs for the industrial/commercial scenario is not exceeded. Construction Worker Exposure Route: Evaluation of the site data indicates the Tier 1 ingestion
and/or inhalation ROs for the construction worker scenario are exceeded for the following
COCs:
Metals
barium
lead
Worker notification would be required in the areas where the construction worker exposure route ROs are is exceeded. Soil Component of the Groundwater Ingestion Exposure Route: Evaluation of the site data above the seasonal water table indicates the Tier 1 soil component of the Class II groundwater ingestion route RO is exceeded for the following COCs:
SVOCs
Metals
3,3'-dichlorobenzidine
lead
Based on these results, removal of the impacted soil, groundwater modeling (Tier 2) or a Tier 3
evaluation will be used to exclude the exposure pathway in the areas where the Class II soil
component to groundwater ingestion exposure route RO is exceeded. In addition, a
groundwater use restriction will be applied.
See Section 3.3.5 for groundwater samples around the perimeter of the landfill.
3.3.4 REC 2: Historical USTs / ASTs
REC 2 is located within Parcel D, northwest section of the West Parcel. The USTs/AST area is just outside of the landfill limits. REC 2 covers VOCs, SVOCs and TPH as related to petroleum USTs/ ASTs only. The remainder of COCs in the area is covered under REC 1. See Table 4.1 for a summary of results. Sample locations are provided on Figure 3.2. Tables 7.1 to 7.5 contain details of analytical results.
RI, ROR and RAP V3 Companies • 35 Blue Island Northeast Mixed-Use Commercial Park, Blue Island, IL August 2013
Tier 1 Soil Evaluation Based upon the exceedance of applicable Tier 1 ROs, the COCs identified from REC 2 samples
and borings include VOCs, SVOCs, and metals. The following summarizes the Tier 1
exceedances by exposure route, parcel and chemical group:
Soil Ingestion Exposure Route: Evaluation of the site data indicates the Tier 1 ingestion RO for
industrial/commercial scenario is exceeded for the following COCs:
SVOCs
Parcel D
benzo(a)anthracene
benzo(a)pyrene
dibenzo(a,h)anthracene
indeno(1,2,3-c,d)pyrene
benzo(b)fluoranthene
Removal of the impacted soil or installation and maintenance of a barrier to exclude the
ingestion pathway would be required in the areas where the soil ingestion exposure route RO is
exceeded.
Soil Inhalation Exposure Route: Evaluation of the site data indicates the Tier 1 inhalation ROs
for industrial/commercial scenario was not exceeded.
Construction Worker Exposure Route: Evaluation of the site data indicates the Tier 1 ingestion
and/or inhalation ROs for the construction worker scenario are exceeded for the following
COCs:
VOCs
SVOCs
Metals
Parcel D
Parcel D
Parcel D
xylenes
naphthalene mercury
benzo(a)pyrene
dibenzo(a,h)anthracene
Worker notification would be required in the areas where the soil inhalation exposure route RO
is exceeded.
Soil Component of the Groundwater Ingestion Exposure Route: Evaluation of the site data
indicates the Tier 1 soil component of the Class II groundwater ingestion route RO is exceeded
for the following COCs:
VOCs
SVOCs
Parcel D
Parcel D
benzene
benzo(a)anthracene
ethylbenzene
benzo(a)pyrene
benzo(b)fluoranthene

RI, ROR and RAP V3 Companies • 36 Blue Island Northeast Mixed-Use Commercial Park, Blue Island, IL August 2013
carbazole
dibenzo(a,h)anthracene
naphthalene
2-methylnaphthalene
N-nitrosodiphenylamine
dibenzofuran
Based on these results, removal of the impacted soil, groundwater modeling (Tier 2) or a Tier 3
evaluation will be used to exclude the exposure pathway in the areas where the Class II soil
component to groundwater ingestion exposure route RO is exceeded. In addition, a
groundwater use restriction will be applied.
Groundwater sampling was performed on MW-15. See Section 3.3.5 for groundwater samples around the perimeter of the landfill.
3.3.5 REC 1: Historic Landfill Operations – Groundwater
The perimeter wells around the landfill will be evaluated as a whole over the west parcel. These
samples are groundwater samples to evaluate if any migration has occurred outside the landfill
boundaries. Refer to Figure 2.3 for well locations and Tables 6.1 and 6.2.
Tier 1 Groundwater Evaluation (Groundwater Samples)
Groundwater Direct Ingestion Exposure Route: Groundwater samples were collected,
analyzed, and compared to Class II groundwater ingestion ROs. Based upon evaluation of
data, the following constituents were detected at concentrations above Class II groundwater
ROs:
Metals
aluminum
iron
lead
Groundwater modeling (Tier 2) will be used to exclude this ingestion pathway in the areas
where the Class II groundwater ingestion exposure route RO is exceeded. In addition, a
groundwater use restriction will be applied along with the use of the City of Blue Island
groundwater use restriction ordinance. Off-site notification will apply to any off-site
concentrations.
3.3.6 REC 1: Historic Landfill Operations – Indoor Inhalation
The new amendments to 35 IAC Part 742 Section 742.515(c) contain two separate exposure
routes that are used to evaluate the indoor inhalation pathway: soil gas and groundwater. In
evaluating areas of concern for indoor inhalation risks, the existing groundwater data was used
to evaluate this pathway.
Groundwater Data Review: Existing groundwater data was compared to the Tier 1
industrial/commercial groundwater ROs for the inhalation exposure pathway provided in Part

RI, ROR and RAP V3 Companies • 37 Blue Island Northeast Mixed-Use Commercial Park, Blue Island, IL August 2013
742, Appendix B, Table H. The Tier 1 ROs in Appendix B, Table H consider both diffusion and
advection, are the most stringent, and are required to be used within 5 feet of a building.
Table 3.3 compares the groundwater results for the Site to the Tier 1 ROs of Appendix B, Table
H. For wells with detections of VOCs, SVOCs and mercury in groundwater, the concentrations
exceed the indoor inhalation industrial-commercial Tier 1 ROs at two locations within Parcel A.
Parcels E, C and the perimeter wells do not contain indoor inhalation exceedances based on
the groundwater wells.
In accordance with Section 742.515(c), compliance with Tier 1 ROs for Appendix B, Table H is
achieved by meeting either the soil gas ROs or the groundwater ROs. As a result, the
groundwater results indicate an indoor inhalation exposure pathway risk is present.
3.4 TACO TIER 2 EVALUATION
When investigation data for a COC are less than Tier 1 ROs, no further TACO evaluation or
remedial action is necessary. Tier 2 evaluations were performed for any remaining COCs not
eliminated from consideration under Tier 1 or Tier 3 as described below. Tier 2 remediation
objectives were determined by RBCA modeling for the soil component of the groundwater
ingestion and the groundwater direct ingestion exposure routes. The Tier 2 modeling
documentation and summary tables are attached in Appendix G and the Tier 2 results are
discussed below.
Tier 2 groundwater remediation objectives can be developed if a groundwater use restriction is
used to “move” the Tier 1 compliance point to the property boundary / remediation site
boundary. Tier 1 Class II ROs are used to evaluate compliance on-site. Class I ROs are
applicable off-site.
Tier 2 Evaluation Based on the Tier 1 evaluation, a Tier 2 evaluation was performed to develop site-specific, risk-based soil and groundwater remediation objectives in accordance with the applicable provisions of Part 742 (IAC Section 742.600 et seq.) for the constituents of concern described above that exceed Tier 1 remediation objectives for the following exposure routes:
Soil Component of the Groundwater Ingestion Exposure Route and
Groundwater Direct Ingestion Exposure Route.
A spreadsheet (Appendix G.4), which incorporates the equations, algorithms, and default values of the Risk-Based Corrective Action (RBCA) model, was used to develop Tier 2 ROs. V3 completed a RBCA equation R26 simulation for groundwater samples to address the ingestion route related to groundwater.
Soil Component of the Groundwater Ingestion Exposure Route – The Tier 2 for this exposure route will be addressed following remediation.
Groundwater Direct Ingestion Exposure Route
During the RI V3 conducted a hydrologic investigation (Section 2.3.2) in which a site-specific
hydraulic conductivity was calculated (Appendix C). The average of the three calculated
hydraulic conductivity values was used in the Tier 2 simulations (Appendix G).
RI, ROR and RAP V3 Companies • 38 Blue Island Northeast Mixed-Use Commercial Park, Blue Island, IL August 2013
Three groundwater source concentrations are above Tier 1, Class II groundwater pathway ROs:
Aluminum: MW-15, MW-16
Iron: MW-16, MW-09
Lead: MW-16
V3 completed a RBCA equation R26 simulation for the groundwater concentrations to
determine:
The distance from the source at which the predicted concentrations of COCs achieved
Tier 1, Class I (off-site) and Class II (on-site) Groundwater remediation objectives within
groundwater, and
The predicted concentrations within groundwater at the compliance point.
Based on the southward direction of groundwater flow (Section 2.2.2), the Site property boundary was used as the down-gradient compliance point for the development of the Tier 2 ROs. However, due to the data’s close proximity to the boundary, to be conservative, the shortest distance to the boundary was used to assess compliance with Tier 2 ROs. Some of the perimeter wells are outside the parcel boundaries, so the onsite distance to receptor did not apply. The use of the Site boundary as the compliance point will require a groundwater use restriction on the Site, which would prevent the installation and/or use of potable wells. There are no potable groundwater supply wells on-site.
A discussion and table summarizing the model parameters (inputs) used in the equations are
attached in Appendix G.2, Table G.1, along with simulation results and calculations.
The modeling results are summarized below:
Based upon the RBCA groundwater simulations, the Tier 1, Class I and II groundwater
remediation objective for aluminum is not achieved at MW-15 and MW-16 prior to
reaching the property boundary.
The Tier 1, Class I and II groundwater remediation objectives are not achieved before
reaching the adjacent property for lead concentrations at location MW-16 on the south
end of the Site.
The Tier 1, Class I and II groundwater remediation objectives are not achieved before
reaching the adjacent property for iron concentrations at location MW-16 and MW-09.
Because the RBCA simulations failed to achieve Tier 1 Class I groundwater ROs at the
property boundary, the City of Blue Island groundwater ordinance will be used as an
institutional control for on-site and off-site groundwater use restriction. Off-site notification
will apply to each owner affected by off-site concentrations.
3.5 TIER 3 EXPOSURE ROUTE EVALUATION
35 IAC Part 742 (TACO) provides three “tiers” for developing site ROs. Section 742.900 (Tier 3
Evaluation) establishes a flexible framework to develop ROs outside the requirements of Tier 1
RI, ROR and RAP V3 Companies • 39 Blue Island Northeast Mixed-Use Commercial Park, Blue Island, IL August 2013
and 2. The physical nature of landfills and certain conditions within them are unique and do not
lend themselves easily to evaluation under Tiers 1 and 2. The following two sections discuss
Tier 3 evaluations developed in accordance 35 IAC Part 742.925 and Part 742.920,
respectively, as it relates to the groundwater exposure pathway and to the presence of COC
concentrations that exceed default soil saturation limits (Csat) at certain locations within the
landfill materials.
3.5.1 Groundwater Exposure Route Exclusion
As discussed in Section 3.3.2, the groundwater / leachate within the landfill contains residual COC concentrations that do not achieve Tier 1 ROs, and given the nature of the landfill, traditional Tier 2 fate and transport modeling using RBCA algorithms is not appropriate. The identified COC concentrations represent a theoretical risk to Site and local groundwater. To further evaluate conditions in association with these COCs, a Tier 3 exposure route evaluation is proposed in accordance with Section 742.925 (Title 35 IAC Part 742). The purpose of the evaluation is to demonstrate that there is no actual or potential impact of contaminants of concern (COCs) to receptors via the groundwater exposure pathway. Receptors in this case include the use of local groundwater as a potable resource. The COCs include the following constituents that did not achieve Tier 1 Class II groundwater ROs:
VOCs (predominantly BTEX constituents)
SVOCs (predominantly PNAs)
PCBs (noted within samples from temporary wells—likely false positives, but not permanent low-flow sampled wells)
Metals (various) The Tier 3 exposure route evaluation is based upon several key considerations:
The source of the subject COCs is the presence of landfilled materials that were emplaced at the Site more than 50 years ago—prior to the 1960’s capping of the landfill. This suggests the sampled leachate appropriately reflects any COCs leaching from site soils and the wastes materials within the landfill;
The landfilled materials have been emplaced in a clay borrow excavation of low permeability (see discussion below), and which has been capped with compacted clay that averages 7 feet or more across the west landfill. No evidence of notable and continuous sand or gravel seams has been observed in any of the wells that surround the perimeter of the landfill. The clay lined landfill has created a “bathtub” effect;
After 50 years, there is no evidence that any of the subject COCs have migrated outside the limits of the landfill at concentrations exceeding Tier 1, Class II groundwater ROs (see Section 3.3.3 discussion for wells installed along the landfill perimeter), and in most cases subject COCs are not detected within the perimeter wells;
In accordance with 35 IAC Part 742.925 (“Exposure Routes”), the following provides the necessary discussion to support the request for site-specific ROs.
a. Exposure route evaluated: Groundwater direct ingestion and the soil to groundwater exposure routes.
b. Site description and physical site characteristics: As described above, the COCs
exceeding Tier 1 Class II groundwater ROs are present within groundwater / leachate

RI, ROR and RAP V3 Companies • 40 Blue Island Northeast Mixed-Use Commercial Park, Blue Island, IL August 2013
found within the clay-lined interior of the landfill. These COCs have not been observed in excess of Tier 1 Class II groundwater ROs outside the limits of the waste pile. The landfill has been capped with clay averaging 7 feet or more, limiting infiltration and leachate generation. The toe of the slopes at the southern extents of the landfill do represent potential seepage zones. However, COCs attributable to potential aqueous phase contamination has not been observed in the perimeter monitoring wells or the ditch water sampled within these zones.
c. Result and possibility of the route becoming active in the future: The landfill has been
capped for over 50 years. The materials within the landfill have had decades to degrade and leach and no evidence of COCs migration is being observed outside the landfill. There are no future development plans for the landfill that would disturb the existing clay cap or slopes in a way that would promote migration of COCs outside the landfill. The City of Blue Island maintains a community-wide groundwater ordinance prohibiting the installation of groundwater wells for potable water use.
d. Technical support:
1) Natural or man-made barriers to that exposure route. The landfilled materials were emplaced within a clay borrow formerly used to manufacture bricks. The clays that remain underlying and surrounding the sides of the waste pile are of very low permeability—the measured hydraulic conductivities from perimeter wells surrounding the landfill are approximately 10-7 cm/s (see Section 2.2.2). Further, the landfill was capped with a compacted clay in the 1960’s. These low permeability clays minimize infiltration, leachate generation and the migration of aqueous phase contamination as evidenced by the perimeter groundwater monitoring.
2) Physical and chemical properties of contaminants of concern. The primary COCs within the landfill waste pile / leachate are typically of low mobility (metals, PNAs and PCBs). BTEX constituents represent the most potentially mobile of the COCs, but the fate and transport of the BTEX constituents is greatly attenuated by the impermeable clays and their natural organic carbon content.
3) Contaminant migration properties. PCBs are virtually immobile, PNAs and metals
are of low mobility, and as expressed above the potential for BTEX migration within the clays surrounding the landfill is very limited. Given the heterogeneous nature of materials within the landfill waste pile and the lack of COCs migration observed within the perimeter monitoring wells, traditional Tier 2 RBCA fate and transport modeling does not make technical sense. Modeling of any COCs observed in perimeter wells in excess of Tier I Class II groundwater ROs has been conducted, and more appropriately reflects the potential for contaminant migration.
3.5.2 Impractical Remediation
As discussed in Section 3.1, deep soils within the landfill contain COC concentrations that exceed the TACO default soil saturation limits. The Csat exceedances include the following:
Parcel A: BI-GP-19 / BI-GP-304: The default soil saturation limit for benzene (870
mg/kg) and xylenes (320 mg/kg) has been exceeded at BI-GP-19 within the landfill
materials at 44-46 feet (881 mg/kg and 1130 mg/kg, respectively). The default soil
saturation limit for ethylbenzene (400 mg/kg) and xylenes (320 mg/kg) has been
RI, ROR and RAP V3 Companies • 41 Blue Island Northeast Mixed-Use Commercial Park, Blue Island, IL August 2013
exceeded at BI-GP-304 within the landfill materials at 53-55 feet (1100 mg/kg and 2300
mg/kg, respectively).
Parcel C: BI-GP-309: The default soil saturation limit for ethylbenzene (400 mg/kg) and
xylenes (320 mg/kg) has been exceeded at BI-GP-309 within the landfill materials at 46-
48 feet (520 mg/kg and 970 mg/kg, respectively).
The identified COC concentrations represent a theoretical risk to Site and local groundwater. To further evaluate conditions in association with these COCs, a Tier 3 impractical remediation evaluation is proposed in accordance with Section 742.920 (Title 35 IAC Part 742). The purpose of the evaluation is to demonstrate that there is no actual or potential migration or impact of contaminants of concern (COCs) to receptors and remediation of such conditions within the saturated zone of a landfill is not practical. In accordance with 35 IAC Part 742.920 (“Impractical Remediation”), the following provides the necessary discussion to support the request for site-specific ROs.
a. The reason why remediation is impractical: The above noted default Csat exceedances are present at depths exceeding 40 feet bgs, and most often in excess of 50 feet bgs. The conditions are also present within a heterogeneous fill and the saturated zone of the landfill waste pile. While these conditions have been identified in a couple locations, it is likely other Csat exceedances are present across the landfill. Given the large areal extent of landfilled material, it is not practical to attempt a reduction of the concentrations of the subject COCs at these depths, within the saturated zone of the waste pile and across a potentially large areal extent due to significant costs and effort to access soils this deep. Further, based upon the discussions contained within Section 3.5, there is no evidence that the groundwater pathway is active and that BTEX migration beyond the limits of the landfill is occurring in excess of Tier 1 Class II groundwater ROs. These conditions have been present in excess of 50 years and have not resulted in outward migration of COCs.
b. The extent of contamination:
The following paragraphs summarize the extent of contamination and conditions as they relate to the presence of BTEX constituent soil saturation limits exceedances at the Site.
BTEX Csat exceedances were identified at depth within Parcels A (e.g., BI-GP-19 and BI-GP-304) and C (BI-GP-309).
Of the more than 19 locations sampled at similar depths, only 3 samples were shown with one or more BTEX COCs exceeding respective soil saturation limits.
While some apparent clustering of BTEX Csat exceedances is noted (e.g., BI-GP-19 and BI-GP-304), the overall distribution of Csat exceedances is likely sporadic across the lower depths of the landfill materials.
No evidence of BTEX constituents and Csat exceedances has been noted within soil borings advanced for installation of the perimeter groundwater wells. As a result, soil saturation exceedances are limited to the materials present at depth inside the landfill limits only.
c. Geology / soil types:
The soil types in the subsurface areas of impact are largely landfill material consisting of loose, wet clay with glass, wood, metal and paper. The “landfill
RI, ROR and RAP V3 Companies • 42 Blue Island Northeast Mixed-Use Commercial Park, Blue Island, IL August 2013
material” is the soils and refuse that was used to backfill the former clay excavation from 1952-1966. It is present to depths up to 60 feet bgs in the West Parcel. In general, many borings that intersected the landfill materials contained a decaying garbage odor, as well as occasional petroleum and solvent-like odors.
The landfilled materials were emplaced within a clay borrow formerly used to manufacture bricks. The clays that remain underlying and surrounding the sides of the waste pile are of very low permeability—the measured hydraulic conductivities from perimeter wells surrounding the landfill are approximately 10-7
cm/s (see Section 2.2.2). Boring logs indicate drilling refusal in the native clay beneath the landfill due to the hard pan clays. Further, the landfill was capped with compacted clay in the 1960’s. These low permeability clays minimize infiltration, leachate generation and the migration of aqueous phase contamination as evidenced by the perimeter groundwater monitoring.
d. Potential Impact to groundwater:
Per the discussions contained within Section 3.5, no impacts to local groundwater resources are anticipated, nor have any been observed. There is no evidence that COCs within the groundwater / leachate in excess of Tier 1 Class II groundwater ROs are migrating beyond the limits of the landfill clay sides. Per Section 3.5, it is our judgment that the groundwater exposure pathway, as it relates to COCs and leachate present within the landfill, may be excluded as there is no actual or potential impact of contaminants of concern to receptors. There are no potable wells within 2,400 feet of the site, and the City of Blue Island municipal ordinance prohibiting the installation of potable water wells within the municipal limits will be used as an institutional control to prohibit the potable use of groundwater at the Site and within the area surrounding the landfill.
e. Results / locations of sampling events:
Parcel A: BI-GP-19 / BI-GP-304: The default soil saturation limit for benzene (870
mg/kg) and xylenes (320 mg/kg) has been exceeded at BI-GP-19 within the landfill
materials at 44-46 ft (881 mg/kg and 1130 mg/kg, respectively). The default soil
saturation limit for ethylbenzene (400 mg/kg) and xylenes (320 mg/kg) has been
exceeded at BI-GP-304 within the landfill materials at 53-55 ft (1100 mg/kg and 2300
mg/kg, respectively). Screening of nearby boring BI-SB-01 did not indicate BTEX
odors (just septic odors), but did contain elevated PID readings.
Parcel C: BI-GP-309: The default soil saturation limit for ethylbenzene (400 mg/kg)
and xylenes (320 mg/kg) has been exceeded at BI-GP-309 within the landfill
materials at 46-48 ft (520 mg/kg and 970 mg/kg, respectively). Nearby samples at BI-
GP-308, BI-SB-07 and BI-GP-21 did not identify VOCs above the soil saturation limit.
f. Map of the area:
See Figures 1.2 and 3.2.
g. Current / post remediation land use / human receptors: Currently, the Site is primarily underutilized commercial and industrial land. The southwestern portion of the landfill is currently vacant, and soccer fields were once maintained west of Division Street within Parcels A and E. The intended reuse of the
RI, ROR and RAP V3 Companies • 43 Blue Island Northeast Mixed-Use Commercial Park, Blue Island, IL August 2013
Site is industrial, with typical uses anticipated to have a freight / material transfer and material processing and storage component to them. Regional stormwater detention facilities are anticipated for construction within the southern portion of Parcel A.
3.6 REMEDIATION OBJECTIVES
The following presents the proposed Site remediation objectives (ROs), as well as the
institutional controls necessary for development of site-specific ROs.
Institutional Controls
Section 742.1000 (Subpart J; IAC Part 742) requires the establishment of institutional controls
for ROs developed based on industrial/commercial property use and the exclusion of exposure
routes/pathways. As per Section 742.1000(a), institutional controls will be placed on the Site
that would:
Restrict the property use to industrial-commercial;
Restrict subsurface construction and maintenance (in specified areas) to qualified
personnel (i.e., in accordance with applicable OSHA regulations) via construction worker
notification;
Restrict groundwater usage at the Site, and in potentially impacted off-site areas, by
using the City of Blue Island community-wide groundwater ordinance (copy provided in
CSIR dated March 2010) as an institutional control for excluding groundwater use;
Require any existing or potential buildings located over the current extent of groundwater
contamination to have a full concrete slab-on-grade floor or full concrete basement floor
and walls with no sump(s); and
Maintain barriers to exclude exposure routes as applicable to specified areas.
As per Section 742.310(b), the soil ingestion route may be excluded if an appropriate
engineered barrier, as set forth in Subpart K, is installed.
The No Further Remediation (NFR) letter will require current and future property owners to
maintain the integrity of the specified barriers, as well as restrict all subsurface construction to
qualified personnel (i.e., in accordance with applicable OSHA regulations) as applicable to the
specified areas.
Section 742.320 specifies the conditions under which the groundwater ingestion exposure route
may be excluded. [Note: The conditions for excluding the groundwater exposure pathway are
satisfied per the simulations and evaluations presented in Section 3.4 and 3.5.1, and by the
using the City of Blue Island groundwater ordinance for restricting groundwater use on-site, and
in potentially impacted off-site areas.]
Remediation Objectives
The following ROs are proposed for the Site:
Tier 1 industrial/commercial and construction worker ROs for the soil inhalation and soil
ingestion exposure pathways;
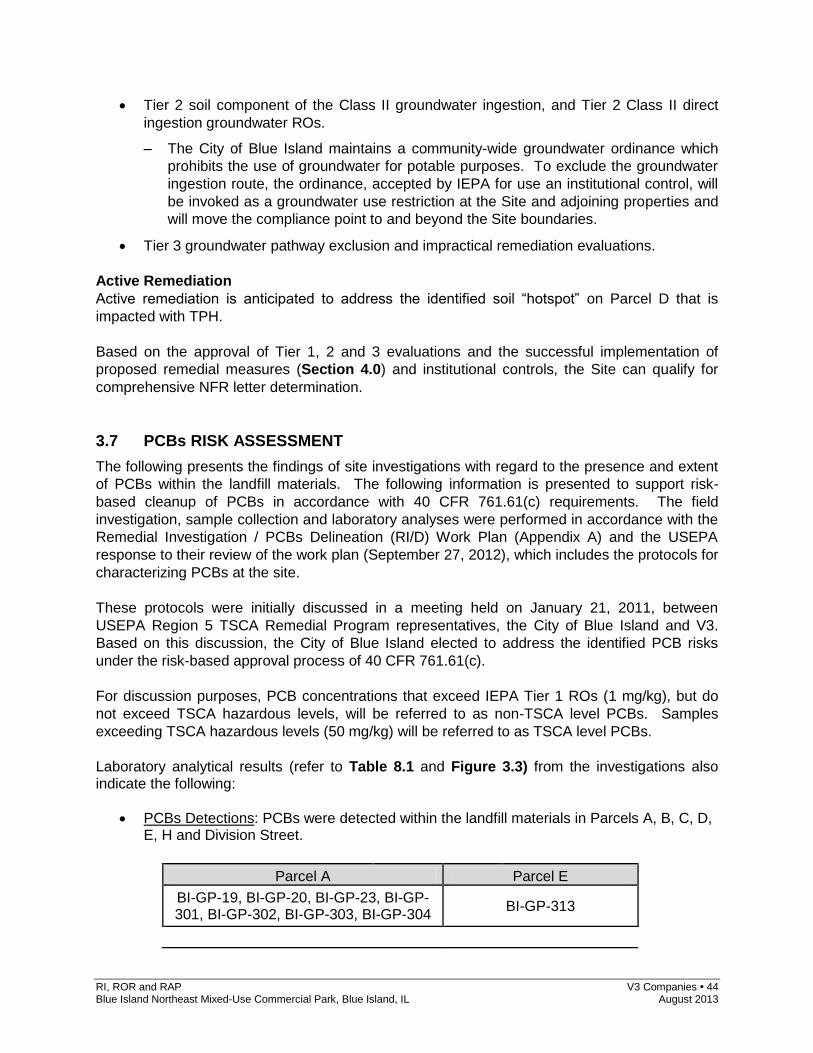
RI, ROR and RAP V3 Companies • 44 Blue Island Northeast Mixed-Use Commercial Park, Blue Island, IL August 2013
Tier 2 soil component of the Class II groundwater ingestion, and Tier 2 Class II direct
ingestion groundwater ROs.
– The City of Blue Island maintains a community-wide groundwater ordinance which
prohibits the use of groundwater for potable purposes. To exclude the groundwater
ingestion route, the ordinance, accepted by IEPA for use an institutional control, will
be invoked as a groundwater use restriction at the Site and adjoining properties and
will move the compliance point to and beyond the Site boundaries.
Tier 3 groundwater pathway exclusion and impractical remediation evaluations.
Active Remediation
Active remediation is anticipated to address the identified soil “hotspot” on Parcel D that is
impacted with TPH.
Based on the approval of Tier 1, 2 and 3 evaluations and the successful implementation of
proposed remedial measures (Section 4.0) and institutional controls, the Site can qualify for
comprehensive NFR letter determination.
3.7 PCBs RISK ASSESSMENT
The following presents the findings of site investigations with regard to the presence and extent
of PCBs within the landfill materials. The following information is presented to support risk-
based cleanup of PCBs in accordance with 40 CFR 761.61(c) requirements. The field
investigation, sample collection and laboratory analyses were performed in accordance with the
Remedial Investigation / PCBs Delineation (RI/D) Work Plan (Appendix A) and the USEPA
response to their review of the work plan (September 27, 2012), which includes the protocols for
characterizing PCBs at the site.
These protocols were initially discussed in a meeting held on January 21, 2011, between
USEPA Region 5 TSCA Remedial Program representatives, the City of Blue Island and V3.
Based on this discussion, the City of Blue Island elected to address the identified PCB risks
under the risk-based approval process of 40 CFR 761.61(c).
For discussion purposes, PCB concentrations that exceed IEPA Tier 1 ROs (1 mg/kg), but do
not exceed TSCA hazardous levels, will be referred to as non-TSCA level PCBs. Samples
exceeding TSCA hazardous levels (50 mg/kg) will be referred to as TSCA level PCBs.
Laboratory analytical results (refer to Table 8.1 and Figure 3.3) from the investigations also indicate the following:
PCBs Detections: PCBs were detected within the landfill materials in Parcels A, B, C, D, E, H and Division Street.
Parcel A Parcel E
BI-GP-19, BI-GP-20, BI-GP-23, BI-GP-301, BI-GP-302, BI-GP-303, BI-GP-304
BI-GP-313
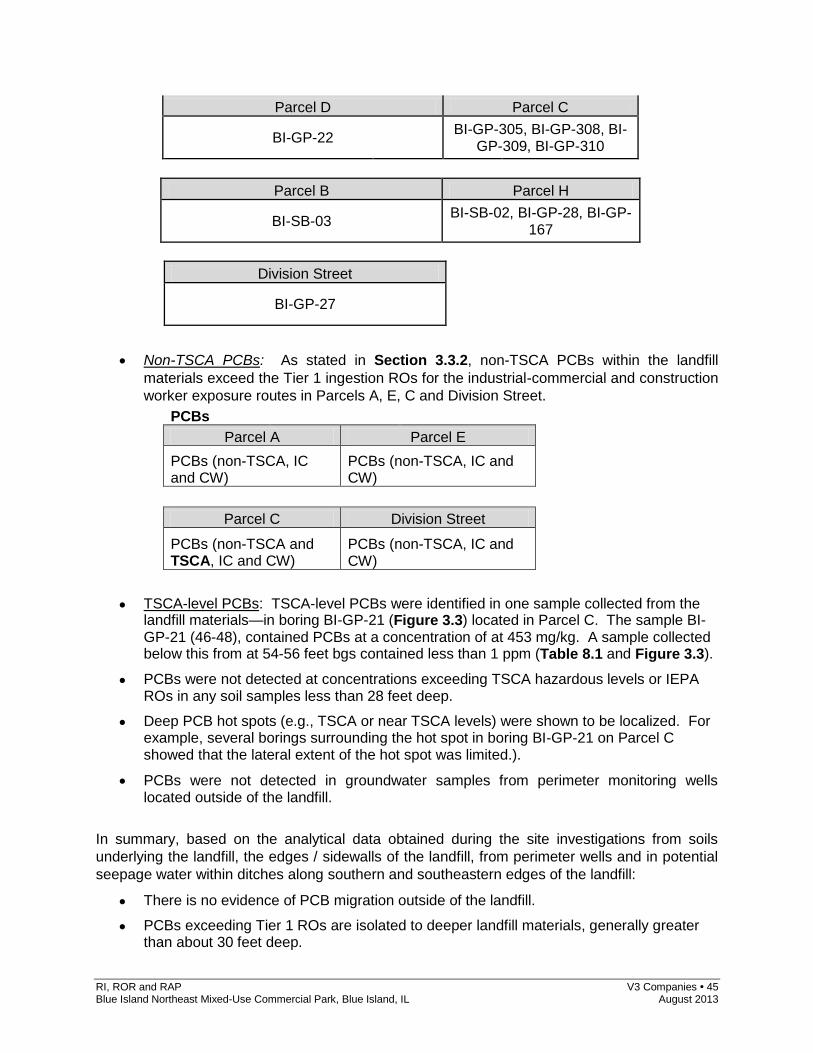
RI, ROR and RAP V3 Companies • 45 Blue Island Northeast Mixed-Use Commercial Park, Blue Island, IL August 2013
Parcel D Parcel C
BI-GP-22 BI-GP-305, BI-GP-308, BI-
GP-309, BI-GP-310
Parcel B Parcel H
BI-SB-03 BI-SB-02, BI-GP-28, BI-GP-
167
Division Street
BI-GP-27
Non-TSCA PCBs: As stated in Section 3.3.2, non-TSCA PCBs within the landfill
materials exceed the Tier 1 ingestion ROs for the industrial-commercial and construction
worker exposure routes in Parcels A, E, C and Division Street.
PCBs Parcel A Parcel E
PCBs (non-TSCA, IC and CW)
PCBs (non-TSCA, IC and CW)
Parcel C Division Street
PCBs (non-TSCA and TSCA, IC and CW)
PCBs (non-TSCA, IC and CW)
TSCA-level PCBs: TSCA-level PCBs were identified in one sample collected from the landfill materials—in boring BI-GP-21 (Figure 3.3) located in Parcel C. The sample BI-GP-21 (46-48), contained PCBs at a concentration of at 453 mg/kg. A sample collected below this from at 54-56 feet bgs contained less than 1 ppm (Table 8.1 and Figure 3.3).
PCBs were not detected at concentrations exceeding TSCA hazardous levels or IEPA ROs in any soil samples less than 28 feet deep.
Deep PCB hot spots (e.g., TSCA or near TSCA levels) were shown to be localized. For example, several borings surrounding the hot spot in boring BI-GP-21 on Parcel C showed that the lateral extent of the hot spot was limited.).
PCBs were not detected in groundwater samples from perimeter monitoring wells located outside of the landfill.
In summary, based on the analytical data obtained during the site investigations from soils
underlying the landfill, the edges / sidewalls of the landfill, from perimeter wells and in potential
seepage water within ditches along southern and southeastern edges of the landfill:
There is no evidence of PCB migration outside of the landfill.
PCBs exceeding Tier 1 ROs are isolated to deeper landfill materials, generally greater than about 30 feet deep.

RI, ROR and RAP V3 Companies • 46 Blue Island Northeast Mixed-Use Commercial Park, Blue Island, IL August 2013
There are no TSCA level or Tier 1 RO exceedances for PCBs in the cap materials.
As a result, it is our judgment that, in accordance with past discussions with USEPA, the results
of the site characterization and PCBs risk-assessment support the following PCBs cleanup
proposal:
The landfill’s existing clay cap is proposed to provide a minimum 3-feet thick clay cap (cover) to prevent exposure to the PCBs identified at depth within the landfill materials of the Western Parcel. Refer to Section 4.6 of the Remedial Action Plan for details.
RI, ROR and RAP V3 Companies • 47 Blue Island Northeast Mixed-Use Commercial Park, Blue Island, IL August 2013
4.0 REMEDIAL ACTION PLAN
The following sections discuss the RAP, which was designed to address COCs at the Site. The RAP discusses overall remediation goals and those areas of the Site where remedial measures will be conducted to exclude exposure pathways, or conducted to allow pathway exclusion (e.g., excavation of impacted soils to satisfy the Subpart C requirements for pathway exclusion). Pathway exclusion will be accomplished by the placement of engineered barriers, construction worker notification, a Tier 3 evaluation, and a Site groundwater use restriction. The Industrial/Commercial land use scenario provides the basis for excluding from further consideration, COCs that do not exceed Tier 1 ROs. Subpart C requirements will be satisfied in part by the excavation and disposal of soils with TPH exceeding the attenuation capacity of site soils. The institutional controls and Tier 3 evaluation will provide the basis for excluding exposure routes remaining after Tier 1 and 2 analyses. These measures will provide the basis for requesting a Comprehensive NFR letter for the Site. This RAP addresses RECs 1 and 2. RECs 3 and 4 have been addressed under the CSI.
4.1 REMEDIATION GOALS
As discussed in Section 3.2.1, the primary COCs within Site soils include BTEX, PNAs, PCBs, metals located beneath the landfill water table at depths exceeding 25 feet bgs (with most deeper than 40 feet bgs), and Arsenic, Lead and PNAs within the landfill cap soils. Concentrations of these constituents were detected above one or more of the following Tier 1 RO pathways: industrial-commercial and construction worker ingestion, industrial-commercial and construction worker inhalation, Class II soil component of the groundwater ingestion and Class II groundwater ingestion. Based on the above described impacts, intended future use and in accordance with Site ROs
(Section 3.6), the remedial goals / actions for the Site are summarized as follows:
Remediate exceedances of Subpart C source material criteria resulting from elevated
TPH concentrations at Parcel D, REC 2.
In accordance with past USEPA Region 5 discussions and the risk-based approval
process of 40 CFR 761.61(c), utilize the existing landfill cap to provide a minimum 3-feet
clay cover to address exposure risks results from PCBs present at depth within the
landfill materials.
Establish approved engineered barrier types that may be used to address TACO soil
ingestion exposure risks resulting from COCs other than PCBs; these barriers will
include both hard surfaces and prescriptive and “alternative” earthen barriers, and will be
used in varying capacities dependent on final land use plans. [Note: Based on the final
end use of the Property, utilization of optional engineered barriers is anticipated to
address the applicable exposure routes. Such barriers may consist of asphalt pavement,
concrete surface, alternative earthen barriers, or a 3-feet clean soil cap. The existing
clay cap is not specifically proposed as a TACO compliant clean soil barrier at this time.
However, the potential use of the existing cap as a clean soil barrier may be allowable
and specified as such in certain locations in the future—via ROR/RAP amendment.]
Groundwater pathway exclusion using the City of Blue Island municipal groundwater
ordinance.
RI, ROR and RAP V3 Companies • 48 Blue Island Northeast Mixed-Use Commercial Park, Blue Island, IL August 2013
Mitigate Landfill Gas (LFG) and indoor inhalation risks; the RAP provided herein lays out
the conceptual approach for addressing these concerns. Specific designs and Building
Control Systems (BCTs) to be provided as amendment(s) to the RAP once respective
land use plans are defined.
The following active cleanup actions are proposed to address parcel-specific environmental
impacts:
Parcel D
TPH / Soil Attenuation Capacity: Perform remediation (excavate, transport and dispose) of soils in which TPH concentrations are in excess of the soil attenuation capacity of Site soils at soil boring BI-GP-318. This condition must be addressed to allow pathway exclusion through the use of Tier 2 and 3 site-specific ROs, and engineering and institutional controls. Refer to Section 4.4.
Any remaining Tier 1 industrial-commercial and construction worker soil and groundwater RO exceedances will be addressed through:
Tier 2 and 3 ROs;
Groundwater use restriction via City of Blue Island municipal ordinance;
Use of existing landfill clay cap to address PCBs exposure risks per USEPA
requirements;
Construction and maintenance of engineered barriers to address soil ingestion exposure
risks;
Construction and maintenance of BCTs and LFG gas venting and management
techniques to address indoor inhalation and LFG risks; and
Notifications to construction workers of site conditions and assurance all work is
completed pursuant to OSHA requirements.
To accommodate the future installation of engineered barriers, site grading and improvements, and the on-site management of impacted soils, the RA is requesting the establishment of a soil management zone (SMZ) in accordance with 35 IAC Section 740.535 (Establishment of Soil Management Zones). A detailed discussion regarding how the remediation goals will be achieved is presented in subsequent sections of the RAP. Refer to Table 4.1 for a list of exceedances and exposure pathway resolutions.
4.2 SOIL MANAGEMENT ZONE
As discussed previously and as depicted in Figure 4.4, the establishment of the Parcels A, E, C and D as an SMZ is being requested. The SMZ is being requested in accordance with 35 IAC Section 740.535, as more specifically described in the following discussions. Purpose / Use: The SMZ is being requested to allow the consolidation of contaminated soils with the Remediation Site, to accommodate engineered barrier installation (see Section 4.5), and the on-site management of contaminated soils resulting from future site grading and foundation and/or underground utility construction.
RI, ROR and RAP V3 Companies • 49 Blue Island Northeast Mixed-Use Commercial Park, Blue Island, IL August 2013
Site Investigation / COCs: The Site and affected soils have been appropriately characterized and the COCs identified during the Comprehensive Site Investigation performed at the Site, and described previously within this report. Dimensions: The requested SMZ will extend across the entire Remediation Site and have a maximum vertical depth equal to the bottom of landfill cap material, approximately 6 – 10 feet deep (see Figure 4.4). Construction and Operation: The SMZ will be operated and maintained in a manner that:
prevents odors from occurring, minimizes fugitive emissions of particulate matter, prevents generation of potentially contaminated runoff, and does not provide a breeding place or food source for vectors.
To minimize odors and/or dust generation, excavated soils that are stockpiled for later use will be covered with plastic and a water truck will be used when needed to further minimize dust generation during construction. To prevent runoff from the Site, silt fencing will be used during construction and grading. Soils will be stockpiled and graded in a manner that does not provide a breeding place for vectors. Exposure Routes: The SMZ will be covered with a combination of engineered barriers. The SMZ will be capped with either a permanent structure (building slab), paved parking area, 3 feet of clean soil, or a geotextile with 1 feet of clean soil (See Figures 4.4 and 4.5). The specified barriers (Types I and II) are described in more detail in Section 4.5. Institutional controls including barrier maintenance and construction worker notifications will be included within the NFR letter. Contaminated Soil Consolidation: No contaminated soils that exhibit hazardous waste characteristics, containing TSCA PCBs or free product will be re-located within the SMZ. The re-deposit of contaminated soils (e.g., soils containing concentrations of COCs in excess of Tier 1 industrial-commercial ROs) will not occur in any location within the Remediation Site where all COCs are present below Tier 1 industrial-commercial ROs. SMZ Duration: It is the intent of the RA that termination of the SMZ will occur upon issuance of a final NFR, perfected in accordance with 35 IAC Sections 740.620, 740.621 and 740.622.
4.3 SITE PREPARATION
Site preparation may include but is not limited to the following:
Installation of temporary security fencing;
Use of ambient air monitoring equipment; and
Location of site utilities.
4.4 Parcel D: REC 2 – TPH Dig and Haul
4.4.1 Remediation Overview
A TPH soil attenuation exceedance (23,000 mg/kg) is located on Parcel D at borehole BI-GP-318 (12-13 feet deep), which must be removed. A deeper sample (15-16 feet) has a TPH concentration of 2,598 mg/kg, which is less than the site-specific TPH soil attenuation limit of 9,100 mg/kg. Based upon neighboring sample concentrations, this issue is an isolated “hotspot”. Refer to Figures 2.2 and 4.1 for boring locations. The remediation plan includes
RI, ROR and RAP V3 Companies • 50 Blue Island Northeast Mixed-Use Commercial Park, Blue Island, IL August 2013
excavating and removal of the soils for off-site disposal. The excavations will be backfilled with engineered clean clay fill or other suitable material. Refer to Figure 4.1 for the location of the remediation area.
4.4.2 Excavation and Soil Removal
Soils with visible TPH impacts will be excavated and loaded directly into trucks or roll-off boxes for disposal as certified non-special waste. The following excavation and disposal is anticipated:
The proposed remediation area measures approximately 30’ by 30’ around boring BI-GP-318 (Figure 4.1). The target removal interval is approximately 10’-15. V3 estimates that approximately 160 cubic yards (about 300 tons) of TPH-impacted soil will be removed and disposed.
Groundwater and/or seepage water may enter the excavation during soil excavation and removal. If needed, any water that comes in direct contact with the impacted soils within the remediation excavation will be pumped out and disposed off site by a licensed liquid waste hauler/disposal company.
4.4.3 Remediation Verification Sampling
At the conclusion of excavation activities, verification soil samples will be collected from the
excavation walls and bottom. Samples will be analyzed for TPH.
The cleanup actions will be deemed complete when visually impacted soils have been removed and the analytical results are less than or equal to 9,100 mg/kg (the site-specific foc). If verification samples indicate that TPH impacted soils exceed of 9,100 mg/kg still remain, additional excavation and disposal will be performed until verification samples show that the remediation goal has been achieved.
4.4.4 Excavation Backfill
Following excavation and removal of impacted soils, imported clean compacted clay fill and/or
surrounding suitable cap soils will be used as backfill for the remainder of the excavation.
Structural fill may be used in the excavations from a commercial quarry. Imported fill needed to
complete backfilling at the Site will be certified TACO clean or sampled by V3 prior to accepting
and bringing the soils on-site.
As necessary, a representative soil sample of imported backfill material will be collected and
submitted to an Illinois NELAP accredited laboratory for analysis of Target Compound List (TCL)
analytes and pH. TCL samples will include VOCs, SVOCs, PCB, pesticides and TAL metals.
Laboratory results will be compared to Tier 1 residential remediation objectives (ROs). Any
soils imported onto the Site must achieve Tier 1 residential ROs. V3 will review the laboratory
reports and communicate to the contractor which soils are acceptable for import. Any imported
soils deemed unsuitable for backfill will not be used at the Site. For the limited amount of fill
anticipated (approximately 160 cubic yards), one TCL sample is proposed for laboratory
analysis.
4.4.5 Post Remediation Monitoring
Subsequent to completion of remediation and backfill activities, one permanent groundwater
monitoring well will be installed down-gradient from (east of) the former TPH source. The well
will be installed to a depth of approximately 20 feet deep and will be constructed of 2-inch
diameter PVC materials. The slotted well casing interval will extend from 5’-20’ bgs.
RI, ROR and RAP V3 Companies • 51 Blue Island Northeast Mixed-Use Commercial Park, Blue Island, IL August 2013
Soil and groundwater samples will be collected for laboratory analysis of TPH and PAHs.
Results will be compared to TACO Tier 1 Industrial/Commercial ROs. If needed based upon an
evaluation of sample results, a well pump test will be performed to evaluate soil hydrological
parameters.
4.5 ENGINEERED BARRIERS AND INSTITUTIONAL CONTROLS
4.5.1 Engineered Barriers
The construction of engineered barriers is anticipated as part of the remedial action plan to
address PAHs and metals impacts exceeding Tier 1 industrial commercial soil ingestion ROs.
As per Section 742.315(b) the soil ingestion route may be excluded from consideration if an
appropriate engineered barrier, as set forth in Subpart K, is in place. The NFR letter will require
current and future property owners to maintain the integrity of the specified surface barriers as
well as restrict all subsurface construction to qualified personnel (i.e., in accordance with
applicable OSHA regulations) as applicable to the specified areas.
The areas of the Site where COC levels exceed the ROs for the industrial-commercial soil
ingestion exposure route will be covered with one or more of the following types of engineered
barriers:
Type I Engineered Barrier: 3’ of clean soil, or 12” of clean soil (including topsoil),
underlain by a permeable geotextile.
Type II Barrier: hardened engineered barriers constructed of asphalt or concrete
pavements and concrete building slabs.
Specific land use plans are not available at this time, but the installed barriers will include a
combination of the Type I and Type II engineered barriers more specifically described in the
following sections. Remedial action plans for specific areas will be provided as amendments to
this plan as end-use plans are developed for respective areas of the Site.
4.5.1.1 Type I Engineered Barriers
Two separate Type I engineered barriers designs are anticipated as follows:
Type IA Engineered Barrier: 12” of clean soil (including topsoil), underlain by a
permeable geotextile (Appendix H), covering the contaminated soils. This barrier type
is anticipated to cover the areas of the Site such as larger open space, regional
detention facilities, and earth / aggregate covered storage and operations yards.
Type IB Engineered Barrier: 3’ of clean soil (including topsoil), covering the
contaminated soils. This barrier type is anticipated in areas where significant
landscaping planting may be planned (e.g., the 3’ of clean soil will accommodate the root
balls of larger plantings, such and trees and shrubs.
Type IB is a prescriptive barrier option under Engineered Barrier Requirements Section
742.1105(c)(2)(C). Therefore, the following information is provided in support of obtaining
special approval on Type IA, and is not applicable to the specification of the Type IB barrier.
Supporting Information for Type IA Engineered Barrier Request: To minimize the volume of soil
requiring removal and/or import resulting in significant grade alterations, the RA is requesting a
RI, ROR and RAP V3 Companies • 52 Blue Island Northeast Mixed-Use Commercial Park, Blue Island, IL August 2013
Tier 3 determination allowing the use of the Type IA barrier with a minimum soil cover thickness
of 12”. The specified geotextile to be placed between the clean and impacted soils is a
Geotex® 801 Nonwoven Geotextile. The geotextile is compatible with the COCs and is a strong
permeable material that will prevent unintended access to, and deter the ingestion of, the
underlying soils, while allowing infiltration of precipitation across the grass covered areas of the
Site. In combination with the proposed 12” of overlying fill, it is our judgment this barrier type
provides a strong and effective ingestion barrier equivalent to 3’ of clean soil. Specifications for
the geotextile are provided in Appendix H.
As mentioned above, it’s proposed that the larger landscaped open space areas (or industrial /
material yards that may not require hard surfaces) be capped with Type IA earthen barriers.
The concentrations of COCs (metals and PAHs) that would be left beneath this barrier design
are as described in Sections 3.3.1.1 – 3.3.1.8 (95% UCLs). The following is provided in
summary for each COC:
Arsenic: Within the upper several feet of existing clay landfill cap over which the Type IA
barrier would be constructed, the highest observed soil concentration is 67.4 mg/kg.
The 95% UCL calculated for the first several feet of the existing clay landfill cap is 17.8
mg/kg, slightly in excess of the Tier 1 RO of 13 mg/kg. Removing the highest (outlier)
concentration results in a UCL of 12.2 mg/kg. As such, the concentrations beneath the
barrier do not represent notable exposure risks beyond Tier 1 industrial commercial soil
ingestion RO.
Lead: Within the upper several feet of existing clay landfill cap over which the Type IA
barrier would be constructed, the highest observed soil concentration is 1210 mg/kg.
The 95% UCL calculated for the first several feet of the existing clay landfill cap is 237.2
mg/kg, lower than the Tier 1 RO of 800 mg/kg. At 5-7 ft, the maximum concentration is
13,900 mg/kg. Removing the highest (outlier) concentration results in a UCL of 279.4
mg/kg. As such, the concentrations beneath the barrier do not represent notable
exposure risks beyond Tier 1 industrial commercial soil ingestion RO.
Benzo(a)anthracene: Within the upper several feet of existing clay landfill cap over
which the Type IA barrier would be constructed, the highest observed soil concentration
is 19 mg/kg. The 97.5% UCL calculated for the first several feet of the existing clay
landfill cap is 5.027 mg/kg, lower than the Tier 1 RO of 8 mg/kg. As such, the
concentrations beneath the barrier do not represent notable exposure risks beyond Tier
1 industrial commercial soil ingestion RO.
Benzo(a)pyrene: Within the upper several feet of existing clay landfill cap over which the
Type IA barrier would be constructed, the highest observed soil concentration is 13
mg/kg. The 95% UCL calculated for the first several feet of the existing clay landfill cap
is 2.784 mg/kg, slightly in excess of the Tier 1 RO of 2.1 mg/kg. Removing the highest
(outlier) concentration results in a UCL of 2.056 mg/kg. As such, the concentrations
beneath the barrier do not represent notable exposure risks beyond Tier 1 industrial
commercial soil ingestion RO.
Benzo(b)fluoranthene: Within the upper several feet of existing clay landfill cap over
which the Type IA barrier would be constructed, the highest observed soil concentration
is 14 mg/kg. The 95% UCL calculated for the first several feet of the existing clay landfill
cap is 2.977 mg/kg, lower than the Tier 1 RO of 8 mg/kg. As such, the concentrations
beneath the barrier do not represent notable exposure risks beyond Tier 1 industrial
commercial soil ingestion RO.
Dibenzo(a,h)anthracene: Within the upper several feet of existing clay landfill cap over
which the Type IA barrier would be constructed, the highest observed soil concentration

RI, ROR and RAP V3 Companies • 53 Blue Island Northeast Mixed-Use Commercial Park, Blue Island, IL August 2013
is 2.3 mg/kg. The 95% UCL calculated for the first several feet of the existing clay
landfill cap is 0.318 mg/kg, lower than the Tier 1 RO of 0.8 mg/kg. As such, the
concentrations beneath the barrier do not represent notable exposure risks beyond Tier
1 industrial commercial soil ingestion RO.
Indeno(1,2,3-c,d)pyrene: Within the upper several feet of existing clay landfill cap over
which the Type IA barrier would be constructed, the highest observed soil concentration
is 4.8 mg/kg. The 95% UCL calculated for the first several feet of the existing clay
landfill cap is 1.013 mg/kg, lower than the Tier 1 RO of 8 mg/kg. As such, the
concentrations beneath the barrier do not represent notable exposure risks beyond Tier
1 industrial commercial soil ingestion RO.
Imported soil or aggregate fill needed to complete the Site barriers will either be certified TACO
clean or sampled by V3 prior to accepting and bringing the soils on-site.
As necessary, representative samples of imported soil or aggregate will be collected and
submitted to an Illinois NELAP accredited laboratory for analysis. One representative soil
sample for every 1,000 cubic yards of soil will be collected and analyzed for Target Compound
List (TCL) analytes and pH. Any soils imported onto the Site must achieve Tier 1 residential
ROs. V3 will review the laboratory reports and communicate to the contractor which soils are
acceptable for import. Any imported soils deemed unsuitable will not be used at the Site.
Evaluation of Suitable Fill Soils
Any imported fill needed to complete the barrier at the Site, which is not obtained from a
commercial quarry, must be sampled prior to bringing soils on site.
If proposed fill soils are in a stockpile, an environmental professional will collect one
discrete sample for every 1,000 cubic yards of soil to be imported.
If proposed fill soils are in-place (have not yet been excavated), an environmental
professional would collect discrete soil samples using a drilling contractor. A soil
sampling plan (SAP) would first be prepared to guide field activities. The SAP would
include development of a 3-dimensional grid for sampling and laboratory analysis, based
on IEPA protocols.
Samples will be submitted to an Illinois NELAP certified laboratory for analysis of TCL
analytes, cyanide and pH. Laboratory results will be compared to Tier 1 residential
remediation objectives (ROs). Any soils imported onto the Site must achieve Tier 1
residential ROs. V3 will review the laboratory reports and communicate to the contractor
which soils are acceptable for import. Any imported soils deemed unsuitable for backfill
will not be used at the Site.
4.5.1.2 Type II Engineered Barrier
Type II engineered barrier will be a concrete or asphalt surface that may be used for building
slabs, sidewalks, parking areas and internal roadways. The concrete or asphalt will be
constructed of a structurally appropriate thickness according to its use with a structurally
appropriate thickness of granular base material underneath. Any slabs or pavements used as
barrier will include a minimum 4” of concrete or asphalt underlain by a minimum 4” of granular
base.
As per Section 742.315(b) the soil ingestion route may be excluded from consideration if an
appropriate engineered barrier, as set forth in Subpart K, is in place. The NFR letter will require
current and future property owners to maintain the integrity of the specified surface barriers as
RI, ROR and RAP V3 Companies • 54 Blue Island Northeast Mixed-Use Commercial Park, Blue Island, IL August 2013
well as restrict all subsurface construction to qualified personnel (i.e., in accordance with
applicable OSHA regulations) as applicable to the specified areas. As per Section
742.1105(c)(2)(A), these barriers will exclude the soil ingestion routes.
4.5.2 Institutional Controls
Section 742.1000 (Title 35 IAC Part 742) of TACO requires establishment of institutional controls when ROs are based on industrial-commercial property use. The City of Blue Island is planning on the Site being developed for Industrial / Commercial use with green common space. Institutional controls and the use of engineered barriers may be considered as remedial solutions to exclude the ingestion, inhalation and groundwater pathways, after the Subpart C source criteria are first satisfied. As per Section 742.1000(a), institutional controls will be placed on the Site that will:
Restrict all subsurface construction to qualified personnel (i.e., in accordance with applicable OSHA regulations) and provide notification to construction workers of site conditions (Figure 4.4);
Prevent the installation and/or use of potable wells and restrict groundwater usage at the Site, and in potentially impacted off-site areas, by using the City of Blue Island community-wide groundwater ordinance (copy provided in Appendix C of CSIR dated March 2010) as an institutional control for excluding groundwater use; and,
Maintain engineered barriers to exclude exposure routes as applicable to specified areas.
4.6 PCBs – MINIMUM 3-FEET THICK CLAY SOIL BARRIER
4.6.1 Remediation Overview – Cleanup Proposal
Almost no PCBs are present in the shallow landfill material (from less than 20 feet deep), and
none of the detected PCBs in this interval are above cleanup standards (refer to Table 8.1).
The significant PCBs concerns are present greater than 25 feet deep. Furthermore, the highest
PCB “hotspot” concentrations (e.g., TSCA hazardous or near hazardous levels) are generally
present between 30 to 55 feet deep, and are localized and manageable.
As a result, we propose to address potential exposure risks related to PCBs present at depth
within the landfill using a risk-based approach that considers the existing clay landfill cap as part
of the solution, as originally discussed with USEPA. This removes the need for active
remediation to mitigate TSCA level PCB hotspots, which would be impractical and economically
infeasible at the depths present within the landfill.
4.6.2 Regulatory Considerations
Based on the USEPA’s review of the RI/D Work Plan, and in accordance with USEPA response
letter dated September 27, 2012, a TSCA Risk-Based approval and closure process under 40
CFR 761.61(c) is appropriate for the Site, under the following conditions:
A minimum 3-feet thick clean clay cover must be maintained over the landfill waste
materials to prevent a complete exposure pathway,
The cover must remain intact to support redevelopment efforts, and an institutional
control (e.g., a deed restriction) would be used to prohibit disturbing the cover, except
when temporarily affected by grading / construction. Under these conditions, a
RI, ROR and RAP V3 Companies • 55 Blue Island Northeast Mixed-Use Commercial Park, Blue Island, IL August 2013
construction worker notification and Health and Safety Plan would be required to protect
workers from exposure to contamination, and
Develop and implement a plan to prevent contamination from migrating outside of the
landfill during redevelopment (e.g., disallowing deeper intrusive construction work along
the edges of the landfill).
4.6.3 Maintenance of Clean Cover Soils as a Barrier
Should the clean cover soils be disturbed such that the remaining cover is less than 3 feet thick,
enough clean clay must be placed to bring the cover thickness back into compliance. Or, one of
the other types of barriers discussed above must be specified and approved by USEPA.
Any fill materials imported to the Site for backfilling or barrier construction will be sampled prior
to bringing the soils on Site. A representative soil sample of proposed off-site backfill materials
will be collected and submitted to an IEPA certified laboratory for analysis of Target Compound
List (TCL) analytes, cyanide and pH. TCL samples will include VOCs, SVOCs, PCB, pesticides
and target analyte list (TAL) metals. Laboratory results must be compared to Tier 1 residential
ROs, and any soils imported onto the Site must achieve Tier 1 residential ROs.
4.7 LANDFILL GAS / INDOOR INHALATION RISK MITIGATION
As discussed above in Section 2.3.1, the landfill materials are producing notable levels of LFG,
based on gas measurements obtained from soil borings across the landfill (refer to Appendix I
for tabulated LFG measurements).
Additionally, Section 3.3.6 discusses the new amendments to 35 IAC Part 742, Section
742.515(c) related to indoor inhalation risks (vapor intrusion). After evaluating subsurface
analytical data and areas of concern for indoor inhalation risks, it has been determined that an
indoor inhalation exposure pathway risk is present at the site.
Both of these conditions can be successfully mitigated concurrently using the same methods
and equipment. These solutions are presented conceptually below. The design and
specification of an appropriate mitigation system will be presented to the agency once a specific
end-use plan is available.
4.7.1 Construction of Buildings
The construction of new inhabited buildings on the landfill will require the use of appropriate
BCTs to mitigate LFG and indoor inhalation risks. Examples of appropriate BCTs include:
Vapor barrier – a specific type of impermeable liner / geomembrane material (requires
IEPA approval)
Active or passive sub-slab depressurization / venting systems – similar to a radon gas
mitigation system and often used in combination with an approved vapor barrier as a
single system that can be installed during construction of the building foundation.
4.7.2 Installation of Underground Utilities
New underground utilities will ultimately be installed across the Site (but as yet there are no
specific site plans establishing their locations and depths). Underground utility trenches must
be lined with an approved geomembrane material and backfilled with clean clay or a flowable fill
cement (or similar material) where utilities exit the site boundary or enter a structure. Trenches
RI, ROR and RAP V3 Companies • 56 Blue Island Northeast Mixed-Use Commercial Park, Blue Island, IL August 2013
must be backfilled in this manner for a minimum lateral distance of 5 feet from the site boundary
or building, to mitigate the lateral migration pathway and minimize lateral and vertical migration
of landfill gas through the cap and into structures.
4.7.3 Venting of Underground Utilities and Pavement Areas
Large paved areas and underground utility trenches crossing open areas of the site should also
be vented to minimize the risk of methane gas buildup. For example, a passive venting system
should be sufficient, and would consist of lateral PVC piping installed in a grid pattern beneath
the pavement subgrade materials, and running over the tops of utility trenches. The horizontal
piping is connected to a number of vertical vent pipes that can be incorporated into the design of
light standards across the parking area.
4.8 REMEDIAL ACTION COMPLETION REPORT (RACR)
Upon completion of remedial activities and post-remediation data evaluation, a RACR(s) will be prepared for submittal to IEPA. The report(s) will describe the field activities performed in addition to summarizing the following:
completion of the remedial action in accordance with approved RAP(s);
results of the post-remediation data evaluation; and,
documentation that Tier 1 and Site-specific ROs, as well as any other requirements of the RAP, have been attained.
[Note: In accordance with past discussions, cleanup and redevelopment of the Site will occur in phases. As a result, it’s anticipated that separate, and potentially Interim, RACRs may be submitted for specific parcels. It is likely that the RA will seek individual NFR Letters for separate parcels.]
4.9 NO FURTHER REMEDIATION (NFR) LETTER
A NFR letter will be warranted, once exposure routes are excluded through remediation, engineered barrier construction, and the placement of deed restrictions on the property that would:
Restrict the property use to industrial-commercial;
Restrict all subsurface construction to qualified personnel (i.e., in accordance with applicable OSHA regulations);
Restrict groundwater usage at the Site, and potentially impacted off-site areas;
Require any existing or potential buildings located over the current extent of groundwater contamination to have a full concrete slab-on-grade floor or full concrete basement floor and walls with no sump(s); and
Require maintenance of the engineered barriers established to exclude exposure routes.

RI, ROR and RAP V3 Companies • 57 Blue Island Northeast Mixed-Use Commercial Park, Blue Island, IL August 2013
5.0 CONCLUSIONS This report, combined with the previously submitted CSIR, documents the completion of the Comprehensive Site Investigation report, the presentation of the Remediation Objectives report and Remedial Action Plan for Parcels A-E and C-D. In April 2010, October-December 2012, V3 performed the additional activities necessary to address IEPA comments. This report addresses the additional investigations and TACO evaluation performed in pursuit of a comprehensive NFR letter for the Site. It is the judgment of the Site’s licensed professional engineer (LPE) that the supporting data relied upon by V3 Companies meets the intent of the Illinois Environmental Protection Act, as relied upon, and is suitable for consideration by the Agency as supplemental site data. The supplemental investigation and related evaluations, in conjunction with the data and evaluations from V3’s CSIR, performed in conformance with the requirements of 35 IAC Section 740.425, 740.440, 740.445, 740.450, provides a complete presentation of historical data, and investigations related to the Site. It is the LPE’s judgment the data and associated evaluations of this RI/ROR/RAP are adequate for characterization of the identified Site RECs. The following RECs were defined for the Site:
REC 1 – Historical Landfill Operation
REC 2 – Historical ASTs/USTs
REC 3 – Historical Railroad Spurs
REC 4 – Adjoining Petroleum Storage and Use
This report addresses RECs 1 and 2 on the Western Parcel. RECs 3 and 4 have been addressed under the CSI. Site COCs: The detected Site COCs include:
Soils: The predominant soil concerns are present within the landfill materials. Overall,
soil COCs are summarized as follows:
– SVOCs (mainly PAHs), VOCs (limited chlorinated solvents and BTEX), PCBs,
and select heavy metals. These COCs are predominantly present within the
landfill materials.
– COCs within the landfill cap are less common, primarily consist of PAHs and
select heavy metals, and are present at relatively low concentrations. VOCs and
a single pesticide concentration are also present.
Groundwater / Leachate: VOCs, SVOCs (mainly PAHs), metals and PCBs were
identified in water collected from within the landfill limits (leachate), rather than from the
monitoring locations along the landfill perimeter. The perimeter groundwater wells only
identified three elevated metals concentrations.
Based on the approval of Tier 1, 2 and 3 evaluations and the implementation of the remedial
actions (engineered barriers and dig and haul activities) and the following institutional controls,
the Site can qualify for an NFR determination:
Restrict the property use to industrial-commercial;

RI, ROR and RAP V3 Companies • 58 Blue Island Northeast Mixed-Use Commercial Park, Blue Island, IL August 2013
Provide pathway exclusion for the ingestion exposure route through the maintenance of an engineered barrier;
Provide notification to construction workers of site conditions and assure all work is
completed pursuant to OSHA requirements;
Require any existing or potential buildings located over the current extent of groundwater
contamination to have a full concrete slab-on-grade floor or full concrete basement floor
and walls with no sump(s); and
Prevent the installation and/or use of potable wells and restrict groundwater usage at the
Site, and in potentially impacted off-site areas, by using the City of Blue Island
community-wide groundwater ordinance as an institutional control for excluding
groundwater use.
The Remedial Action Plan outlines the remedial actions intended to address the environmental
issues associated with the former Site operations. The primary remedial goals of the RAP
include:
Remediate the exceedance of Subpart C source material criteria resulting from elevated
TPH concentrations at Parcel D, REC 2.
In accordance with past USEPA Region 5 discussions and the risk-based approval
process of 40 CFR 761.61(c), utilize the existing landfill cap to provide a minimum 3-feet
clay cover to address exposure risks results from PCBs present at depth within the
landfill materials.
Establish approved engineered barrier types that may be used to address TACO soil
ingestion exposure risks resulting from COCs other than PCBs; these barriers will
include both hard surfaces and prescriptive and “alternative” earthen barriers, and will be
used in varying capacities dependent on final land use plans.
Groundwater pathway exclusion using the City of Blue Island municipal groundwater
ordinance.
Mitigate LFG gas and indoor inhalation risks; the RAP provided herein lays out the
conceptual approach for addressing these concerns. Specific designs and BCTs to be
provided as amendment(s) to the RAP once respective land use plans are defined.
Parcel-specific land plans are not yet available. For the remedial actions that are dependent on redevelopment, the RAP provides options for addressing the potential industrial-commercial scenarios that are likely to occur.
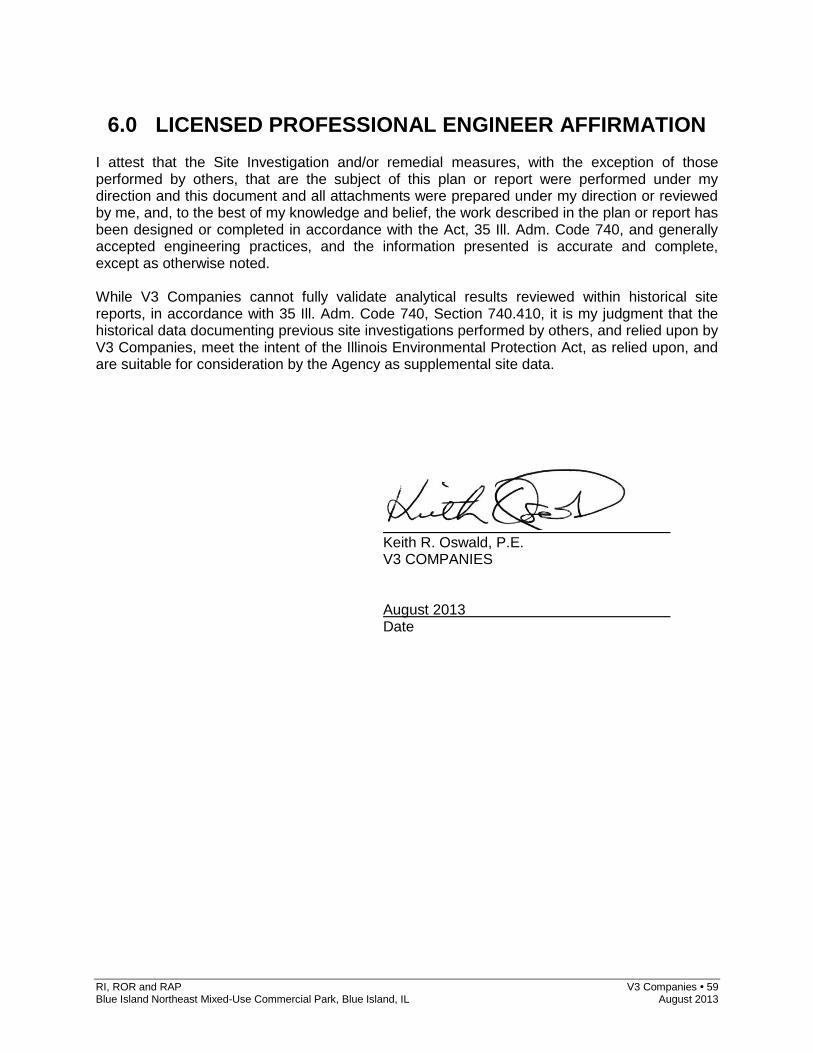
RI, ROR and RAP V3 Companies • 59 Blue Island Northeast Mixed-Use Commercial Park, Blue Island, IL August 2013
6.0 LICENSED PROFESSIONAL ENGINEER AFFIRMATION I attest that the Site Investigation and/or remedial measures, with the exception of those performed by others, that are the subject of this plan or report were performed under my direction and this document and all attachments were prepared under my direction or reviewed by me, and, to the best of my knowledge and belief, the work described in the plan or report has been designed or completed in accordance with the Act, 35 Ill. Adm. Code 740, and generally accepted engineering practices, and the information presented is accurate and complete, except as otherwise noted. While V3 Companies cannot fully validate analytical results reviewed within historical site reports, in accordance with 35 Ill. Adm. Code 740, Section 740.410, it is my judgment that the historical data documenting previous site investigations performed by others, and relied upon by V3 Companies, meet the intent of the Illinois Environmental Protection Act, as relied upon, and are suitable for consideration by the Agency as supplemental site data.
Keith R. Oswald, P.E.
V3 COMPANIES August 2013 Date

FFFIIIGGGUUURRREEESSS

TTTAAABBBLLLEEESSS