remediation is enhanced oil recovery: know your source g.d. beckett, r.g., c.hg. a qui- v er, inc....
TRANSCRIPT

Remediation is Enhanced Oil Recovery: Know Your Source
G.D. Beckett, R.G., C.HG.
AQUI-VER, INC. & SDSU

Steam Flood
Steam Flood
Which Scenario Works Best?
OilOil

It’s Sort Of Obvious..
• E&P expends effort knowing oil distribution– Aim for the oil
– Missing the oil misses revenues
• Environmental restoration has a more spotty record– Sampling difficulty below water tables
– Some misnomers & misconceptions about NAPL• Thickness exaggeration
• Sorption vs. residual
– Dissolved-phase thinking
– Hydrologic time bias in most environmental data sets

Talk Outline
• A few source principles & observations– Chemistry will not be discussed
– Focus is source location relative to cleanup mechanisms
• Site examples where the source zone was missed
• Site example where source zone was pegged
• Conclusions

NAPL is the Source of Risk
Gasoline LNAPL Mass
Water, Vapor &
Sorbed Mass
Equivalent Volumes

Schematic of LNAPL Source Distribution
I II III
IV V
I
IIIII
IV
V

Equilibrium LNAPL Saturation(uniform dune sand)
0.00 0.05 0.10 0.15 0.20 0.25 0.30
Hydrocarbon Saturation
0
1
2
3Z
ab
ove
oil
/wat
er i
nte
rfac
e (f
t)
Predicted SaturationsMeasured Saturations
LN
AP
L

0.0 0.1 0.2 0.3 0.4 0.5 0.6
Hydrocarbon Saturation
-50
0
50
100
150
200
250Z
Ab
ov
e O
il/W
ate
r In
terf
ace
(cm
)
Measured Predicted
H2O
LN
AP
L
LNAPL Saturation in Heterogeneous Soil(interbedded silty sands and sand)
after Huntley et al., 1997
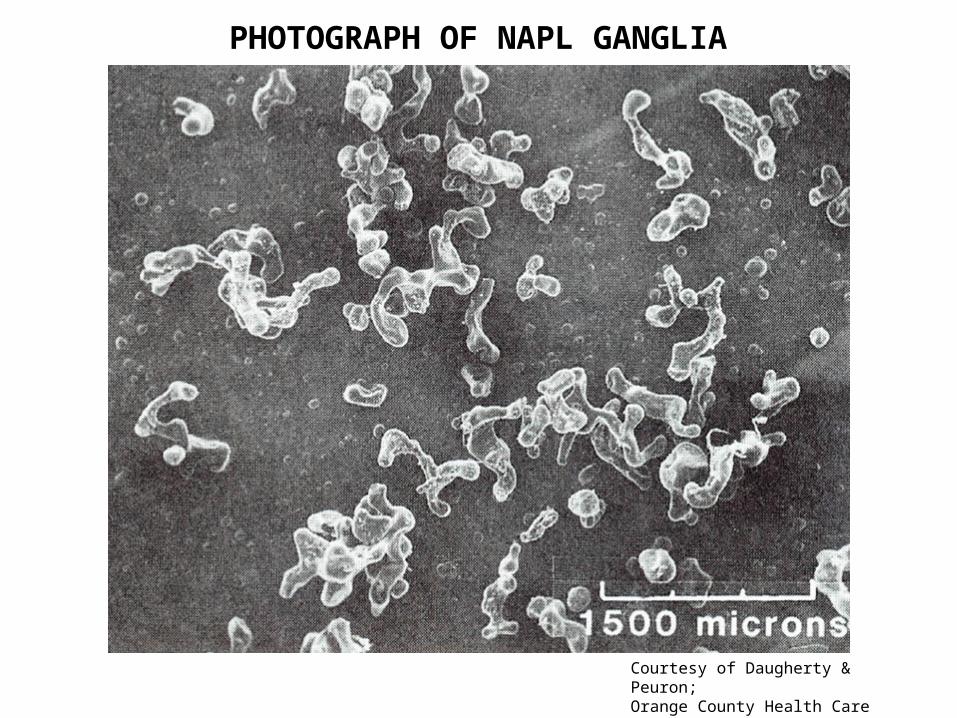
PHOTOGRAPH OF NAPL GANGLIA
Courtesy of Daugherty & Peuron;Orange County Health Care Agency

Courtesy of Terra Tek, Salt Lake City, UT
A Peak Into the Pore Domain (brine to oil mobility spectrum)

The SitesTwo Misses & One Hit
• Site 1: Service station adjacent to tidal stream– Tidal influence affects product distribution & cleanup
– Several years of cleanup have not changed gw impacts
• Site 2: Service station with deep vadose zone– Rise in gw table strands product
– 5 years of cleanup with no meaningful gw benefit
• Site 3: Former fuel terminal with effective targeting– Dewatering with enhanced airflow delivery
– Source zone characterization was key to success

SITE 1
Gasoline LNAPL Adjacent to Tidal Stream

Site Plan & Plume Map
gw flow

LNAPL Source & Geologic Distribution(after the fact)
Section Distance (ft)
0 20 40 60 80 100 120
-5.0
-10.0
-15.0
-20.0
LIF Intensity Contour
CPT Geologic ValueClays Silty Silty Sand
Sand Sand
CB-1 CB-3 CB-4 CB-7 CB-6 CB-10

Remediation Actions
• Horizontal IAS, 18 fbg, uncontrolled flow responses– Airflow in creek
– No direct capture by SVE
• SVE from available wells, pulling upper zone
• Groundwater pumping & skimming
• Combined SVE & groundwater recovery

Remediation Results after 7 years
• Free product thickness decrease in wells– Product still present at low water stands
• No statistical reduction in gw concentrations
• Product discharges to adjacent creek– Despite hydraulic containment in water phase
• System upsizing to pump more water– Increase drawdown into deeper impact zone
– Force airflow into dewatered zone

SITE 2
Stranded LNAPL from Groundwater Rise
No gw benefit from SVE & Pumping

Site Plan & Initial Plume Distribution

Schematic Cross-Section
DispensersSVE &Pumping Well
Sandstone
Shale
F.P
. Zon
e
UST
142.00
144.00
146.00
148.00
150.00
152.00
154.00
156.00
158.00
160.00
10/1/90 10/1/91 9/30/92 9/30/93 10/1/94 10/1/95 9/30/96
DATE
GR
OU
ND
WA
TE
R E
LE
VA
TIO
N (
ft m
sl)
MW-10
MW-11
MW-12
MW-13
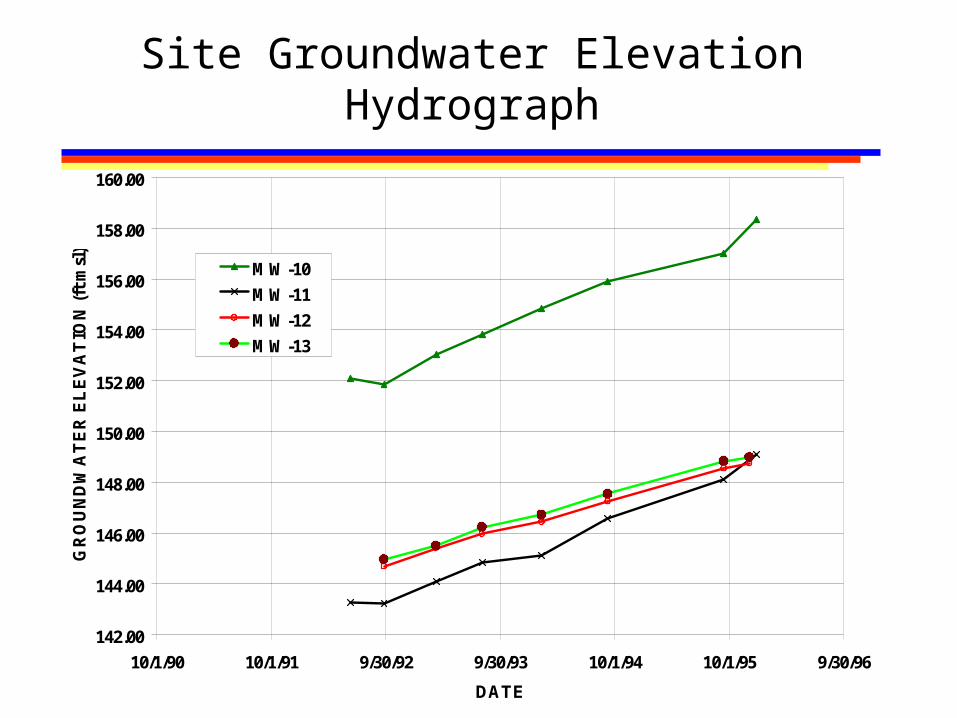
Site Groundwater Elevation Hydrograph

SVE/P&T System Summary; 1991-1996
• Low flow gw pumping planned (< 2 gpm)– Never really ran much, head loss issues
– No effective dewatering
– Water level rise over period of cleanup
• SVE from multilevel screens– Packers not maintained by new contractor
– SVE from full interval
– > 10,000 ppmv TPH initial to 500 ppmv final
– However, discrete well sampling = 9,600 ppmv final

1.0E+03
1.0E+04
1.0E+05
1.0E+06
12/23/88 5/7/90 9/19/91 1/31/93 6/15/94 10/28/95 3/11/97
Co
nce
ntr
atio
n (
ug
/l)
TPH
Benzene
Toluene
Chemical Hydrograph, Sentry Well MW-8

Site Plan & Post SVE/Pumping Plume

Site Plan & Initial Plume Distribution

Site 2 Wrap Up
• Water table rose– No effective dewatering of smear zone
• SVE did not access full smear zone– Ran to asymptotic
– Lower zone pneumatically inefficient
• Dissolved concentrations unchanged at key points
• Despite this, no risk & site obtained NFA status

Fuel Terminal & Operations Site
LNAPL Smear Found & Targeted
Highly Effective Remediation Response

General Site Conditions
• AST & terminal operation sources
• Heterogeneous, interbedded fine materials
• Water table approx. 15 feet below grade (fbg)
• Observed free product gasoline in 12 wells
• Widespread dissolved phase impacts– Initial TPHg max = 500,000 ug/L
– Initial Benzene max = 58,000 ug/L
– Initial MTBE max = 24,000 ug/L

Site Plan; Plume Width 600 ft
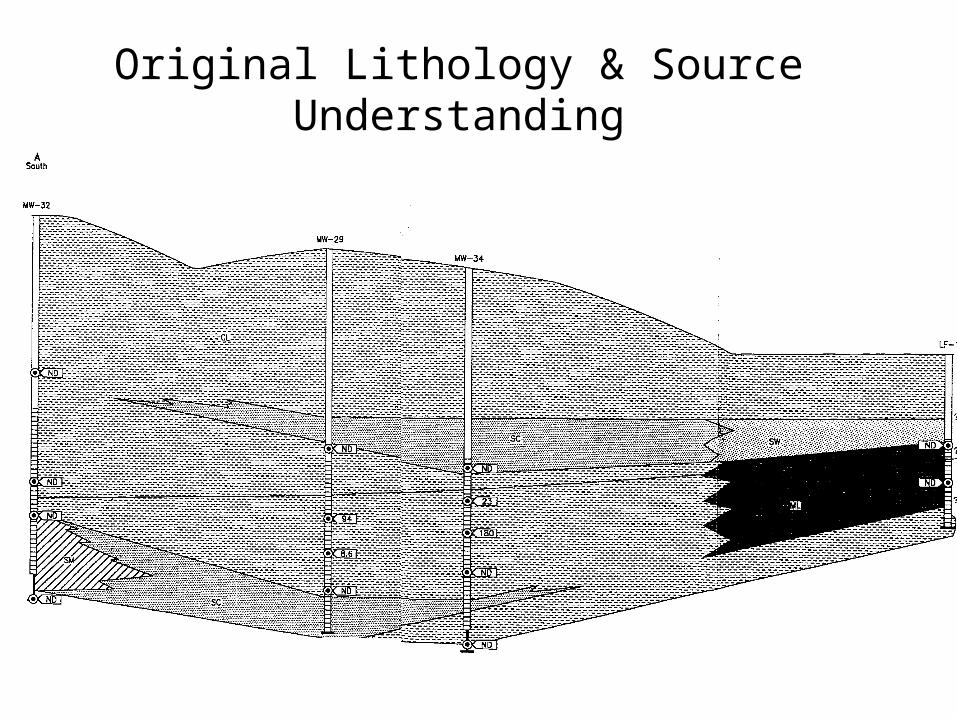
Original Lithology & Source Understanding

0 25 50 75 100 125
75
70
65
60
55
50
45
40
35
30
Section Distance (ft)
Ele
vati
on
(ft
msl
)
Clays/silts
Updated Source & Lithologic Setting
LNAPL zones
SandsSilty Sands

Changes in Thinking
• LNAPL stranded below, not at the water table
• Original design unable to access impacted zones
• Went to dewatering, enhanced airflow strategy– Specific target = smear zone
• Large improvement in subsurface cleanup efficiency
• Large improvement in mass per unit time per cost

Estimated Cleanup Improvement Factor(multiphase calculations)
4
5
6
7
8
9
10
11
12
13
14
0.0 20 40 60 80 100
Mass Recovery Improvement Factor
Str
atig
rap
hic
Ele
vati
on
(m
)
Area #1Area #2

MTBE Through Remediation
1
10
100
1,000
10,000
100,000
Pre-remdiation April-99 July-99 Oct-99
MW-7
MW-12
MW-13
MW-14
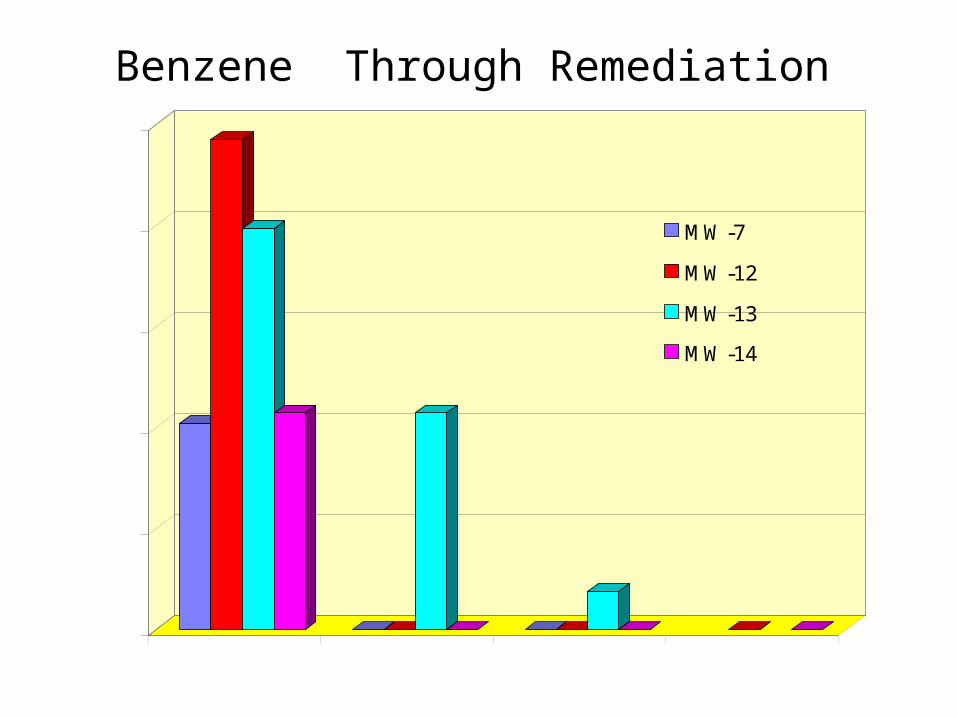
Benzene Through Remediation
1
10
100
1,000
10,000
100,000
Pre-remediation April-99 July-99 Oct-99
MW-7
MW-12
MW-13
MW-14

Recovery to Date
• Full hydraulic capture
• 400,000 lbs TPH recovered over 6 months– 18,000 as free phase; 2,000 in water phase; 15,000 in
biodecay; 365,000 in vapor phase
• Free product no longer observed in cleanup area– 80-day removal, multiphase estimate was 2-3 months
• Orders of magnitude reduction in MTBE & benzene– On average and against pre-cleanup maximums
– Mole fraction changes consistent with principles

Conclusions
• Targeting depends first on knowing smear zone– Common limitations to characterization efforts
– Like E&P, no oil, no production
• Efficient designs directly access smear zone– Geologic efficiency is order of magnitude
• Tracking of success is fairly straightforward– Chemical milestones, molar & otherwise
– Physical relationships between fluid zones
• No matter what, you cannot have it all– Some soil zones won’t produce in any phase
– Always uncertainty in geologic distributions