remediation persistence study - adams state … persistence study. by: pat bryson, office of...
TRANSCRIPT

Remediation Persistence Study By: Pat Bryson, Office of Institutional Research and Assessment; August 4, 2006
This is an attempt to track the performance of students that enrolled in remedial classes in the Fall Semesters of 1999 through 2005. There are all classifications included within these cohorts, including some graduate students. In some of the cases, the students were enrolled in remedial classes in more than one of the semesters being tracked. Thus if a student was enrolled in Math 095 in 1999 and English 099 in 2000, that student will be counted as a new student in the second cohort. Some of the students may have taken the same remedial course (and/or the classes that follow remediation) more than once. Also, some of the students took more than one remedial class in the same term. Unfortunately, tracking those students that transferred to another institution of Higher Education is beyond the scope of this study. The structure of the study is a series of graphs (followed by the underlying data) analyzing:
• The percentage of the overall Undergraduate Student Population that took Remedial courses • Retention Rates of Freshman Remedial students • Retention Rates of the entire Remedial cohorts • The Graduation Rates for the entire cohorts • The Graduation Rates of the Freshmen in the cohorts • The results achieved by Remedial courses • The results in subsequent classes
o Results aggregated by Remedial course and subsequent classes combined o Results grouped by Remedial cohort and grade earned in Remediation o Underlying data is grouped by Department and grade earned in Remediation
All of the charts have links that can be followed to the underlying data, and likewise, the data have links to the summarizing chart. Chart 1: % of Undergraduate Population Enrolled in Remedial Courses
% of Undergraduate Population Enrolled in Remedial Courses
11.0%8.9%
12.2%11.1%
11.4%14.5%
16.0%
0.0% 2.0% 4.0% 6.0% 8.0% 10.0% 12.0% 14.0% 16.0% 18.0%
% of Population
2005200420032002200120001999
1 of 59
2 of 59
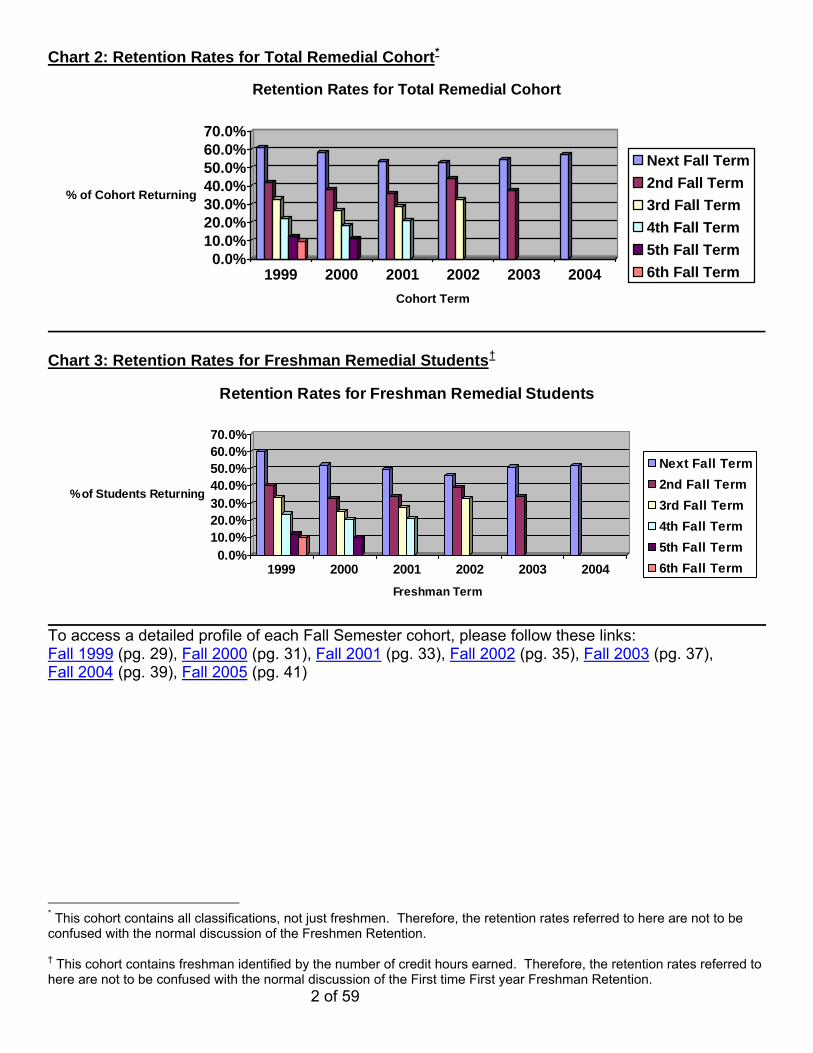
Chart 2: Retention Rates for Total Remedial Cohort*
0.0%10.0%20.0%30.0%40.0%50.0%60.0%70.0%
% of Cohort Returning
1999 2000 2001 2002 2003 2004Cohort Term
Retention Rates for Total Remedial Cohort
Next Fall Term2nd Fall Term3rd Fall Term4th Fall Term5th Fall Term6th Fall Term
† Chart 3: Retention Rates for Freshman Remedial Students
0.0%10.0%20.0%30.0%40.0%50.0%60.0%70.0%
% of Students Returning
1999 2000 2001 2002 2003 2004Freshman Term
Retention Rates for Freshman Remedial Students
Next Fall Term2nd Fall Term3rd Fall Term4th Fall Term5th Fall Term6th Fall Term
To access a detailed profile of each Fall Semester cohort, please follow these links: Fall 1999 (pg. 29), Fall 2000 (pg. 31), Fall 2001 (pg. 33), Fall 2002 (pg. 35), Fall 2003 (pg. 37), Fall 2004 (pg. 39), Fall 2005 (pg. 41)
* This cohort contains all classifications, not just freshmen. Therefore, the retention rates referred to here are not to be confused with the normal discussion of the Freshmen Retention. † This cohort contains freshman identified by the number of credit hours earned. Therefore, the retention rates referred to here are not to be confused with the normal discussion of the First time First year Freshman Retention.
3 of 59
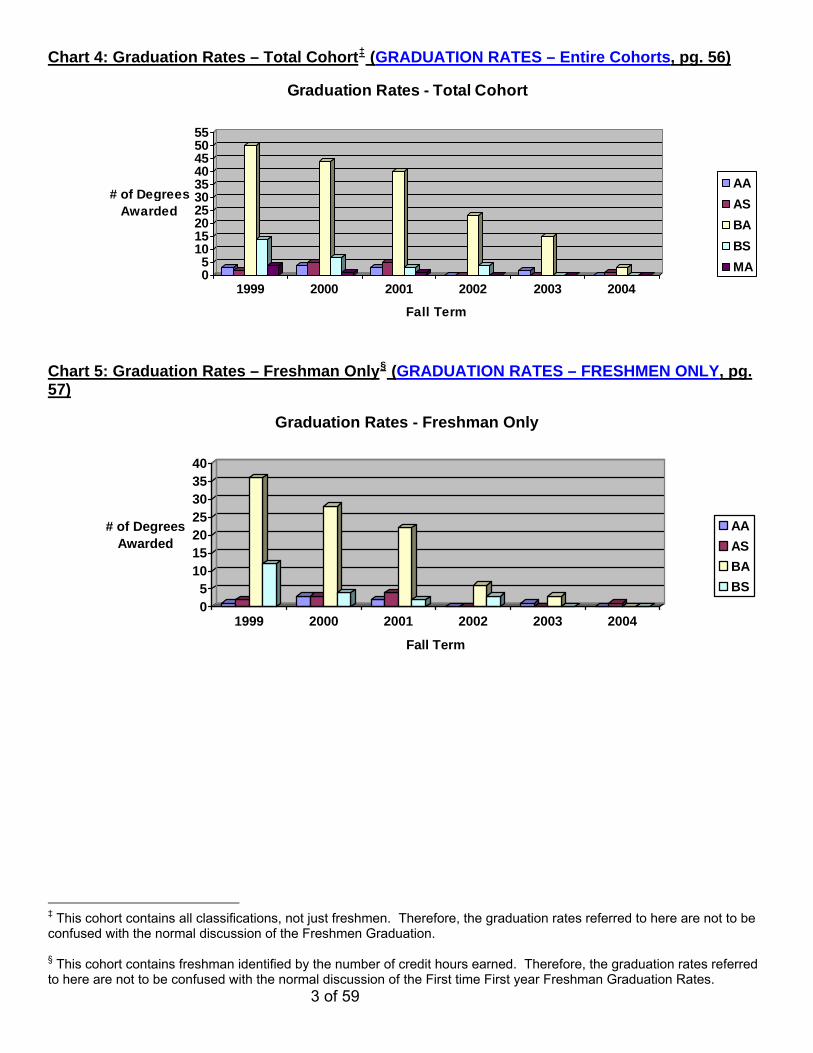
Chart 4: Graduation Rates – Total Cohort‡ (GRADUATION RATES – Entire Cohorts, pg. 56)
05
10152025303540455055
# of Degrees Awarded
1999 2000 2001 2002 2003 2004
Fall Term
Graduation Rates - Total Cohort
AAASBABSMA
Chart 5: Graduation Rates – Freshman Only§ (GRADUATION RATES – FRESHMEN ONLY, pg. 57)
05
10152025303540
# of Degrees Awarded
1999 2000 2001 2002 2003 2004
Fall Term
Graduation Rates - Freshman Only
AAASBABS
‡ This cohort contains all classifications, not just freshmen. Therefore, the graduation rates referred to here are not to be confused with the normal discussion of the Freshmen Graduation. § This cohort contains freshman identified by the number of credit hours earned. Therefore, the graduation rates referred to here are not to be confused with the normal discussion of the First time First year Freshman Graduation Rates.
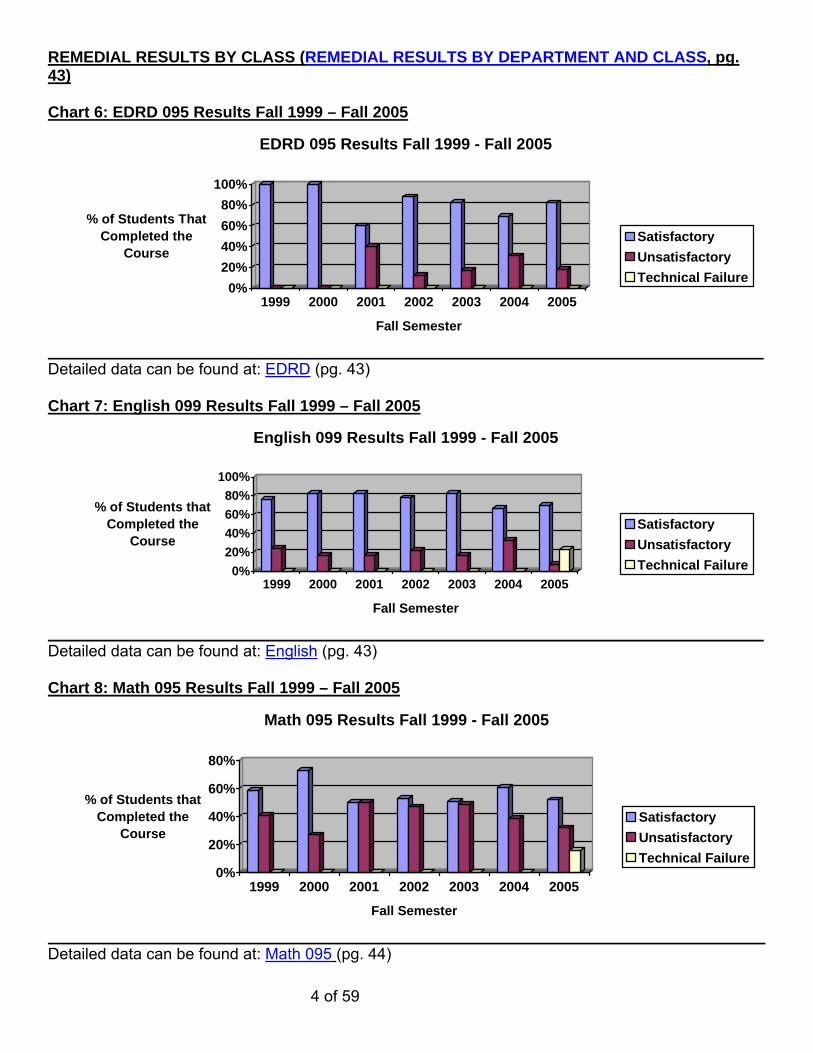
REMEDIAL RESULTS BY CLASS (REMEDIAL RESULTS BY DEPARTMENT AND CLASS, pg. 43) Chart 6: EDRD 095 Results Fall 1999 – Fall 2005
4 of 59
0%20%40%60%80%
100%
% of Students That Completed the
Course
1999 2000 2001 2002 2003 2004 2005
Fall Semester
EDRD 095 Results Fall 1999 - Fall 2005
SatisfactoryUnsatisfactoryTechnical Failure
Detailed data can be found at: EDRD (pg. 43) Chart 7: English 099 Results Fall 1999 – Fall 2005
0%20%40%60%80%
100%
% of Students that Completed the
Course
1999 2000 2001 2002 2003 2004 2005
Fall Semester
English 099 Results Fall 1999 - Fall 2005
SatisfactoryUnsatisfactoryTechnical Failure
Detailed data can be found at: English (pg. 43) Chart 8: Math 095 Results Fall 1999 – Fall 2005
0%
20%
40%
60%
80%
% of Students that Completed the
Course
1999 2000 2001 2002 2003 2004 2005
Fall Semester
Math 095 Results Fall 1999 - Fall 2005
SatisfactoryUnsatisfactoryTechnical Failure
Detailed data can be found at: Math 095 (pg. 44)

Chart 9: Math 097 Results Fall 2004 – Fall 2005
5 of 59
0%10%20%30%40%50%60%
% of Students that Completed the
Course
2004 2005
Fall Semester
Math 097 Results Fall 2004 - Fall 2005
SatisfactoryUnsatisfactoryTechnical Failure
This course was Math 099 prior to Fall 2004. Detailed data can be found at: Math 097 (pg. 44) Chart 10: Math 099 Results Fall 1999 – Fall 2005
0%10%20%30%40%50%60%70%
% of Students that Completed the
Course
1999 2000 2001 2002 2003 2004 2005Fall Semester
Math 099 Results Fall 1999 - Fall 2005
SatisfactoryUnsatisfactoryTechnical Failure
This course was Math 101 prior to Fall 2004. Detailed data can be found at: Math 099 (pg. 44) Chart 11: Remedial Math Results – All Classes All Terms
0%10%20%30%40%50%60%
% of Students that Completed the
Courses
Satisfactory Unsatisfactory TechnicalFailure
Grade
Remedial Math Results - All Classes All Terms
Detailed data can be found at: All Classes All Terms (pg. 45)

REMEDIAL RESULTS – SUBSEQUENT CLASSES (SUBSEQUENT CLASSES, pg. 45)** As there are no subsequent classes for EDRD 095, a comparison of the students’ GPA before and after taking the course is the best way to gauge a student’s progress. Chart 12: EDRD Average GPA Comparison
6 of 59
0.000.501.001.502.002.50
Average GPA
1999 2000 2001 2002 2003 2004
Fall Semester Enrolled
EDRD Average GPA Comparison
Enrolled GPAGPA Following Fall
Detailed data can be found at: EDRD 095 (pg. 45) The following charts show the results of all students that took any of the classes that follow the remedial course that they were registered for and the grades that they earned. As mentioned above, some of the students may have attempted the following courses more than once. Chart 13: English 099 to English 101 & 102 Combined
0
5
10
15
20
25
30
35
40
# of Grades Assigned
1999 2000 2001 2002 2003 2004 2005Term
English 099 to English 101 & 102 Combined
ABCDFTFINWNo Grade
Detailed data can be found at: English 099 (pg. 45)
** If less than 3 students enrolled in subsequent classes after completing remedial courses, the results can be found in the detailed data that follows the graphs.
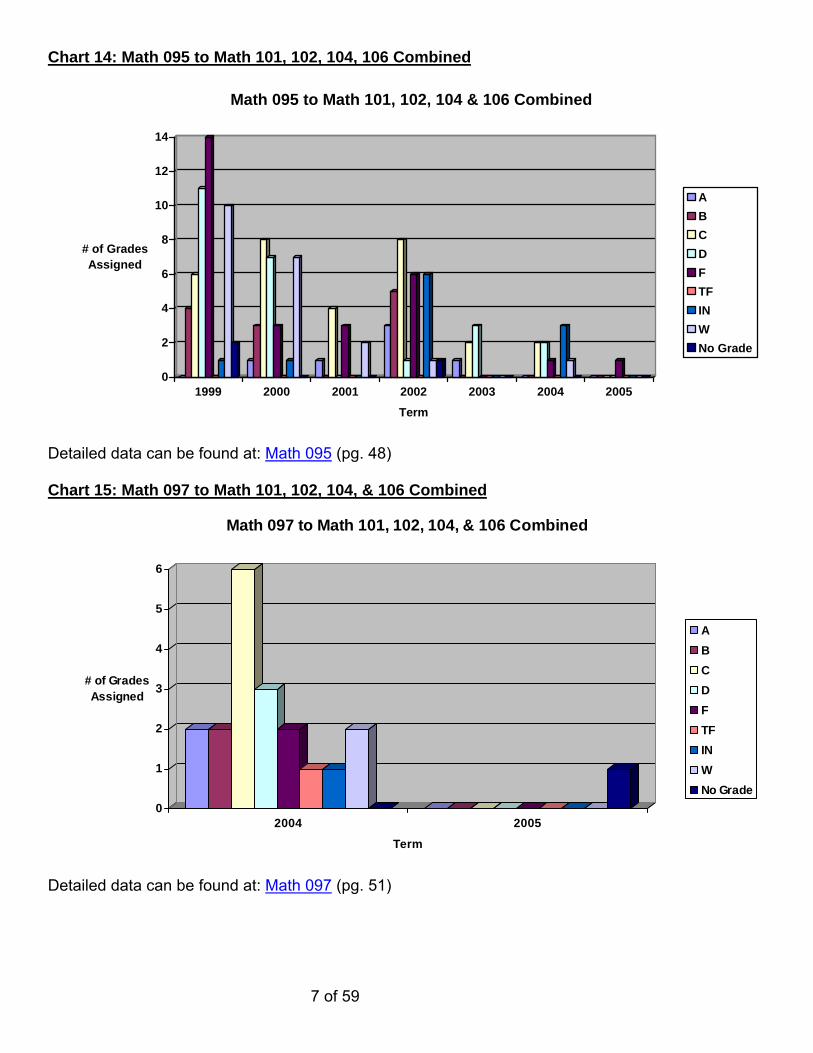
Chart 14: Math 095 to Math 101, 102, 104, 106 Combined
7 of 59
0
2
4
6
8
10
12
14
# of Grades Assigned
1999 2000 2001 2002 2003 2004 2005Term
Math 095 to Math 101, 102, 104 & 106 Combined
ABCDFTFINWNo Grade
Detailed data can be found at: Math 095 (pg. 48) Chart 15: Math 097 to Math 101, 102, 104, & 106 Combined
0
1
2
3
4
5
6
# of Grades Assigned
2004 2005
Term
Math 097 to Math 101, 102, 104, & 106 Combined
ABCDFTFINWNo Grade
Detailed data can be found at: Math 097 (pg. 51)
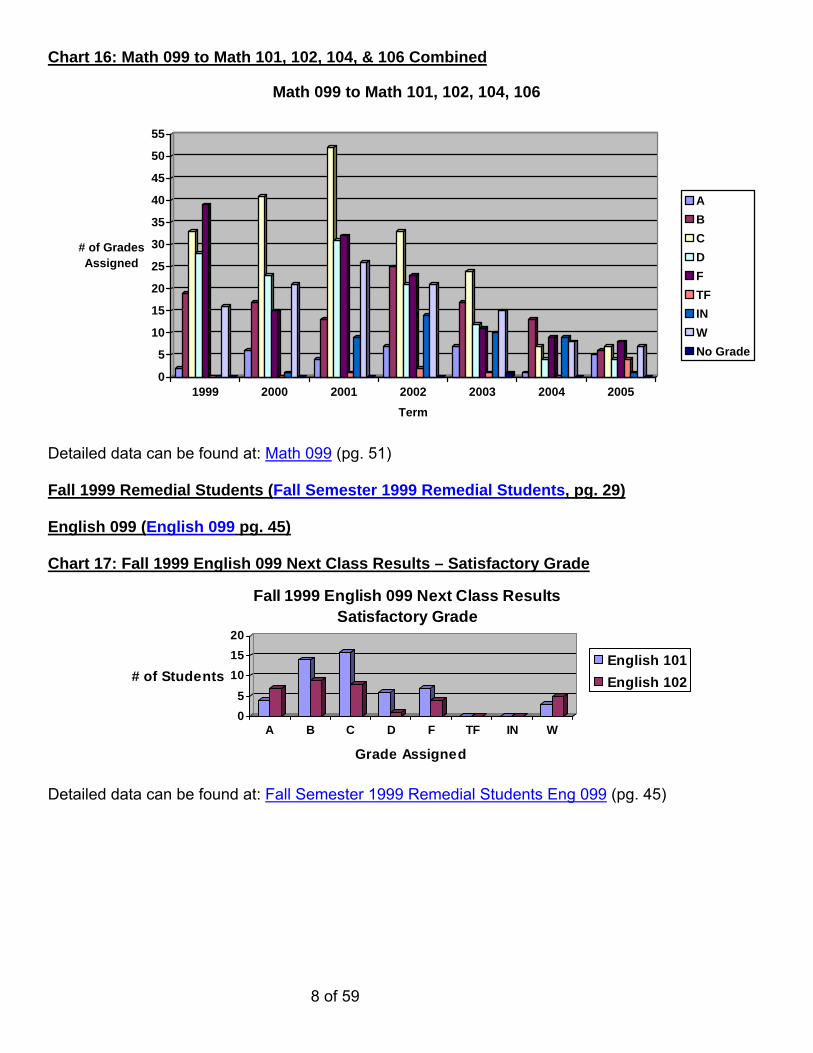
Chart 16: Math 099 to Math 101, 102, 104, & 106 Combined
8 of 59
0
5
10
15
20
25
30
35
40
45
50
55
# of Grades Assigned
1999 2000 2001 2002 2003 2004 2005Term
Math 099 to Math 101, 102, 104, 106
ABCDFTFINWNo Grade
Detailed data can be found at: Math 099 (pg. 51) Fall 1999 Remedial Students (Fall Semester 1999 Remedial Students, pg. 29) English 099 (English 099 pg. 45) Chart 17: Fall 1999 English 099 Next Class Results – Satisfactory Grade
05
101520
# of Students
A B C D F TF IN W
Grade Assigned
Fall 1999 English 099 Next Class ResultsSatisfactory Grade
English 101English 102
Detailed data can be found at: Fall Semester 1999 Remedial Students Eng 099 (pg. 45)
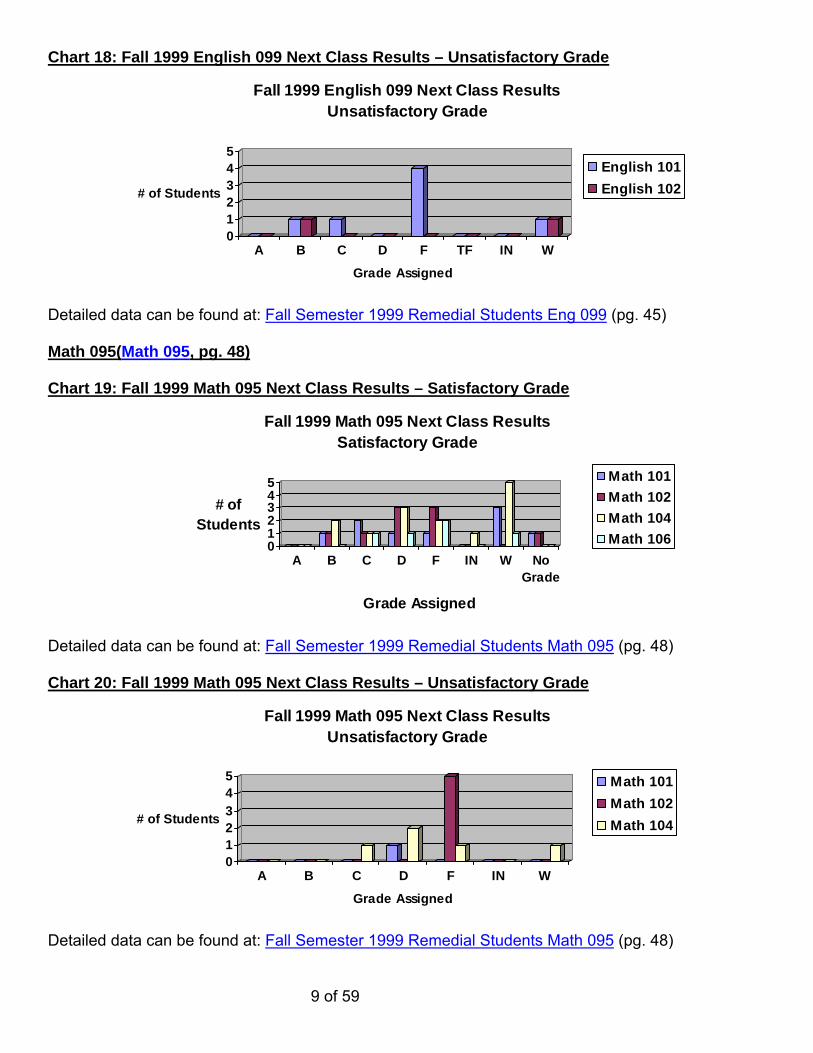
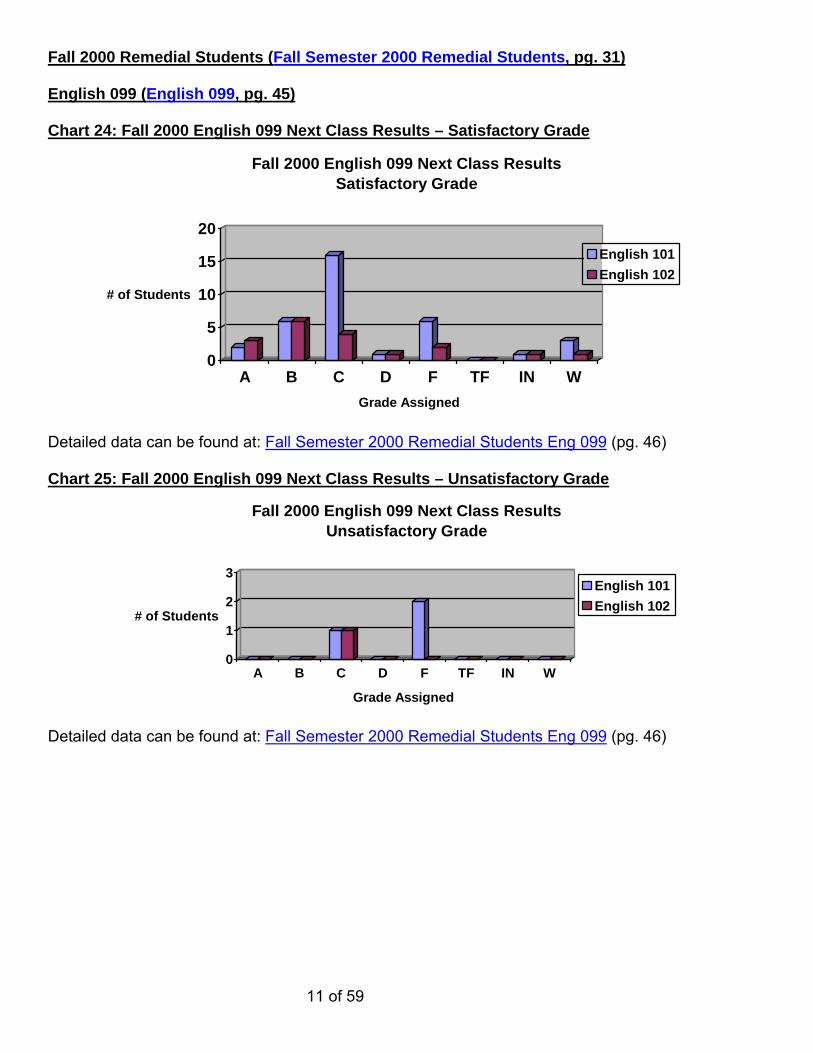
Chart 18: Fall 1999 English 099 Next Class Results – Unsatisfactory Grade
9 of 59
012345
# of Students
A B C D F TF IN W
Grade Assigned
Fall 1999 English 099 Next Class Results Unsatisfactory Grade
English 101English 102
Detailed data can be found at: Fall Semester 1999 Remedial Students Eng 099 (pg. 45) Math 095(Math 095, pg. 48) Chart 19: Fall 1999 Math 095 Next Class Results – Satisfactory Grade
012345
# of Students
A B C D F IN W NoGrade
Grade Assigned
Fall 1999 Math 095 Next Class Results Satisfactory Grade
Math 101Math 102Math 104Math 106
Detailed data can be found at: Fall Semester 1999 Remedial Students Math 095 (pg. 48) Chart 20: Fall 1999 Math 095 Next Class Results – Unsatisfactory Grade
012345
# of Students
A B C D F IN W
Grade Assigned
Fall 1999 Math 095 Next Class Results Unsatisfactory Grade
Math 101Math 102Math 104
Detailed data can be found at: Fall Semester 1999 Remedial Students Math 095 (pg. 48)

Math 099(Math 099 pg. 52) Chart 21: Fall 1999 Math 099 Next Class Results – Satisfactory Grade
10 of 59
02468
1012
# of Students
A B C D F IN W
Grade Assigned
Fall 1999 Math 099 Next Class Results Satisfactory Grade Math 101
Math 102Math 104Math 106
Detailed data can be found at: Fall Semester 1999 Remedial Students Math 099 (pg. 52) Chart 22: Fall 1999 Math 099 Next Class Results – Unsatisfactory Grade
02468
# of Students
A B C D F IN W
Grade Assigned
Fall 1999 Math 099 Next Class Results Unsatisfactory Grade
Math 101Math 102Math 104
Detailed data can be found at: Fall Semester 1999 Remedial Students Math 099 (pg. 52) Chart 23: Fall 1999 Math 099 Next Class Results – Withdrawal Grade
01234
# of Students
A B C D F IN W
Grade Assigned
Fall 1999 Math 099 Next Class Results Withdrawal Grade
Math 101Math 102Math 104
Detailed data can be found at: Fall Semester 1999 Remedial Students Math 099 (pg. 52)
Fall 2000 Remedial Students (Fall Semester 2000 Remedial Students, pg. 31) English 099 (English 099, pg. 45) Chart 24: Fall 2000 English 099 Next Class Results – Satisfactory Grade
11 of 59
0
5
10
15
20
# of Students
A B C D F TF IN WGrade Assigned
Fall 2000 English 099 Next Class Results Satisfactory Grade
English 101English 102
Detailed data can be found at: Fall Semester 2000 Remedial Students Eng 099 (pg. 46) Chart 25: Fall 2000 English 099 Next Class Results – Unsatisfactory Grade
0
1
2
3
# of Students
A B C D F TF IN W
Grade Assigned
Fall 2000 English 099 Next Class Results Unsatisfactory Grade
English 101English 102
Detailed data can be found at: Fall Semester 2000 Remedial Students Eng 099 (pg. 46)

Math 095(Math 095, pg. 48) Chart 26: Fall 2000 Math 095 Next Class Results – Satisfactory Grade
12 of 59
012345
# of Students
A B C D F IN W
Grade Assigned
Fall 2000 Math 095 Next Class Results Satisfactory Grade
Math 101Math 102Math 104Math 106
Detailed data can be found at: Fall Semester 2000 Remedial Students Math 095 (pg. 49) Math 099(Math 099, pg. 51) Chart 27: Fall 2000 Math 099 Next Class Results – Satisfactory Grade
02468
101214
# of Students
A B C D F IN WGrade Assigned
Fall 2000 Math 099 Next Class Results Satisfactory Grade
Math 101Math 102Math 104Math 106
Detailed data can be found at: Fall Semester 2000 Remedial Students Math 099 (pg. 52)

Chart 28: Fall 2000 Math 099 Next Class Results – Unsatisfactory Grade
13 of 59
012345
# of Students
A B C D F IN W
Grade Assigned
Fall 2000 Math 099 Next Class Results Unsatisfactory Grade
Math 101Math 102Math 104Math 106
Detailed data can be found at: Fall Semester 2000 Remedial Students Math 099 (pg. 52) Chart 29: Fall 2000 Math 099 Next Class Results – Withdrawal Grade
01234
# of Students
A B C D F IN W
Grade Assigned
Fall 2000 Math 099 Next Class Results Withdrawal Grade
Math 101Math 102Math 104Math 106
Detailed data can be found at: Fall Semester 2000 Remedial Students Math 099 (pg. 52)

Fall 2001 Remedial Students (Fall Semester 2001 Remedial Students, pg. 33) English 099 (English 099, pg. 45) Chart 30: Fall 2001 English 099 Next Class Results – Satisfactory Grade
14 of 59
05
10152025
# of Students
A B C D F TF IN WGrade Assigned
Fall 2001 English 099 Next Class Results Satisfactory Grade
English 101English 102
Detailed data can be found at: Fall Semester 2001 Remedial Students Eng 099 (pg. 46) Chart 31: Fall 2001 English 099 Next Class Results – Unsatisfactory Grade
0
1
2
3
4
# of Students
A B C D F IN WGrade Assigned
Fall 2001 English 099 Next Class Results Unsatisfactory Grade
English 101English 102
Detailed data can be found at: Fall Semester 2001 Remedial Students Eng 099 (pg. 46) Math 095(Math 095, pg. 48)
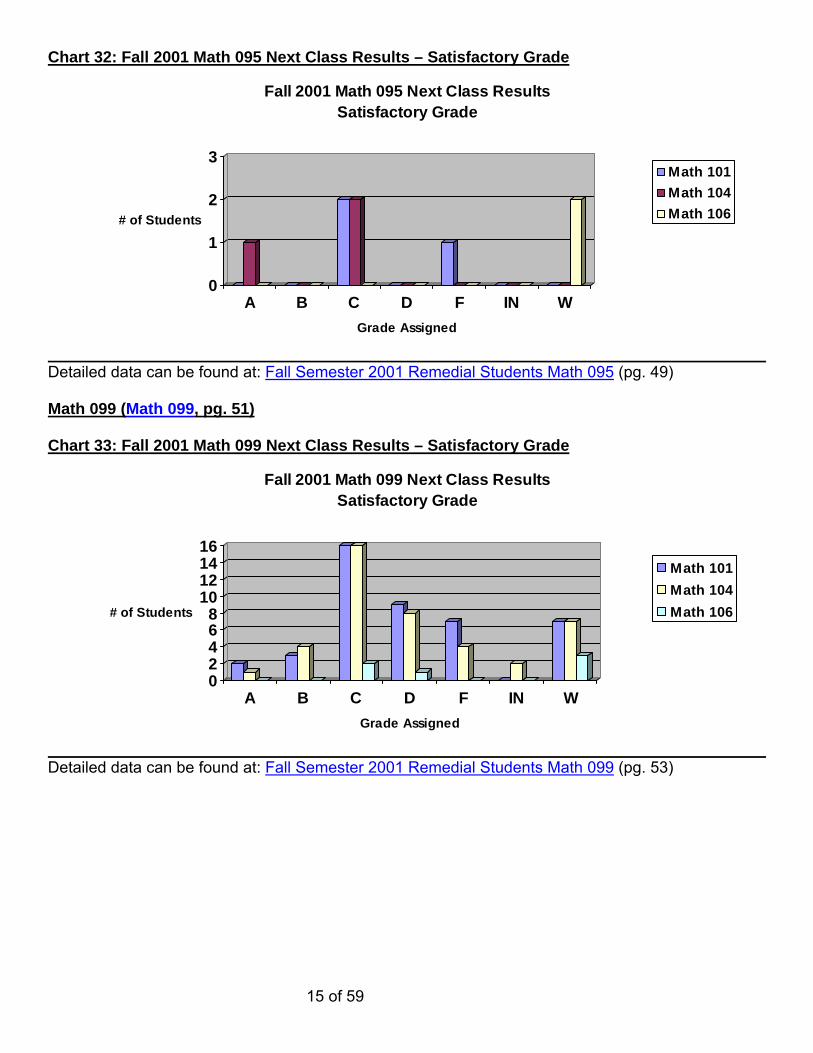
Chart 32: Fall 2001 Math 095 Next Class Results – Satisfactory Grade
15 of 59
0
1
2
3
# of Students
A B C D F IN WGrade Assigned
Fall 2001 Math 095 Next Class Results Satisfactory Grade
Math 101Math 104Math 106
Detailed data can be found at: Fall Semester 2001 Remedial Students Math 095 (pg. 49) Math 099 (Math 099, pg. 51) Chart 33: Fall 2001 Math 099 Next Class Results – Satisfactory Grade
02468
10121416
# of Students
A B C D F IN WGrade Assigned
Fall 2001 Math 099 Next Class Results Satisfactory Grade
Math 101Math 104Math 106
Detailed data can be found at: Fall Semester 2001 Remedial Students Math 099 (pg. 53)

Chart 34: Fall 2001 Math 099 Next Class Results – Unsatisfactory Grade
16 of 59
02468
10
# of Students
A B C D F TF IN WGrade Assigned
Fall 2001 Math 099 Next Class Results Unsatisfactory Grade
Math 101Math 104Math 106
Detailed data can be found at: Fall Semester 2001 Remedial Students Math 099 (pg. 53) Chart 35: Fall 2001 Math 099 Next Class Results – Withdrawal Grade
0
1
2
3
# of Students
A B C D F tf IN WGrade Assigned
Fall 2001 Math 099 Next Class Results Withdrawal Grade
Math 101Math 104Math 106
Detailed data can be found at: Fall Semester 2001 Remedial Students Math 099 (pg. 53)
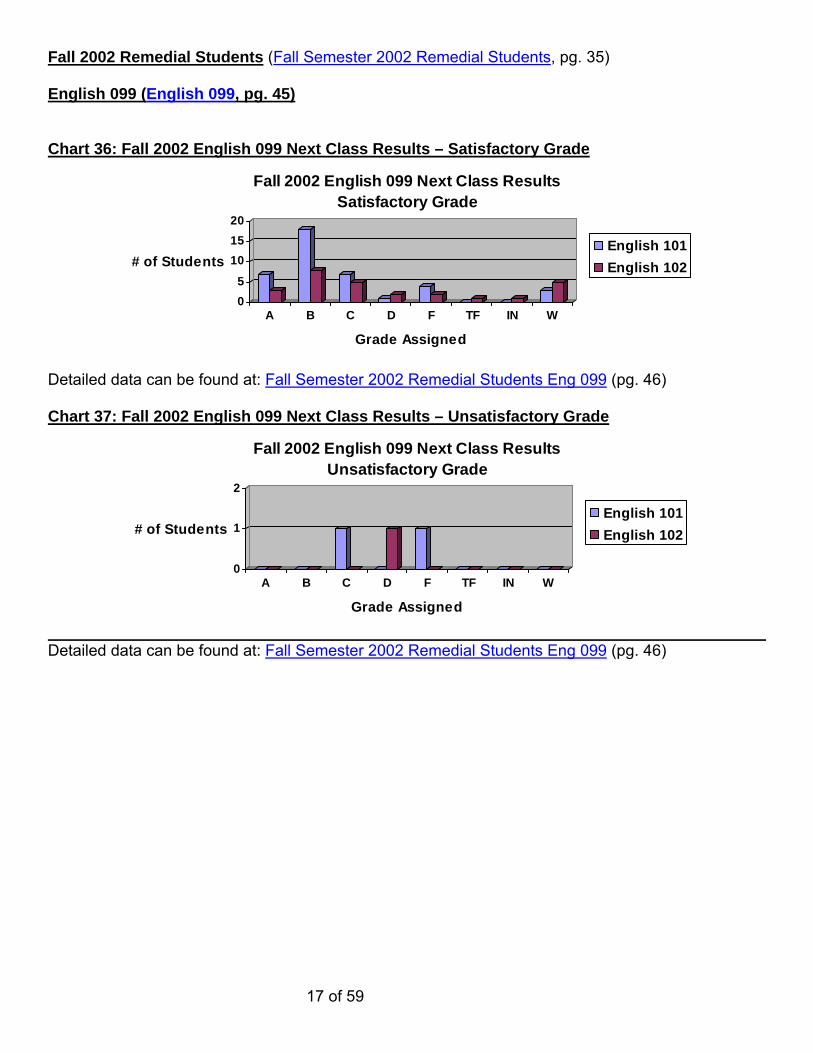
Fall 2002 Remedial Students (Fall Semester 2002 Remedial Students, pg. 35) English 099 (English 099, pg. 45) Chart 36: Fall 2002 English 099 Next Class Results – Satisfactory Grade
17 of 59
05
101520
# of Students
A B C D F TF IN W
Grade Assigned
Fall 2002 English 099 Next Class ResultsSatisfactory Grade
English 101English 102
Detailed data can be found at: Fall Semester 2002 Remedial Students Eng 099 (pg. 46) Chart 37: Fall 2002 English 099 Next Class Results – Unsatisfactory Grade
0
1
2
# of Students
A B C D F TF IN W
Grade Assigned
Fall 2002 English 099 Next Class ResultsUnsatisfactory Grade
English 101English 102
Detailed data can be found at: Fall Semester 2002 Remedial Students Eng 099 (pg. 46)
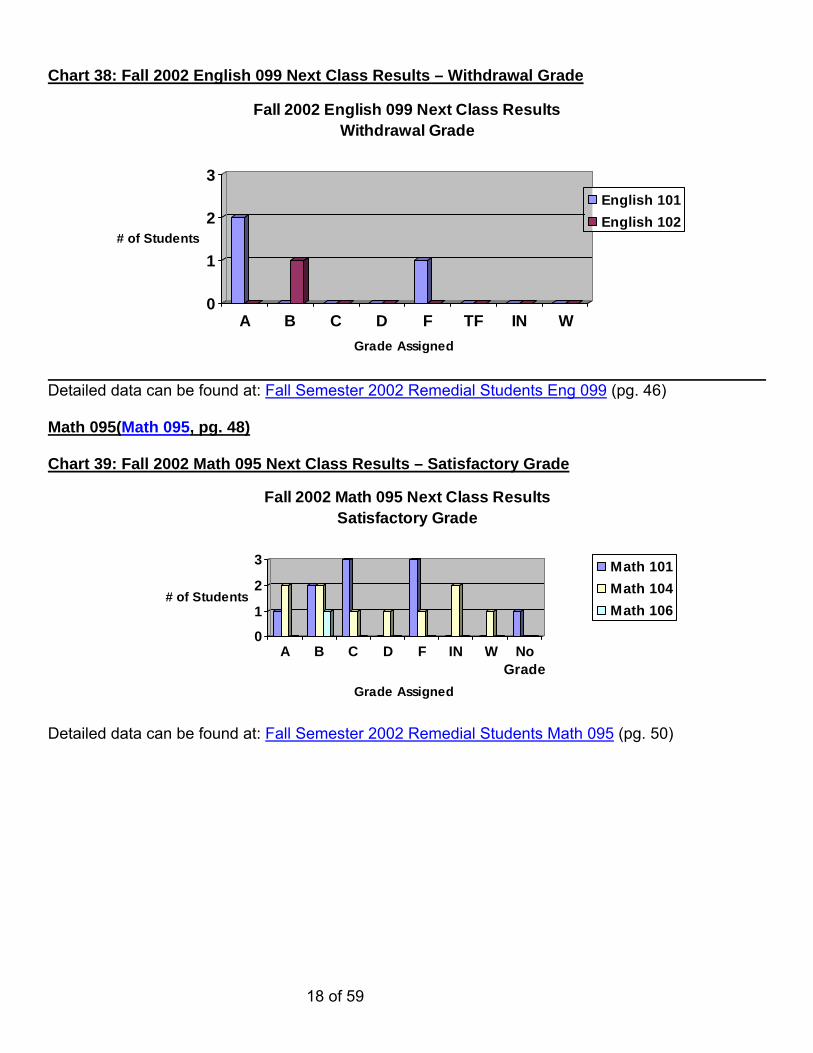
Chart 38: Fall 2002 English 099 Next Class Results – Withdrawal Grade
18 of 59
0
1
2
3
# of Students
A B C D F TF IN WGrade Assigned
Fall 2002 English 099 Next Class Results Withdrawal Grade
English 101English 102
Detailed data can be found at: Fall Semester 2002 Remedial Students Eng 099 (pg. 46) Math 095(Math 095, pg. 48) Chart 39: Fall 2002 Math 095 Next Class Results – Satisfactory Grade
0
1
2
3
# of Students
A B C D F IN W NoGrade
Grade Assigned
Fall 2002 Math 095 Next Class Results Satisfactory Grade
Math 101Math 104Math 106
Detailed data can be found at: Fall Semester 2002 Remedial Students Math 095 (pg. 50)

Chart 40: Fall 2002 Math 095 Next Class Results – Unsatisfactory Grade
19 of 59
012345
# of Students
A B C D F IN W
Grade Assigned
Fall 2002 Math 095 Next Class Results Unsatisfactory Grade
Math 101Math 104
Detailed data can be found at: Fall Semester 2002 Remedial Students Math 095 (pg. 50) Math 099 (Math 099, pg. 51) Chart 41: Fall 2002 Math 099 Next Class Results – Satisfactory Grade
02468
10121416
# of Students
A B C D F TF IN WGrade Assigned
Fall 2002 Math 099 Next Class Results Satisfactory Grade
Math 101Math 104Math 106
Detailed data can be found at: Fall Semester 2002 Remedial Students Math 099 (pg. 54)

Chart 42: Fall 2002 Math 099 Next Class Results – Unsatisfactory Grade
20 of 59
012345
# of Students
A B C D F IN WGrade Assigned
Fall 2002 Math 099 Next Class Results Unsatisfactory Grade
Math 101Math 104Math 106
Detailed data can be found at: Fall Semester 2002 Remedial Students Math 099 (pg. 54) Chart 43: Fall 2002 Math 099 Next Class Results – Withdrawal Grade
0123456
# of Students
A B C D F IN WGrade Assigned
Fall 2002 Math 099 Next Class Results Withdrawal Grade
Math 101Math 104Math 106
Detailed data can be found at: Fall Semester 2002 Remedial Students Math 099 (pg. 54) Fall 2003 Remedial Students (Fall Semester 2003 Remedial Students, pg. 37) English 099 (English 099, pg. 45)

Chart 44: Fall 2003 English 099 Next Class Results – Satisfactory Grade
21 of 59
05
101520
# of Students
A B C D F TF IN W
Grade Assigned
Fall 2003 English 099 Next Class ResultsSatisfactory Grade
English 101English 102
Detailed data can be found at: Fall Semester 2003 Remedial Students Eng 099 (pg. 47) Chart 45: Fall 2003 English 099 Next Class Results – Unsatisfactory Grade
01234
# of Students
A B C D F TF IN W
Grade Assigned
Fall 2003 English 099 Next Class ResultsUnsatisfactory Grade
English 101
Detailed data can be found at: Fall Semester 2003 Remedial Students Eng 099 (pg. 47) Chart 46: Fall 2003 English 099 Next Class Results – Withdrawal Grade
0
1
2
3
# of Students
A B C D F TF IN W
Grade Assigned
Fall 2003 English 099 Next Class ResultsWithdrawal Grade
English 101English 102
Detailed data can be found at: Fall Semester 2003 Remedial Students Eng 099 (pg. 47) Math 095(Math 095, pg. 48)
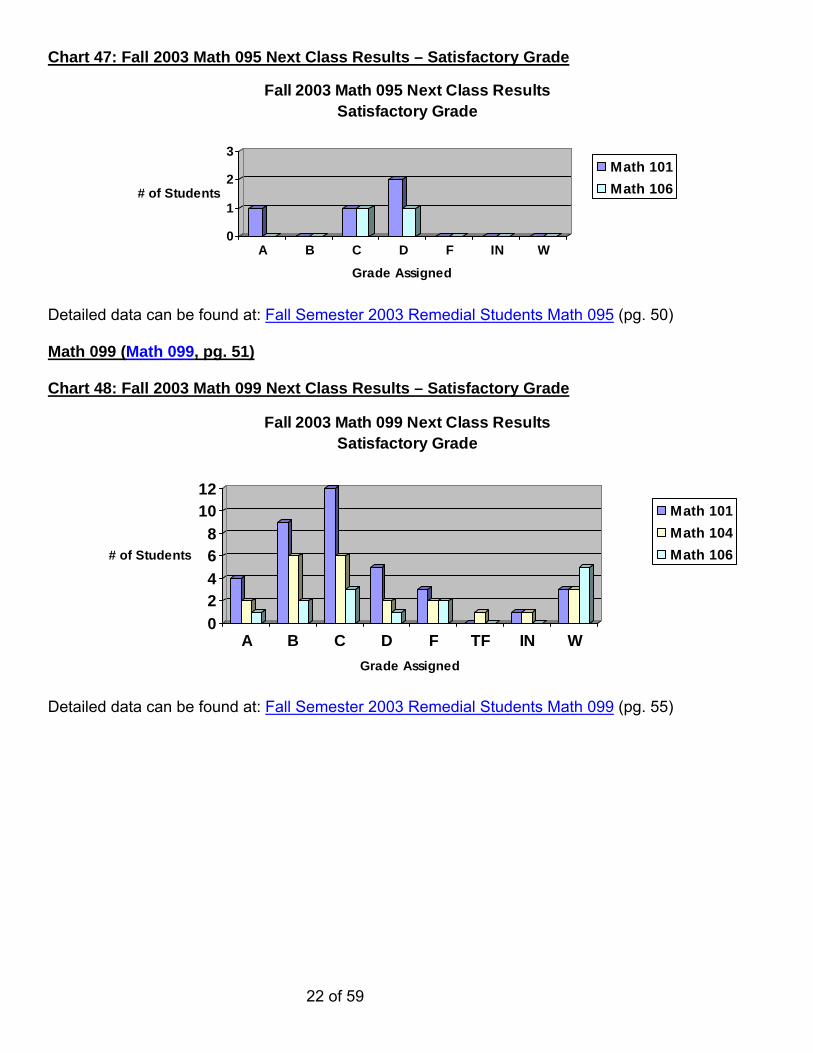
Chart 47: Fall 2003 Math 095 Next Class Results – Satisfactory Grade
22 of 59
0
1
2
3
# of Students
A B C D F IN W
Grade Assigned
Fall 2003 Math 095 Next Class Results Satisfactory Grade
Math 101Math 106
Detailed data can be found at: Fall Semester 2003 Remedial Students Math 095 (pg. 50) Math 099 (Math 099, pg. 51) Chart 48: Fall 2003 Math 099 Next Class Results – Satisfactory Grade
02468
1012
# of Students
A B C D F TF IN WGrade Assigned
Fall 2003 Math 099 Next Class Results Satisfactory Grade
Math 101Math 104Math 106
Detailed data can be found at: Fall Semester 2003 Remedial Students Math 099 (pg. 55)
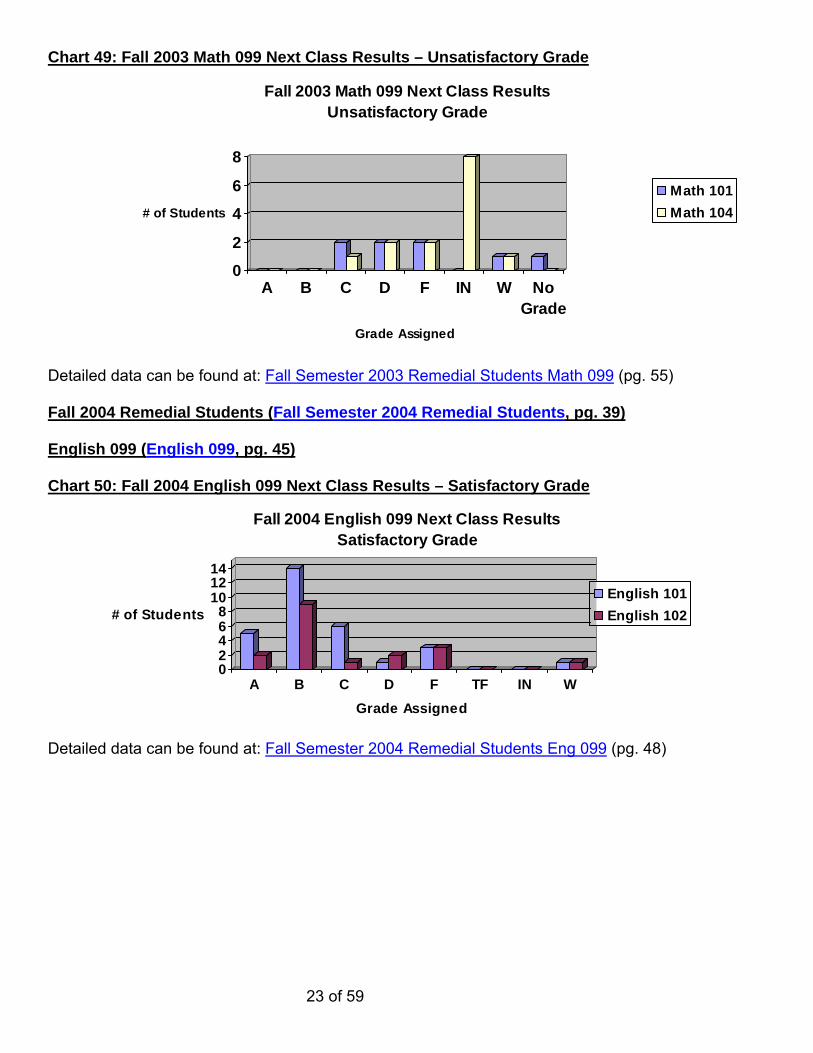
Chart 49: Fall 2003 Math 099 Next Class Results – Unsatisfactory Grade
23 of 59
0
2
4
6
8
# of Students
A B C D F IN W NoGrade
Grade Assigned
Fall 2003 Math 099 Next Class Results Unsatisfactory Grade
Math 101Math 104
Detailed data can be found at: Fall Semester 2003 Remedial Students Math 099 (pg. 55) Fall 2004 Remedial Students (Fall Semester 2004 Remedial Students, pg. 39) English 099 (English 099, pg. 45) Chart 50: Fall 2004 English 099 Next Class Results – Satisfactory Grade
02468
101214
# of Students
A B C D F TF IN WGrade Assigned
Fall 2004 English 099 Next Class ResultsSatisfactory Grade
English 101English 102
Detailed data can be found at: Fall Semester 2004 Remedial Students Eng 099 (pg. 48)
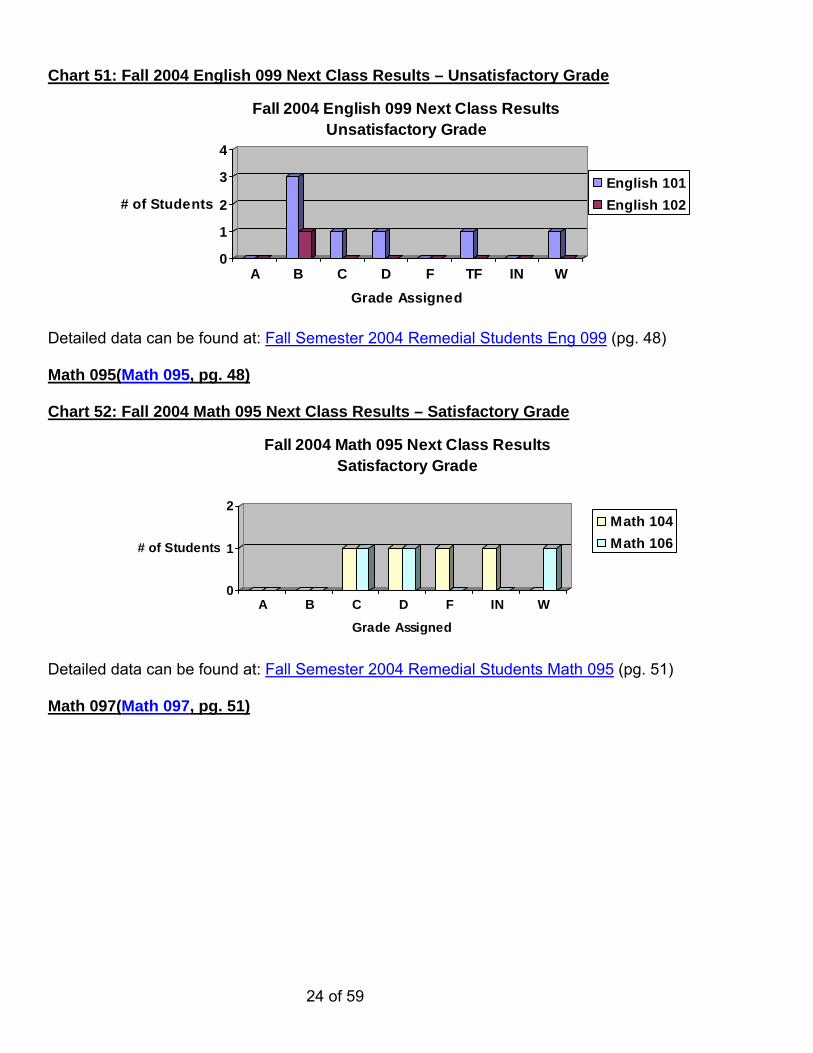
Chart 51: Fall 2004 English 099 Next Class Results – Unsatisfactory Grade
24 of 59
0
1
2
3
4
# of Students
A B C D F TF IN WGrade Assigned
Fall 2004 English 099 Next Class ResultsUnsatisfactory Grade
English 101English 102
Detailed data can be found at: Fall Semester 2004 Remedial Students Eng 099 (pg. 48) Math 095(Math 095, pg. 48) Chart 52: Fall 2004 Math 095 Next Class Results – Satisfactory Grade
0
1
2
# of Students
A B C D F IN W
Grade Assigned
Fall 2004 Math 095 Next Class Results Satisfactory Grade
Math 104Math 106
Detailed data can be found at: Fall Semester 2004 Remedial Students Math 095 (pg. 51) Math 097(Math 097, pg. 51)
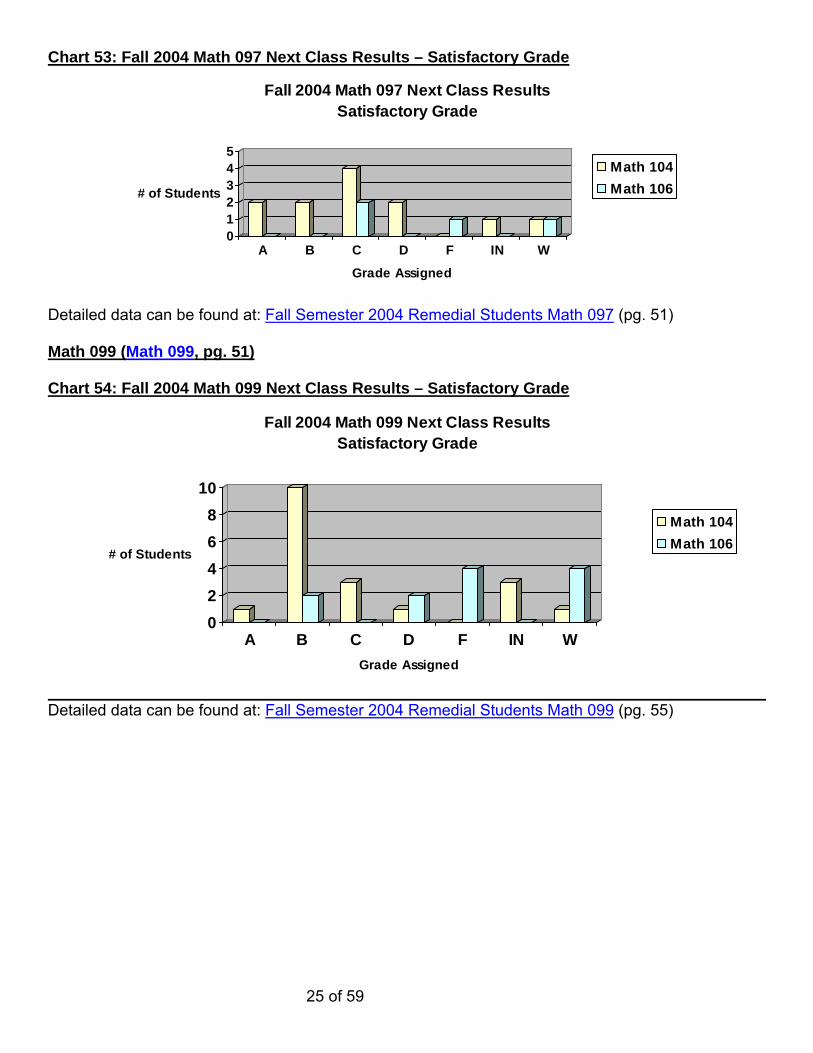
Chart 53: Fall 2004 Math 097 Next Class Results – Satisfactory Grade
25 of 59
012345
# of Students
A B C D F IN W
Grade Assigned
Fall 2004 Math 097 Next Class Results Satisfactory Grade
Math 104Math 106
Detailed data can be found at: Fall Semester 2004 Remedial Students Math 097 (pg. 51) Math 099 (Math 099, pg. 51) Chart 54: Fall 2004 Math 099 Next Class Results – Satisfactory Grade
02468
10
# of Students
A B C D F IN WGrade Assigned
Fall 2004 Math 099 Next Class Results Satisfactory Grade
Math 104Math 106
Detailed data can be found at: Fall Semester 2004 Remedial Students Math 099 (pg. 55)

Chart 55: Fall 2004 Math 099 Next Class Results – Unsatisfactory Grade
26 of 59
0
1
2
3
4
# of Students
A B C D F IN WGrade Assigned
Fall 2004 Math 099 Next Class Results Unsatisfactory Grade
Math 104Math 106
Detailed data can be found at: Fall Semester 2004 Remedial Students Math 099 (pg. 55) Chart 56: Fall 2004 Math 099 Next Class Results – Withdrawal Grade
0
1
2
3
# of Students
A B C D F IN WGrade Assigned
Fall 2004 Math 099 Next Class Results Wtihdrawal Grade
Math 104
Detailed data can be found at: Fall Semester 2004 Remedial Students Math 099 (pg. 55)

Fall 2005 Remedial Students (Fall Semester 2005 Remedial Students, pg. 41) English 099 (English 099, pg. 45) Chart 57: Fall 2005 English 099 Next Class Results – Satisfactory Grade
27 of 59
02468
10121416182022
# of Students
A B C D F TF IN W NoGrade
Grade Assigned
Fall 2005 English 099 Next Class ResultsSatisfactory Grade
English 101English 102
Detailed data can be found at: Fall Semester 2005 Remedial Students Eng 099 (pg. 48) Chart 58: Fall 2005 English 099 Next Class Results – Technical Failure Grade
0
1
2
# of Students
A B C D F TF IN W
Grade Assigned
Fall 2005 English 099 Next Class ResultsTechnical Failure Grade
English 101
Detailed data can be found at: Fall Semester 2005 Remedial Students Eng 099 (pg. 48) Math 099 (Math 099, pg.51)
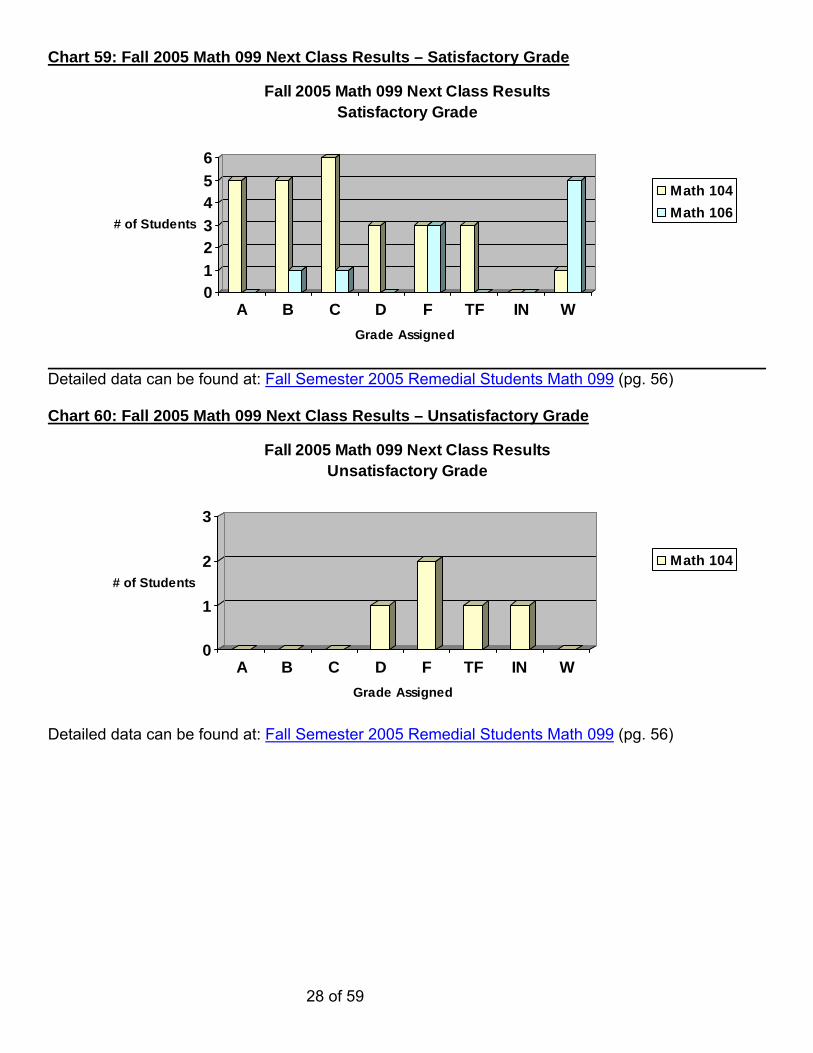
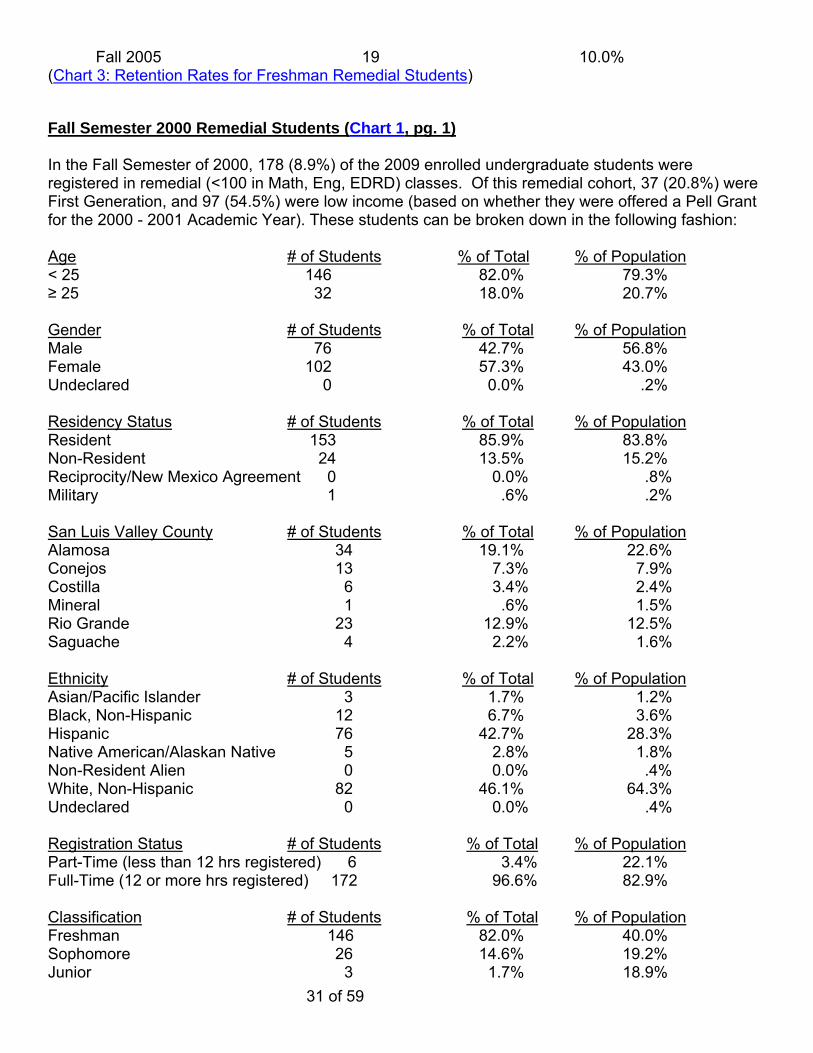
Chart 59: Fall 2005 Math 099 Next Class Results – Satisfactory Grade
28 of 59
0123456
# of Students
A B C D F TF IN WGrade Assigned
Fall 2005 Math 099 Next Class Results Satisfactory Grade
Math 104Math 106
Detailed data can be found at: Fall Semester 2005 Remedial Students Math 099 (pg. 56) Chart 60: Fall 2005 Math 099 Next Class Results – Unsatisfactory Grade
0
1
2
3
# of Students
A B C D F TF IN WGrade Assigned
Fall 2005 Math 099 Next Class Results Unsatisfactory Grade
Math 104
Detailed data can be found at: Fall Semester 2005 Remedial Students Math 099 (pg. 56)

29 of 59
REMEDIAL STUDENT PROFILE Fall Semester 1999 Remedial Students (Chart 1, pg. 1) In the Fall Semester of 1999, 222 (11%) of the 2024 enrolled undergraduate students were registered in remedial (<100 in Math, Eng, EDRD) classes. Of this remedial cohort, 41 (18.5%) were First Generation, and 109 (49%) were low income (based on whether they were offered a Pell Grant for the 1999 – 2000 Academic Year). These students can be broken down in the following fashion: Age # of Students % of Total % of Population < 25 186 83.8% 81.0% ≥ 25 36 16.2% 19.0% Gender # of Students % of Total % of Population Male 94 42.4% 44.1% Female 128 57.6% 55.9% Residency Status # of Students % of Total % of Population Resident 192 86.4% 82.7% Non-Resident 27 12.2% 16.3% Reciprocity/New Mexico Agreement 3 1.4% .8% Military 0 0.0% .2% San Luis Valley County # of Students % of Total % of Population Alamosa 47 21.2% 22.2% Conejos 16 7.2% 5.8% Costilla 6 2.7% 2.2% Mineral 1 .4% .5% Rio Grande 34 15.3% 11.9% Saguache 5 2.2% 1.6% Ethnicity # of Students % of Total % of Population Asian/Pacific Islander 5 2.3% 1.4% Black, Non-Hispanic 9 4.1% 3.8% Ethnicity # of Students % of Total % of Population Hispanic 82 36.9% 25.5% Native American/Alaskan Native 7 3.2% 1.9% Non-Resident Alien 1 .4% .3% White, Non-Hispanic 118 53.1% 67.1% Registration Status # of Students % of Total % of Population Part-Time (less than 12 hrs registered) 8 3.6% 12.7% Full-Time (12 or more hrs registered) 214 96.4% 87.3 Classification # of Students % of Total % of Population Freshman 190 85.6% 38.9% Sophomore 22 9.9% 21.5% Junior 6 2.7% 14.7% Senior 2 .9% 22.8% Undergraduate/Non-degree 2 .9% 2.1%

30 of 59
Student Type # of Students % of Total % of Population First-Time Freshmen 153 68.9% 27.0% First-Time 1 .5% 1.4% Continuing 52 23.4% 60.8% Internal Transfer 0 0.0% .3% Readmit 7 3.2% 4.5% Transfer 9 4.0% 6.1% Subject # of Students Grade % of Class Participants†† EDRD 095 44 S 100% EDRD 095 5 W Eng 099 52 S 76% Eng 099 16 U 24% Eng 099 1 W Math 095 26 S 59% Math 095 18 U 41% Math 095 2 W Math 099 54 S 51% Math 099 52 U 49% Math 099 11 W Charts can be found at: Chart 6: EDRD 095 Results (pg. 4), Chart 7: English 099 Results, Chart 8: Math 095 Results, Chart 10: Math 099 Results 1999 Cohort Retention Rates Of the original 222 students in the Fall Semester 1999 cohort, the retention‡‡ rates were as follows: Term # of Students % of Remedial Cohort Fall 2000 136 61.2% Fall 2001 93 41.9% Fall 2002 73 32.9% Fall 2003 49 22.1% Fall 2004 28 12.6% Fall 2005 22 9.9% (Chart 2: Retention Rates for Total Remedial Cohort) 1999 Freshman Retention Rates Of the 222 students in the Fall Semester 1999 cohort, 190 were freshman. The retention §§ rates for these freshman students were as follows: Term # of Students % of Freshman Remedial Cohort Fall 2000 114 60.0% Fall 2001 76 40.0% Fall 2002 63 33.2% Fall 2003 45 23.7% Fall 2004 23 12.1% †† In determining these percentages, only those students that completed the class and earned a grade of S, TF, or U were considered. IN, W, and students that were not assigned a grade are not included in the analysis. ‡‡ This cohort contains all classifications, not just freshmen. Therefore, the retention rates referred to here are not to be confused with the normal discussion of the Freshmen Retention. §§ This cohort contains freshman identified by the number of credit hours earned. Therefore, the retention rates referred to here are not to be confused with the normal discussion of the First time First year Freshman Retention.
31 of 59
Fall 2005 19 10.0% (Chart 3: Retention Rates for Freshman Remedial Students)
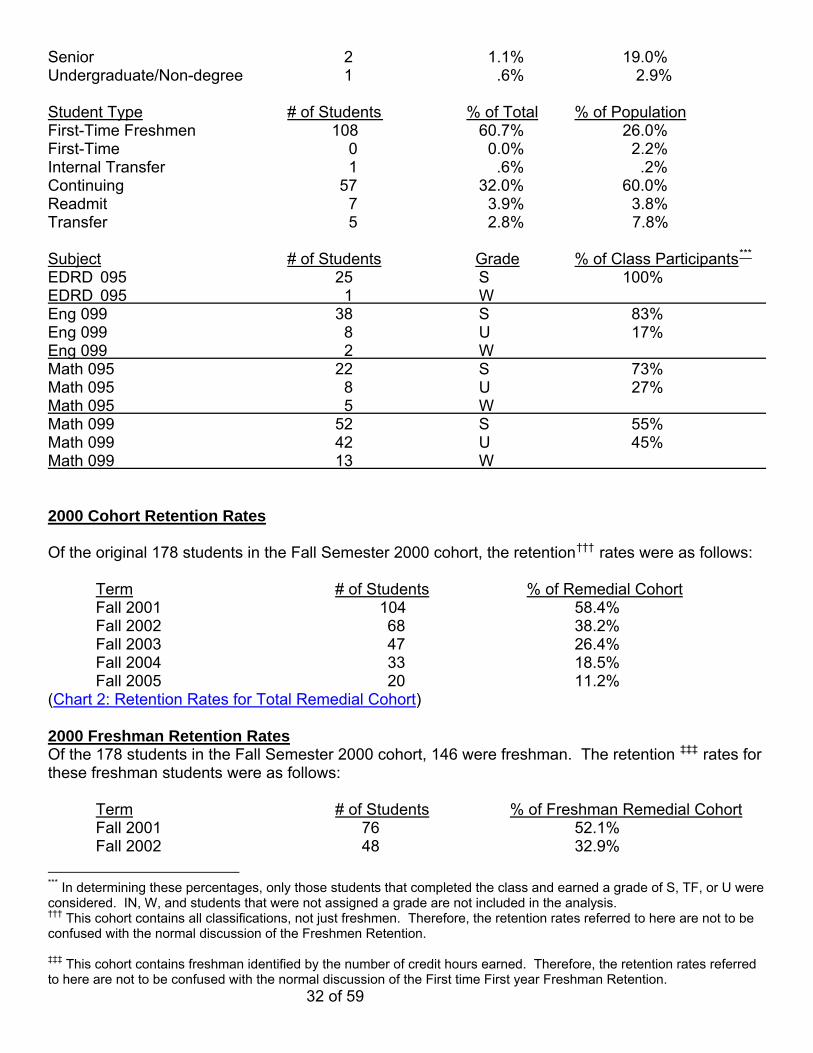
Fall Semester 2000 Remedial Students (Chart 1, pg. 1) In the Fall Semester of 2000, 178 (8.9%) of the 2009 enrolled undergraduate students were registered in remedial (<100 in Math, Eng, EDRD) classes. Of this remedial cohort, 37 (20.8%) were First Generation, and 97 (54.5%) were low income (based on whether they were offered a Pell Grant for the 2000 - 2001 Academic Year). These students can be broken down in the following fashion: Age # of Students % of Total % of Population < 25 146 82.0% 79.3% ≥ 25 32 18.0% 20.7% Gender # of Students % of Total % of Population Male 76 42.7% 56.8% Female 102 57.3% 43.0% Undeclared 0 0.0% .2% Residency Status # of Students % of Total % of Population Resident 153 85.9% 83.8% Non-Resident 24 13.5% 15.2% Reciprocity/New Mexico Agreement 0 0.0% .8% Military 1 .6% .2% San Luis Valley County # of Students % of Total % of Population Alamosa 34 19.1% 22.6% Conejos 13 7.3% 7.9% Costilla 6 3.4% 2.4% Mineral 1 .6% 1.5% Rio Grande 23 12.9% 12.5% Saguache 4 2.2% 1.6% Ethnicity # of Students % of Total % of Population Asian/Pacific Islander 3 1.7% 1.2% Black, Non-Hispanic 12 6.7% 3.6% Hispanic 76 42.7% 28.3% Native American/Alaskan Native 5 2.8% 1.8% Non-Resident Alien 0 0.0% .4% White, Non-Hispanic 82 46.1% 64.3% Undeclared 0 0.0% .4% Registration Status # of Students % of Total % of Population Part-Time (less than 12 hrs registered) 6 3.4% 22.1% Full-Time (12 or more hrs registered) 172 96.6% 82.9% Classification # of Students % of Total % of Population Freshman 146 82.0% 40.0% Sophomore 26 14.6% 19.2% Junior 3 1.7% 18.9%
32 of 59
Senior 2 1.1% 19.0% Undergraduate/Non-degree 1 .6% 2.9% Student Type # of Students % of Total % of Population First-Time Freshmen 108 60.7% 26.0% First-Time 0 0.0% 2.2% Internal Transfer 1 .6% .2% Continuing 57 32.0% 60.0% Readmit 7 3.9% 3.8% Transfer 5 2.8% 7.8% Subject # of Students Grade % of Class Participants*** EDRD 095 25 S 100% EDRD 095 1 W Eng 099 38 S 83% Eng 099 8 U 17% Eng 099 2 W Math 095 22 S 73% Math 095 8 U 27% Math 095 5 W Math 099 52 S 55% Math 099 42 U 45% Math 099 13 W 2000 Cohort Retention Rates Of the original 178 students in the Fall Semester 2000 cohort, the retention††† rates were as follows: Term # of Students % of Remedial Cohort Fall 2001 104 58.4% Fall 2002 68 38.2% Fall 2003 47 26.4% Fall 2004 33 18.5% Fall 2005 20 11.2% (Chart 2: Retention Rates for Total Remedial Cohort) 2000 Freshman Retention Rates Of the 178 students in the Fall Semester 2000 cohort, 146 were freshman. The retention ‡‡‡ rates for these freshman students were as follows: Term # of Students % of Freshman Remedial Cohort Fall 2001 76 52.1% Fall 2002 48 32.9% *** In determining these percentages, only those students that completed the class and earned a grade of S, TF, or U were considered. IN, W, and students that were not assigned a grade are not included in the analysis. ††† This cohort contains all classifications, not just freshmen. Therefore, the retention rates referred to here are not to be confused with the normal discussion of the Freshmen Retention. ‡‡‡ This cohort contains freshman identified by the number of credit hours earned. Therefore, the retention rates referred to here are not to be confused with the normal discussion of the First time First year Freshman Retention.
33 of 59
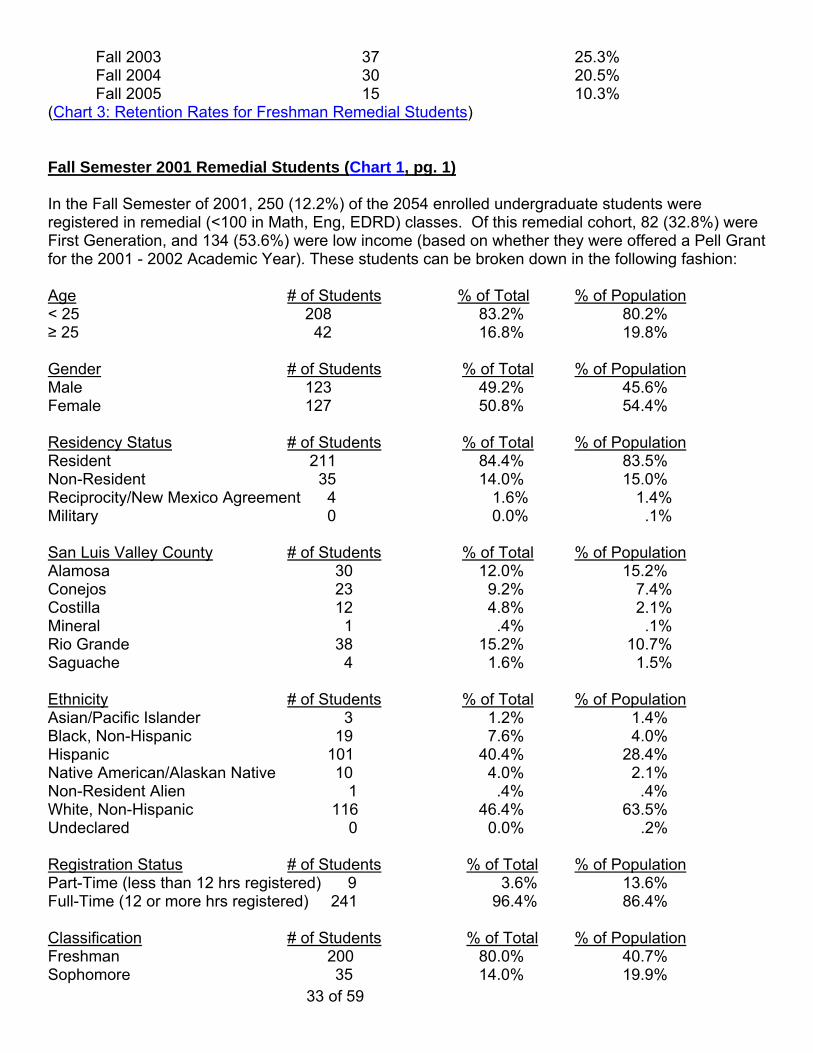
Fall 2003 37 25.3% Fall 2004 30 20.5% Fall 2005 15 10.3% (Chart 3: Retention Rates for Freshman Remedial Students) Fall Semester 2001 Remedial Students (Chart 1, pg. 1) In the Fall Semester of 2001, 250 (12.2%) of the 2054 enrolled undergraduate students were registered in remedial (<100 in Math, Eng, EDRD) classes. Of this remedial cohort, 82 (32.8%) were First Generation, and 134 (53.6%) were low income (based on whether they were offered a Pell Grant for the 2001 - 2002 Academic Year). These students can be broken down in the following fashion: Age # of Students % of Total % of Population < 25 208 83.2% 80.2% ≥ 25 42 16.8% 19.8% Gender # of Students % of Total % of Population Male 123 49.2% 45.6% Female 127 50.8% 54.4% Residency Status # of Students % of Total % of Population Resident 211 84.4% 83.5% Non-Resident 35 14.0% 15.0% Reciprocity/New Mexico Agreement 4 1.6% 1.4% Military 0 0.0% .1% San Luis Valley County # of Students % of Total % of Population Alamosa 30 12.0% 15.2% Conejos 23 9.2% 7.4% Costilla 12 4.8% 2.1% Mineral 1 .4% .1% Rio Grande 38 15.2% 10.7% Saguache 4 1.6% 1.5% Ethnicity # of Students % of Total % of Population Asian/Pacific Islander 3 1.2% 1.4% Black, Non-Hispanic 19 7.6% 4.0% Hispanic 101 40.4% 28.4% Native American/Alaskan Native 10 4.0% 2.1% Non-Resident Alien 1 .4% .4% White, Non-Hispanic 116 46.4% 63.5% Undeclared 0 0.0% .2% Registration Status # of Students % of Total % of Population Part-Time (less than 12 hrs registered) 9 3.6% 13.6% Full-Time (12 or more hrs registered) 241 96.4% 86.4% Classification # of Students % of Total % of Population Freshman 200 80.0% 40.7% Sophomore 35 14.0% 19.9%
34 of 59
Junior 11 4.4% 15.1% Senior 4 1.6% 22.0% Undergraduate/Non-Degree Seeking 0 0.0% 23.4% Student Type # of Students % of Total % of Population First-Time Freshmen 148 59.2% 27.6% First-Time 0 0.0% 1.6% Internal Transfer 0 0.0% .1% Continuing 78 31.2% 59.3% Readmit 4 1.6% 3.2% Transfer 20 8.0% 8.2% Subject # of Students Grade % of Class Participants§§§ EDRD 095 38 S 60% EDRD 095 25 U 40% EDRD 095 2 W Eng 099 77 S 83% Eng 099 16 U 17% Eng 099 6 W Math 095 11 S 50% Math 095 11 U 50% Math 095 3 W Math 099 52 S 44% Math 099 67 U 56% Math 099 28 W Math 099 1 No Grade 2001 Cohort Retention Rates Of the original 250 students in the Fall Semester 2001 cohort, the retention**** rates were as follows: Term # of Students % of Remedial Cohort Fall 2002 134 53.6% Fall 2003 90 36.0% Fall 2004 72 28.8% Fall 2005 53 21.2% (Chart 2: Retention Rates for Total Remedial Cohort) 2001 Freshman Retention Rates Of the 250 students in the Fall Semester 2001 cohort, 200 were freshman. The retention †††† rates for these freshman students were as follows: Term # of Students % of Freshman Remedial Cohort
§§§ In determining these percentages, only those students that completed the class and earned a grade of S, TF, or U were considered. IN, W, and students that were not assigned a grade are not included in the analysis. **** This cohort contains all classifications, not just freshmen. Therefore, the retention rates referred to here are not to be confused with the normal discussion of the Freshmen Retention. †††† This cohort contains freshman identified by the number of credit hours earned. Therefore, the retention rates referred to here are not to be confused with the normal discussion of the First time First year Freshman Retention.

35 of 59
Fall 2002 99 49.5% Fall 2003 68 34.0% Fall 2004 55 27.5% Fall 2005 42 21.0% (Chart 3: Retention Rates for Freshman Remedial Students) Fall Semester 2002 Remedial Students (Chart 1, pg. 1) In the Fall Semester of 2002, 224 (11.1%) of the 2018 enrolled undergraduate students were registered in remedial (<100 in Math, Eng, EDRD) classes. Of this cohort, 70 (31.2%) were First Generation, and 129 (57.6%) were low income (based on whether they were offered a Pell Grant for the 2002 - 2003 Academic Year). These students can be broken down in the following fashion: Age # of Students % of Total % of Population < 25 182 81.2% 79.3% ≥ 25 42 18.8% 20.7% Gender # of Students % of Total % of Population Male 99 44.2% 42.8% Female 125 55.8% 56.7% Undeclared 0 0.0% .5% Residency Status # of Students % of Total % of Population Resident 198 88.5% 82.5% Non-Resident 20 8.9% 10.1% Reciprocity/New Mexico Agreement 3 1.3% 1.1% Military 0 0.0% .1% WUE 3 1.3% 6.2% San Luis Valley County # of Students % of Total % of Population Alamosa 42 18.7% 15.5% Conejos 18 8.0% 8.3% Costilla 7 3.1% 2.1% Mineral 1 .4% .2% Rio Grande 22 9.8% 9.2% Saguache 8 3.6% 1.5% Ethnicity # of Students % of Total % of Population Asian/Pacific Islander 2 .9% 1.0% Black, Non-Hispanic 23 10.3% 4.3% Hispanic 94 42.0% 28.3% Native American/Alaskan Native 1 .4% 1.8% Non-Resident Alien 0 0.0% .5% White, Non-Hispanic 104 46.4% 63.3% Undeclared 0 0.0% .8% Registration Status # of Students % of Total % of Population Part-Time (less than 12 hrs registered) 10 4.5% 15.7%

36 of 59
Full-Time (12 or more hrs registered) 214 95.5% 84.3% Classification # of Students % of Total % of Population Freshman 169 75.4% 38.1% Sophomore 34 15.2% 20.2% Junior 16 7.2% 18.3% Senior 4 1.8% 20.9% Undergraduate/Non-Degree Seeking 0 0.0% 2.5% Graduate/Non-Degree Seeking 1 .4% 0.0% Student Type # of Students % of Total % of Population First-Time Freshmen 123 54.9% 25.3% First-Time 0 0.0% 1.7% Continuing 85 37.9% 58.1% Readmit 8 3.6% 5.2% Transfer 8 3.6% 9.7% Subject # of Students Grade % of Class Participants‡‡‡‡ EDRD 095 23 S 88% EDRD 095 3 U 12% EDRD 095 6 W Eng 099 47 S 78% Eng 099 13 U 22% Eng 099 1 IN Eng 099 6 W Math 095 21 S 53% Math 095 19 U 47% Math 095 5 W Math 099 45 S 45% Math 099 56 U 55% Math 099 31 W 2002 Cohort Retention Rates Of the original 224 students in the Fall Semester 2002 cohort, the retention§§§§ rates were as follows: Term # of Students % of Remedial Cohort Fall 2003 119 53.1% Fall 2004 99 44.2% Fall 2005 73 32.6% (Chart 2: Retention Rates for Total Remedial Cohort) 2002 Freshman Retention Rates Of the 224 students in the Fall Semester 2002 cohort, 169 were freshman. The retention ***** rates for these freshman students were as follows: ‡‡‡‡ In determining these percentages, only those students that completed the class and earned a grade of S, TF, or U were considered. IN, W, and students that were not assigned a grade are not included in the analysis. §§§§ This cohort contains all classifications, not just freshmen. Therefore, the retention rates referred to here are not to be confused with the normal discussion of the Freshmen Retention.

37 of 59
Term # of Students % of Freshman Remedial Cohort Fall 2003 78 46.2% Fall 2004 66 39.1% Fall 2005 55 32.5% (Chart 3: Retention Rates for Freshman Remedial Students) Fall Semester 2003 Remedial Students (Chart 1, pg. 1) In the Fall Semester of 2003, 228 (11.4%) of the 1994 enrolled undergraduate students were registered in remedial (<100 in Math, Eng, EDRD) classes. Of this cohort, 70 (30.7%) were First Generation, and 128 (56.1%) were low income (based on whether they were offered a Pell Grant for the 2003 - 2004 Academic Year). These students can be broken down in the following fashion: Age # of Students % of Total % of Population < 25 193 84.6% 78.5% ≥ 25 35 15.4% 21.5% Gender # of Students % of Total % of Population Male 106 46.5% 42.6% Female 122 53.5% 57.2% Undeclared 0 0.0% .2% Residency Status # of Students % of Total % of Population Resident 208 91.2% 83.8% Non-Resident 11 4.8% 9.5% Military 0 0.0% .1% Reciprocity/New Mexico Agreement 5 2.2% 1.1% WUE 4 1.8% 5.5% San Luis Valley County # of Students % of Total % of Population Alamosa 40 17.5% 17.0% Conejos 29 12.7% 9.2% Costilla 6 2.6% 2.1% Mineral 0 0.0% .2% Rio Grande 28 12.3% 9.0% Saguache 2 .9% 1.3% Ethnicity # of Students % of Total % of Population Asian/Pacific Islander 1 .4% .9% Black, Non-Hispanic 15 6.6% 4.5% Hispanic 87 38.2% 26.8% Native American/Alaskan Native 5 2.2% 1.7% Non-Resident Alien 0 0.0% .4% White, Non-Hispanic 118 51.8% 64.8% Undeclared 2 .8% .9%
***** This cohort contains freshman identified by the number of credit hours earned. Therefore, the retention rates referred to here are not to be confused with the normal discussion of the First time First year Freshman Retention.

38 of 59
Registration Status # of Students % of Total % of Population Part-Time (less than 12 hrs registered) 10 4.4% 19.0% Full-Time (12 or more hrs registered) 218 95.6% 81.0% Classification # of Students % of Total % of Population Freshman 165 72.4% 33.9% Sophomore 38 16.7% 20.6% Junior 17 7.4% 20.0% Senior 7 3.1% 23.1% Undergraduate/Non-Degree Seeking 1 .4% 2.4% Student Type # of Students % of Total % of Population First-Time Freshmen 120 52.6% 22.8% First-Time Other 1 .4% 1.8% Continuing 87 38.2% 60.5% Internal Transfer 1 .4% .2% Readmit 6 2.6% 5.0% Transfer 13 5.8% 9.7% Subject # of Students Grade % of Class Participants††††† EDRD 095 35 S 83% EDRD 095 7 U 17% EDRD 095 9 IN EDRD 095 2 W Eng 099 57 S 83% Eng 099 12 U 17% Eng 099 1 IN Eng 099 5 W Eng 099 1 No Grade Math 095 18 S 51% Math 095 17 U 49% Math 095 2 W Math 099 48 S 48% Math 099 53 U 52% Math 099 15 W Math 099 1 No Grade 2003 Cohort Retention Rates Of the original 228 students in the Fall Semester 2003 cohort, the retention‡‡‡‡‡ rate is as follows: Term # of Students % of Remedial Cohort Fall 2004 125 54.8% Fall 2005 86 37.7% (Chart 2: Retention Rates for Total Remedial Cohort) ††††† In determining these percentages, only those students that completed the class and earned a grade of S, TF, or U were considered. IN, W, and students that were not assigned a grade are not included in the analysis. ‡‡‡‡‡ This cohort contains all classifications, not just freshmen. Therefore, the retention rates referred to here are not to be confused with the normal discussion of the Freshmen Retention.

39 of 59
2003 Freshman Retention Rates Of the 228 students in the Fall Semester 2003 cohort, 165 were freshman. The retention §§§§§ rates for these freshman students were as follows: Term # of Students % of Freshman Remedial Cohort Fall 2004 84 50.9% Fall 2005 56 33.9% (Chart 3: Retention Rates for Freshman Remedial Students) Fall Semester 2004 Remedial Students (Chart 1, pg. 1) In the Fall Semester of 2004, 282 (14.5%) of the 1946 enrolled undergraduate students were registered in remedial (<100 in Math, Eng, EDRD) classes. Of this cohort, 87 (30.8%) were First Generation, and 145 (51.4%) were low income (based on whether they were offered a Pell Grant for the 2004 – 2005 Academic Year). These students can be broken down in the following fashion: Age # of Students % of Total % of Population < 25 233 82.6% 77.1% ≥ 25 49 17.4% 22.9% Gender # of Students % of Total % of Population Male 130 46.1% 43.0% Female 152 53.9% 57.0% Residency Status # of Students % of Total % of Population Resident 255 90.4% 85.3% Non-Resident 13 4.6% 7.8% Military 0 0.0% .1% Reciprocity/New Mexico Agreement 5 1.8% 1.2% WUE 9 3.2% 5.6% San Luis Valley County # of Students % of Total % of Population Alamosa 40 14.2% 17.9% Conejos 16 5.7% 9.1% Costilla 4 1.4% 2.3% Mineral 2 .7% .5% Rio Grande 23 8.2% 10.4% Saguache 4 1.4% 1.3% Ethnicity # of Students % of Total % of Population Asian/Pacific Islander 1 .4% .9% Black, Non-Hispanic 17 6.0% 5.2% Hispanic 106 37.5% 27.9% Native American/Alaskan Native 7 2.5% 1.5% Non-Resident Alien 0 0.0% .3% White, Non-Hispanic 142 50.4% 61.0%
§§§§§ This cohort contains freshman identified by the number of credit hours earned. Therefore, the retention rates referred to here are not to be confused with the normal discussion of the First time First year Freshman Retention.
40 of 59
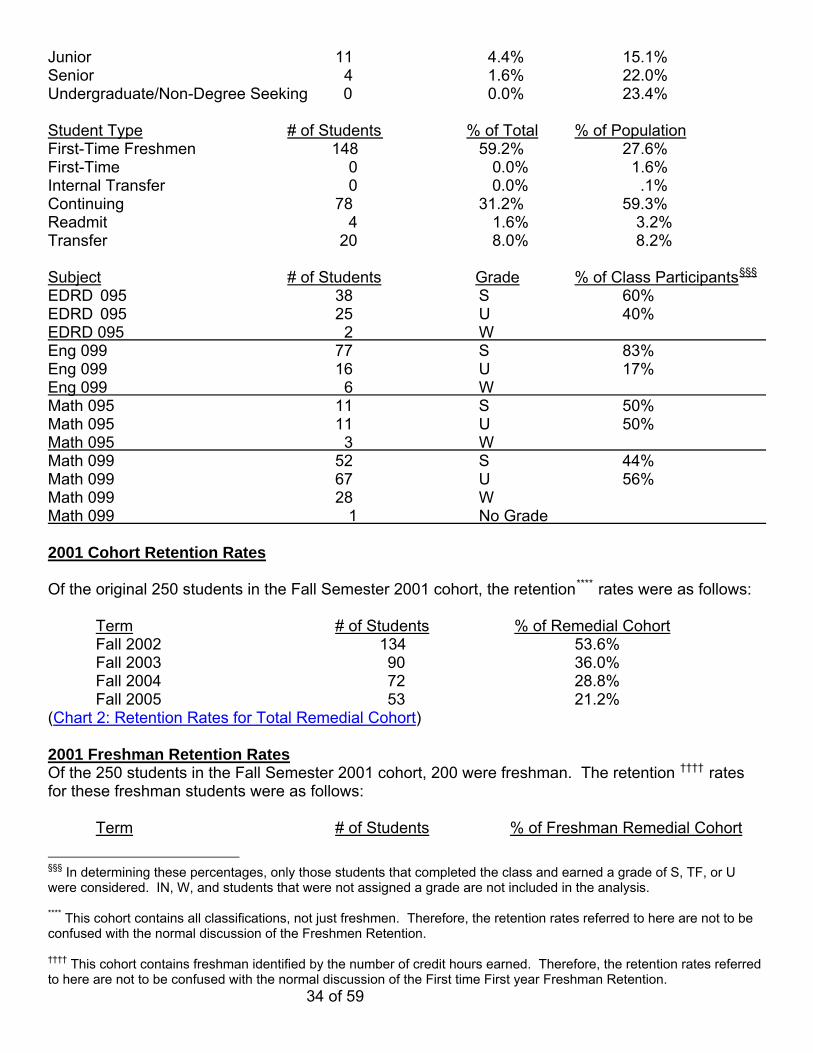
Undeclared 9 3.2% 3.2% Registration Status # of Students % of Total % of Population Part-Time (less than 12 hrs registered) 19 6.7% 16.6% Full-Time (12 or more hrs registered) 263 93.3% 83.4% Classification # of Students % of Total % of Population Freshman 205 72.7% 32.2% Sophomore 43 15.3% 19.9% Junior 19 6.7% 19.2% Senior 10 3.5% 24.8% Undergraduate/Non-Degree Seeking 3 1.1% 3.9% Graduate/Non-Degree Seeking 2 .7% 0.0% Student Type # of Students % of Total % of Population First-Time Freshmen 141 50.0% 20.5% First-Time Other 3 1.1% 3.6% Continuing 108 38.3% 63.9% Internal Transfer 2 .7% .5% Readmit 16 5.7% 6.2% Transfer 12 4.2% 10.5% Subject # of Students Grade % of Class Participants****** EDRD 095 38 S 69% EDRD 095 17 U 31% EDRD 095 2 W EDRD 095 2 No Grade Eng 099 33 S 67% Eng 099 16 U 33% Eng 099 4 W Eng 099 2 No Grade Math 095 25 S 61% Math 095 16 U 39% Math 095 8 W Math 097 26 S 40% Math 097 39 U 60% Math 097 9 W Math 099 33 S 43% Math 099 44 U 57% Math 099 11 W 2004 Cohort Retention Rates Of the original 282 students in the Fall Semester 2004 cohort, the retention†††††† rate is as follows: ****** In determining these percentages, only those students that completed the class and earned a grade of S, TF, or U were considered. IN, W, and students that were not assigned a grade are not included in the analysis. †††††† This cohort contains all classifications, not just freshmen. Therefore, the retention rates referred to here are not to be confused with the normal discussion of the Freshmen Retention.
41 of 59
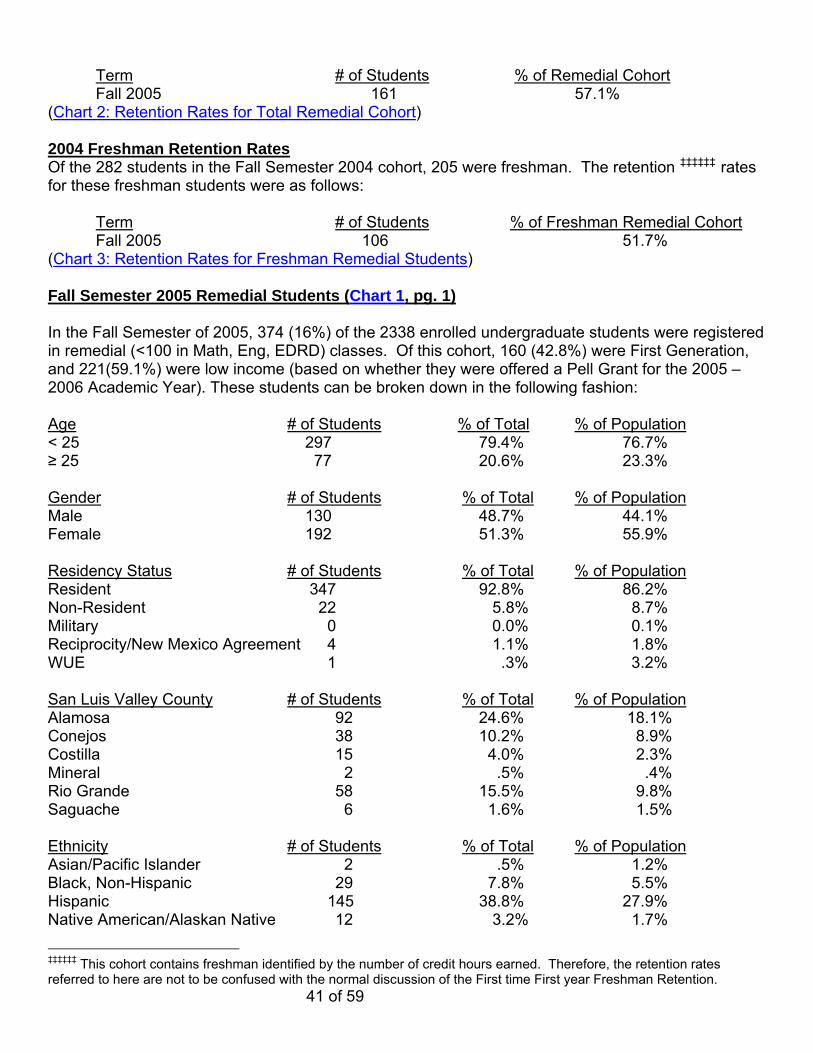
Term # of Students % of Remedial Cohort Fall 2005 161 57.1% (Chart 2: Retention Rates for Total Remedial Cohort) 2004 Freshman Retention Rates Of the 282 students in the Fall Semester 2004 cohort, 205 were freshman. The retention ‡‡‡‡‡‡ rates for these freshman students were as follows: Term # of Students % of Freshman Remedial Cohort Fall 2005 106 51.7% (Chart 3: Retention Rates for Freshman Remedial Students) Fall Semester 2005 Remedial Students (Chart 1, pg. 1) In the Fall Semester of 2005, 374 (16%) of the 2338 enrolled undergraduate students were registered in remedial (<100 in Math, Eng, EDRD) classes. Of this cohort, 160 (42.8%) were First Generation, and 221(59.1%) were low income (based on whether they were offered a Pell Grant for the 2005 – 2006 Academic Year). These students can be broken down in the following fashion: Age # of Students % of Total % of Population < 25 297 79.4% 76.7% ≥ 25 77 20.6% 23.3% Gender # of Students % of Total % of Population Male 130 48.7% 44.1% Female 192 51.3% 55.9% Residency Status # of Students % of Total % of Population Resident 347 92.8% 86.2% Non-Resident 22 5.8% 8.7% Military 0 0.0% 0.1% Reciprocity/New Mexico Agreement 4 1.1% 1.8% WUE 1 .3% 3.2% San Luis Valley County # of Students % of Total % of Population Alamosa 92 24.6% 18.1% Conejos 38 10.2% 8.9% Costilla 15 4.0% 2.3% Mineral 2 .5% .4% Rio Grande 58 15.5% 9.8% Saguache 6 1.6% 1.5% Ethnicity # of Students % of Total % of Population Asian/Pacific Islander 2 .5% 1.2% Black, Non-Hispanic 29 7.8% 5.5% Hispanic 145 38.8% 27.9% Native American/Alaskan Native 12 3.2% 1.7%
‡‡‡‡‡‡ This cohort contains freshman identified by the number of credit hours earned. Therefore, the retention rates referred to here are not to be confused with the normal discussion of the First time First year Freshman Retention.

42 of 59
Non-Resident Alien 0 0.0% .1% White, Non-Hispanic 172 46.0% 57.8% Undeclared 14 3.7% 5.8% Registration Status # of Students % of Total % of Population Part-Time (less than 12 hrs registered) 29 7.8% 24.0% Full-Time (12 or more hrs registered) 345 92.2% 76.0% Classification # of Students % of Total % of Population Freshman 291 77.8% 36.7% Sophomore 47 12.6% 17.1% Junior 22 5.9% 17.8% Senior 14 3.7% 27.0% Non-Degree Seeking Undergrad 0 0.0% 1.4% Student Type # of Students % of Total % of Population First-Time Freshmen 199 53.2% 24.9% First-Time Other 1 .3% .5% Continuing 133 35.6% 60.2% Internal Transfer 4 1.1% .4% Readmit 17 4.5% 5.9% Transfer 20 5.3% 8.1% Subject # of Students Grade % of Class Participants§§§§§§ EDRD 095 74 S 82% EDRD 095 16 U 18% EDRD 095 1 W Eng 099 64 S 70% Eng 099 6 U 7% Eng 099 21 TF******* 23% Eng 099 2 W Math 095 57 S 52% Math 095 35 U 32% Math 095 18 TF 16% Math 095 2 W Math 097 29 S 46% Math 097 26 U 41% Math 097 8 TF 13% Math 097 1 IN Math 097 14 W Math 099 66 S 65% Math 099 26 U 25% Math 099 10 TF 10% Math 099 1 IN Math 099 6 W §§§§§§ In determining these percentages, only those students that completed the class and earned a grade of S, TF, or U were considered. IN, W, and students that were not assigned a grade are not included in the analysis. ******* Starting Fall Semester 2005, a new grade option, Technical Failure (TF), was initiated. This grade is assigned to students who did not attend or withdrawal from a course for which they were registered.
43 of 59
REMEDIAL RESULTS BY DEPARTMENT AND CLASS (REMEDIAL RESULTS BY CLASS, pg. 4) EDRD (Chart 6: EDRD 095 Results Fall 1999 – Fall 2005 pg. 4)
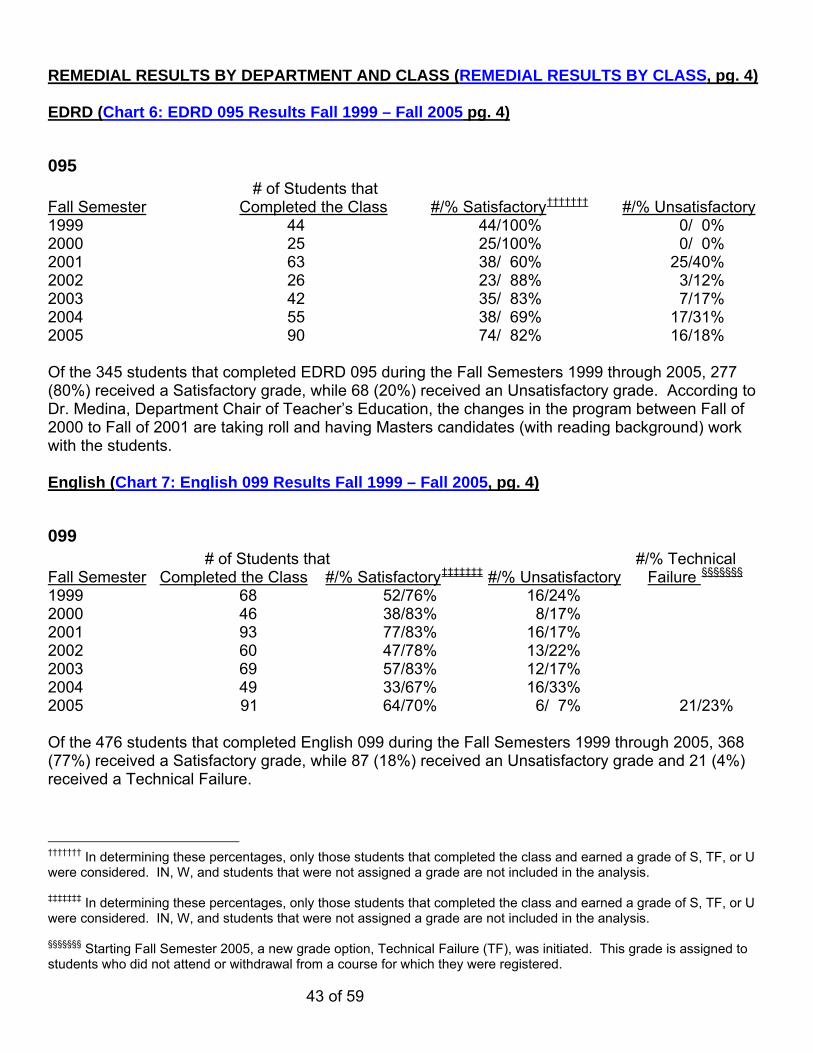
095 # of Students that Fall Semester Completed the Class #/% Satisfactory††††††† #/% Unsatisfactory 1999 44 44/100% 0/ 0% 2000 25 25/100% 0/ 0% 2001 63 38/ 60% 25/40% 2002 26 23/ 88% 3/12% 2003 42 35/ 83% 7/17% 2004 55 38/ 69% 17/31% 2005 90 74/ 82% 16/18% Of the 345 students that completed EDRD 095 during the Fall Semesters 1999 through 2005, 277 (80%) received a Satisfactory grade, while 68 (20%) received an Unsatisfactory grade. According to Dr. Medina, Department Chair of Teacher’s Education, the changes in the program between Fall of 2000 to Fall of 2001 are taking roll and having Masters candidates (with reading background) work with the students. English (Chart 7: English 099 Results Fall 1999 – Fall 2005, pg. 4)
099 # of Students that #/% Technical Fall Semester Completed the Class #/% Satisfactory‡‡‡‡‡‡‡ #/% Unsatisfactory Failure §§§§§§§ 1999 68 52/76% 16/24% 2000 46 38/83% 8/17% 2001 93 77/83% 16/17% 2002 60 47/78% 13/22% 2003 69 57/83% 12/17% 2004 49 33/67% 16/33% 2005 91 64/70% 6/ 7% 21/23% Of the 476 students that completed English 099 during the Fall Semesters 1999 through 2005, 368 (77%) received a Satisfactory grade, while 87 (18%) received an Unsatisfactory grade and 21 (4%) received a Technical Failure.
††††††† In determining these percentages, only those students that completed the class and earned a grade of S, TF, or U were considered. IN, W, and students that were not assigned a grade are not included in the analysis. ‡‡‡‡‡‡‡ In determining these percentages, only those students that completed the class and earned a grade of S, TF, or U were considered. IN, W, and students that were not assigned a grade are not included in the analysis. §§§§§§§ Starting Fall Semester 2005, a new grade option, Technical Failure (TF), was initiated. This grade is assigned to students who did not attend or withdrawal from a course for which they were registered.
44 of 59
Mathematics
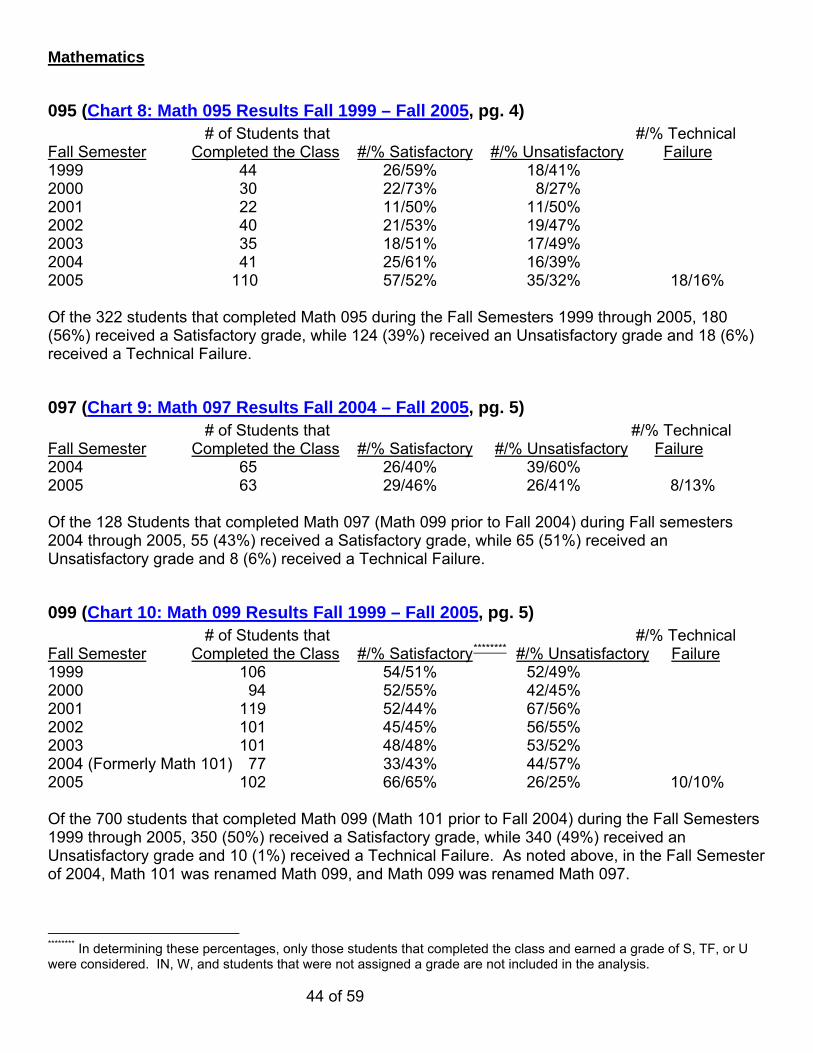
095 (Chart 8: Math 095 Results Fall 1999 – Fall 2005, pg. 4) # of Students that #/% Technical Fall Semester Completed the Class #/% Satisfactory #/% Unsatisfactory Failure 1999 44 26/59% 18/41% 2000 30 22/73% 8/27% 2001 22 11/50% 11/50% 2002 40 21/53% 19/47% 2003 35 18/51% 17/49% 2004 41 25/61% 16/39% 2005 110 57/52% 35/32% 18/16% Of the 322 students that completed Math 095 during the Fall Semesters 1999 through 2005, 180 (56%) received a Satisfactory grade, while 124 (39%) received an Unsatisfactory grade and 18 (6%) received a Technical Failure.
097 (Chart 9: Math 097 Results Fall 2004 – Fall 2005, pg. 5) # of Students that #/% Technical Fall Semester Completed the Class #/% Satisfactory #/% Unsatisfactory Failure 2004 65 26/40% 39/60% 2005 63 29/46% 26/41% 8/13% Of the 128 Students that completed Math 097 (Math 099 prior to Fall 2004) during Fall semesters 2004 through 2005, 55 (43%) received a Satisfactory grade, while 65 (51%) received an Unsatisfactory grade and 8 (6%) received a Technical Failure.
099 (Chart 10: Math 099 Results Fall 1999 – Fall 2005, pg. 5) # of Students that #/% Technical Fall Semester Completed the Class #/% Satisfactory******** #/% Unsatisfactory Failure 1999 106 54/51% 52/49% 2000 94 52/55% 42/45% 2001 119 52/44% 67/56% 2002 101 45/45% 56/55% 2003 101 48/48% 53/52% 2004 (Formerly Math 101) 77 33/43% 44/57% 2005 102 66/65% 26/25% 10/10% Of the 700 students that completed Math 099 (Math 101 prior to Fall 2004) during the Fall Semesters 1999 through 2005, 350 (50%) received a Satisfactory grade, while 340 (49%) received an Unsatisfactory grade and 10 (1%) received a Technical Failure. As noted above, in the Fall Semester of 2004, Math 101 was renamed Math 099, and Math 099 was renamed Math 097.
******** In determining these percentages, only those students that completed the class and earned a grade of S, TF, or U were considered. IN, W, and students that were not assigned a grade are not included in the analysis.

45 of 59
All Classes All Terms (Chart 11: Remedial Math Results – All Classes All Terms, pg. 5) Over all, the remedial results for all three Math classes for the semesters involved in this study are: Students completing the classes Satisfactory Unsatisfactory Technical Failure 1150 585 (51%) 529 (46%) 36 (3%) REMEDIAL RESULTS – SUBSEQUENT CLASSES ( SUBSEQUENT CLASSES, pg. 6) EDRD 095 (Chart 12: EDRD Average GPA Comparison, pg. 6) EDRD 095 (Basic Reading Skills) classes are a requirement of the Teacher’s Education Department. The students’ progress as a result of taking the class is very difficult to track as there are no classes that logically follow the completion of EDRD 095. To try to offer some form of measurement, the average GPA of each cohort in the Fall Semester that they were enrolled and the average GPA of the following Fall Semester are shown below: Enrolled Semester GPA Following Fall GPA 1999 2.00 2000 1.73 2000 1.56 2001 1.95 2001 1.88 2002 2.29 2002 1.88 2003 1.79 2003 1.89 2004 2.12 2004 1.43 2005 1.55 English 099 (Chart 13: English 099 to English 101 & 102 Combined, pg. 6) Adams State College graduation requirements include both English 101 and English 102 as part of the General Education Curriculum. English 099 is the remedial class available to students that may need help to be successful in those courses. Below is an analysis of the success rates in English 101 and English 102 of the cohorts of students who had taken English 099. Some of the students had taken the courses more than once.
Fall Semester 1999 Remedial Students Of the 222 students that were enrolled in remedial classes in the Fall Semester of 1999, 69 (27%) were enrolled in Eng 099. Of those students that received a Satisfactory grade [52 (75.4%)], 45 (86.5%) enrolled in English 101, and 28 (53.8%) enrolled in English 102. The reported grades are: A B C D F IN W English 101 4 14 16 6 7 0 3 English 102 7 9 8 1 4 0 5 (Chart 17: Fall 1999 English 099 Next Class Results – Satisfactory Grade, pg. 8) Of the 16 (23.2%) students that received an Unsatisfactory grade, 5 (31.3%) enrolled in English 101, and 2 (1.3%) enrolled in English 102. The reported grades are:
46 of 59
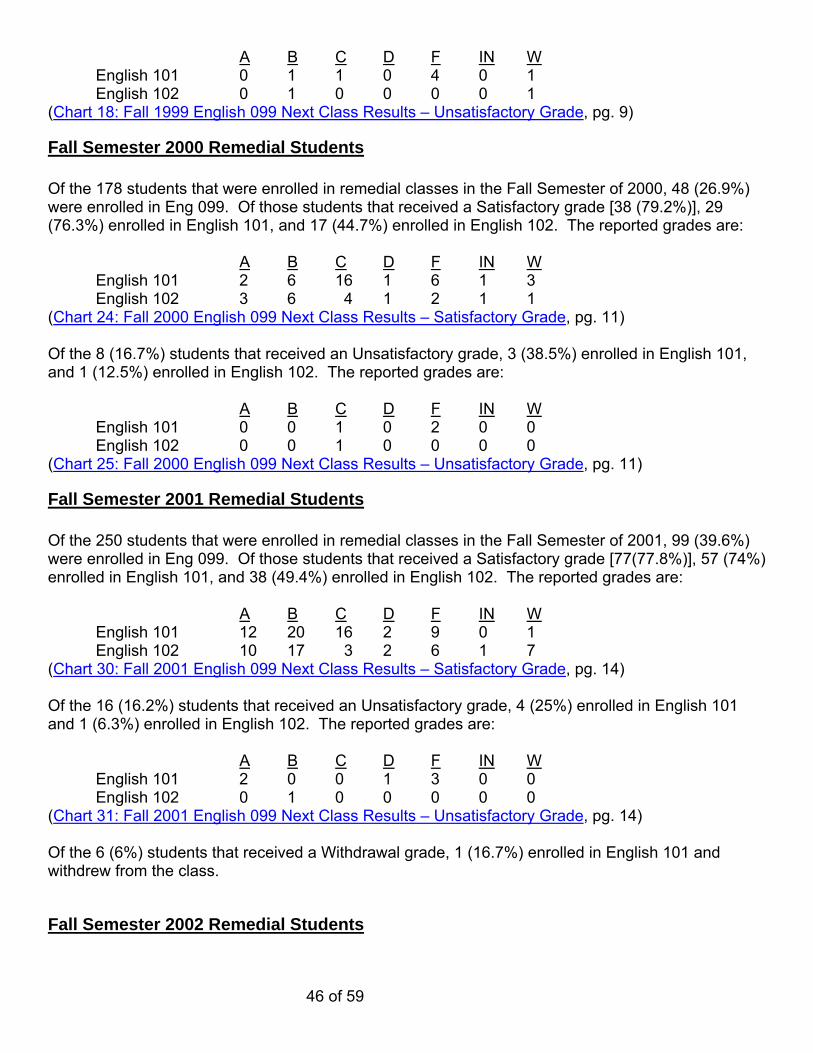
A B C D F IN W English 101 0 1 1 0 4 0 1 English 102 0 1 0 0 0 0 1 (Chart 18: Fall 1999 English 099 Next Class Results – Unsatisfactory Grade, pg. 9)
Fall Semester 2000 Remedial Students Of the 178 students that were enrolled in remedial classes in the Fall Semester of 2000, 48 (26.9%) were enrolled in Eng 099. Of those students that received a Satisfactory grade [38 (79.2%)], 29 (76.3%) enrolled in English 101, and 17 (44.7%) enrolled in English 102. The reported grades are: A B C D F IN W English 101 2 6 16 1 6 1 3 English 102 3 6 4 1 2 1 1 (Chart 24: Fall 2000 English 099 Next Class Results – Satisfactory Grade, pg. 11) Of the 8 (16.7%) students that received an Unsatisfactory grade, 3 (38.5%) enrolled in English 101, and 1 (12.5%) enrolled in English 102. The reported grades are: A B C D F IN W English 101 0 0 1 0 2 0 0 English 102 0 0 1 0 0 0 0 (Chart 25: Fall 2000 English 099 Next Class Results – Unsatisfactory Grade, pg. 11)
Fall Semester 2001 Remedial Students Of the 250 students that were enrolled in remedial classes in the Fall Semester of 2001, 99 (39.6%) were enrolled in Eng 099. Of those students that received a Satisfactory grade [77(77.8%)], 57 (74%) enrolled in English 101, and 38 (49.4%) enrolled in English 102. The reported grades are: A B C D F IN W English 101 12 20 16 2 9 0 1 English 102 10 17 3 2 6 1 7 (Chart 30: Fall 2001 English 099 Next Class Results – Satisfactory Grade, pg. 14) Of the 16 (16.2%) students that received an Unsatisfactory grade, 4 (25%) enrolled in English 101 and 1 (6.3%) enrolled in English 102. The reported grades are: A B C D F IN W English 101 2 0 0 1 3 0 0 English 102 0 1 0 0 0 0 0 (Chart 31: Fall 2001 English 099 Next Class Results – Unsatisfactory Grade, pg. 14) Of the 6 (6%) students that received a Withdrawal grade, 1 (16.7%) enrolled in English 101 and withdrew from the class.
Fall Semester 2002 Remedial Students
47 of 59
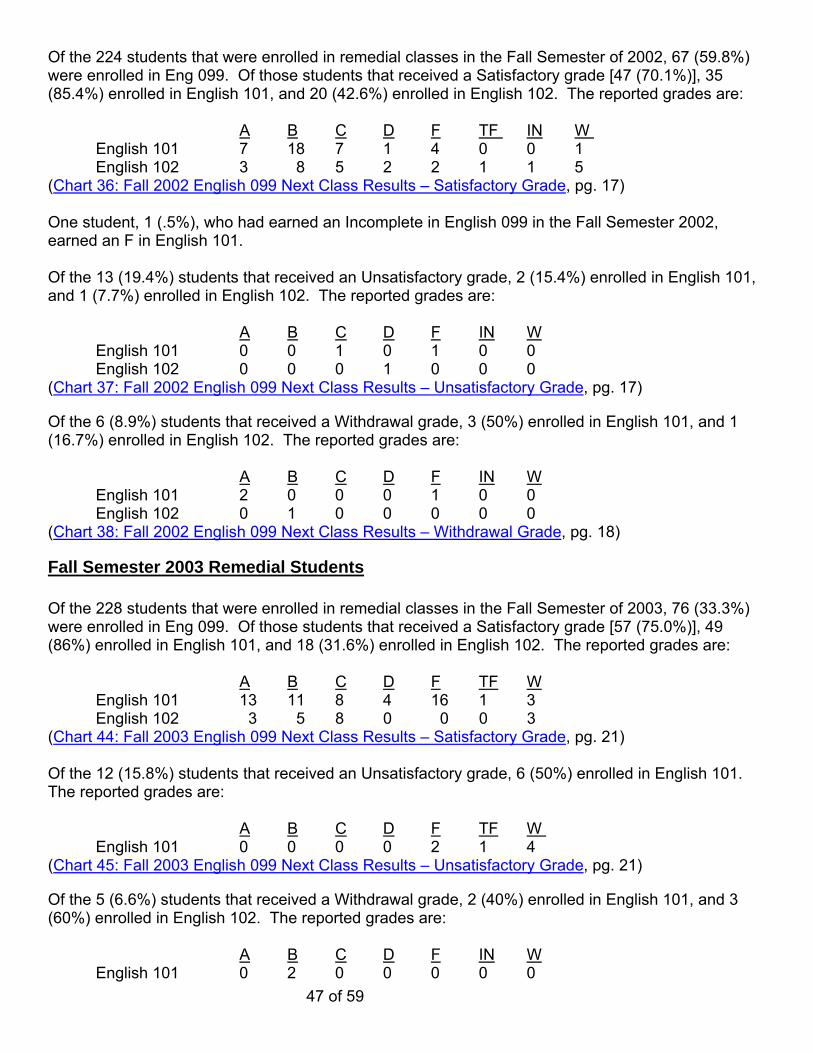
Of the 224 students that were enrolled in remedial classes in the Fall Semester of 2002, 67 (59.8%) were enrolled in Eng 099. Of those students that received a Satisfactory grade [47 (70.1%)], 35 (85.4%) enrolled in English 101, and 20 (42.6%) enrolled in English 102. The reported grades are: A B C D F TF IN W English 101 7 18 7 1 4 0 0 1 English 102 3 8 5 2 2 1 1 5 (Chart 36: Fall 2002 English 099 Next Class Results – Satisfactory Grade, pg. 17) One student, 1 (.5%), who had earned an Incomplete in English 099 in the Fall Semester 2002, earned an F in English 101. Of the 13 (19.4%) students that received an Unsatisfactory grade, 2 (15.4%) enrolled in English 101, and 1 (7.7%) enrolled in English 102. The reported grades are: A B C D F IN W English 101 0 0 1 0 1 0 0 English 102 0 0 0 1 0 0 0 (Chart 37: Fall 2002 English 099 Next Class Results – Unsatisfactory Grade, pg. 17)
Of the 6 (8.9%) students that received a Withdrawal grade, 3 (50%) enrolled in English 101, and 1 (16.7%) enrolled in English 102. The reported grades are: A B C D F IN W English 101 2 0 0 0 1 0 0 English 102 0 1 0 0 0 0 0 (Chart 38: Fall 2002 English 099 Next Class Results – Withdrawal Grade, pg. 18)
Fall Semester 2003 Remedial Students Of the 228 students that were enrolled in remedial classes in the Fall Semester of 2003, 76 (33.3%) were enrolled in Eng 099. Of those students that received a Satisfactory grade [57 (75.0%)], 49 (86%) enrolled in English 101, and 18 (31.6%) enrolled in English 102. The reported grades are: A B C D F TF W English 101 13 11 8 4 16 1 3 English 102 3 5 8 0 0 0 3 (Chart 44: Fall 2003 English 099 Next Class Results – Satisfactory Grade, pg. 21) Of the 12 (15.8%) students that received an Unsatisfactory grade, 6 (50%) enrolled in English 101. The reported grades are: A B C D F TF W English 101 0 0 0 0 2 1 4 (Chart 45: Fall 2003 English 099 Next Class Results – Unsatisfactory Grade, pg. 21)
Of the 5 (6.6%) students that received a Withdrawal grade, 2 (40%) enrolled in English 101, and 3 (60%) enrolled in English 102. The reported grades are: A B C D F IN W English 101 0 2 0 0 0 0 0
48 of 59
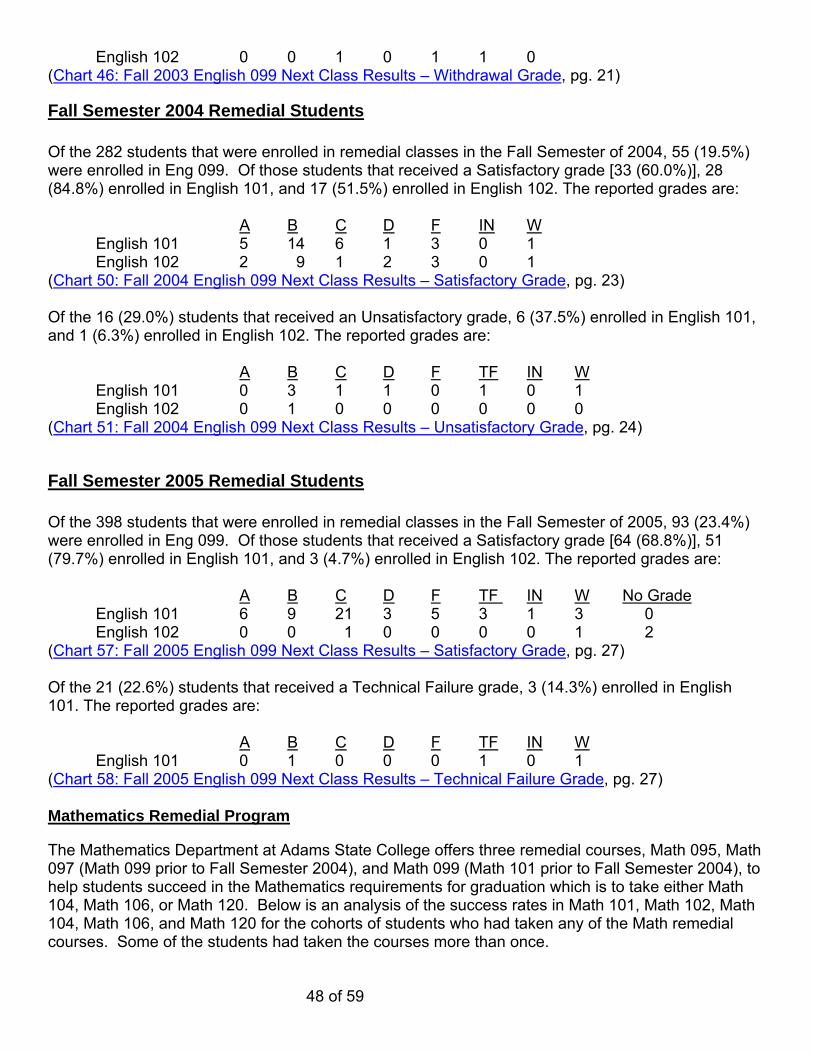
English 102 0 0 1 0 1 1 0 (Chart 46: Fall 2003 English 099 Next Class Results – Withdrawal Grade, pg. 21)
Fall Semester 2004 Remedial Students Of the 282 students that were enrolled in remedial classes in the Fall Semester of 2004, 55 (19.5%) were enrolled in Eng 099. Of those students that received a Satisfactory grade [33 (60.0%)], 28 (84.8%) enrolled in English 101, and 17 (51.5%) enrolled in English 102. The reported grades are: A B C D F IN W English 101 5 14 6 1 3 0 1 English 102 2 9 1 2 3 0 1 (Chart 50: Fall 2004 English 099 Next Class Results – Satisfactory Grade, pg. 23) Of the 16 (29.0%) students that received an Unsatisfactory grade, 6 (37.5%) enrolled in English 101, and 1 (6.3%) enrolled in English 102. The reported grades are: A B C D F TF IN W English 101 0 3 1 1 0 1 0 1 English 102 0 1 0 0 0 0 0 0 (Chart 51: Fall 2004 English 099 Next Class Results – Unsatisfactory Grade, pg. 24)
Fall Semester 2005 Remedial Students Of the 398 students that were enrolled in remedial classes in the Fall Semester of 2005, 93 (23.4%) were enrolled in Eng 099. Of those students that received a Satisfactory grade [64 (68.8%)], 51 (79.7%) enrolled in English 101, and 3 (4.7%) enrolled in English 102. The reported grades are: A B C D F TF IN W No Grade English 101 6 9 21 3 5 3 1 3 0 English 102 0 0 1 0 0 0 0 1 2 (Chart 57: Fall 2005 English 099 Next Class Results – Satisfactory Grade, pg. 27) Of the 21 (22.6%) students that received a Technical Failure grade, 3 (14.3%) enrolled in English 101. The reported grades are: A B C D F TF IN W English 101 0 1 0 0 0 1 0 1 (Chart 58: Fall 2005 English 099 Next Class Results – Technical Failure Grade, pg. 27) Mathematics Remedial Program
The Mathematics Department at Adams State College offers three remedial courses, Math 095, Math 097 (Math 099 prior to Fall Semester 2004), and Math 099 (Math 101 prior to Fall Semester 2004), to help students succeed in the Mathematics requirements for graduation which is to take either Math 104, Math 106, or Math 120. Below is an analysis of the success rates in Math 101, Math 102, Math 104, Math 106, and Math 120 for the cohorts of students who had taken any of the Math remedial courses. Some of the students had taken the courses more than once.
49 of 59
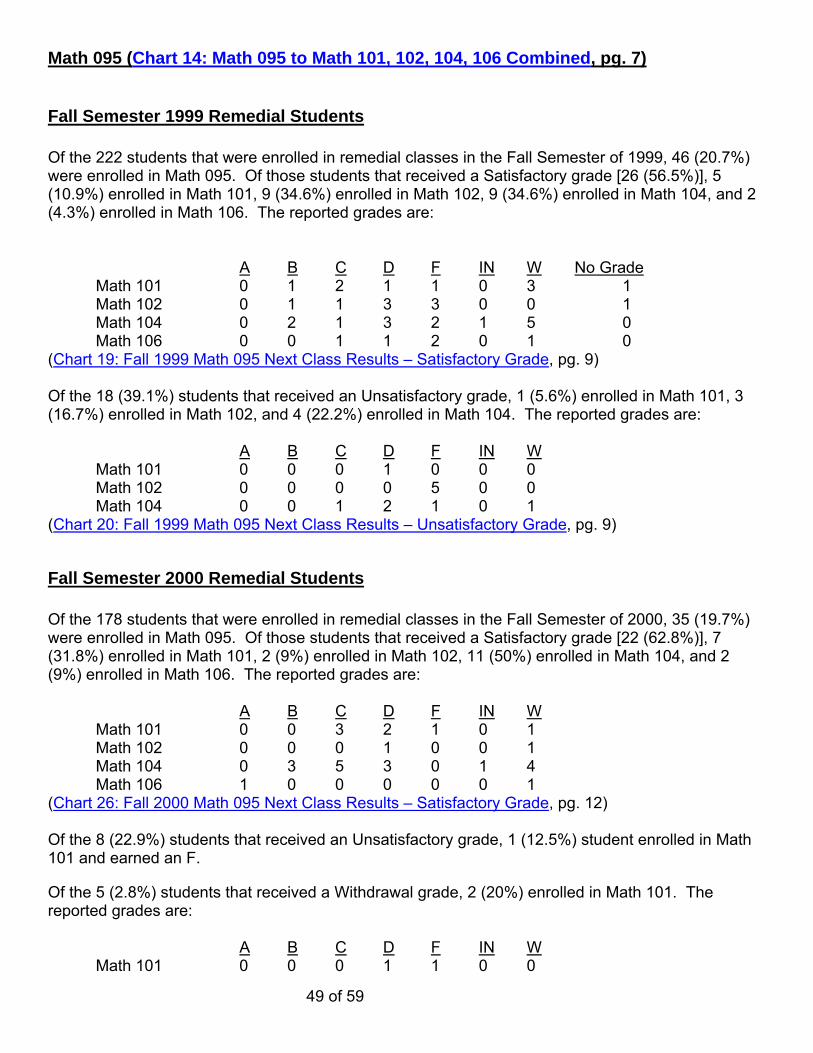
Math 095 (Chart 14: Math 095 to Math 101, 102, 104, 106 Combined, pg. 7)
Fall Semester 1999 Remedial Students Of the 222 students that were enrolled in remedial classes in the Fall Semester of 1999, 46 (20.7%) were enrolled in Math 095. Of those students that received a Satisfactory grade [26 (56.5%)], 5 (10.9%) enrolled in Math 101, 9 (34.6%) enrolled in Math 102, 9 (34.6%) enrolled in Math 104, and 2 (4.3%) enrolled in Math 106. The reported grades are: A B C D F IN W No Grade Math 101 0 1 2 1 1 0 3 1 Math 102 0 1 1 3 3 0 0 1 Math 104 0 2 1 3 2 1 5 0 Math 106 0 0 1 1 2 0 1 0 (Chart 19: Fall 1999 Math 095 Next Class Results – Satisfactory Grade, pg. 9) Of the 18 (39.1%) students that received an Unsatisfactory grade, 1 (5.6%) enrolled in Math 101, 3 (16.7%) enrolled in Math 102, and 4 (22.2%) enrolled in Math 104. The reported grades are: A B C D F IN W Math 101 0 0 0 1 0 0 0 Math 102 0 0 0 0 5 0 0 Math 104 0 0 1 2 1 0 1 (Chart 20: Fall 1999 Math 095 Next Class Results – Unsatisfactory Grade, pg. 9)
Fall Semester 2000 Remedial Students Of the 178 students that were enrolled in remedial classes in the Fall Semester of 2000, 35 (19.7%) were enrolled in Math 095. Of those students that received a Satisfactory grade [22 (62.8%)], 7 (31.8%) enrolled in Math 101, 2 (9%) enrolled in Math 102, 11 (50%) enrolled in Math 104, and 2 (9%) enrolled in Math 106. The reported grades are: A B C D F IN W
Math 101 0 0 3 2 1 0 1 Math 102 0 0 0 1 0 0 1
Math 104 0 3 5 3 0 1 4 Math 106 1 0 0 0 0 0 1 (Chart 26: Fall 2000 Math 095 Next Class Results – Satisfactory Grade, pg. 12) Of the 8 (22.9%) students that received an Unsatisfactory grade, 1 (12.5%) student enrolled in Math 101 and earned an F.
Of the 5 (2.8%) students that received a Withdrawal grade, 2 (20%) enrolled in Math 101. The reported grades are: A B C D F IN W Math 101 0 0 0 1 1 0 0
50 of 59
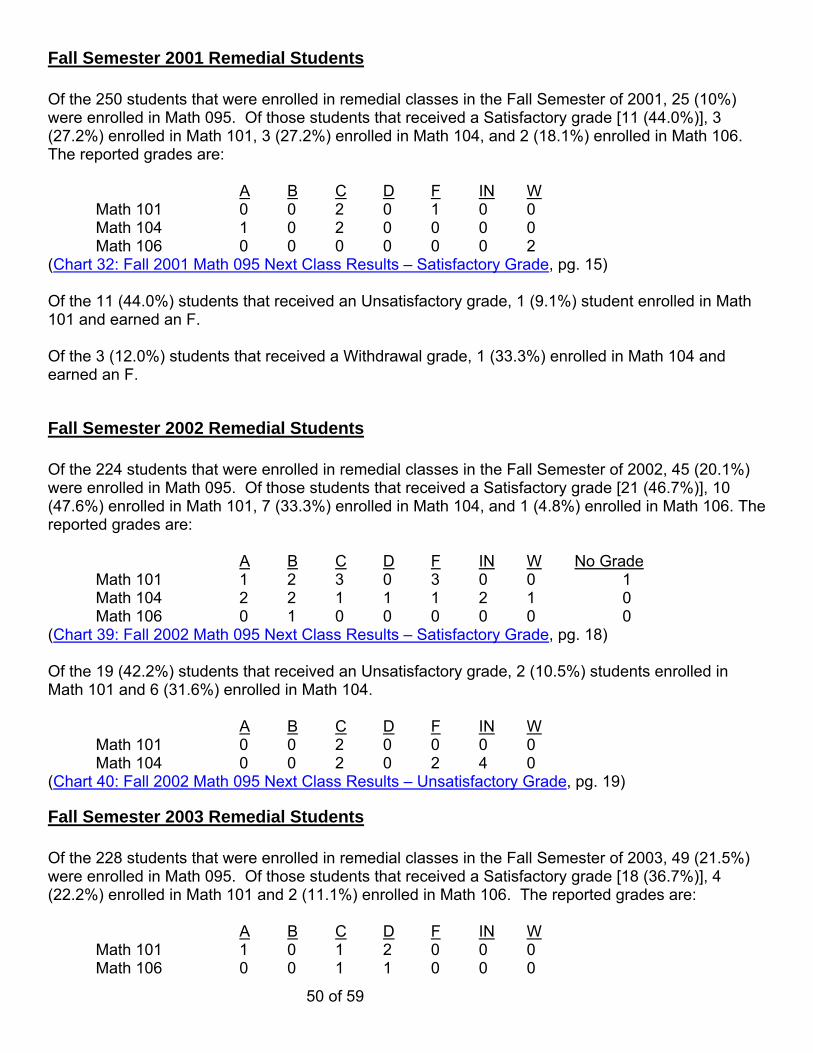
Fall Semester 2001 Remedial Students Of the 250 students that were enrolled in remedial classes in the Fall Semester of 2001, 25 (10%) were enrolled in Math 095. Of those students that received a Satisfactory grade [11 (44.0%)], 3 (27.2%) enrolled in Math 101, 3 (27.2%) enrolled in Math 104, and 2 (18.1%) enrolled in Math 106. The reported grades are: A B C D F IN W
Math 101 0 0 2 0 1 0 0 Math 104 1 0 2 0 0 0 0 Math 106 0 0 0 0 0 0 2 (Chart 32: Fall 2001 Math 095 Next Class Results – Satisfactory Grade, pg. 15) Of the 11 (44.0%) students that received an Unsatisfactory grade, 1 (9.1%) student enrolled in Math 101 and earned an F. Of the 3 (12.0%) students that received a Withdrawal grade, 1 (33.3%) enrolled in Math 104 and earned an F.
Fall Semester 2002 Remedial Students Of the 224 students that were enrolled in remedial classes in the Fall Semester of 2002, 45 (20.1%) were enrolled in Math 095. Of those students that received a Satisfactory grade [21 (46.7%)], 10 (47.6%) enrolled in Math 101, 7 (33.3%) enrolled in Math 104, and 1 (4.8%) enrolled in Math 106. The reported grades are: A B C D F IN W No Grade
Math 101 1 2 3 0 3 0 0 1 Math 104 2 2 1 1 1 2 1 0 Math 106 0 1 0 0 0 0 0 0 (Chart 39: Fall 2002 Math 095 Next Class Results – Satisfactory Grade, pg. 18) Of the 19 (42.2%) students that received an Unsatisfactory grade, 2 (10.5%) students enrolled in Math 101 and 6 (31.6%) enrolled in Math 104. A B C D F IN W Math 101 0 0 2 0 0 0 0 Math 104 0 0 2 0 2 4 0 (Chart 40: Fall 2002 Math 095 Next Class Results – Unsatisfactory Grade, pg. 19)
Fall Semester 2003 Remedial Students Of the 228 students that were enrolled in remedial classes in the Fall Semester of 2003, 49 (21.5%) were enrolled in Math 095. Of those students that received a Satisfactory grade [18 (36.7%)], 4 (22.2%) enrolled in Math 101 and 2 (11.1%) enrolled in Math 106. The reported grades are: A B C D F IN W Math 101 1 0 1 2 0 0 0 Math 106 0 0 1 1 0 0 0

51 of 59
(Chart 47: Fall 2003 Math 095 Next Class Results – Satisfactory Grade, pg. 22)
Fall Semester 2004 Remedial Students
Of the 282 students that were enrolled in remedial classes in the Fall Semester of 2004, 49 (17.4%) were enrolled in Math 095. Of those students that received a Satisfactory grade [25 (51%)], 4 (8.2%) enrolled in Math 104 and 3 (6.1%) enrolled in Math 106. The reported grades are:
A B C D F IN W Math 104 0 0 1 1 1 1 0 Math 106 0 0 1 1 0 0 1 (Chart 52: Fall 2004 Math 095 Next Class Results – Satisfactory Grade, pg. 24) Of the 16 (32.7%) students that received an Unsatisfactory grade, 1 (6.3%) enrolled in Math 104 twice and earned an Incomplete both times.
Fall Semester 2005 Remedial Students Of the 374 students that were enrolled in remedial classes in the Fall Semester of 2005, 112 (29.9%) were enrolled in Math 095. Of those students that received a Technical Failure [18 (16.1%)], 1 (5.6%) enrolled in Math 106 and earned an F.
Math 097 (Chart 15: Math 097 to Math 101, 102, 104, & 106 Combined, pg. 7) This class was offered beginning Fall Semester 2004. The course content was formerly taught as Math 099.
Fall Semester 2004 Remedial Students Of the 282 students that were enrolled in remedial classes in the Fall Semester of 2004, 74 (26.2%) were enrolled in Math 097. Of those students that received a Satisfactory grade [26 (35.1%)], 12 (46.2%) enrolled in Math 104, and 4 (15.4%) enrolled in Math 106. The reported grades are: A B C D F IN W Math 104 2 2 4 2 0 1 1 Math 106 0 0 2 0 1 0 1 (Chart 53: Fall 2004 Math 097 Next Class Results – Satisfactory Grade, pg. 25) Of the 39 (52.7%) students that received an Unsatisfactory grade, 2 (5.1%) enrolled in Math 104. The reported grades are: A B C D F IN W TF Math 104 0 0 0 1 1 0 0 1

52 of 59
Fall Semester 2005 Remedial Students Of the 374 students that were enrolled in remedial classes in the Fall Semester of 2005, 78 (20.9%) were enrolled in Math 097. Of those students that received a Satisfactory grade [29 (37.2%)], 1 (3.4%) enrolled in Math 104 and was not assigned a grade.
Math 099 (Chart 16: Math 099 to Math 101, 102, 104, & 106 Combined, pg. 8)
Fall Semester 1999 Remedial Students Of the 222 students that were enrolled in remedial classes in the Fall Semester of 1999, 117 (52.7%) were enrolled in Math 099. Of those students that received a Satisfactory grade [54 (46.2%)], 11 (20.3%) enrolled in Math 101, 23 (42.6%) enrolled in Math 102, 25 (46.3%) enrolled in Math 104, and 7 (12.9%) enrolled in Math 106. The reported grades are: A B C D F IN W
Math 101 1 2 4 3 3 0 1 Math 102 1 5 6 8 3 0 2
Math 104 0 9 12 2 6 0 2 Math 106 0 1 3 1 8 0 3 (Chart 21: Fall 1999 Math 099 Next Class Results – Satisfactory Grade, pg. 10) Of the 52 (44.4%) students that received an Unsatisfactory grade, 3 (5.8%) students enrolled in Math 101, 13 (25%) enrolled in Math 102, and 11 (21.2%) enrolled in Math 104. The reported grades are: A B C D F IN W Math 101 0 0 0 2 3 0 1
Math 102 0 1 3 7 5 0 0 Math 104 0 1 3 3 7 0 6 (Chart 22: Fall 1999 Math 099 Next Class Results – Unsatisfactory Grade, pg. 10) Of the 11 (9.4%) students that received a Withdrawal grade, 2 (18.2%) enrolled in Math 101, 3 (27.3) enrolled in Math 102, and 1 (9.1%) enrolled in Math 104. The reported grades are: A B C D F IN W Math 101 0 0 0 1 1 0 1
Math 102 0 0 2 1 0 0 0 Math 104 0 0 0 0 3 0 0 (Chart 23: Fall 1999 Math 099 Next Class Results – Withdrawal Grade, pg. 10)
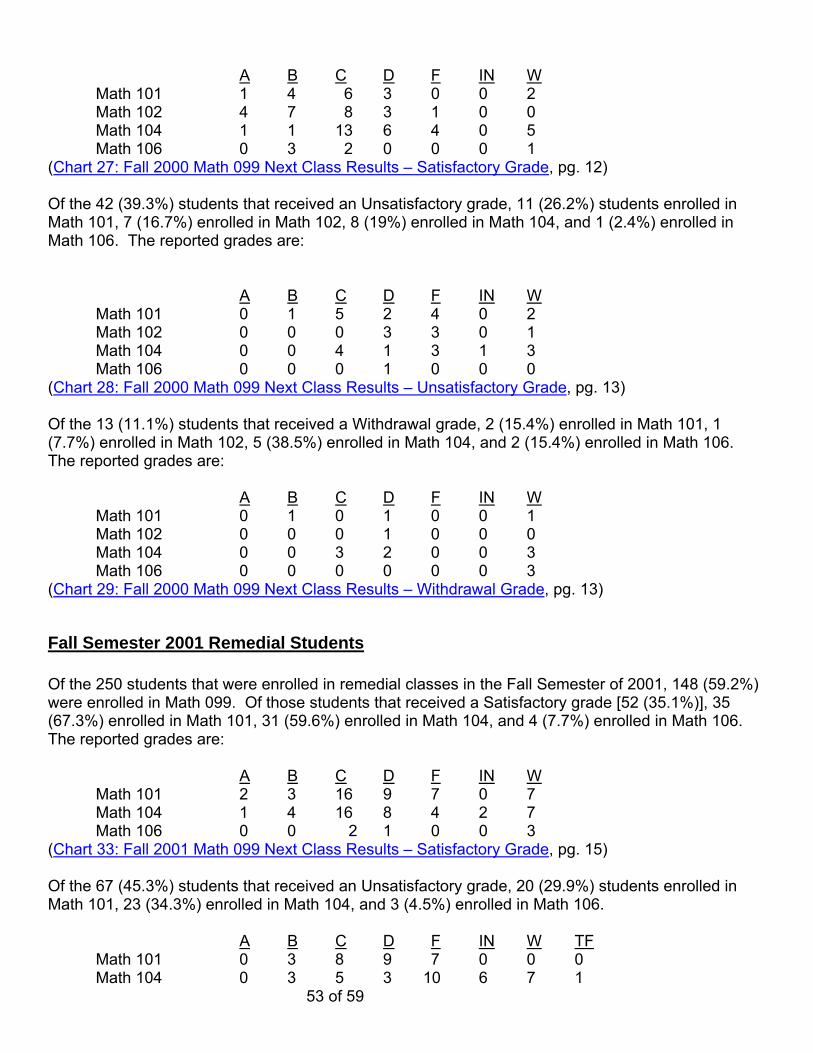
Fall Semester 2000 Remedial Students Of the 178 students that were enrolled in remedial classes in the Fall Semester of 2000, 107 (60.1%) were enrolled in Math 099. Of those students that received a Satisfactory grade [52 (48.6%)], 16 (30.8%) enrolled in Math 101, 23 (44.2%) enrolled in Math 102, 23 (44.2%) enrolled in Math 104, and 6 (11.5%) enrolled in Math 106. Some of the students attempted to take the courses more than once. The reported grades are:
53 of 59
A B C D F IN W
Math 101 1 4 6 3 0 0 2 Math 102 4 7 8 3 1 0 0
Math 104 1 1 13 6 4 0 5 Math 106 0 3 2 0 0 0 1 (Chart 27: Fall 2000 Math 099 Next Class Results – Satisfactory Grade, pg. 12) Of the 42 (39.3%) students that received an Unsatisfactory grade, 11 (26.2%) students enrolled in Math 101, 7 (16.7%) enrolled in Math 102, 8 (19%) enrolled in Math 104, and 1 (2.4%) enrolled in Math 106. The reported grades are: A B C D F IN W
Math 101 0 1 5 2 4 0 2 Math 102 0 0 0 3 3 0 1
Math 104 0 0 4 1 3 1 3 Math 106 0 0 0 1 0 0 0 (Chart 28: Fall 2000 Math 099 Next Class Results – Unsatisfactory Grade, pg. 13) Of the 13 (11.1%) students that received a Withdrawal grade, 2 (15.4%) enrolled in Math 101, 1 (7.7%) enrolled in Math 102, 5 (38.5%) enrolled in Math 104, and 2 (15.4%) enrolled in Math 106. The reported grades are: A B C D F IN W Math 101 0 1 0 1 0 0 1
Math 102 0 0 0 1 0 0 0 Math 104 0 0 3 2 0 0 3 Math 106 0 0 0 0 0 0 3 (Chart 29: Fall 2000 Math 099 Next Class Results – Withdrawal Grade, pg. 13)
Fall Semester 2001 Remedial Students Of the 250 students that were enrolled in remedial classes in the Fall Semester of 2001, 148 (59.2%) were enrolled in Math 099. Of those students that received a Satisfactory grade [52 (35.1%)], 35 (67.3%) enrolled in Math 101, 31 (59.6%) enrolled in Math 104, and 4 (7.7%) enrolled in Math 106. The reported grades are: A B C D F IN W
Math 101 2 3 16 9 7 0 7 Math 104 1 4 16 8 4 2 7 Math 106 0 0 2 1 0 0 3 (Chart 33: Fall 2001 Math 099 Next Class Results – Satisfactory Grade, pg. 15) Of the 67 (45.3%) students that received an Unsatisfactory grade, 20 (29.9%) students enrolled in Math 101, 23 (34.3%) enrolled in Math 104, and 3 (4.5%) enrolled in Math 106. A B C D F IN W TF Math 101 0 3 8 9 7 0 0 0 Math 104 0 3 5 3 10 6 7 1

54 of 59
Math 106 0 0 3 0 1 0 0 0 (Chart 34: Fall 2001 Math 099 Next Class Results – Unsatisfactory Grade, pg. 16) Of the 28 (11.1%) students that received a Withdrawal grade, 4 (14.3%) enrolled in Math 101, 3 (10.7%) enrolled in Math 104, and 1 (3.6%) enrolled in Math 106. The reported grades are: A B C D F IN W Math 101 0 0 1 1 3 0 1 Math 104 0 0 1 0 0 1 1 Math 106 1 0 0 0 0 0 0 (Chart 35: Fall 2001 Math 099 Next Class Results – Withdrawal Grade, pg. 16) One student (.4%) received no grade, and enrolled in and earned a C in both Math 101 and Math 104.
Fall Semester 2002 Remedial Students Of the 224 students that were enrolled in remedial classes in the Fall Semester of 2002, 132 (58.9%) were enrolled in Math 099. Of those students that received a Satisfactory grade [45 (34.1%)], 32 (71.1%) enrolled in Math 101, 28 (62.2%) enrolled in Math 104, and 11 (24.4%) enrolled in Math 106. The reported grades are: A B C D F IN W TF
Math 101 3 9 13 7 3 0 1 0 Math 104 2 8 4 5 11 4 6 2 Math 106 1 0 5 2 1 0 5 0 (Chart 41: Fall 2002 Math 099 Next Class Results – Satisfactory Grade, pg. 19) Of the 56 (42.4%) students that received an Unsatisfactory grade, 13 (23.2%) students enrolled in Math 101 and 13 (23.2%) enrolled in Math 104, 6 (10.7%) enrolled in Math 106. The reported grades are: A B C D F IN W
Math 101 0 5 4 3 3 0 2 Math 104 0 1 3 2 2 4 1 Math 106 0 0 2 1 3 0 4 (Chart 42: Fall 2002 Math 099 Next Class Results – Unsatisfactory Grade, pg. 20) Of the 31 (23.5%) students that received a Withdrawal grade, 4 (12.9%) enrolled in Math 101, 8 (25.8%) enrolled in Math 104, and 1 (3.2%) enrolled in Math 106. The reported grades are: A B C D F IN W Math 101 0 1 1 1 0 0 1 Math 104 0 1 1 0 0 6 1 Math 106 1 0 0 0 0 0 0 (Chart 43: Fall 2002 Math 099 Next Class Results – Withdrawal Grade, pg. 20)

55 of 59
Fall Semester 2003 Remedial Students Of the 228 students that were enrolled in remedial classes in the Fall Semester of 2003, 117 (51.3%) were enrolled in Math 099. Of those students that received a Satisfactory grade [48 (41.0%)], 36 (75.0%) enrolled in Math 101, 21 (43.8%) enrolled in Math 104, and 12 (25%) enrolled in Math 106. The reported grades are: A B C D F IN W TF
Math 101 4 9 12 5 3 1 3 0 Math 104 2 6 6 2 2 1 3 1 Math 106 1 2 3 1 2 0 5 0 (Chart 48: Fall 2003 Math 099 Next Class Results – Satisfactory Grade, pg. 22) Of the 53 (45.3%) students that received an Unsatisfactory grade, 8 (15.1%) students enrolled in Math 101 and 12 (22.6%) enrolled in Math 104. A B C D F IN W No Grade Math 101 0 0 2 2 2 0 1 1 Math 104 0 0 1 2 2 8 1 0 (Chart 49: Fall 2003 Math 099 Next Class Results – Unsatisfactory Grade, pg. 23) Of the 15 (12.8%) students that received a Withdrawal grade, 1 (6.7%) enrolled in Math 104 twice and withdrew both times.
Fall Semester 2004 Remedial Students Of the 282 students that were enrolled in remedial classes in the Fall Semester of 2004, 88 (31.2%) were enrolled in Math 099. Of those students that received a Satisfactory grade [33 (37.5%)], 19 (57.6%) enrolled in Math 104, and 8 (24.2%) enrolled in Math 106. The reported grades are: A B C D F IN W Math 104 1 10 3 1 0 3 1 Math 106 0 2 0 2 4 0 4 (Chart 54: Fall 2004 Math 099 Next Class Results – Satisfactory Grade, pg. 25) Of the 44 (50.0%) students that received an Unsatisfactory grade, 12 (27.3%) students enrolled in Math 104 and 3 (6.8%) enrolled in Math 106. The reported grades are: A B C D F IN W Math 104 0 1 2 1 4 4 2 Math 106 0 0 1 0 1 0 1 (Chart 55: Fall 2004 Math 099 Next Class Results – Unsatisfactory Grade, pg. 26) Of the 11 (12.5%) students that received an Withdrawal grade, 3 (27.3%) students enrolled in Math 104. A B C D F IN W Math 104 0 0 1 0 0 2 0 (Chart 56: Fall 2004 Math 099 Next Class Results – Withdrawal Grade, pg. 26)

56 of 59
Fall Semester 2005 Remedial Students Of the 374 students that were enrolled in remedial classes in the Fall Semester of 2005, 109 (29.1%) were enrolled in Math 099. Of those students that received a Satisfactory grade [66 (60.6%)], 27 (40.9%) enrolled in Math 104, and 10 (15.2%) enrolled in Math 106. The reported grades are: A B C D F IN W TF Math 104 5 5 6 3 3 0 1 3 Math 106 0 1 1 0 3 0 5 0 (Chart 59: Fall 2005 Math 099 Next Class Results – Satisfactory Grade, pg. 28) Of the 26 (23.9%) students that received an Unsatisfactory grade, 5 (19.2%) students enrolled in Math 104. The reported grades are: A B C D F IN W TF Math 104 0 0 0 1 2 1 0 1 (Chart 60: Fall 2005 Math 099 Next Class Results – Unsatisfactory Grade, pg. 28) Of the 6 (5.5%) students that received a Withdrawal grade, 1 (16.7%) enrolled in Math 104 and withdrew from the class. GRADUATION RATES – Entire Cohorts Fall Semesters 1999 through 2002 (Chart 4: Graduation Rates – Total Cohort, pg. 3) As noted at the beginning of this study, the cohorts used to generate these graduation rates contained all student classifications. Also, there may be duplicates between the cohorts. Thus these graduation rates should not be confused with the freshman graduation rates that are usually referred to when the graduation rate is discussed. Fall Semester 1999 Remedial Students Of the 222 students were enrolled in any remedial classes in the Fall Semester of 1999, 66 (29.7%) of them went on to earn degrees at Adams State College, distributed in the following way: Degree Awarded % of Total # of Degrees Awarded AA 1% 3 AS .9% 2 BA 22.5% 50 BS 6% 14 Two of the students that earned Associates degrees went on to earn BS degrees at Adams State College. One of the students earned 2 BA degrees. Four students that earned BA degrees at Adams State College went on to earn MA degrees in Counseling (3), and Secondary Education (1). Fall Semester 2000 Remedial Students Of the 178 students that were enrolled in any remedial classes in the Fall Semester of 2000, 55 (30.9%) went on to earn degrees at Adams State College, distributed in the following way: Degrees Awarded % of Total # of Degrees Awarded
57 of 59
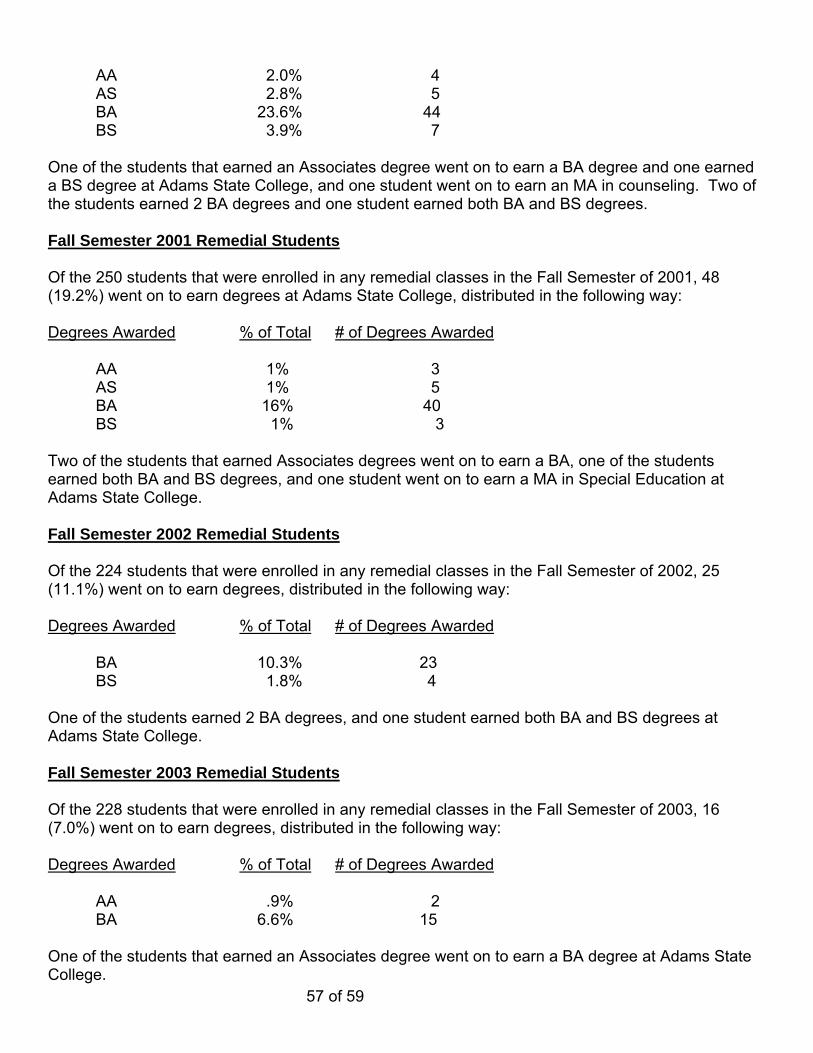
AA 2.0% 4 AS 2.8% 5 BA 23.6% 44 BS 3.9% 7 One of the students that earned an Associates degree went on to earn a BA degree and one earned a BS degree at Adams State College, and one student went on to earn an MA in counseling. Two of the students earned 2 BA degrees and one student earned both BA and BS degrees. Fall Semester 2001 Remedial Students Of the 250 students that were enrolled in any remedial classes in the Fall Semester of 2001, 48 (19.2%) went on to earn degrees at Adams State College, distributed in the following way: Degrees Awarded % of Total # of Degrees Awarded AA 1% 3 AS 1% 5 BA 16% 40 BS 1% 3 Two of the students that earned Associates degrees went on to earn a BA, one of the students earned both BA and BS degrees, and one student went on to earn a MA in Special Education at Adams State College. Fall Semester 2002 Remedial Students Of the 224 students that were enrolled in any remedial classes in the Fall Semester of 2002, 25 (11.1%) went on to earn degrees, distributed in the following way: Degrees Awarded % of Total # of Degrees Awarded BA 10.3% 23 BS 1.8% 4 One of the students earned 2 BA degrees, and one student earned both BA and BS degrees at Adams State College. Fall Semester 2003 Remedial Students Of the 228 students that were enrolled in any remedial classes in the Fall Semester of 2003, 16 (7.0%) went on to earn degrees, distributed in the following way: Degrees Awarded % of Total # of Degrees Awarded AA .9% 2 BA 6.6% 15 One of the students that earned an Associates degree went on to earn a BA degree at Adams State College.

58 of 59
Fall Semester 2004 Remedial Students Of the 282 students that were enrolled in any remedial classes in the Fall Semester of 2004, 4 (5.0%) went on to earn degrees, distributed in the following way: Degrees Awarded % of Total # of Degrees Awarded AS .4% 1 BA 1.1% 3 GRADUATION RATES – FRESHMEN ONLY Fall Semesters 1999 through 2001 (Chart 5: Graduation Rates – Freshman Only, pg. 3) The cohorts used to generate these graduation rates contained students that were classified as freshman during the term when they took remedial courses. Also, there may be duplicates between the cohorts. Thus these graduation rates should not be confused with the freshman graduation rates that are usually referred to when the graduation rate is discussed. Fall Semester 1999 Freshmen Remedial Students Of the 222 students that were enrolled in remedial courses in the Fall Semester of 1999, 190 (85.6%) were freshmen. Of those freshmen, 49 (25.8%) went on to earn degrees at Adams State College, distributed in the following way: Degrees Awarded % of Freshman Cohort # of Degrees Awarded AA 0.5% 1 AS 1.1% 2 BA 18.9% 36 BS 6.3% 12 One of the students that earned an Associate degree went on to earn a BS, and one student earned 2 BA degrees from Adams State College. Fall Semester 2000 Freshmen Remedial Students Of the 178 students that were enrolled in remedial courses in the Fall Semester of 2000, 146 (82.0%) were freshmen. Of those freshmen, 36 (24.7%) went on to earn degrees at Adams State College, distributed in the following way: Degrees Awarded % of Freshman Cohort # of Degrees Awarded AA 2.1% 3 AS 2.1% 3 BA 19.2% 28 BS 2.7% 4 One student that had earned an Associate degree went on to earn a BA, and one student earned both BA and BS degrees at Adams State College.
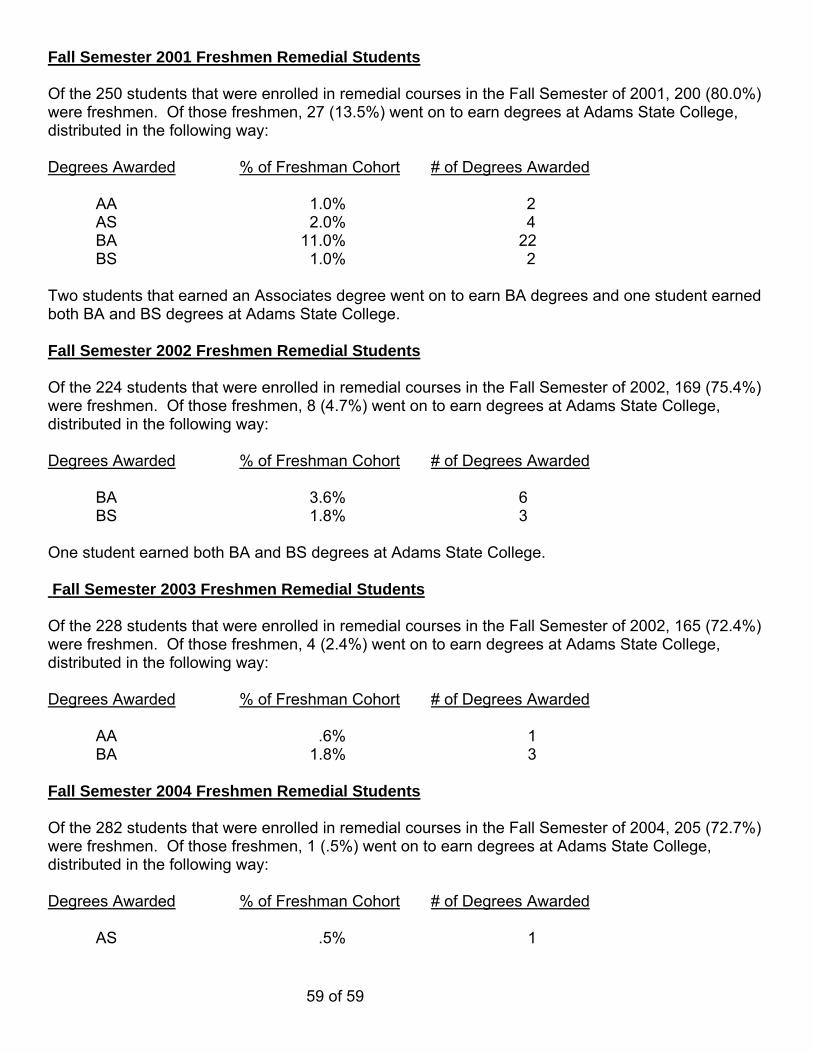
59 of 59
Fall Semester 2001 Freshmen Remedial Students Of the 250 students that were enrolled in remedial courses in the Fall Semester of 2001, 200 (80.0%) were freshmen. Of those freshmen, 27 (13.5%) went on to earn degrees at Adams State College, distributed in the following way: Degrees Awarded % of Freshman Cohort # of Degrees Awarded AA 1.0% 2 AS 2.0% 4 BA 11.0% 22 BS 1.0% 2 Two students that earned an Associates degree went on to earn BA degrees and one student earned both BA and BS degrees at Adams State College. Fall Semester 2002 Freshmen Remedial Students Of the 224 students that were enrolled in remedial courses in the Fall Semester of 2002, 169 (75.4%) were freshmen. Of those freshmen, 8 (4.7%) went on to earn degrees at Adams State College, distributed in the following way: Degrees Awarded % of Freshman Cohort # of Degrees Awarded BA 3.6% 6 BS 1.8% 3 One student earned both BA and BS degrees at Adams State College. Fall Semester 2003 Freshmen Remedial Students Of the 228 students that were enrolled in remedial courses in the Fall Semester of 2002, 165 (72.4%) were freshmen. Of those freshmen, 4 (2.4%) went on to earn degrees at Adams State College, distributed in the following way: Degrees Awarded % of Freshman Cohort # of Degrees Awarded AA .6% 1 BA 1.8% 3 Fall Semester 2004 Freshmen Remedial Students Of the 282 students that were enrolled in remedial courses in the Fall Semester of 2004, 205 (72.7%) were freshmen. Of those freshmen, 1 (.5%) went on to earn degrees at Adams State College, distributed in the following way: Degrees Awarded % of Freshman Cohort # of Degrees Awarded AS .5% 1