remgro limited annual report 2005€¦ · annual report 2005. ... well-known international and...
TRANSCRIPT

ANNUAL REPORT
2005�

INVESTMENT PHILOSOPHY 1Remgro’s investment philosophy
GROUP STRUCTURE 2Schematic presentation of the Group’s principal investments
GROUP PROFILE 3Summary of the Company’s business and its principal investments
FINANCIAL HIGHLIGHTS 6Headline earnings per share Dividends per share Intrinsic value per share Exchange ratesStock exchange pricesRemgro’s relative share performance
SHARE STATISTICS 7Information regarding transactions on the JSE Securities Exchange South Africa
CONSOLIDATED FINANCIAL STATISTICS
Seven-year consolidated income statements 8
Six-year consolidated balance sheets and cash flow statements 9
DIRECTORATE 10Executive and non-executive directors’ curricula vitae
GENERAL REPORT
Financial review 12Commentary on the Group’s results
Investment review 16Short review of the results of individual investments
INTRINSIC NET ASSET VALUE 28Composition of the intrinsic net asset value
CORPORATE GOVERNANCE 29
SUSTAINABILITY REPORT 36Stakeholder relationsGroup ethicsSafety and environmentHIV/Aids policyEmployeesEmployment equityBEE – black economic empowermentSocial investment
FINANCIAL REPORT 2005 44Statutory consolidated annual financial statements of the Group with contents
COMPANY INFORMATION 93
SHAREHOLDERS’ INFORMATION 94
NOTICE TO SHAREHOLDERS 98
EXPLANATORY NOTES TO THE NOTICE TO SHAREHOLDERS 102
FORM OF PROXY ATTACHED
CONTENTS
�
REMGRO LIMITEDINCORPORATED IN THE REPUBLIC OF SOUTH AFRICA
REGISTRATION NUMBER 1968/006415/06ISIN ZAE000026480 SHARE CODE REM
www.remgro.com

r e m g r o l i m i t e d1
INVESTMENT PHILOSOPHY
�Remgro invests in businesses that can deliver superior earnings
and dividend growth over the long term. This involves the
acquisition of meaningful interests in companies that have
sound management and have the ability to generate strong
cash returns and growth. Remgro forges strategic alliances on a
partnership basis and endeavours to add value where possible.
The purpose is to ensure excellent returns to shareholders by
way of dividend and capital growth.

r e m g r o l i m i t e d2r e m g r o l i m i t e d2
GROUP STRUCTUREAT 31 MARCH 2005
�
British American Tobacco 10%
associated companies and other subsidiary companies
M&I MANAGEMENT SERVICES
tobacco interests
Transvaal Sugar 100%Wispeco 100%Rainbow Chicken 63%Medi-Clinic Corporation 52%
Gencor 11%Trans Hex Group 34%Implats 5%
Unilever Bestfoods Robertsons 41%Nampak 14%Total South Africa 25%Dorbyl 43%Air Products SA 50%Distell Group 30%
FirstRand 10%RMB Holdings 23%Absa Group 9%Sage Group 22%
industrial interests
industrial interests
mining interests
financial services
Remgro Finance Corporation 100%Remgro Finance and Services 100%
corporate and other interests
Percentages represent the direct interests and have been rounded off.Annexures A and B provide further information of subsidiary companies and investments.
M&I Management Services (Proprietary) Limited (M&I) renders management and support services to Remgro. Remgrodoes not hold any interest in M&I. The shareholders of M&I are employees of M&I who own all the issued ordinary
shares. Rembrandt Trust (Proprietary) Limited owns all the A ordinary shares of M&I. The A ordinary shares only have votingrights but have no rights to the income or assets of M&I.
REMGRO LIMITED

GROUP PROFILE
�Remgro Limited is a South African investment holdingcompany established with effect from 1 April 2000, after therestructuring of the former Rembrandt Group Limited.
The Group’s interests consist mainly of investments in tobaccoproducts, banking and financial services, printing andpackaging, building and motor components, life assurance,medical services, mining, petroleum products, food, wine andspirits and various other trade mark products.
The Company’s activities are concentrated mainly on themanagement of investments and the provision of support ratherthan on being involved in the day-to-day management ofbusiness units of investees.
Subsidiaries not wholly owned are mainly listed companieswith independent boards of directors on which this Companyhas non-executive representation. Non-subsidiary investmentscomprise both listed and unlisted companies not controlled bythis Company and which are mostly associated companies due tosignificant influence and Board representation.
r e m g r o l i m i t e d3
r e m g r o l i m i t e d4r e m g r o l i m i t e d4
�
GROUP PROFILEINFORMATION ON THE COMPANIES IN WHICH INVESTMENTS ARE HELD
�
Effective interest: 10%
• Listed on the London Stock Exchange.• Chief Executive Officer: P Adams • Produces high quality tobacco products for a diverse, worldwide market. The company is involved from the
planting and growing of tobacco crops to the marketing of the final products.• Interest is represented by a one-third shareholding in the ordinary shares and a 100% shareholding in the
participating securities of R&R Holdings SA (R&R). The other two-thirds shareholding in R&R are held byCompagnie Financière Richemont SA.
• Market capitalisation at 31 March 2005: £19 935 million • Website: www.bat.com
Effective interest: 30%
• Listed on the JSE Securities Exchange South Africa.• Chief Executive Officer: J J Scannell • Distell produces and markets fine wines, spirits and flavoured alcoholic beverages, with an increasing
international profile, in South Africa.• Interest is represented by a 50% shareholding in Remgro-KWV Investments Limited which held a 60% share in
Distell at 31 March 2005.• Market capitalisation at 31 March 2005: R4 726 million• Website: www.distell.co.za
Effective interest: 10%(excluding indirect interest held
through RMB Holdings)
• Listed on the JSE Securities Exchange South Africa.• Chief Executive Officer: L L Dippenaar• The FirstRand group of companies is involved in financial service activities, including retail, corporate,
investment and merchant banking, short-term insurance, life insurance, employee benefits, health insuranceand asset management.
• The banking and insurance activities are represented by the wholly-owned subsidiaries FirstRand BankHoldings Limited and Momentum Group Limited respectively and the health activities in the 66%-ownedDiscovery Holdings Limited.
• Market capitalisation at 31 March 2005: R72 999 million• Website: www.firstrand.co.za
Effective interest: 23%
Effective interest: 22%
• Listed on the JSE Securities Exchange South Africa.• Chief Executive Officer: P Cooper• RMBH’s interests are:
– FirstRand Limited (32%)– RMB Structured Insurance Limited (100%)– OUTsurance Limited (66%)– Glenrand M.I.B Limited (17%)
• Market capitalisation at 31 March 2005: R25 455 million• Website: www.rmbh.co.za
• Listed on the JSE Securities Exchange South Africa.• Chief Executive Officer: G Griffin (resigned on 31 May 2005)• Sage is a South African life assurance, investment and financial services organisation.• Market capitalisation at 31 March 2005: R679 million• Website: www.sage.co.za
Effective interest: 9%
• Listed on the JSE Securities Exchange South Africa.• Chief Executive Officer: S F Booysen • Absa is the investment holding company of a number of banks and insurance companies. The company gives
direction to the planning, controlling and co-ordination of the activities of its group companies.• Market capitalisation at 31 March 2005: R49 391 million• Website: www.absa.co.za
Effective interest: 34%
• Listed on the JSE Securities Exchange South Africa.• Chief Executive Officer: L Delport • Exploration for, and mining and marketing of, land and marine diamonds.• Market capitalisation at 31 March 2005: R1 559 million• Website: www.transhex.co.za
Effective interest: 41%
• Unlisted• Chief Executive Officers: K T Kruythoff (South Africa); M Keren (Israel)• The UBR venture covers the territories of Southern Africa and Israel, and manufactures and markets an
extensive range of food products, while enjoying market leadership in most of its major categories.Well-known international and local brands include Robertsons herbs and spices, Knorr soups, Aromat seasonings,Rama and Flora margarine, Lipton and Joko tea, and Mrs Ball’s culinary products.
• Website: www.unilever.co.za

GROUP PROFILE
�
Effective interest: 14%
• Listed on the JSE Securities Exchange South Africa.• Chief Executive Officer: G E Bortolan• Nampak is Africa’s largest and most diversified packaging manufacturer, with operations in the United Kingdom
and Europe. It produces a wide variety of packaging products, from metals, paper and plastic to glass, is the largestmanufacturer and distributor of tissue paper products, and holds a substantial share of the paper merchanting market.
• Market capitalisation at 31 March 2005: R10 193 million• Website: www.nampak.com
Effective interest: 25%
• Unlisted• Chief Executive Officer: P W Jordan • Subsidiary of Total (France). Total South Africa’s business is the refining and marketing of petroleum and
petroleum products in South Africa and it has a market share of 15%. It distributes to neighbouring NBLScountries. It has a 36% interest in National Petroleum Refiners of S.A. (Pty) Limited (Natref ).
• Website: www.total.co.za
Effective interest: 43%
• Listed on the JSE Securities Exchange South Africa.• Chief Executive Officer: W W Cooper• Dorbyl is an industrial group in the engineering industry, with investments in South Africa and the USA.
Major industries served by Dorbyl include automotive and roofing.• Market capitalisation at 31 March 2005: R995 million• Website: www.dorbyl.co.za
Effective interest: 50%
• Unlisted• Chief Executive Officer: A G Cooper • Air Products produces oxygen, hydrogen and nitrogen for sale in gaseous form by pipeline under long-term
contracts to major industrial users, as well as the distribution of industrial gases and chemicals for sale,together with ancillary equipment, to the merchant market.
• The other 50% of the ordinary shares is held by Air Products and Chemicals Incorporated, a USA company.• Website: www.airproducts.co.za
Effective interest: 100%
• Unlisted• Chief Executive Officer: H Snyman • TSB is involved in cane growing and the production, transport and marketing of sugar and animal feed.
Citrus is also grown on the company’s estates.• Website: www.tsb.co.za
Effective interest: 100%
• Unlisted• Chief Executive Officer: R F Röhrs • Wispeco’s main business is the extrusion of aluminium profiles used mainly in the building, engineering and
durable goods sectors.• Website: www.wispeco.co.za
Effective interest: 63%
• Listed on the JSE Securities Exchange South Africa.• Chief Executive Officer: M Dally • Rainbow is the holding company of one principal operating subsidiary which is a vertically integrated chicken
producer.• Market capitalisation at 31 March 2005: R1 790 million• Website: www.rainbowchicken.co.za
Effective interest: 52%
• Listed on the JSE Securities Exchange South Africa.• Chief Executive Officer: L J Alberts• Medi-Clinic’s business consists of the provision of comprehensive, high-quality hospital services on a cost-
effective basis.• Market capitalisation at 31 March 2005: R5 356 million• Website: www.mediclinic.co.za
Effective interest: 5%
• Listed on the JSE Securities Exchange South Africa.• Chief Executive Officer: K Rumble • Implats is a fully integrated mining and metallurgical organisation, which markets refined platinum group
metals for global markets, and is one of the world’s largest platinum recyclers.• Market capitalisation at 31 March 2005: R35 027 million• Website: www.implats.co.za
Remgro financecorporation limited and
remgro finance andservices limited
Effective interest: 100%
• Both companies are unlisted.• Responsible for Remgro’s central treasury function.
r e m g r o l i m i t e d5

r e m g r o l i m i t e d6r e m g r o l i m i t e d6
FINANCIAL HIGHLIGHTS
�
HEADLINE EARNINGS R4 982m R4 687m 6.3
BASIC EARNINGS – NET PROFIT FOR THE YEAR R8 807m R3 605m 144.3
HEADLINE EARNINGS PER SHARE 1 001.8c 931.3c 7.6
BASIC EARNINGS PER SHARE 1 771.0c 716.3c 147.2
Dividends per share– Ordinary 314.00c 285.00c– Special * 200.00c
Net asset value per share(attributable to own members)– at book value R71.77 R59.26 21.1
Tobacco interests R27.54 R17.37 58.5Other investments R44.23 R41.89 5.6
– at intrinsic value R119.97 R100.36 19.5
Tobacco interests R53.94 R46.91 15.0Other investments R66.03 R53.45 23.5
Exchange ratesPound sterling/SA rand exchange rate – weighted average
– for the financial year 11.5342 12.1025– at 31 March 11.7520 11.5950
Stock exchange pricesClosing price per share at 31 March R93.80 R72.00Change in share price for the year 30% 40%
The comparative figures for the year ended 31 March 2004 have been restated. Please refer to the paragraph headed “Prior yearadjustments” in the Report of the Board of Directors.
* Refer to the paragraph headed “Cash flow and utilisation” in the Report of the Board of Directors on page 49.
2005 2004 % change
remgro’s relative share performance (based to 100)
406080
100120140160180200220240260
09/2
000
01/2
001
05/2
001
09/2
001
01/2
002
05/2
002
09/2
002
01/2
003
05/2
003
09/2
003
01/2
004
05/2
004
09/2
004
01/2
005
05/2
005
Remgro ALSI FINDI

r e m g r o l i m i t e d7
SHARE STATISTICS
�
JSE Securities Exchange South Africa 2005 2004 2003 2002
Weighted number of Remgro ordinary shares in issue (’000) 461 786 467 774 481 011 486 494
Market capitalisation at 31 March (R million)– Ordinary shares only 45 633 35 028 25 030 30 649
Price (cents per share)– 31 March 9 380 7 200 5 145 6 300– Highest 9 701 7 495 7 399 6 650– Lowest 6 980 5 150 5 145 4 780
Number of shares traded (’000) 187 389 187 231 216 082 203 231
Value of shares traded (R million) 15 553 11 785 14 105 12 101
Shares traded/weighted number of ordinary shares (%) 40.6 40.0 44.9 41.8
Number of transactions 64 707 54 055 58 873 67 712
remgro share price
Cents per share10 000
6 500
7 000
7 500
8 000
8 500
9 000
9 500
High/Low Closing price
04/2
004
05/2
004
06/2
004
07/2
004
08/2
004
09/2
004
10/2
004
11/2
004
12/2
004
01/2
005
02/2
005
03/2
005

r e m g r o l i m i t e d8
SEVEN-YEAR CONSOLIDATED INCOME STATEMENTS
Revenue 12 823 11 763 11 212 8 441 7 358 5 738 10 381
Profit before taking into account the following 1 375 1 292 1 209 734 504 412 404Exceptional items and other
non-operating income/(expenses) 2 215 (132) 1 055 (158) 1 523 202 (25)
Consolidated profit before tax 3 590 1 160 2 264 576 2 027 614 379Taxation (400) (397) (394) (173) (109) (100) (114)
Consolidated profit after tax 3 190 763 1 870 403 1 918 514 265Share in after-tax profit of associated
companies 6 026 3 177 7 262 3 255 4 765 1 733 2 178
Profit before taking into account the following 4 495 4 164 4 421 3 881 2 901 2 307Exceptional items and other
non-operating income/(expenses) 1 531 (987) 2 841 (626) 1 864 (574)
Group profit after tax 9 216 3 940 9 132 3 658 6 683 2 247 2 443Minority interest (409) (335) (446) (151) (109) (76) (107)
Net profit for the year 8 807 3 605 8 686 3 507 6 574 2 171 2 336
Headline earnings 4 982 4 687 4 856 4 252 3 195 2 508 2 339
Headline earnings per share (cents) 1 001.8 931.3 940.1 814.5 612.1 480.5 448.1Basic earnings per share (cents) 1 771.0 716.3 1 681.6 671.8 1 259.4 415.9 447.5Dividends per share (cents)– Ordinary 314.00 285.00 248.00 206.00 162.00 120.00 104.35 – Special * 200.00 100.00 100.00
The pro forma comparative figures in the income statements above represent the figures of Rembrandt Group Limited afteradjustments have been made for investments apportioned to VenFin Limited in terms of the restructuring in 2000, and are basedon the audited annual financial statements of Rembrandt Group Limited.
The 2000 to 2005 figures in respect of exceptional items are not comparable with those of the prior years. Since 2000, exceptionalitems have been disclosed before taxation while previously it was reported after taxation.
* Refer to the paragraph headed “Cash flow and utilisation” in the Report of the Board of Directors on page 49.
2005 2004 2003 2002 2001 2000 1999R million Pro forma Pro forma
2001
612
0
200
400
600
800
1 000
1 200
0.0
0.5
1.0
1.5
2.0
2.5
3.0
3.5
4.0
4.5
271
815
381
940
543
931
463
1 002
6081.91.6
2.21.81.7
3.8 4.0 3.8
3.23.3
2002 2003 2004 2005
Cents Times
HEPS: Headline earnings per shareCEPS: Cash earnings per share
HEPS CEPS Dividend cover Cash cover
dividend cover
�

r e m g r o l i m i t e d9
SIX-YEARCONSOLIDATED BALANCE SHEETS AND CASH FLOW STATEMENTS
BALANCE SHEETSProperty, plant and equipment 3 982 3 515 3 253 2 083 2 027 2 259Investments – Associated companies 28 415 22 737 19 844 16 984 13 164 10 660Other non-current assets 2 664 2 106 3 607 2 831 2 968 241Current assets 4 765 5 372 4 079 4 435 3 395 2 283
Total assets 39 826 33 730 30 783 26 333 21 554 15 443
Total shareholders’ equity 36 971 31 411 28 981 24 991 20 177 13 365Non-current liabilities 883 685 472 244 310 296Current liabilities 1 972 1 634 1 330 1 098 1 067 1 782
Total equity and liabilities 39 826 33 730 30 783 26 333 21 554 15 443
Net asset value per share (Rand)(attributable to own members)– at book value 71.77 59.26 54.19 46.10 37.14 24.05– at intrinsic value 119.97 100.36 77.23 89.50 64.32 51.43
CASH FLOW STATEMENTSCash generated from operations 1 545 1 383 1 055 618 401Cash flow generated from returns on investments 2 672 2 013 2 542 1 697 1 196Taxation paid (546) (363) (220) (111) (116)
Cash available from operating activities 3 671 3 033 3 377 2 204 1 481Dividends paid (2 642) (1 438) (1 765) (968) (303)
Cash inflow/(outflow) from operating activities 1 029 1 595 1 612 1 236 1 178Net investing activities (2 184) (528) (1 943) (201) 356Net financing activities 9 62 (82) (158) (631)
Net increase/(decrease) in cash and cash equivalents (1 146) 1 129 (413) 877 903
The pro forma comparative figures in the balance sheets above represent the figures of Rembrandt Group Limited after adjustmentshave been made for investments apportioned to VenFin Limited in terms of the restructuring in 2000, and are based on the auditedannual financial statements of Rembrandt Group Limited. Pro forma figures for the cash flow statement for 2000 are not available.
2005 2004 2003 2002 2001 2000R million Pro forma
cash movement at the holding company(“cash at the centre”) (r million)
800
1 800
2 800
3 800
4 800
-1 200
-200(1 056)
(1 272)
BATdividend
Otherdividends
Otherincome
Ordinarydividends
paid
Specialdividends
paid
Cashmovement
(1) Investments realised consist of the consideration received on the partial redemption of debentures by R&R (R2 100 million) and proceeds from disposal of the Henkel Investment (R80 million).(2) Investments made consist of the acquisition of participation securities in R&R (R2 098 million) and net loans granted (R84 million).
Investmentsrealised
Investmentsmade
Sharebuy-backs
(1 011)
(1 498)
(2 182) (2)2 180 (1)
1591 199
1 369
�

r e m g r o l i m i t e d10r e m g r o l i m i t e d10
DIRECTORATE
�Non-executive directors
J P Rupert (55) Chairman Directorships: Executive Chairman ofCompagnie Financière Richemont SAand Richemont Société Anonyme andNon-executive Chairman of VenFinLimited and Chairman of BusinessPartners Limited.
E de la H Hertzog (55) Deputy Chairman (since 22 June 2005)Directorships: Chairman of Medi-ClinicCorporation Limited. Serves on the Boardof Distell Group Limited, Total SouthAfrica (Pty) Limited and Trans Hex GroupLimited.
P E Beyers (55) Directorships: Richemont SociétéAnonyme, British American Tobacco Plc,VenFin Limited, Distell Group Limited,Unilever Bestfoods Robertsons (Holdings)Limited L.L.C.
J W Dreyer (54) Directorships: RMB Holdings Limited andVenFin Limited.
Independent non-executive directors
G D de Jager (54) Directorships: Anglo Suisse InvestmentHoldings Limited, Lenco HoldingsLimited and Sharp Interpack Limited.
P K Harris (55) Directorships: Chief Executive Officer ofFirstRand Bank Limited and director ofRMB Holdings Limited and MomentumGroup Limited.
E Molobi (60) Directorship: Chairman of Kagiso TrustInvestment Company (Pty) Limited.
J F Mouton (58) Directorships: Chairman of PSG GroupLimited and Capitec Bank HoldingsLimited and director of SteinhoffInternational Holdings Limited.
D Prins (57)Directorship: Distell Group Limited.
F Robertson (50) Directorships: Executive Deputy Chairmanof Brimstone Investment CorporationLimited and other companies in theBrimstone group, and Chairman of Lionof Africa Insurance Company Limitedand Lion of Africa Life AssuranceCompany Limited.

r e m g r o l i m i t e d11r e m g r o l i m i t e d11
Executive directors
M H Visser (51)Chief Executive OfficerQualification: BComm (Hons), CA(SA)Years of service with the Group: 25Directorships: British American Tobacco Plc,Distell Group Limited, Nampak Limited,Unilever Bestfoods Robertsons (Holdings)Limited L.L.C. and Chairman ofRainbow Chicken Limited.
W E Bührmann (50)InvestmentsQualification: BComm, CA(SA)Years of service with the Group: 18Directorships: Air Products SA (Pty) Limited,Dorbyl Limited, Gencor Limited,Medi-Clinic Corporation Limited,Rainbow Chicken Limited, TransvaalSugar Limited, Trans Hex Group Limitedand Wispeco Holdings Limited.
D M Falck (59)Group FinanceQualification: CA(SA)Years of service with the Group: 33Directorships: RMB Holdings Limited,FirstRand Limited, FirstRand Bank Limitedand Total South Africa (Pty) Limited.
J A Preller (Mrs) (55) Corporate AffairsQualification: BEconYears of service with the Group: 33
T van Wyk (57)InvestmentsQualification: BComm, LLB, LLM,H Dip TaxYears of service with the Group: 15Directorships: Absa Group Limited,Air Products SA (Pty) Limited,Dorbyl Limited, Sage Group Limited,Chairman of Wispeco Holdings Limitedand Deputy Chairman of BusinessPartners Limited.
Members of committees
Executive CommitteeM H Visser (Chairman)W E BührmannD M FalckJ A PrellerT van Wyk
Audit and Risk CommitteeD Prins (Chairman)D M FalckJ F MoutonF Robertson
Remuneration and Nomination CommitteeJ P Rupert (Chairman)P K HarrisJ F MoutonF Robertson
DIRECTORATE AND MEMBERS OF COMMITTEES
�

r e m g r o l i m i t e d12
GENERAL REPORTFINANCIAL REVIEW
The domestic economic performance has been characterised by a strong momentum in spending by households, the
government and the private business sector, particularly towards the end of 2004. In all three sectors the acceleration in
spending is built on sound foundations, with renewed employment growth in the formal sector of the economy as an important
driver of income growth. Both business and consumer confidence reached historic high levels recently.
The services sectors and other sectors not producing tradable goods (e.g. retail and construction), are benefiting more from thekeen demand conditions and have performed strongly. On the other hand, growth in the sectors producing tradable goods (e.g.agriculture, mining and manufacturing) has been constrained by the sustained strength of the rand.
Domestically inflation has consistently been contained within the 3% – 6% target range for the past 18 months and interest ratescontinued to drift lower during the early part of 2005. Relative rand strength was also sustained over this period, and contributedto a widening deficit on the current account of the balance of payments. It is expected that the rand will adjust closer to anequilibrium value over the short term as it probably reached overvalued levels early this year. This should assist in a more balanceddomestic economic growth.
The global economy slowed down during the second half of 2004 and the early part of this year, mainly under the impact of highercrude oil prices and disappointing economic growth performances in Japan and the Euro zone. The macro-economic imbalancesin the USA economy, together with China, the engine of world economic growth, remain a cause for concern. Internationalfinancial markets are uncertain how the US imbalances will correct itself over the medium term.
SEGMENTAL ANALYSIS
2005 % 2004R million change R million
Tobacco interests 2 029 (3.4) 2 100Financial services 1 695 21.6 1 394Industrial interests 1 125 13.1 995Mining interests 101 (41.3) 172Corporate finance and other interests 32 23.1 26
4 982 6.3 4 687
contribution to headline earnings
Tobacco interestsFinancial servicesIndustrial interestsMining interestsCorporate finance
and other interests
2005%
413422
2
1100
2004%
4530213
1100
�
r e m g r o l i m i t e d13
GENERAL REPORT: FINANCIAL REVIEW
It should be noted that Remgro changed its segmental analysis from 1 April 2004. Distell Group Limited (Distell) and Medi-ClinicCorporation Limited (Medi-Clinic) are classified as “Industrial interests”, while previously accounted for as “Trade mark interests”and “Corporate finance and other interests” respectively. Since that date, Caxton and CTP Publishers and Printers Limited,previously accounted for under “Corporate finance and other interests”, is also included in “Industrial interests”.
After the restatement, R&R Holdings SA, Luxembourg (R&R), which represents Remgro’s tobacco interests, is the onlyremaining interest under “Trade mark interests”. The description “Trade mark interests” has therefore been changed to “Tobaccointerests”. The comparative figures have been restated accordingly.
HEADLINE EARNINGSHeadline earnings for the year to 31 March 2005 increased by 6.3%, from R4 687 million to R4 982 million. However, headlineearnings per share increased by 7.6% from 931.3 cents to 1 001.8 cents due to the favourable impact of the share repurchaseprogramme.
Currency movements continued to impact the Group’s earnings. Due to a stronger but more stable rand, the unfavourablecurrency impact on translation of R&R’s contribution to headline earnings declined from R520 million in 2004 to R100 millionfor the year under review, as set out in the table below.
Financial year: 2005 2004Average exchange rate (£/R) 11.5342 12.1025Closing exchange rate at year-end (£/R) 11.7520 11.5950R&R’s contribution (£m) 176 174R&R’s contribution (Rm) 2 029 2 100Unfavourable currency impact (Rm) (100) (520)
The contribution of the financial services interests to Remgro’s headline earnings increased by 21.6% from R1 394 million in 2004 to R1 695 million. FirstRand and RMBH’s combined contribution to headline earnings amounted to R1 172 million (2004: R976 million), while Absa increased its contribution by 23.4% to R517 million (2004: R419 million).
The contribution of the industrial interests increased by 13.1%, mainly as a result of strong performances by Total South Africa,Distell and Medi-Clinic. This was, however, offset by lower results from Rainbow, Nampak, UBR and Transvaal Sugar.
Mining interest’s contribution to headline earnings decreased by 41.3% to R101 million. Trans Hex reported lower results and itscontribution to headline earnings decreased to R29 million (2004: R79 million).
Analysis of comparable headline earnings (cents per share)
– Excluding contributions by R&R 2005 2004Headline earnings as reported 1 001.8 931.3R&R’s contribution (408.1) (417.3)Comparable headline earnings after exclusion of the above (+15.5%) 593.7 514.0
�
r e m g r o l i m i t e d14
GENERAL REPORTFINANCIAL REVIEW
BASIC EARNINGSBasic earnings per share increased by 147.2% to 1 771.0 cents. Basic earnings reflects the net earnings after impairment andgoodwill amortisation and after exceptional items. This increase was mainly due to the surplus realised on the redemption by R&Rof debentures (refer to the BAT paragraph on page 16) and Remgro’s share in the favourable exceptional items of associatedcompanies. The latter mainly comprises the profit realised by BAT following the merger of Brown & Williamson’s US businesseswith R.J. Reynolds to form a new holding company, Reynolds American Inc., and from the sale of Lane Limited to ReynoldsAmerican.
CASH EARNINGSAttributable cash earnings (excluding the Group’s share of net profits retained by associated companies), before exceptional itemsand impairment and amortisation of goodwill, increased by 29.8% from R2 329 million to R3 023 million, mainly as a result ofan increase in dividends received from associated companies. The latter amounted to R2 372 million compared to R1 690 million in 2004. This increase was mainly due to higher dividends from R&R, RMBH, FirstRand and UBR.
REPURCHASE OF SHARESDuring the year under review, a wholly-owned subsidiary company of Remgro acquired a further 14 079 239 ordinary Remgroshares (2.9% of the ordinary shares) at an average price of R87.69 for a total amount of R1 234.6 million. Together with thoseshares acquired in previous financial years, a total of 30 521 841 (6.3%) are held as treasury shares.
During the year under review, The Remgro Share Trust bought 660 018 (2004: 711 000) ordinary Remgro shares at an average price of R90.93 (2004: R65.43) for a total amount of R60.0 million (2004: R46.5 million). During the year under review514 946 shares were delivered to participants against payment thereof.
DIVIDENDSOrdinary dividends of 314 cents per share were declared for the year, compared to 285 cents the previous year. This represents anincrease of 10.2%. The dividend is covered 3.2 times by headline earnings and 1.9 times by cash earnings, against 3.3 times and1.6 times respectively the previous year.
It is the Board’s intention to also declare a special dividend of 600 cents per share shortly after, and subject to, the Absa transactionbeing declared unconditional. The salient dates of the special dividend will then be announced on SENS and distributed toshareholders.
INTRINSIC VALUEThe intrinsic net asset value of the Group includes valuations of all investments, incorporating subsidiary and associatedcompanies, either at listed market value or, in the case of unlisted investments, at directors’ valuation. The net assets of wholly-owned non-investment subsidiary companies, consisting mainly of monetary items, are included at book value.
The intrinsic net asset value at the end of March 2005 amounted to R119.97 per share. A schedule setting out the calculation ofthe intrinsic net asset value per share on 31 March 2005 and 2004 is included at the end of the investment review.
�

r e m g r o l i m i t e d15
GENERAL REPORT: FINANCIAL REVIEW
The cash at the centre differs from the cash in the balance sheet. The latter comprises the following:
2005 2004R million R million
Per balance sheet 2 372 3 446Less: Cash from other operating subsidiaries (1 278) (1 296)Cash at the centre 1 094 2 150
– Local 782 2 147– Offshore 312 3
The table below reflects a comparison of the relative performance of the Remgro intrinsic net asset value per share in relation tocertain selected JSE indices.
No account has been taken of dividends paid by Remgro.
2005 2004 2003 2002 2001Intrinsic net asset value – Rand per share 119.97 100.36 77.23 89.50 64.32JSE – All share index 13 299 10 693 7 680 11 015 8 094
– Fin & Ind 30 index 13 477 9 953 6 682 9 713 9 464– Financial 15 index 5 258 3 782 2 744 3 415 3 758
1 year to 4 years to31 March 2005 31 March 2005
Relative performance (% year-on-year) (% comp p.a.)Intrinsic net asset value +19.5 +16.9JSE – All share index +24.4 +13.2
– Fin & Ind 30 index +35.4 +9.2– Financial 15 index +39.0 +8.8
The table below reflects a comparison of Remgro’s internal rate of return (IRR) with that of certain selected JSE indices. In allcases it has been assumed that dividends have been reinvested in Remgro’s shares or in the appropriate indices.
IRRFrom 26 September 2000
to 31 March 2005 (% comp p.a.)
Remgro share +26.0JSE – All share index +15.5
– Fin & Ind 30 index +7.4– Financial 15 index +11.6
�

r e m g r o l i m i t e d16
GENERAL REPORTINVESTMENT REVIEW
(Note: Only limited commentary is given for listed companies seeing that the information is generally available.The unlisted investments are treated in more detail.)
�
contribution to headline earnings
TOBACCO INTERESTS
2005 2004R million R million
R&R Holdings 2 029 2 100
R&R HoldingsRemgro’s interest in British American Tobacco Plc (BAT) is represented by its one-third holding of the ordinary shares anddebentures, as well as all the participation securities, issued by R&R Holdings S.A., Luxembourg (R&R). This gives Remgro aneffective interest of 10.03% in BAT at 31 March 2005. The other two-thirds of the ordinary share capital and debentures of R&Rare held by Compagnie Financière Richemont SA (Richemont).
In May 2004, optionholders exercised the call warrants that were issued by R&R in January 2003 in respect of the BAT preferenceshares. These preference shares were converted into ordinary BAT shares and, as a result, Remgro’s effective interest in BATdeclined from 9.8% to 9.3%.
On 28 February 2005, Remgro’s wholly-owned subsidiary Remgro Investments Limited ( Jersey) invested £188.0 million in 19 281 686 participation securities issued by R&R. This was funded by the proceeds of the redemption by R&R of debenturesamounting to £564.7 million. Remgro and Richemont received £188.2 million and £376.5 million respectively. The debenturesthat were redeemed formed part of the consideration received from the Rothmans International merger on 1 October 1995. Asset out in the 1996 Rembrandt Group Limited Annual Report, no book value was reflected in the group accounts in respect ofthe original investment in R&R. As a result, the gross proceeds received by Remgro upon redemption of the debentures has beenrecorded as an exceptional profit.
The participation securities entitle Remgro to all the rewards and risks of directly owning the same number of ordinary shares inBAT. The participation securities can be redeemed by R&R either by delivery of the appropriate number of BAT ordinary shareson a one-for-one basis, or by the payment by R&R to the holder of the proceeds from the disposal of the appropriate number ofBAT ordinary shares.
As Remgro and Richemont hold an interest of one-third and two-thirds respectively in R&R’s ordinary share capital, and as thetransaction did not affect the total number of BAT shares owned by R&R, Remgro and Richemont, as ordinary shareholders,both surrendered their indirect interest in 19 281 686 ordinary BAT shares on a pro rata basis. At the same time Remgro, as anordinary shareholder, acquired a one-third interest in the £188.0 million cash obtained by R&R from issuing the participationsecurities.
The net result was that Remgro’s effective interest in BAT increased by 12 854 457 shares at a cost of £124.9 million, excludingtransaction costs.
For the year under review, R&R’s results included its 29.6% interest of BAT’s results for the period up to the conversion of theBAT preference shares into ordinary shares at the beginning of June 2004 at which time its interest was diluted to 27.9%.Subsequent share buy-backs by BAT resulted in R&R’s percentage holding rising to 28.1% at 30 September 2004, 28.2% at 31 December 2004 and 28.3% at 31 March 2005. The results for the comparative period reflected R&R’s 28.8% effective interestfor the six months to 30 September 2003 and its 29.4% interest for the six months to 31 March 2004.

r e m g r o l i m i t e d17
GENERAL REPORT: INVESTMENT REVIEW
As explained in the 2003 Annual Report, the BAT preference shares, referred to above, were treated as debt instruments sinceJanuary 2003 and were no longer equity accounted. This also resulted in those debt instruments being revalued to fair value. Themovement in the present value of the preference shares was therefore recognised and accounted for accordingly. Remgro’s shareof the deferred net warrant premium of £30 million was included in equity accounted income during the comparative period to 31 March 2004.
R&R’s share of BAT’s earnings for the twelve months to 31 March 2005 is based on BAT’s results for the year ended 31 December 2004 plus the results for the quarter to 31 March 2005 (now reported under International Financial ReportingStandards (IFRS)) less the results for the quarter to 31 March 2004. For this purpose, in order to be in line with the practice inprevious years, R&R adjusted BAT’s results for the quarter to 31 March 2005 to UK accounting practice. Remgro’s share of R&R’sheadline earnings is included in the table below.
2005 2004£ million £ million
Attributable profit as reported by BAT:– for the year ended 31 December 2004 (2004: to 31 December 2003) 1 098 631– less: for the quarter ended 31 March 2004 (2004: to 31 March 2003) (219) (235)– add: for the quarter ended 31 March 2005 (2004: to 31 March 2004) 267 219
– as reported by BAT under IFRS 458– adjustment from IFRS to UK GAAP (191)
Adjustments:– to eliminate goodwill amortisation 529 426– to eliminate exceptional items 23 518
1 698 1 559 – movement in present value of BAT preference shares and dividends (8) (42)Adjusted attributable profit of BAT for the twelve months ended 31 March 1 690 1 517
R&R’s share of the adjusted attributable profit of BAT:– 1 April 2003 to 31 March 2004 – 440– 1 April 2004 to 28 February 2005 442 –– 1 March 2005 to 31 March 2005 38 –Movement in present value of BAT preference shares and dividends 8 42R&R’s other income 38 8R&R’s headline earnings for the year ended 31 March 526 490Net warrant premium no longer deferred – 30R&R’s adjusted headline earnings for the year ended 31 March 526 520
Remgro’s share thereof:– 33⅓% of R&R’s share of the adjusted attributable profit of BAT for the period
1 April 2003 to 31 March 2004 – 147– 33⅓% of R&R’s share of the adjusted attributable profit of BAT for the period
1 April 2004 to 28 February 2005 147 –– 35.46% of R&R’s share of the adjusted attributable profit of BAT for the period
1 March 2005 to 31 March 2005 14 –– 33⅓% of R&R’s non-BAT income 15 27
176 174
R million R millionTranslated at an average £/R rate of 11.5342 (2004: 12.1025) 2 029 2 100
�
r e m g r o l i m i t e d18
GENERAL REPORTINVESTMENT REVIEW
BAT’s own attributable profit for the twelve months to 31 March 2005, excluding goodwill amortisation and exceptional items,was 9% higher than the previous year at £1 698 million. However, after accounting adjustments to reflect the present value of thepreference shares and preference share dividends, BAT’s results for 2005 were 11% higher compared to the previous year.
In July 2004, BAT completed the agreement to combine its Brown & Williamson (B&W) US domestic businesses with that ofR.J. Reynolds (RJR) under Reynolds American Inc., a new holding company, 58% owned by RJR shareholders and 42% by BAT.BAT also sold Lane, its US-based pipe and smoking tobacco business, to Reynolds American for $400 million cash. As aconsequence of the merger, B&W and each of its affiliates (other than Reynolds American Inc. and its subsidiaries) will beindemnified by Reynolds American for all existing and future litigation relating to the US tobacco business. BAT expects that thetransaction will significantly improve its competitive position in the US domestic market.
BAT – in line with UK accounting practice – included within its equity an amount of £918 million, being the gain on the disposalof subsidiaries and some £216 million in respect of goodwill reinstated on its balance sheet. These items were linked to the deemeddisposal of its US operations as a consequence of the Reynolds American transaction. R&R has included its share of the gain ondisposal in its profit and loss account for the year to 31 March 2005.
BAT has a 31 December financial year-end. The following commentary is based on the BAT results for the financial year ended31 December 2004.
BAT’s adjusted diluted earnings per share, a good measure of its underlying performance (and which excludes the effects ofgoodwill amortisation, restructuring costs, disposal of subsidiaries, etc.), grew 10% to 75.83 pence per share. This reflects thehigher operating profit, the reduced effective tax rate, lower minority interests and the positive impact of BAT’s share buy-backprogramme.
Cigarette volumes, including make-your-own ‘stix’, grew by 8% to 853 billion cigarettes. The additional volumes were mainlygained from acquisitions together with the impact of the Reynolds American transaction. Excluding these benefits, the growth insales volume would have been 0.4%. Cigarette sales volumes include the whole of the Reynolds American volume, as is the casewith BAT’s other associated companies in India and Denmark. The US volumes, therefore, include seven months from Brown & Williamson and five months from Reynolds American. Excluding merger benefits, there were strong volume performances inRussia, Turkey, India and Pakistan, offset by declines in Germany, France, Canada and Japan. The global drive brands – Dunhill,Kent, Lucky Strike and Pall Mall – grew by 2%. Kent’s volume increased by 10% to a new record high of 33 billion.
BAT’s operating profit, before goodwill amortisation and exceptional items, was 2% higher at £2 830 million. These results wereadversely affected by average sterling exchange rates strengthening against almost all currencies. At comparable rates of exchange,operating profit, before goodwill and exceptional items, would have risen by 7%, reflecting the benefit from the Ente TabacchiItaliani S.p.A. (ETI) acquisition at the end of 2003 and a good performance in all regions except America-Pacific.
Profit from the America-Pacific region was £795 million, a decrease of £200 million from the same period last year. This was theresult of lower profits in Canada and Japan, further accentuated by the translation of US and Canadian results into sterling.Volumes in the region were up 27% to 131 billion, mainly as a result of the Reynolds American transaction, with higher volumesfrom South Korea more than offset by declines in Canada and Japan.
In Asia-Pacific, regional profit rose by £42 million to £515 million as strong performances in Australia, New Zealand, Malaysia,Vietnam, Pakistan, India and the duty-free business were only partially offset by reduced profit from Indonesia and Taiwan.Regional volumes at 201 billion were 4% higher than last year, with strong increases in India, Vietnam, Pakistan and Bangladesh,partially offset by declines in Indonesia and Malaysia.
�

r e m g r o l i m i t e d19
GENERAL REPORT: INVESTMENT REVIEW
In Latin America, a decrease in profit of £12 million to £428 million was mainly the result of many currencies in this regionweakening against sterling. This masked good performances in local currency terms as the region benefited from an improvementin margins. Regional sales volume at 148 billion was down by 2 billion mainly as a result of increased pressure from growing illicittrade, especially after-excise driven price increases in Brazil and Argentina. This was partly offset by the additional volumes fromthe new business acquisition in Peru, good performances in the majority of the Central American markets and growth inVenezuela.
In Europe, profit increased by £190 million to £726 million, mainly driven by the inclusion of ETI in the results from thebeginning of 2004. Excluding ETI, there was good profit growth of 10% at comparable rates of exchange. There were excellentperformances in Russia and Romania. The smoking tobacco and cigars business performed well and benefits were realised fromcost savings following the closure of factories and a number of reorganisations. These more than offset the adverse impact ofmarkets where excise increases resulted in lower volumes. Regional volumes grew by 7%, reaching 268 billion, primarily due toincremental volume from newly acquired businesses and growth in Russia, partly offset by market-related declines in WesternEurope.
Profits in the Africa and Middle East region grew by £29 million to £366 million, with strong performances from South Africa,Nigeria and the Caucasus, partly offset by the cost of continued investment in new markets and a large fall in profit fromZimbabwe. Volumes rose by 7% to 105 billion mainly as a result of the significant growth in Turkey as well as increases in theCaucasus and Nigeria, partly offset by declines in South Africa and Zimbabwe.
FINANCIAL SERVICES
Both FirstRand Limited (FirstRand) and RMB Holdings Limited (RMBH) have June year-ends and therefore their results forthe twelve months to 31 December have been equity accounted.
FirstRandFirstRand’s contribution to headline earnings, as indicated above, excludes the indirect contribution of FirstRand throughRemgro’s interest in RMBH.
For the reported six months ended 31 December 2004, FirstRand’s headline earnings increased by 22.6% to R3 355 million (2003 restated: R2 736 million). These results were achieved in a favourable economic environment which provided strong organicgrowth opportunities, particularly for the FirstRand Banking Group. This was evident in the high levels of new business growthat Rand Merchant Bank, Wesbank and First National Bank and resulted in headline earnings growth for the FirstRand BankingGroup of 23% to R2.8 billion.
contribution to headline earnings
FirstRandRMBHAbsaOther
2005R million %
632 37540 32517 31
6 –1 695 100
2004R million %
523 38453 32419 30
(1) –1 394 100
%Change
211923
22
�

r e m g r o l i m i t e d20
GENERAL REPORTINVESTMENT REVIEW
In May this year, FirstRand announced that all conditions precedent regarding its proposed black economic empowerment (BEE)transaction, had been complied with. The operative date of the scheme was 16 May 2005.
In terms of this transaction, FirstRand has bought back approximately 416.2 million ordinary shares on a pro rata basis from allshareholders in the ratio of 7.6 ordinary shares for each 100 ordinary shares held. The price per ordinary share amounted toR12.28 and in terms of this transaction Remgro received R486.0 million on 16 May 2005. At the same time FirstRand issued119 million ordinary shares to the BEE consortium, with the result that Remgro’s direct interest in FirstRand has been dilutedfrom 10.0% to 9.4%.
This transaction also diluted RMBH’s interest in FirstRand from 34.4% to 32.2%. After this transaction, Remgro’s total interestin FirstRand, including the indirect interest held by RMBH, is 16.8%.
FirstRand is committed to transformation in South Africa and specifically wishes to ensure that the long-term benefits of theBEE transaction reach the widest possible community of black South Africans, with a specific focus on the lower income groups.
RMBHFor the twelve months ended 31 December 2004, 90.3% (2003: 90.1%) of RMBH’s headline earnings was from FirstRand while9.7% (2003: 9.9%) was contributed by its other interests.
RMBH’s other interests included RMB Structured Insurance Limited, OUTsurance Limited (OUTsurance) and Glenrand M.I.BLimited.
OUTsurance posted strong results for the six months to 31 December 2004. Gross premium income equalled R881 million,reflecting a 32% increase. This was driven by strong organic growth in both personal and business lines. RMBH’s attributableshare of OUTsurance’s headline earnings for the six-month period increased by 42% and amounted to R85 million (2003: R60 million).
Effective from 1 January 2004, RMBH sold its 48.4% interest in Global Resorts (SA) (Pty) Limited (GRSA) to a consortium of investors. RMBH received the R530 million sale consideration during May 2004, which resulted in a profit on the disposal of R161 million.
AbsaAbsa Group Limited’s (Absa) headline earnings for the year ended 31 March 2005 increased by 23.3% to R5 484 million.
Absa’s share price appreciated by 61.7% for the year under review, due to a rerating of the South African banking sector in generaland Absa in particular, coupled with the Barclays Bank PLC (Barclays) offer to acquire a majority stake in Absa.
Barclays, a leading international financial services institution, recently announced its formal offer to Absa shareholders to acquirea controlling stake in it. The transaction, still subject to certain conditions precedent, will be the largest foreign direct investmentin South Africa’s history and underlines the commitment of Barclays to both Absa and South Africa. The Report of the Boardof Directors contains more particulars regarding this transaction.
SageFor the year ended 31 December 2004 Sage Group Limited (Sage) reported a headline loss of R46.3 million (headline earningsfor the year ended 31 December 2003: R61.2 million).
�
r e m g r o l i m i t e d21
GENERAL REPORT: INVESTMENT REVIEW
On 20 May 2005 Momentum Group Limited (Momentum), a wholly-owned subsidiary of FirstRand, announced that it hassubmitted an offer to acquire all the issued shares in Sage, other than those held by Sage Life Limited, by way of a scheme ofarrangement in terms of section 311 of the Companies Act.
The consideration payable in terms of the scheme shall be R634 million, or R1.75 per Sage share, comprising of an initial paymentof R1.42 per share and a potential subsequent payment of up to a maximum of R0.33 per share. As security for certain potentialcontingent taxation-related liabilities, an amount of R120 million of the cash consideration will be held in an escrow account.Once the potential tax liabilities have been resolved, the escrow amount will be reduced and the balance will be distributed to Sageshareholders pro rata to their shareholding.
Remgro gave an irrevocable undertaking to Momentum to vote in favour of the proposed scheme and also agreed that therepayment of the R95 million loan to Sage be postponed to 31 October 2005.
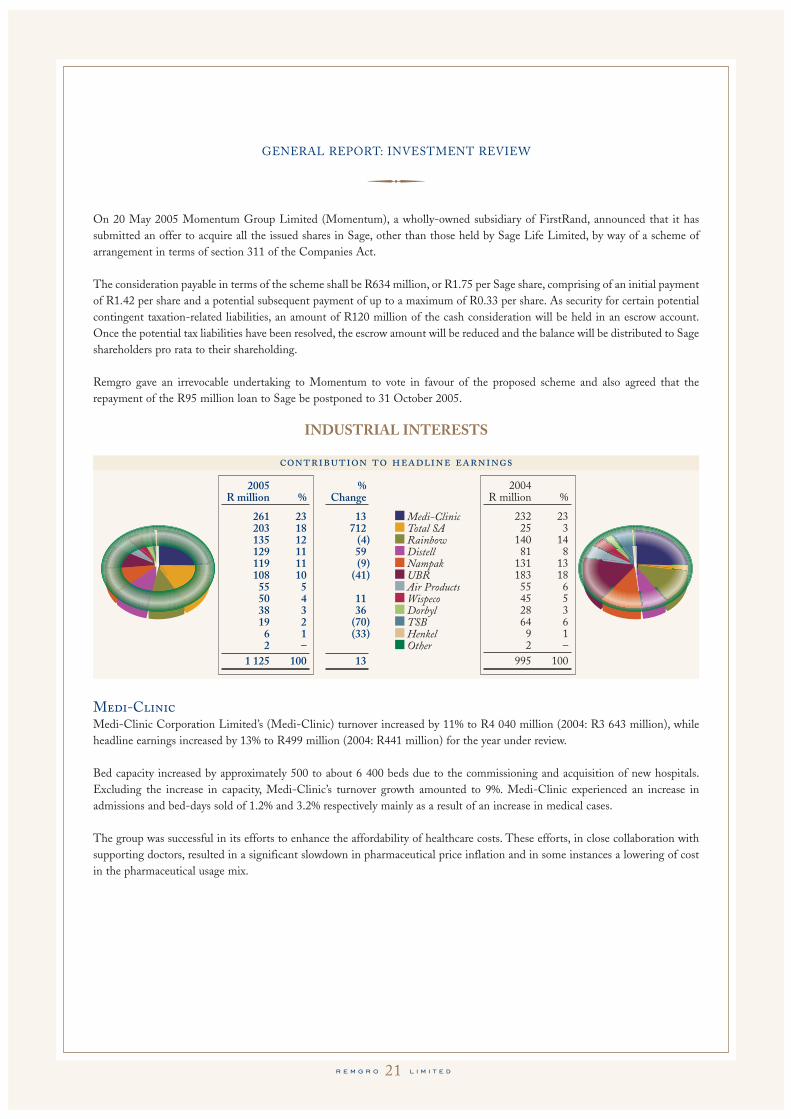
INDUSTRIAL INTERESTS
Medi-ClinicMedi-Clinic Corporation Limited’s (Medi-Clinic) turnover increased by 11% to R4 040 million (2004: R3 643 million), whileheadline earnings increased by 13% to R499 million (2004: R441 million) for the year under review.
Bed capacity increased by approximately 500 to about 6 400 beds due to the commissioning and acquisition of new hospitals.Excluding the increase in capacity, Medi-Clinic’s turnover growth amounted to 9%. Medi-Clinic experienced an increase inadmissions and bed-days sold of 1.2% and 3.2% respectively mainly as a result of an increase in medical cases.
The group was successful in its efforts to enhance the affordability of healthcare costs. These efforts, in close collaboration withsupporting doctors, resulted in a significant slowdown in pharmaceutical price inflation and in some instances a lowering of costin the pharmaceutical usage mix.
contribution to headline earnings
Medi-ClinicTotal SARainbowDistellNampakUBRAir ProductsWispecoDorbylTSBHenkelOther
2005R million %
261 23203 18135 12129 11119 11108 10
55 550 438 319 2
6 12 –
1 125 100
%Change
13712
(4)59(9)
(41)
1136
(70)(33)
13
2004R million %
232 2325 3
140 1481 8
131 13183 1855 645 528 364 69 12 –
995 100
�

r e m g r o l i m i t e d22
GENERAL REPORTINVESTMENT REVIEW
Unilever Bestfoods Robertsons (Holdings) LLC (UBR) – UnlistedThe UBR venture covers the territories of Southern Africa and Israel and manufactures and markets an extensive range of foodproducts, while enjoying market leadership in most of its major categories.
IsraelAlthough overall economic sentiment in Israel improved through the year in step with political developments, the food-retailingsector remains in deflationary and price-sensitive mode. Competition between rival chains has caused some significant movementsin market share and as differentiation is low, there is an ongoing emphasis on consumer price. This impacts on manufacturersthrough tough discussions on trade terms and promotional activities.
Turnover was lower than the prior year mainly due to the disposal of the Rushdie condiment business and a small cheese business.Excluding this effect, sales were flat. The continued focus on strategic brands like Telma cereals, Klik confectionery, Knorr andLipton resulted in very good levels of brand growth, however the effect of additional discounts to customers lowered turnover andprofit marginally. In the Foodservice markets, good business growth was achieved in the catering segments, while on the otherhand the food ingredient business declined marginally.
Gross margins were stable across the two years but lower turnover reduced overall profit. While the supply chain savings improvedmargins, these were negatively impacted by trade discounts. There was also a significant increase in promotional and mediasupport for the portfolio. Exceptional items had a substantial impact on the headline earnings. The recent supply chainrestructuring programme was completed and the positive impact on manufacturing and distribution costs is expected to be seenin the 2006 financial year. A second restructuring programme, to increase the efficiency of both sales and head office activities,was announced in December 2004. This programme will be undertaken over the course of 2005 and 2006 and full savings willaccrue in 2007.
South AfricaTurnover for the year ended December 2004 was 7% below the prior year. Excluding the impact of disposals, turnover was up by1%. Margarine gained market share of 2% mainly as a result of improved competitiveness.
Gross margin was higher than the prior year as a result of supply chain efficiencies, the improvement of the exchange rate and thedisposal of brands with lower margins. Retail grew on the back of a strong margin delivery, coupled with overhead savingsresulting from internal organisational restructuring. Exceptional items included the sales of the factories in Industria, Hartswater,Tzaneen and the oil refinery at the Boksburg site. Brands disposed of were Carmel, Robertsons Baking Aids and Pastrex. Intereston shareholder loans decreased due to the partial repayment of loan capital (Remgro’s portion being R266.5 million), as well aslower interest rates.
Subsequent to 31 March 2005, UBR sold its Bovril, Marmite and Maizena brands in South Africa for R110 million. Thistransaction will be accounted for in UBR’s results for the twelve months to 31 March 2006.
UBR’s contribution to Remgro’s headline earnings is made up as follows:2005 2004
R million R millionEarnings before exceptional items – South Africa 98 108
– Israel 29 51127 159
Less: Exceptional items charged against headline earnings (49) (27)Headline earnings 78 132Interest on shareholder’s loan after taxation 30 51Contribution to headline earnings 108 183
�

r e m g r o l i m i t e d23
GENERAL REPORT: INVESTMENT REVIEW
UBR produced lower results for the twelve months ended 31 March 2005 compared to the comparative period. This is mainlydue to a lower contribution by Israel, where the overall economic environment remained weak during the period under review aswell as major restructuring expenses being incurred. As indicated above, the majority of these expenses have been included inheadline earnings.
Total South Africa – UnlistedTotal South Africa (Proprietary) Limited (Total SA) reported excellent results for the year to 31 December 2004 due to increasedmarket share and improved margins.
The market shares of main fuels and lubricants stood at 14.8% at the end of 2004 (2003: 14.1%). Retail and Commercial andSpecialities market share also grew in 2004. Margin increases granted by government have translated into operating profits. Thecompany again maintained a high level of investment in its marketing operations during the year.
Its results were positively impacted by the constant increase in the fuel price due to the movement in the US dollar crude priceand the value of the rand. This translated into gains in the value of inventory on hand, accommodation balances and refiningmargins.
The black economic empowerment (BEE) involvement in Total SA has continued to contribute to the well-being of theCompany, and Tosaco, the BEE partner, has met all its obligations.
NampakThe contribution to Remgro’s headline earnings relates to Nampak Limited’s (Nampak) results for the twelve months to 31 March 2005.
For the six months ended 31 March 2005, Nampak reported a decline in headline earnings per share of 11.3% to 70.8 cents (2004: 79.8 cents).
Turnover from continuing operations, including the plastic industrial containers business and Peters Papers which were sold,declined by over 9%. Excluding these businesses, the decline was 4%. A fall-off in volumes occurred, due mainly to reduced directand indirect exports, as well as increased imports of packaging and finished products. Low inflation and, with the exception ofpolymer, little movement in raw material prices resulted in selling prices remaining flat.
Effective from 1 March 2005, Nampak sold Peters Papers, its paper merchants division, to Actis, a private equity company inemerging markets, for R220 million. The transaction was concluded in partnership with the management of Peters Papers andIzingwe Capital, a BEE investment company.
DistellDistell Group Limited’s (Distell) contribution to Remgro’s headline earnings relates to its twelve months ended 31 December 2004.
Distell’s turnover grew by 7.3% to R3.4 billion on a sales volume increase of 1.8% for the latest reported six-month period ended31 December 2004. Sales volumes in the domestic market, which grew by 0.9%, reflect a favourable sales mix. International salesvolumes, excluding Africa, increased by 7.2%. A 6.1% improvement in the value of the rand impacted negatively on turnover, withinternational turnover declining by 1.6%. Turnover derived from African countries increased by 7.0%. The increase of 14.4% intrading income was driven largely by increased turnover, the continual improvement in the domestic sales mix and enhancedefficiencies across various dimensions of the business.
�

r e m g r o l i m i t e d24
GENERAL REPORTINVESTMENT REVIEW
TSB – UnlistedTransvaal Sugar Limited (TSB) is primarily involved in cane growing and the production, transport and marketing of sugar andanimal feed. The main area of operation is the Nkomazi region in the Mpumalanga Lowveld. The company’s two sugar mills aresituated near Malelane and Komatipoort.
Sugar products are sold under the well-established Selati brand. The Selati brand enjoys market leadership in its target market(Gauteng, Mpumalanga, North West and Limpopo), while the recent expansion into other geographic areas has also been verysuccessful.
TSB’s animal feed operation, Molatek, produces various livestock products. The major raw materials used in the productionprocess are by-products from the sugar process. Due to a difficult marketing environment the Molatek animal feed plantproduction decreased by 14% during the year under review.
TSB also invested in citrus via Golden Frontiers Citrus (GFC). GFC owns three citrus estates and four packing plants wheregrapefruit and oranges are cultivated, harvested and packed for the export market. TSB sold 49% of its investment in GFC duringthe year to the Industrial Development Corporation in terms of a BEE deal. The marketing of the citrus is undertaken by KomatiFruits, a partnership between various citrus producers.
During the year under review TSB acquired a 100% share in Booker Tate Limited (Booker Tate) for R23 million. Booker Tate isbased in the United Kingdom and its main business is the rendering of management services to sugar mills and refineries. Millsmanaged by Booker Tate produced 1.5 million tons of sugar during the year under review.
Due to climatic conditions, the sugar industry’s production decreased by 7.6% in 2004/2005. The lower crop, coupled with thestrengthening of the rand and the low world sugar price, had a devastating effect on the financial performance of millers andgrowers throughout the industry.
TSB’s sugar production decreased by 13.3% for the year under review compared to the 7.6% for the total industry. This is due tothe prolonged drought in the TSB water catchment areas. A total of 3 530 million tons of cane was crushed this season (2004: 3 975 million tons), with a sugar production of 422 868 tons raw sugar (2004: 488 000 tons). Both mills attained goodproduction efficiencies. TSB operates a refinery at the Malelane Mill complex that refines for the local and export market. Therefinery produced 324 000 tons of refined sugar during the year (2004: 320 000 tons).
TSB’s group results were influenced negatively by the strengthening of the rand and the impact of the drought. Turnover increasedby 2.9% to R1 355 million and operating profit decreased by 38.4%. Headline earnings decreased to R19.0 million (2004 restated: R63.8 million).
Due to better climatic conditions, sugar production for the new year is expected to be better than the 2005 financial year. However,a strong South African currency will still have a negative impact on results. Export prices increased marginally over the past fewmonths and will have a positive impact on expected results.
RainbowRainbow Chicken Limited’s (Rainbow) headline earnings declined by 6.3% from R227.5 million to R213.0 million.
Rainbow’s results were negatively impacted by feed being contaminated for a limited period by a supplier product. This reducedpre-taxation earnings by some R80 million and caused headline earnings to decrease by 6.3% over the comparable period. Thefull impact of the loss is included in the current year’s results.
Feed raw material prices, particularly maize, softened significantly, with the year-on-year closing SAFEX price for yellow maizeapproximately 50% lower at the end of the financial year. However, Rainbow was unable to benefit fully from this reduction as aresult of certain long-term positions held in maize, and to a lesser extent soya.
�
r e m g r o l i m i t e d25
GENERAL REPORT: INVESTMENT REVIEW
Rainbow’s turnover increased by 5.1% mainly due to chicken turnover, which increased by 5.5% to R3.3 billion (2004: R3.1 billion) on the back of a 6.0% improvement in price realisations.
During the year under review Rainbow acquired a 100% share in Vector Logistics (Pty) Limited for R456 million. It is a specialistthird party logistics service provider for the food and food-related industries within Southern Africa. Vector currently distributesapproximately 70% of Rainbow’s products and its business is made up of approximately 60% of Rainbow’s distribution.
The review period was an important one for Rainbow as significant progress has been made towards transforming Rainbow froma commodity manufacturer to a more dynamic, consumer-focused, integrated producer.
Air Products – UnlistedAir Products South Africa (Proprietary) Limited (Air Products) is the largest industrial manufacturer in Southern Africa ofoxygen, nitrogen, argon, hydrogen and carbon dioxide. Products are supplied to the steel, chemical, petrol refining, pulp and paperindustries as well as general fabrication and welding shops.
Over the past three years the company expanded into supplying the resource minerals industry of platinum refining and copperand cobalt smelters.
The company focuses on cost-effective solutions in the supply of gases to major corporations through pipeline supply from majoron-site plants, bulk liquid tankers as well as supplying smaller customers with a wide range of cylinders, minitanks and specialtygases directly or through an extensive distribution network.
The company has increased its market share in the packaged gas business through the leadership position established in the smallliquid and minitank/maxitank product offering. The company was recently awarded the supply contract for oxygen and nitrogento Impala Platinum Refineries.
For the six months ended 31 March 2005, Air Products’ turnover grew by 11.6% (2004: 2.3%) from R323.9 million to R361.6 million and its headline earnings by 15.8% (2004: 12.6%) from R53.8 million to R62.3 million.
DorbylDorbyl Limited’s (Dorbyl) headline earnings per share increased by 38% from 199.3 cents in 2004 to 275.6 cents in 2005.
Dorbyl’s turnover at Alpine in US dollar terms improved by 26% and, in South Africa, Dorbyl Automotive Technologies increasedsales by 9%. This resulted in a total rise of 10% to R2.1 billion, although some of this improvement was the result of particularlyhigh steel price increases.
Dorbyl had a significant adverse swing in exceptional items. While last year reflected net profits of R27.2 million (mainly inrespect of the disposal of certain operations), the current year reflected a loss of R22.7 million (mainly due to the loss on disposalof the Wheels business at Heidelberg and legal costs incurred in endeavouring to recover money due to Dorbyl in respect of alease obligation and related costs of R17 million).
On 25 May 2005, Dorbyl entered into an agreement to dispose of its Alpine Engineered Products Division with effect from 1 April 2005. The transaction is subject to the approval of Dorbyl’s shareholders. The purchase consideration in terms of thedisposal is $158 million. It is the intention of Dorbyl to distribute the major portion of the proceeds on the disposal to itsshareholders. After the implementation of the transaction, Dorbyl’s prospects will revolve largely around its remaining localDorbyl Automotive Technologies operations.
�

r e m g r o l i m i t e d26
GENERAL REPORTINVESTMENT REVIEW
Wispeco – UnlistedWispeco Holdings Limited’s (Wispeco) turnover increased by 22% during the year under review and sales volumes increased by19%, which contributed to the increase in Wispeco’s headline earnings from R45 million to R50 million.
The on-site industry training programmes for aluminium fabricators, introduced in the previous year, are continuing to be highlysuccessful and contribute largely to the increase in aluminium usage.
The commissioning of the sixth extrusion press was completed towards the end of 2004. The additional output from this press aswell as that from the one presently being installed in Parow, Cape Town, has added much needed capacity to support the Wispecophilosophy of quick delivery. Smaller expansions of the Alrode and Cape Town finishing plants are continuing, the latest additionbeing the new automated powder-coating plant, which is to be installed in Epping, Cape Town.
In November 2004 the stockist division was expanded with the acquisition of the aluminium business of the Conways Group, adivision of the Iliad Group. This has added three new outlets.
MINING INTERESTS
Trans HexTrans Hex Group Limited’s (Trans Hex) headline earnings per share declined by 56.7% from 222.0 cents in 2004 to 96.2 cents in 2005.
Diamond sales were 3% lower in rand terms at R1 015 million (2004: R1 042 million) and 13% higher in US dollar terms at $162.2 million (2004: $144.1 million). Diamond prices remained strong throughout the period, but the strengthening of the rand had a significant negative impact on earnings. In constant currency terms, headline earnings per share would have been 184.5 cents (a decline of 16.9%). Increased exploration activities, especially in Angola, contributed to increased exploration costsof R67.3 million (2004: R49.7 million).
Trans Hex acquired an effective 39% interest in Matikara Prestação De Serviços SARL. This exploration joint venture holds theexploration rights to three Angolan alluvial properties and has been granted kimberlite exploration rights for one property.
Trans Hex’s board has approved a R30 million plant upgrade for the PK (Paleo Canal) facility located in the Lower Orange Riverregion to improve production by 2 100 carats per year. This will replace the production from the discontinued Saxendrift andReuning facilities.
contribution to headline earnings
ImplatsTrans HexGencorOther
2005R million %
70 6929 29
2 2– –
101 100
2004R million %
17 1079 4672 424 2
172 100
%Change
312(63)(97)
(41)
�

r e m g r o l i m i t e d27
GENERAL REPORT: INVESTMENT REVIEW
ImplatsRemgro’s interest in Implats is 5% and only dividend income is brought into account.
CORPORATE FINANCE AND OTHER INTERESTS2005 2004
R million R millionCentral treasury 98 104Net corporate costs (72) (84)Other interests 6 6
32 26
CorporateThe central treasury division’s contribution to Remgro’s headline earnings decreased from R104 million to R98 million. This wasmainly the result of lower interest rates during the year under review, as well as lower cash balances due to the special dividendpayment in August 2004 and the repurchase of Remgro shares during the year.
Net after-tax corporate costs, which includes donations and the cost of the share incentive scheme, decreased by R12 million froma restated R84 million in 2004 to R72 million in 2005. This was mainly the result of the lower share incentive scheme costs.
ACKNOWLEDGEMENTTo all of those who contributed to the performance of the Group over the past year, we extend our sincere thanks: to theshareholders for their continued confidence; the managing directors and all colleagues in the various Group companies for theirco-operation and support; all other directors, officials and employees for their dedication and all parties concerned for servicesrendered.
Johann Rupert Thys Visser
Stellenbosch21 June 2005
�

r e m g r o l i m i t e d28
INTRINSIC NET ASSET VALUEAT 31 MARCH 2005
Tobacco interestsR&R Holdings 2 235.9 11.7520 26 276 23 517
– BAT ordinary shares 1 214.3 933 1 999.4– Cash and dividends receivable 236.4– Other net assets 0.1
Financial servicesFirstRand 520.7 1 333 6 941 5 113RMB Holdings 274.1 2 143 5 874 4 087Absa Group 61.4 7 540 4 629 2 863Sage Group 65.0 185 120 111Sagecor 26 11
Industrial interestsMedi-Clinic Corporation 178.6 1 530 2 732 2 143Unilever Bestfoods Robertsons 1 711 1 754Distell Group 58.7 2 395 1 405 909Nampak 86.8 1 580 1 371 1 150Total South Africa 1 187 933Rainbow Chicken 172.8 650 1 124 942Transvaal Sugar 1 028 1 073Air Products South Africa 606 605Dorbyl 14.1 3 000 422 260Wispeco 304 268Henkel South Africa – 75Caxton 7.8 1 145 89 69
Mining interestsImplats 3.3 52 500 1 751 1 720Trans Hex Group 30.2 1 750 529 823Gencor 38.0 15 6 5
Other interestsSundry investments and loans 72 72Other net assets 283 98
Cash at the centre– Local 2 782 2 147– Offshore 2 26.6 11.7520 312 3
Intrinsic net asset value 59 580 50 751Potential CGT liability 3 (1 141) (439)
Intrinsic net asset value after tax 58 439 50 312
Issued shares after deduction of shares repurchased and the shares in The Remgro Share Trust (million) 487.1 501.3
Intrinsic value per share R119.97 R100.36
Notes1. This represents Remgro’s effective interest of 10.03% in BAT Plc.2. Cash at the centre excludes cash held by subsidiaries and associated companies that are separately valued above.3. The potential capital gains tax (CGT) liability, which is unaudited, is calculated at an effective rate of 14.5% on the specific
identification method using the most favourable calculation for investments acquired before 1 October 2001 and also takinginto account the corporate relief provisions.
4. The listed investments are valued at stock exchange prices and unlisted investments at directors’ valuation.
Stock Shares exchange 31 March 31 March
held closing Exchange 2005 2004Notes million price £ million rate R million R million
�

r e m g r o l i m i t e d29
CORPORATE GOVERNANCE
R emgro endorses, and is fully committed to compliance with the principles of the King II Report’s Code of Corporate
Practices and Conduct.
The Company is an investment holding company. Reference to “the Company” also means the Company and its wholly-ownedsubsidiaries. Each entity in which the Company is invested has its own governance structures. In giving effect to its riskmanagement responsibilities, Remgro has also approved the maintenance of a broader risk management review programme toensure a coherent governance approach throughout the Group.
All the Company’s listed subsidiaries and associated companies endorse the Code of Corporate Practices and Conduct whereapplicable. The Company encourages full compliance where possible and disclosure where not.
The following are the notable aspects of the Company’s corporate governance.
BOARD CHARTERThe Board has adopted a formal charter which has been implemented to:
• identify, define and record the responsibilities, functions and composition of the Board, and • serve as a reference to new directors.
The charter has been endorsed by all directors of Remgro Limited and is available for inspection at the registered address.
The Board, having reflected on the following, is satisfied that, for the year under review, it executed the required actions containedin the charter satisfactorily.
COMPOSITION OF THE BOARDRemgro has a fully functional Board that leads and controls the Group. The Board currently consists of five executive and tennon-executive directors of whom six are independent.
The roles of the chairman and the chief executive officer are separated. The chairman is a non-executive director but is notindependent.
Board members are listed on pages 10 and 11.
ROLE AND RESPONSIBILITIESThe Board is ultimately responsible for the strategic direction, risk appetite, performance and affairs of the Company. In directingthe Group, the Board exercises leadership, integrity and judgement based on fairness, accountability, responsibility andtransparency so as to achieve continuing prosperity for the Group.
After approving operational and investment plans and strategies, the Board empowers executive management to implement theseand to provide timely, accurate and relevant feedback on progress made.
The Board remains accountable for the overall success of the approved strategies, based on values, objectives and stakeholderrequirements, and for the process and policy to ensure the integrity of risk management and internal controls. The Board is thefocal point of the Group’s corporate governance and is also responsible for ensuring that it complies with all relevant laws,regulations and codes of best business practices.
�

r e m g r o l i m i t e d30
CORPORATE GOVERNANCE
The Board is responsible for monitoring the operational and investment performance of the Group including financial and non-financial aspects. It is also responsible for ensuring that procedures and practices are in place which will protect the Company’sassets and reputation.
The Board has established the following subcommittees to assist it in discharging its duties and responsibilities:
• The Remuneration and Nomination Committee, consisting of four non-executive directors, advises the Board onthe remuneration and terms of employment of all directors and members of senior management and is responsible for succession planning. Additionally, it annually participates in evaluating directors. The committee is also responsible fornominating directors. Directors do not have long-term contracts or exceptional benefits associated with the termination ofservices. The chairman of the Board is chairman of this committee. The chief executive officer attends meetings by invitation.
The committee has a formal mandate and its effectiveness is evaluated by the Board in terms thereof.
• The Audit and Risk Committee, consisting of three non-executive directors and one executive director, reviews the adequacyand effectiveness of the following: the financial reporting process; the system of internal control; the management of financial,investment, technological and operating risks; risk funding; the internal and external audit processes; the Company’s processfor monitoring compliance with laws and regulations; its own code of business conduct; and procedures implemented tosafeguard the Company’s assets. An independent non-executive director is chairman of the committee.
The committee has a formal mandate and its effectiveness is evaluated by the Board in terms thereof.
• The Executive Committee, consisting of all five executive directors, meets regularly between Board meetings to deal withissues delegated by the Board.
Risks retained directly by the Board include: strategic risk, opportunity risk and social responsibility.
The Board is responsible for the appointment and induction of new directors. Non-executive directors are selected for theirbroader knowledge and experience and are expected to contribute effectively to decision-making and the formulation of strategiesand policy.
Executive directors contribute their insight of day-to-day operations enabling the Board to identify goals, provide direction anddetermine the feasibility of the strategies proposed. These directors are generally responsible for taking and implementing alloperational decisions.
MEETINGS AND QUORUMThe articles of association requires three directors to form a quorum for Board meetings. A majority of members, preferably withsignificant representation of the non-executive directors, are required to attend all committee meetings.
The Board meets at least six times a year. The Audit and Risk Committee meets at least four times a year, and the Remunerationand Nomination Committee meets at least once a year.
�

r e m g r o l i m i t e d31
CORPORATE GOVERNANCE
MATERIALITY AND APPROVAL FRAMEWORKIssues of a material or strategic nature, which can impact on the reputation of the Company, are referred to the Board. Otherissues, as mandated by the Board, are dealt with at senior management level.
The minutes of all the committee meetings are circulated to the members of the Board. Issues that require the Board’s attentionor a Board resolution, are highlighted and included as agenda items for the next Board meeting.
REMUNERATION PRINCIPLESThe Company’s policy that guides the remuneration of all directors and senior management is aimed at:
• Retaining the services of existing directors and senior management• Attracting potential directors and senior managers• Providing directors and senior management with remuneration that is fair and just• Ensuring that no discrimination occurs• Recognising and encouraging exceptional and value-added performance
In accordance with these objectives, the Remuneration and Nomination Committee annually reviews and evaluates thecontribution of each director and member of senior management and determines their annual salary adjustments. For this purposeit also considers salary surveys compiled by independent organisations.
DUTIES OF DIRECTORSThe Companies Act places certain duties on directors and determines that they should apply the necessary care and skill infulfilling their duties. To ensure that this is achieved, best practice principles, as contained in the King II Report on CorporateGovernance for South Africa, are applied.
The Board is also responsible for formulating the Company’s communication policy and ensuring that spokespersons adhere toit. This responsibility includes clear, transparent, balanced and truthful communication to shareholders and relevant stakeholders.
After evaluating in terms of their respective charters, the directors are of the opinion that the Board and the subcommittees havedischarged all their responsibilities.
CONFLICTS Mechanisms are in place to recognise, respond to and manage any potential conflicts of interest. Directors sign, at least once ayear, a declaration stating that they are not aware of any conflicts of interest that may exist due to their interest in, or associationwith, any other company. In addition, directors disclose interests in contracts that are of significance to the Company’s business.
All information acquired by directors in the performance of their duties, which is not disclosed publicly, is treated as confidential.Directors may not use, or appear to use, such information for personal advantage or for the advantage of third parties.
All directors of the Company are required to comply with the Remgro Code of Conduct and the requirements of the JSESecurities Exchange South Africa ( JSE) regarding inside information, transactions and disclosure of transactions.
�

r e m g r o l i m i t e d32
CORPORATE GOVERNANCE
COMPANY SECRETARY AND PROFESSIONAL ADVICEAll directors are entitled to seek independent professional advice concerning the affairs of the Group, at the Company’s expense.
All directors have unlimited access to the services of the Company Secretary, who is responsible to the Board for ensuring thatproper corporate governance principles are adhered to. Board orientation or training is done when appropriate.
GOING CONCERNAt least once a year the Board considers the going concern status of the Group with reference to the following:
• Net available funds and the liquidity thereof• The Group’s residual risk profile• World economic events• The following year’s strategic business plan, budgets and cash flow models• The Group’s current financial position
SERVICE COMPANYAn agreement was concluded with a service company, M&I Management Services (Proprietary) Limited (M&I), to rendermanagement and support services to Remgro. The shareholders of M&I are employees of M&I who own all the issued ordinaryshares. No dividends have been declared. Rembrandt Trust (Proprietary) Limited owns all the A ordinary shares of M&I. The A ordinary shares have voting rights only and no rights to the income or assets of M&I.
Remgro pays fees to M&I which cover the overhead costs of the management of Remgro. These fees will not exceed 0.463% peryear of the market capitalisation of Remgro, calculated on a monthly average basis. This percentage may not be exceeded withoutthe approval of 75% of all classes of shareholders of Remgro. The fees for the past year are disclosed in note 18 to the annualfinancial statements.
RISK MANAGEMENT AND INTERNAL CONTROLIn determining strategic goals, the Board of Directors has ensured its understanding of all the risks accepted in the Company’sinvestment portfolio with a view to maximising sustainable profits and growth. These risks are continuously measured against therisk appetite determined by the Board.
The categories of risk identified can be broadly classified as follows:
• Performance risk relates to those risks managed by the Board and include strategic risk, opportunity risk, reputation risk,liquidity risk, and also risks relating to corporate governance, social responsibility and stakeholder relations.
• Investment risk inherent to existing investments. The Board has delegated the responsibility for investment risk managementto the boards of the various investment companies. The Remgro Board monitors that these delegated responsibilities areeffectively executed by appointing its own members in non-executive capacities on those boards.
• Operational risk includes operational effectiveness and efficiency, safeguarding of assets, compliance with relevant laws andregulations, reliability of reporting, effective operational risk management, human resource risk, technology risks, businesscontinuity and risk funding. Various operational risks have been transferred to M&I as part of the agreement with the servicecompany. These include human resource risks and information technology risks.
The Board has documented and implemented a comprehensive risk management system, which incorporates continuous riskassessment, evaluation, and internal control embedment.
�

r e m g r o l i m i t e d33
CORPORATE GOVERNANCE
The Enterprise-wide Risk Management system applicable to the Company is as follows:
• Group risk analysisThe purpose of the Group risk analysis is to reconfirm and update the Group’s consolidated risk profile. This ensures that theresidual risk profiles by investment, and in total, remain within the risk tolerances set by the Board and that new emergingrisks are identified and responded to in time.
• Activity risk analysisThe activity risk assessment further refines the Company’s risk assessment at key activity level relevant to the achieving ofobjectives and ensures that risk management initiatives are duly prioritised and resourced.
• Operational risk managementThe Board influences the control environment by setting ethical values and organisational culture while ensuring thatmanagement styles, delegated authorities, business plans and management competency are appropriate, effective and efficient.
Operational risks are managed mainly by means of internal control. This is a process designed to provide reasonable assuranceregarding the achievement of organisational objectives and to reduce the possibility of loss or misstatement to within acceptedlevels. The effectiveness of risk management is measured by the level of reduction of the Company’s cost of risk.
Risk management principles along with internal controls are embedded into the daily activities of the Company. Anautomated risk management tool, Risk Minimiser®, supports this process and delivers self-assessment functionality to linemanagers by translating controls, benchmarked and linked to key performance indicators, into daily activity lists. The systemsupports the values of transparency, mutual respect and accountability. Key outputs from the system include:
• Assurance regarding compliance with key controls• Exception reporting regarding control deviations• Real-time risk profiles based on validated data• Cost of risk and incident monitoring• Electronic distribution of all relevant policies, procedures, laws and practices from centrally updated databases• Automated communication and tracking of control enhancement activities
Management structures have been established to focus on certain key risk activities, including safety, health, environment,security, tax and risk funding.
• TreasuryGiven the nature and its extent, control of treasury risk is regarded as important. The Group uses the central treasurydepartment of M&I, whose responsibility it is to manage the risks associated with interest rates, liquidity, compliance andcredit and foreign exchange transactions in accordance with a written mandate.
A treasury committee, constituted of nominated members of the Risk and Audit Committee and senior management, isresponsible for determining policy and procedures as well as clearly defined levels of competency and risk acceptance and givesregular feedback to the Board.
�

r e m g r o l i m i t e d34
CORPORATE GOVERNANCE
• Risk fundingRisk funding is viewed as a cost of capital activity aimed at reducing the Company’s residual exposures to risk with potentialcatastrophic impacts or risks which cannot be managed cost beneficially.
• Integrated assuranceThe Board does not only rely on the adequacy of the control embedment process but regularly receives and considers reportson the effectiveness of risk management activities. The Audit and Risk Committee ensures that the assurance functions ofmanagement as well as internal and external audit are sufficiently integrated.
The various assurance providers to the Board comprise the following:
• The Executive Committee and senior management consider the Company’s risk strategy and policy along with theeffectiveness and efficiency thereof.
• The Audit and Risk Committee focuses on reviewing the adequacy of risk management strategies, systems of internalcontrol, risk profiles, legal compliance, internal and external audit reports and also reviews the independence of the auditors,the extent and nature of their engagements, coverage and findings. This committee also reviews the level of disclosure inthe annual reports and the appropriateness of policies adopted by management, the fraud register and other loss incidentsreported. The Board reviews the functionality of the audit and risk committee against its charter.
Internal auditThe Company has an internal audit function, which has been outsourced to M&I’s Risk Management and InternalAudit department. It is an effective independent appraisal function and employs a risk-based audit approach, formallydefined in accordance with the Institute of Internal Auditors’ (IIA) definition of internal auditing and documented ina charter approved by the Board. The head of this department has direct access to the chairman of the Audit and RiskCommittee as well as to the chairman of the Group.
External auditThe Company’s external auditors attend all Audit and Risk Committee meetings and have direct access to the chairmanof the Audit and Risk Committee. Their audit coverage is adequately integrated with the Internal Audit functionswithout their scope being restricted.
Other services provided by the auditing firm mainly relate to tax matters and are effected by a department independentto the audit partners. Independence is further assured by terms of appointment.
The Audit and Risk Committee has reviewed the risk management programmes and systems of internal control of the Companyand its dependent wholly-owned subsidiaries for the financial year to 31 March 2005. Transvaal Sugar and Wispeco are consideredto be independent. The directors are of the opinion that, based on inquiries made and the reports from the internal and externalauditors, the risk management programmes and systems of internal control were effective for the period under review.
The Audit and Risk Committee has also satisfied itself that there are effective audit committees functioning at the Company’sindependent subsidiaries and associated companies.
�

r e m g r o l i m i t e d35
CORPORATE GOVERNANCE
DEALINGS IN SECURITIES In accordance with the Listings Requirements of the JSE, the Company has adopted a code of conduct for insider trading. Duringthe closed period directors and designated employees are prohibited from dealing in the Company’s securities. Directors anddesignated employees may only deal in the Company’s securities outside the closed period, with the authorisation of the chairmanor the managing director. The closed period lasts from the end of a financial reporting period until the publication of financialresults for that period. Additional closed periods may be declared from time to time if circumstances warrant it.
JSE – SRI INDEX Remgro, as part of its Corporate Governance Accreditation process, chose to participate in the JSE – SRI index. Since itsinception, Remgro has qualified in terms of the specified accreditation criteria.
ATTENDANCE AT MEETINGS
Audit and Remuneration andExecutive Risk Nomination
Directorate Committee Committee Committee
Number of meetings held 7 5 4 1
Attendance by directorsJ P Rupert 7 1M H Visser 7 5P E Beyers 7W E Bührmann 6 5G D de Jager 6J W Dreyer 7D M Falck 7 5 4P K Harris 3 1E de la H Hertzog 7E Molobi 3J F Mouton 6 3 1J A Preller 7 5D Prins * 7 1F Robertson 6 1 –T van Wyk 7 5
* Mr D Prins was appointed as chairman of the Audit and Risk Committee on 28 August 2004 and has since attended all the meetings.
�

r e m g r o l i m i t e d36
SUSTAINABILITY REPORT
As Remgro is an investment holding company, disclosure regarding sustainability is limited to that of the Company and its
wholly-owned subsidiaries, including Wispeco and Transvaal Sugar. Social and sustainability reporting for listed investees
and private associate companies is contained in the reports of those entities.
The main aspects to report on are as follows:
STAKEHOLDER RELATIONSThe following are recognised as stakeholders in the Company:
• Shareholders and lenders as providers of capital• The State as policy maker and regulator• The investment community as interested party• The community, through the creation of employment, and part benefactor of taxes paid by profitable organisations and as a
recipient of social contributions
The Board regularly reviews its strategies against the requirements of the stakeholders to ensure balanced long-term growth andthe viability of the Company and the environment in which it operates.
GROUP ETHICS Dr Anton Rupert, founder of the Group, which today includes Remgro Limited, more than 40 years ago drew up guidelines fordoing business successfully. These guidelines developed into what is today Remgro’s value system. The Company believes thatthese values incorporate the spirit in which it strives to be a good corporate citizen. It furthermore believes that ethical behaviourstems from the value system, as communicated and demonstrated by the Board of Directors.
Remgro’s commitment to ethical behaviour is contained in the following documents:
• Code of ethics• Code of conduct• Fraud prevention policy • Internet policy• Disciplinary code
SAFETY AND ENVIRONMENTThe Company has a duly constituted safety and health committee, as required by the Occupational Health and Safety Act. Thiscommittee assists the Board in ensuring that the Company provides and maintains a safe and healthy risk-free environment forstaff and visitors by identifying risks and ensuring that controls designed to mitigate these risks are effective and complied with.
Most of the Company’s core activities are regarded as having a low impact on the environment.
The Company benchmarks its current environmental practices against the criteria stipulated in the Global Reporting Initiative™(GRI) Framework. These include:
• Materials• Energy• Water• Biodiversity• Emissions, effluents and waste• Suppliers• Products and services• Compliance• Transport
�

r e m g r o l i m i t e d37
SUSTAINABILITY REPORT
Where deemed appropriate, usage and impact are being quantified and measured against best practices. Where appropriate,compliance with safety, health and environmental systems are measured against formal standard systems such as ISO and subjectto independent review. Boards monitor capital projects aimed at reducing environmental usage while increasing biodegradablerecycling.
HIV/AIDS POLICY During February 2003, the GRI published a resource document to serve as a reporting guidance for HIV/Aids. Because the GRIchose South Africa as the development area for this resource document, which will eventually become a technical protocol,Remgro uses this document as its reporting standard.
From an investment holding company perspective, the risk of HIV/Aids comprises two elements, namely:
Group risk Given the potential impact of HIV/Aids on the markets, on human capital cost of employment and on the operational processesof the various businesses invested in, this risk is managed within the governance structures of the various companies.
The progress of these policies and strategies is monitored against best practice standards.
Company riskRemgro and M&I have a formal HIV/Aids policy and are committed to manage the pandemic, and the business risks associatedwith it, actively. The policy makes provision, inter alia, for the following:
• Compliance with all legal requirements as far as HIV/Aids is concerned• No discrimination against employees or potential employees based on their HIV status• Strict confidential treatment of information on the HIV status of employees• General measures to prevent accidental infection
Remedi Medical Aid Scheme, of which most of M&I’s staff are members, has a management plan for HIV/Aids in whichemployees can choose to participate.
EMPLOYEES
Summary of employees of the operating subsidiaries 2005 2004Medi-Clinic Corporation 11 635 11 320Rainbow Chicken 7 121 5 239Wispeco 768 679Transvaal Sugar 2 791 3 004Other 11 11
22 326 20 253
The employees of M&I, the service company of the Group, are not included above as M&I is not a subsidiary 195 198
The boards of directors of the individual operating subsidiaries are responsible for their own strategies regarding employmentequity, HIV/Aids programmes, training and other personnel matters. Further analyses in categories are therefore not given here.
�

r e m g r o l i m i t e d38
SUSTAINABILITY REPORT
EMPLOYMENT EQUITYM&I, the service company, strives, in accordance with the Employment Equity Act, to afford all staff the opportunity to realisetheir full potential.
A steering committee and various work groups, together with M&I’s management, are continuously involved in determiningtraining and development needs and in implementing and monitoring a labour plan. Special attention is given to those groupswhich, because of historic reasons, may be in a disadvantaged position.
In accordance with the requirements of the Employment Equity Act, M&I annually submits a labour plan to the Department of Labour.
Because of the nature of its operations, inter alia to provide core services to Remgro, M&I’s work force is characterised by the following:
• A high level of expertise within the top structure of the organisation and in various specialised divisions• A young employee profile, especially with regard to management• A low turnover rate of staff and, consequently, limited opportunities for new appointments
M&I believes that the quality of its staff is an important sustainable competitive advantage. Therefore it believes that its successdoes not lie in the uniformity of its staff, but in the diversity and development of their collective talents. For these, space andopportunity will always be created.
Human resource policies and procedures also address the issues of non-discrimination, child labour, disciplinary practices, humanrights et al.
BEE – BLACK ECONOMIC EMPOWERMENTThe Board believes that BEE is a social, political and economic imperative and we therefore support the Company’s subsidiariesand associated companies’ initiatives to give impetus to the BEE process in their industries. Although the ideal is to supportpeople to realise their full potential, special focus is needed on those who, for historical reasons, have lagged behind. The aim isto enable them to compete on merit in the market. We look forward to the day when all South Africans, especially our children,can fully participate in our economy on a non-racial and equal basis.
�

r e m g r o l i m i t e d39
SUSTAINABILITY REPORT
SOCIAL INVESTMENTCorporate citizenship, namely the commitment of business to contribute to sustainable economic development, endorses theprinciple that no business exists in isolation but is undeniably part of the environment in which operations take place. In itsrelations with all stakeholders (clients, personnel and the community), Remgro strives to be a value partner.
Donations to deserving institutions are usually made over specific terms and are not spread over such a broad area that the extentand effect become negligible. During the past year, the Company has been involved in the following projects and institutions:
Entrepreneurship and trainingSome years ago Remgro and its sister company VenFin granted a loan to the Peace Parks Foundation (PPF) to be used for theactivities of the SA College for Tourism in Graaff-Reinet and the Southern African Wildlife College near the border of the KrugerNational Park. Both colleges are involved in practical training and job creation.
SA College for Tourism – This college in Graaff-Reinet trains especially young black women from previouslydisadvantaged communities for the hospitality industry. Since the establishment of the College in 2001, more than 100 womenfrom the Southern African Development Community have been trained. Last year’s students came from Botswana, Lesotho,Malawi, Mozambique, Swaziland, Zambia and Zimbabwe.
Subjects offered include: culinary arts, food and beverage studies, room and front-of-house services, guesthouse management aswell as entrepreneurship. The students also gain experience at many big functions held throughout the year.
The College enjoys the support of prominent women in Southern Africa. In 2002 South Africa’s First Lady, Mrs Zanele Mbeki,officially opened the College, while Mrs Barbara Mogae, First Lady of Botswana, delivered the keynote address at last year’sgraduation ceremony.
South African Wildlife College – trains students from many countries in Southern Africa as well as from otherparts of Africa in nature conservation management. The College also attends to other aspects of human development. Coursesare presented in communication and computer skills, office and basic financial management, tourism management and humanresources management, to mention only a few. PPF and WWF-SA are jointly responsible for the management of the College.
Although the College is not a charity organisation, it strives to cultivate a conservation ethic within the community through itsinvolvement in initiatives such as the maintenance of a borehole, support of a local bakery, assistance rendered to a crèche,empowerment courses for women and fundraising for a local clinic.
SciMathUS – This post-matric programme from the Institute for Mathematics and Science Teaching at the University ofStellenbosch reaches an important milestone this year when students from the first class in 2001 will graduate from the Universityof Stellenbosch and other Western Cape tertiary institutions. Remgro is a founder sponsor of the project.
The aim of the SciMathUS project is to provide students from disadvantaged communities the opportunity to improve their matric results in subjects such as mathematics, science and accountancy in order to gain access to tertiary education. Last year all 64 students who rewrote these subjects qualified for mainstream tertiary education. On average, their 2004 results saw a 16% improvement for mathematics compared to their 2003 school results, 19% for physical science and 14% for accountancy.
�

r e m g r o l i m i t e d40
SUSTAINABILITY REPORT
Paul Roos Academy – In many respects 2004 was a year of firsts for the Academy. It was the first year that the organiserscould see how many children would return after the completion of the school year; also the first year that girls gained access tothe Academy; a year in which the relevance of the curriculum could be tested by offering it to a second group of learners; and theyear when a new curriculum had to be developed for the returning grade 8 learners.
Of the 61 learners who participated in the 2003 programme, 58 returned in 2004, proof surely of a positive experience of this learning intervention. For 2004, 40 boys and 40 girls were selected, but in the end only 72 of the grade 7 learners showed up.A total of 130 learners therefore received additional training last year.
The Academy, of which Remgro is a founder sponsor, is an imaginative project aimed at identifying leadership talent indisadvantaged schools. Through tuition during holidays it helps these children to realise their full potential. The participatingschools consist of five in Khayelitsha, Nyanga and Langa and seven farm schools in the Stellenbosch area.
Rally to Read – For the third consecutive year, Remgro has supported this outreach project aimed at improving the rate ofliteracy at some of the country’s most neglected schools. Since 1998 more than R12.5 million has been invested in this project toimprove the quality of education. As part of the programme, off-road vehicles are used annually during May to deliver educationalmaterials such as books and toys to some of the country’s poorest schools. This year, books valued at R2.5 million were donated,while a teacher development programme of at least R1.3 million was launched.
Independent research has shown that after a two-year READ intervention in a school, learners on average advance two years inreading skills and four years in writing skills.
Environment WWF-South Africa – As a corporate member, Remgro has supported this conservation organisation since itsestablishment in 1968. During the past year, WWF-SA redesigned itself and the way it tackles the complexity of the environment.As part of this reorganisation, conservation activities were grouped into distinct programmes that target specific aspects of theenvironment.
Highlights of the past year’s activities included the following:
• Some 340 schools registered with the WWF-SA/WESSA (Wildlife & Environment Society of SA) Eco-SchoolsProgramme of which 110 were awarded their green flags for 2004.
• The exclusive Thonga Beach Lodge opened for business in August. As part of the Sappi/WWF TreeRoutes partnership, thisinnovative ecotourism venture provides jobs for the Mabibi community and will contribute to the conservation of theMaputaland Coastal Forest Reserve on the north coast of KwaZulu-Natal.
• The Mondi Wetlands Project, a freshwater conservation partnership between WESSA and WWF-SA, continues torehabilitate wetlands, train extension officers and engage with local communities to strengthen wetland management aroundthe country.
• The Minister of Environmental Affairs and Tourism, Mr Marthinus van Schalkwyk, announced the proclamation of four newMarine Protected Areas. WWF presented the government with a Gift to the Earth award in July last year in support of thisproject.
�

r e m g r o l i m i t e d41
SUSTAINABILITY REPORT
Cultural development Klein Karoo National Arts Festival – Remgro’s sponsorship of this festival is used mainly for community projects.This year, a group of talented children took part in street performances during the festival, while special performances were alsoheld in Bongolethu. The latter was so successful that the organisers were at one stage asked to stop any further marketing!
The first winner of the Remgro/VenFin bursary for the development of a career in the arts was announced during the festival.Avigail Bushakovitz is a talented violinist who receives instruction from Prof Jack van Wyk in Cape Town. The panel of judgesdescribed her as exceptionally talented and a violinist who has a bright future ahead of her.
Stellenbosch Music Festival – Remgro sponsored the concert of the Sontonga String Quartet, one of the country’sleading string quartets, during the festival. Young string players of development projects in Kayamandi, Hout Bay and Paarlattended the concert and this persuaded Sontonga to hold workshops for these music projects. When approached on short notice,the Company also agreed to bear the cost of the Buskaid Soweto String Ensemble whose sponsorship fell through at the lastminute.
Sport development SA Golf Development Board (SAGDB) – The promotion of golf amongst the youth in disadvantaged communitieswent from strength to strength during the fifth year of the SAGDB’s existence. During this period approximately 7 000 childrenbetween the ages of 7 and 18 years were introduced to the game through this initiative. Proof of the success of the programme todate has been the promotion of 11 players to join the “crème of the crop” in the Ernie Els Foundation.
Limpopo, Mpumalanga and North West are the only provinces not yet reached by the golf project – an issue which will receiveattention this year. Remgro and its sister company VenFin are responsible for the administrative costs of the SAGDB.
Western Cape Cricket Academy – Remgro has recently extended its sponsorship of the Cricket Academy for afurther term of three years. The Academy is held in high esteem by the cricket fraternity and some 120 applications are receivedannually, of which only 36 can be approved. Since its inception in 1993, nine Academy players have played for South Africa anda further 16 for other national teams. Boland used 30 Academy players over the years in its provincial side and WP 22. The roleof the Academy as seedbed for the southern provinces can clearly been deduced from these statistics.
Community development Ikamva Labantu – This welfare organisation in the black townships of Cape Town went through a very difficult phase whenRemgro committed itself for an initial period of five years to sponsor a portion of the administrative costs of this developmentproject.
Instead of spending most of its time on survival issues, Ikamva Labantu could, in the years that followed, focus its attention oninnovative ways to reach target groups; appoint professional staff; and, rather than looking inward, could improve externalcommunication and networking.
Ikamva Labantu’s focus remains on early childhood development, foster care, youth development, the visually impaired, home-based care, frail care, health care, poverty alleviation as well various other community programmes.
�

r e m g r o l i m i t e d42
SUSTAINABILITY REPORT
Health careWits/Donald Gordon Medical Centre – is being developed to build a teaching and research network in theprivate healthcare sector. It is modelled on well-known American academic hospitals such as the Mayo Clinic, Harvard’sMassachussets General Hospital and the Stanford University Hospital. Remgro and VenFin have agreed to contribute $1 millionover ten years to the centre.
The need for such a facility has its origin in the government’s increased focus on primary and community health, which hasresulted in tertiary hospitals having increasingly fewer resources available to fund medical posts. In addition, because of a wideningof the salary gap between the private and the public sector, academic hospitals are no longer able to retain their best people.
Organ Donor Foundation of SA – During the past year, the lives of approximately 500 people have been saved byorgan transplantation. Remgro is grateful that it could make a small contribution to this end by sponsoring four flights for thetransport of organs. We would like to thank our staff at Falconair for sacrifices made in this regard.
�

FINANCIAL REPORT
2005�

r e m g r o l i m i t e d44
CONTENTS
STATEMENT OF RESPONSIBILITY BY THE BOARD OF DIRECTORS 45
STATEMENT BY THE COMPANY SECRETARY 46
REPORT OF THE INDEPENDENT AUDITORS 46
REPORT OF THE BOARD OF DIRECTORS 47
ACCOUNTING POLICIES 56
BALANCE SHEETS 62
INCOME STATEMENTS 63
STATEMENTS OF CHANGES IN EQUITY 64
CASH FLOW STATEMENTS 65
NOTES TO THE ANNUAL FINANCIAL STATEMENTS 66
ANNEXURE A – PRINCIPAL SUBSIDIARY COMPANIES 86
ANNEXURE B – PRINCIPAL INVESTMENTS 87
ANNEXURE C – SIGNIFICANT ASSOCIATED COMPANIES 88
ANNEXURE D – INFORMATION ON BUSINESS AND GEOGRAPHICAL SEGMENTS 90
ANNEXURE E – BUSINESSES ACQUIRED 92
COMPANY INFORMATION 93
SHAREHOLDERS’ INFORMATION 94
NOTICE TO SHAREHOLDERS 98
EXPLANATORY NOTES TO THE NOTICE TO SHAREHOLDERS 102
FORM OF PROXY ATTACHED
�

r e m g r o l i m i t e d45
STATEMENT OF RESPONSIBILITY BY THE BOARD OF DIRECTORS
The directors are responsible for the maintenance of adequate accounting records and the preparation and integrity of the
annual financial statements included in this Annual Report. The independent auditors are responsible for reporting on
the annual financial statements.
The annual financial statements are prepared, in accordance with South African Statements of Generally Accepted AccountingPractice and the requirements of the South African Companies Act, on the going concern basis and incorporate full andresponsible disclosure. The annual financial statements are based upon appropriate accounting policies which are in accordancewith those of the previous year, with the exception of the implementation of the South African Statements of Generally AcceptedAccounting Practice, AC 140 (IFRS 3): Business combinations, AC 128 (IAS 36): Impairment of assets, AC 129 (IAS 38):Intangible assets and AC 501: Accounting for secondary taxation on companies (STC), and supported by reasonable and prudentjudgements and estimates.
The directors are of the opinion that the Group will continue as a going concern in the future.
Signed on behalf of the Board of Directors.
Johann Rupert Thys VisserChairman Chief Executive Officer/Deputy Chairman
Stellenbosch21 June 2005
�

r e m g r o l i m i t e d46
STATEMENT BY THE COMPANY SECRETARY
�I, Mariza Lubbe, being the Company Secretary of Remgro Limited, hereby certify that all returns required of a public companyhave, in respect of the year under review, been lodged with the Registrar of Companies and that all such returns are true, correctand up to date.
Mariza LubbeSecretary
Stellenbosch21 June 2005
REPORT OF THE INDEPENDENT AUDITORSTO THE MEMBERS OF REMGRO LIMITED
�We have audited the annual financial statements and Group annual financial statements of Remgro Limited set out on pages 47 to 92 for the year ended 31 March 2005. These financial statements are the responsibility of the Company’s directors.Our responsibility is to express an opinion on these financial statements based on our audit.
SCOPEWe conducted our audit in accordance with statements of South African Auditing Standards. Those standards require that weplan and perform the audit to obtain reasonable assurance that the financial statements are free of material misstatement. An auditincludes:
• examining, on a test basis, evidence supporting the amounts and disclosures included in the financial statements,• assessing the accounting principles used and significant estimates made by management, and • evaluating the overall financial statement presentation.
We believe that our audit provides a reasonable basis for our opinion.
AUDIT OPINIONIn our opinion, the financial statements fairly present, in all material respects, the financial position of the Company and Groupat 31 March 2005 and the results of their operations, changes in equity and cash flows for the year then ended in accordance withSouth African Statements of Generally Accepted Accounting Practice, and in the manner required by the Companies Act in South Africa.
Registered Accountants and AuditorsChartered Accountants (SA)
Stellenbosch21 June 2005
r e m g r o l i m i t e d47
REPORT OF THE BOARD OF DIRECTORSFOR THE YEAR ENDED 31 MARCH 2005
Dear Shareholder
The Board has pleasure in reporting on the activities and financial results for the year under review.
NATURE OF ACTIVITIESThe Company is an investment holding company. Cash income is derived mainly from dividends and interest. The consolidatedannual financial statements of the Company and its subsidiaries also incorporate the equity accounted attributable income ofassociated companies.
The Group’s interests consist mainly of investments in tobacco products, banking and financial services, printing and packaging,building and motor components, life assurance, medical services, mining, petroleum products, food, wine and spirits and variousother trade mark products.
RESULTS
Year ended 31 March: 2005 2004Headline earnings (R million) 4 982 4 687– per share (cents) 1 001.8 931.3– diluted (cents) 998.7 929.3
Basic earnings – net profit for the year (R million) 8 807 3 605– per share (cents) 1 771.0 716.3– diluted (cents) 1 765.4 714.8
Dividends (R million)* 1 639 2 532– ordinary – per share (cents) 314.00 285.00– special – per share (cents) ** 200.00
* A final dividend of 198 cents (2004: 184 cents) per share was declared after the year-end and consequently not provided for in the annualfinancial statements.
** Refer to the paragraph headed “Cash flow and utilisation” on page 49.
INVESTMENTSThe most important changes during the year under review were as follows:
Tobacco interestsIn May 2004, optionholders exercised the call warrants that were issued by R&R Holdings SA, Luxembourg (R&R), in January 2003 in respect of the BAT preference shares. These preference shares were converted into ordinary BAT shares and, asa result, Remgro’s effective interest in BAT declined from 9.8% to 9.3%.
On 28 February 2005, Remgro’s wholly-owned subsidiary Remgro Investments Limited ( Jersey) invested £188.0 million in 19 281 686 participation securities issued by R&R. This was funded by the proceeds of the redemption by R&R of debenturesamounting to £564.7 million. Remgro and Richemont received £188.2 million and £376.5 million respectively. The debenturesthat were redeemed formed part of the consideration received from the Rothmans International merger on 1 October 1995.As set out in the 1996 Rembrandt Group Limited Annual Report, no book value was reflected in the group accounts in respectof the original investment in R&R. As a result, the gross proceeds received by Remgro upon redemption of the debentures hasbeen recorded as an exceptional profit.
The participation securities entitle Remgro to all the rewards and risks of directly owning the same number of ordinary shares inBAT. The participation securities can be redeemed by R&R either by delivery of the appropriate number of BAT ordinary shareson a one-for-one basis, or by the payment by R&R to the holder of the proceeds from the disposal of the appropriate number ofBAT ordinary shares.
�

r e m g r o l i m i t e d48
REPORT OF THE BOARD OF DIRECTORSFOR THE YEAR ENDED 31 MARCH 2005
As Remgro and Compagnie Financière Richemont SA (Richemont) hold an interest of one-third and two-thirds respectively inR&R’s ordinary share capital, and as the transaction did not affect the total number of BAT shares owned by R&R, Remgro andRichemont, as ordinary shareholders, both surrendered their indirect interest in 19 281 686 ordinary BAT shares on a pro ratabasis. At the same time Remgro, as an ordinary shareholder, acquired a one-third interest in the £188.0 million cash obtained byR&R from issuing the participation securities.
The net result was that Remgro’s effective interest in BAT increased by 12 854 457 shares at a cost of £124.9 million, excludingtransaction costs. At 31 March 2005 Remgro’s effective interest in BAT was 10.03%.
Vector Logistics (Proprietary) Limited (Vector)During the year under review Remgro’s subsidiary company, Rainbow Chicken Limited (Rainbow), acquired a 100% share inVector for R456 million. Vector currently distributes approximately 70% of Rainbow’s products.
Henkel South Africa (Proprietary) Limited (Henkel)During October 2004 Remgro sold its 50% interest in Henkel for R80 million. An after-tax capital surplus of R43.9 million wasrealised and is accounted for as an exceptional item.
Sage Group Limited (Sage)During January 2005 Remgro advanced R95.0 million to Sage in order to enable it to settle certain debt instruments. Interest ischarged at market-related rates and the loan is repayable by 31 October 2005. Please refer to the Sage paragraph under“Subsequent to the year-end”.
Repurchase of sharesDuring the year under review, a wholly-owned subsidiary company of Remgro acquired a further 14 079 239 ordinary Remgroshares (2.9% of the ordinary shares) at an average price of R87.69 for a total amount of R1 234.6 million. Together with thoseshares acquired in previous financial years, a total of 30 521 841 (6.3%) are held as treasury shares.
During the year under review, The Remgro Share Trust purchased 660 018 (2004: 711 000) ordinary Remgro shares at an average price of R90.93 (2004: R65.43) for a total amount of R60.0 million (2004: R46.5 million). During the year under review514 946 shares were delivered to participants against payment thereof.
SUBSEQUENT TO THE YEAR-ENDAbsa Group Limited (Absa)
On 5 May 2005, Barclays Bank Plc (Barclays) made an offer to Absa shareholders to acquire a 60% interest in Absa (the Barclaystransaction). Remgro entered into an agreement with Barclays whereby Remgro undertook to dispose of all or part of its interestin Absa.
The Barclays transaction will be implemented through two inter-conditional processes:
• a scheme of arrangement in terms of section 311 of the Companies Act, whereby Barclays will acquire 32% of the Absaordinary shares held by each Absa ordinary shareholder, excluding the Absa Group Limited Share Incentive Scheme Trustand Barclays and its subsidiaries, except to the extent that they hold Absa shares on behalf of third parties; and
• a partial offer by Barclays to acquire an additional 28% of Absa ordinary shares held by each Absa ordinary shareholder.
The consideration amounts to R82.50 per share, plus the entitlement to receive the final dividend of R2.00 per share declared byAbsa in respect of its financial year to 31 March 2005.
�

r e m g r o l i m i t e d49
REPORT OF THE BOARD OF DIRECTORS FOR THE YEAR ENDED 31 MARCH 2005
To the extent that Barclays does not secure sufficient acceptances to reach the required level of a 60% shareholding in Absa,Remgro has agreed to tender additional Absa shares, up to Remgro’s total shareholding, as part of the partial offer. Barclays willacquire such additional shares from Remgro on the same terms and conditions as all other Absa shares subject to the Barclaystransaction.
The effective date of the disposal will be determined by the operative date of the scheme of arrangement and the record date ofthe partial offer.
FirstRand Limited (FirstRand)In May this year, FirstRand announced that all conditions precedent regarding its proposed black economic empowerment (BEE)transaction had been complied with. The operative date of the scheme was 16 May 2005.
In terms of this transaction, FirstRand has bought back approximately 416.2 million ordinary shares on a pro rata basis from allshareholders in the ratio of 7.6 ordinary shares for each 100 ordinary shares held. The price per ordinary share amounted toR12.28 and in terms of this transaction Remgro received R486.0 million on 16 May 2005. At the same time FirstRand issued119 million ordinary shares to the BEE consortium, with the result that Remgro's direct interest in FirstRand has been dilutedfrom 10.0% to 9.4%.
This transaction also diluted RMB Holdings Limited’s (RMBH) interest in FirstRand from 34.4% to 32.2%. After thistransaction, Remgro’s total interest in FirstRand, including the indirect interest held by RMBH, is 16.8%.
SageOn 20 May 2005 Momentum Group Limited (Momentum), a wholly-owned subsidiary of FirstRand, announced that it hassubmitted an offer to acquire all the issued shares in Sage, other than those held by Sage Life Limited, by way of a scheme ofarrangement in terms of section 311 of the Companies Act.
The consideration payable in terms of the scheme shall be R634 million, or R1.75 per Sage share, comprising an initial paymentof R1.42 per share and a potential subsequent payment of up to a maximum of R0.33 per share. As security for certain potentialcontingent taxation-related liabilities, an amount of R120 million of the cash consideration will be held in an escrow account.Once the potential tax liabilities have been resolved, the escrow amount will be reduced and the balance will be distributed to Sageshareholders pro rata to their shareholding.
Remgro gave an irrevocable undertaking to Momentum to vote in favour of the proposed scheme and also agreed that therepayment of the R95 million loan to Sage be postponed to 31 October 2005.
CASH FLOW AND UTILISATIONThe Company’s cash resources at 31 March 2005 are as follows:
Local Offshore TotalR million R million R million
Per consolidated balance sheet 2 060 312 2 372 Less: Cash from other operating subsidiaries (1 278) – (1 278)Cash at the centre 782 312 1 094 Attributable share of R&R’s cash – 2 778 2 778 Available cash 782 3 090 3 872
�

r e m g r o l i m i t e d50
REPORT OF THE BOARD OF DIRECTORSFOR THE YEAR ENDED 31 MARCH 2005
In the light of the 7.6% increase in headline earnings per share, the Board has decided to increase the ordinary dividend per shareby 10.2% from 285 cents to 314 cents for the financial year ended 31 March 2005. The increase in the final dividend is 7.6%.
Local cash at the centre may increase substantially subsequent to year-end. Over and above normal cash flows from dividendincome, the proceeds of the FirstRand transaction have already been received and those of the Absa and Sage transactions arereceivable as soon as all conditions precedent are fulfilled.
It is the Board’s intention to also declare a special dividend of 600 cents per share shortly after, and subject to, the Absa transactionbeing declared unconditional. The salient dates of the special dividend will then be announced on SENS and distributed toshareholders.
On the assumption that the Absa transaction goes ahead and Remgro sells at least 60% of its Absa shares to Barclays, the Groupwill still have sufficient cash resources to pursue further investment opportunities and to continue its share repurchase programme.
If the special dividend referred to above is also declared, the total distribution to shareholders in respect of the financial year willbe R4 771 million and be made up as follows:
(Based on total issued capital) 2005 2004R million R million
Ordinary– Interim 606 527– Final 1 033 961Total 1 639 1 488 Special 3 132 1 044
4 771 2 532
GROUP FINANCIAL REVIEWPrior year adjustments
Changes in accounting policy AC 140 (IFRS 3): Business combinations and related accounting statements
With effect from 1 April 2004 Remgro adopted AC 140 (IFRS 3), AC 128 (IAS 36): Impairment of assets and AC 129 (IAS 38): Intangible assets. In terms of the provisions of AC 140, goodwill arising from a business combination for which theagreement date is on or after 31 March 2004, will not be amortised, but be carried at cost less accumulated impairment losses.
As from 1 April 2004 all goodwill that already existed on this date is also treated in accordance with AC 140. All existinggoodwill is therefore no longer amortised but carried at cost less accumulated impairment losses. Due to the fact that thecomparative figures are not restated under the transitional provisions of AC 140, certain items are not directly comparable ona line-for-line basis with those of the prior year.
AC 501: Accounting for secondary tax on companies (STC)In terms of this accounting statement, a deferred tax asset should be recognised for unutilised STC credits to the extent thatit is probable that the entity will declare dividends against which the STC credits can be utilised.
Remgro’s history regarding dividends received against ordinary dividends paid suggests increasing STC credits over time.It is therefore not likely that Remgro’s STC credits will be employed against ordinary dividends paid in the foreseeable future,and consequently no deferred tax asset has been created for the Company’s unutilised STC credits. For particulars aboutRemgro’s STC credits on 31 March 2005 refer to note 22.
A subsidiary company, Medi-Clinic Corporation Limited, has however recognised a deferred tax asset for its unutilised STCcredits in terms of AC 501, and its comparative figures for 2004 have been restated accordingly. This has had no effect onRemgro’s earnings for the comparative year. The comparative balance sheet has been restated accordingly.
�

r e m g r o l i m i t e d51
REPORT OF THE BOARD OF DIRECTORS FOR THE YEAR ENDED 31 MARCH 2005
Other adjustmentsRestatement of comparative figures in respect of inventories
During the year Transvaal Sugar Limited changed its revenue recognition policy in respect of sugar sales from a seasonalbasis to an accrual basis. This had the effect that carry-over sugar inventory, which was previously recognised as revenue, isnow accounted for as inventory. The effect on Remgro’s 2004 results was a decrease in headline earnings of R32 million. Thecomparative balance sheet has been restated accordingly.
Restatement of comparative figures relating to goodwillAs reported above Remgro adopted AC 140 (IFRS 3), AC 128 (IAS 36) and AC 129 (IAS 38) with effect from 1 April 2004.In terms of these accounting standards goodwill is tested annually for any possible impairments, and for this purpose it isallocated to the different cash-generating units to which it relates.
Consequently, goodwill attributable to investments in associated companies is reported under “Investments – Associatedcompanies” in the 2005 annual financial statements while previously it was reported under “Goodwill and trade marks”.The comparative balance sheet has been restated accordingly.
Restatement of prior year figures as a result of the above-mentioned adjustments
Year ended31 March 2004
R millionIncome statementHeadline earnings as previously reported 4 719Restatement of comparative figures in respect of inventories (32)Restated headline earnings 4 687
Headline earnings per share as previously reported (cents) 937.6Restated headline earnings per share (cents) 931.3
R millionBalance sheetDecrease in reserves (57)Increase in minority interest 2Decrease in goodwill and trade marks (3 192)Increase in investments – associated companies 3 192Increase in deferred tax assets 37Increase in current assets 164Decrease in deferred tax liability (28)Increase in current liabilities 284
�
r e m g r o l i m i t e d52
REPORT OF THE BOARD OF DIRECTORSFOR THE YEAR ENDED 31 MARCH 2005
International Financial Reporting Standards (IFRS)With effect from 1 April 2005 Remgro will implement IFRS and in the Group’s financial statements for the year ending 31 March 2006 the comparative figures for 2005 will be restated accordingly. In the announcement of the interim results for thesix months ending 30 September 2005, which will be presented in terms of IFRS, the effects of these new accounting standardswill be fully disclosed.
Balance sheetThe analysis of “Equity” and of “Source of headline earnings” below reflects the divisions into which the interests have beenclassified. Each division represents the main business sector of the investments classified thereunder. No adjustment has been made where companies are mainly active in one sector but also have interests in other sectors.
2005 2004R per R per
R million share R million shareEquity employedInterest of own members 34 960 71.77 29 709 59.26Employment of equityTobacco interests 13 725 28.18 8 709 17.37Financial services 10 184 20.91 9 205 18.36Industrial interests 8 039 16.50 7 194 14.35Mining interests 1 923 3.95 1 977 3.94Corporate finance and other interests 1 089 2.23 2 624 5.24
34 960 71.77 29 709 59.26
Income statement
2005 2004R million % R million %
Source of headline earningsTobacco interests 2 029 41 2 100 45Financial services 1 695 34 1 394 30Industrial interests 1 125 22 995 21Mining interests 101 2 172 3Corporate finance and other interests 32 1 26 1
4 982 100 4 687 100
2005 2004R million R million
Composition of headline earningsSubsidiary companies and joint ventures 594 573
Profits 597 578Losses (3) (5)
Associated companies 4 388 4 114
Profits 4 390 4 117Losses (2) (3)
4 982 4 687
�

r e m g r o l i m i t e d53
REPORT OF THE BOARD OF DIRECTORS FOR THE YEAR ENDED 31 MARCH 2005
COMPANY NET PROFIT AND APPROPRIATION2005 2004
R million R millionThe Company’s own distributable reserves at the beginning of the year amounted to 7 692 7 676Net profit for the year 2 904 1 378Dividend No 8 of 184.00c per share paid in August 2004 (2003: 160.00c) (960) (835)Special dividend of 200.00c per share paid in August 2004 (1 044) –Dividend No 9 of 116.00c per share paid in January 2005 (2004: 101.00c) (606) (527)The Company’s own distributable reserves carried forward to the following year amounted to 7 986 7 692
SHARE SCHEMEDuring the year the trustees of the Remgro Share Scheme (the “scheme”) offered ordinary shares to participants as follows(also refer note 29):
NumberOffer Number of sharesprice of shares accepted as at
Date (Rand) offered 31 March 200501/04/2004 72.00 11 270 11 27003/05/2004 74.15 1 950 1 95001/06/2004 73.90 547 54720/09/2004 81.50 111 410 110 11030/11/2004 87.86 547 143 547 14305/01/2005 93.25 487 48703/02/2005 94.00 482 482
673 289 671 989
The current position of the Remgro Share Scheme is as follows:Average
offer price Number(Rand) of shares
Ordinary shares due to participantsPrevious financial year 47.97 4 236 898Offered and accepted in current financial year 86.51 671 989Shares paid for and delivered 44.31 (514 946)Resignations and other (18 159)Total at 31 March 2005 54.26 4 375 782
The offers are valid for one year from the date of the offer. The scheme is a deferred purchase scheme and payment is made in threeequal annual instalments, the first of which is only payable three years after the offer date. Participants have no right to delivery, votingor ordinary dividends on shares before payment has been made. Participants may choose to pay on a later date with the resultantdeferment of rights. Payment must, however, be made within ten years. Refer to Ordinary Resolution Number 9 on pages 99 and 102where it is recommended that this period of ten years be changed to seven years.
�

r e m g r o l i m i t e d54
REPORT OF THE BOARD OF DIRECTORSFOR THE YEAR ENDED 31 MARCH 2005
PRINCIPAL SHAREHOLDERRembrandt Trust (Proprietary) Limited (Rembrandt Trust) holds all the issued unlisted B ordinary shares of the Company andis entitled to 44.02% (2004: 43.3%) of the total votes.
An analysis of the shareholders appears on pages 95 and 96.
SUBSIDIARY COMPANIES AND INVESTMENTSParticulars of subsidiary companies, associated companies and other investments are disclosed in Annexures A and B.
DIRECTORSThe names of the directors appear on pages 10 and 11.
In terms of the provision of the articles of association, Messrs W E Bührmann, J W Dreyer, T van Wyk, Dr E de la H Hertzogand Mrs J A Preller retire from the Board by rotation. These directors are eligible and offer themselves for re-election.
Mr P G Steyn retired as a non-executive director with effect from 25 August 2004. The Board would like to thank him for hiscontribution over many years.
Mr M H Visser, the Chief Executive Officer of Remgro, acted as Deputy Chairman of the Board until 22 June 2005, when Dr E de la H Hertzog, a non-executive director, was appointed as Deputy Chairman.
DIRECTORS’ INTERESTSAt 31 March 2005 the aggregate of the direct and indirect interests of the directors in the issued ordinary share capital of theCompany amounted to 0.57% (2004: 0.69%).
Mr J P Rupert is a director of Rembrandt Trust which owns all the issued unlisted B ordinary shares.
An analysis of directors’ interests in the issued capital of the Company appears on page 97.
DIRECTORS’ EMOLUMENTSThe Board recommends that directors’ fees for services rendered as directors during the past financial year be fixed at R1 720 000(2004: R865 000) in total.
ACQUISITION OF SHARES OF THE COMPANY It is recommended that a general authority be granted to the Board to acquire, should circumstances warrant it, the Company’sown shares and to approve the acquisition of shares in the Company by any of its subsidiaries, subject to the provisions of theCompanies Act 61 of 1973, as amended, and the Listings Requirements of the JSE Securities Exchange South Africa.
Special resolutions to this effect are incorporated in the notice of the annual general meeting that appears on page 98.
SPECIAL RESOLUTIONSNo special resolutions have been passed by the Company’s major subsidiaries, the nature of which might be significant in respectof the state of affairs of the Group.
�

r e m g r o l i m i t e d55
REPORT OF THE BOARD OF DIRECTORS FOR THE YEAR ENDED 31 MARCH 2005
DIVIDEND DECLARATIONDividend No 10
A final dividend of 198 cents (2004: 184 cents) per share was declared in respect of both the ordinary shares of one cent each andthe unlisted B ordinary shares of ten cents each, for the financial year ended 31 March 2005.
PaymentThe final dividend is payable to shareholders of the Company registered at the close of business on Friday, 19 August 2005.
Shareholders may not dematerialise or rematerialise their holdings of ordinary shares between Monday, 15 August 2005, andFriday, 19 August 2005, both days inclusive.
SECRETARYThe name and address of the Company Secretary appears on page 93.
APPROVALThe annual financial statements set out on pages 47 to 92 have been approved by the Board.
Signed on behalf of the Board of Directors.
Johann Rupert Thys VisserChairman Chief Executive Officer/Deputy Chairman
Stellenbosch21 June 2005
�

r e m g r o l i m i t e d56
ACCOUNTING POLICIESFOR THE YEAR ENDED 31 MARCH 2005
The annual financial statements are prepared on the historical cost basis, unless otherwise indicated, in accordance with South
African Statements of Generally Accepted Accounting Practice, the requirements of the South African Companies Act
1973, as amended, and the Listings Requirements of the JSE Securities Exchange South Africa. These financial statements
incorporate the following principal accounting policies which are consistent in all respects with those of the previous year, with
the exception of the implementation of South African Statements of Generally Accepted Accounting Practice, AC 140 (IFRS 3):
Business combinations, AC 128 (IAS 36): Impairment of assets, AC 129 (IAS 38): Intangible assets and AC 501: Accounting for
secondary tax on companies (STC):
(i) Consolidation, proportionate consolidation and equity accountingConsolidation – subsidiary companiesAll companies in which the Group, directly or indirectly, has an interest of more than one half of the voting rights orotherwise has the power to exercise control over the operations, are included in the consolidated financial statements inthe accepted manner.
The results of subsidiary companies acquired or disposed of during the year are included in the consolidated incomestatement from or to the date on which effective control was acquired or ceased.
Consolidation – The Remgro Share TrustThe Remgro Share Trust has been consolidated as it is effectively controlled by the Company.
Proportionate consolidation – joint venturesAll jointly controlled ventures are accounted for according to the proportionate consolidation method. In terms of thismethod the attributable share of assets, liabilities, income, expenditure and cash flow are included in the consolidatedfinancial statements.
Equity accounting – associated companiesCompanies which are neither subsidiaries nor joint ventures, but in which a long-term interest is held and over whosefinancial and operating policies a significant influence can be exercised, are accounted for according to the equity methodas associated companies. Certain associated companies have year-ends which differ from that of the Company. In suchcircumstances the results of listed and certain unlisted companies are accounted for from the latest published informationand management accounts as at year-end, respectively. The accounting policies of associated companies do not in allcircumstances correspond with those of the group. No adjustments are made for such differences where it is notpracticable. The Group’s share of retained income is transferred to non-distributable reserves. The Group’s share of othermovements in the reserves of associated companies are accounted for as changes in consolidated non-distributablereserves.
The results of associated companies, acquired or disposed of, are included in the consolidated income statement from thedate on which effective significant influence begins or until it ceases.
(ii) Property, plant and equipment and depreciationLeased assets – Assets leased in terms of finance lease agreements are capitalised at their equivalent cashconsideration. Depreciation is provided on the straight-line basis over the expected useful lives of the assets. Financecharges are written off over the term of the lease in accordance with the effective interest rate method. Leases of assets interms of which all the risks and benefits of ownership are effectively retained by the lessor are classified as operating leases.Payments made under operating leases are accounted for in normal income.
Preproduction costs and interest – Preproduction costs as well as interest on borrowings directly related tomajor capital projects under construction are capitalised until such assets are brought into a working condition for theirintended use.
�

r e m g r o l i m i t e d57
ACCOUNTING POLICIES FOR THE YEAR ENDED 31 MARCH 2005
Land and buildings – are stated at cost. Buildings are depreciated on a straight-line basis over their expected usefullives. Leasehold improvements are stated at cost and are written off over the periods of the leases.
Machinery, equipment, office equipment and vehicles – are stated at cost and depreciated on a straight-linebasis over their expected useful lives.
Where assets are identified as being impaired, that is when the recoverable amount has declined below its carryingamount, the carrying amount is reduced to reflect the decline in value. Such written-off amounts are accounted for innormal income.
(iii) Biological agricultural assets The fair value of the biological agricultural assets are determined on the following basis:
Sugarcane – Roots are valued at the current establishment and replacement cost and the value is proportionallyreduced over the estimated useful life of the roots. Standing cane is valued at its best-estimated recoverable value lessharvesting, transport, agricultural levies and other over the weighbridge costs.
Citrus – Orchards are valued at the current establishment and replacement cost adjusted for maturity levels and thevalue is proportionally reduced over the estimated useful life of the orchards. Citrus fruits are valued at the best-estimatedrecoverable values less harvesting, transport and agricultural levies.
Tea – Tea plantations are valued at the current establishment and replacement cost and the value is proportionallyreduced over the estimated useful life of the plantations. Tea leaves are valued at current cultivation costs less point-of-sale costs.
Breeding stock – is capitalised at cost at the beginning of its productive cycle and is amortised on the straight-linebasis, over the anticipated productive cycle, to its estimated net realisable value.
Live broiler chickens and hatching eggs – are valued at the lower of cost or net realisable value. The basis ofdetermining cost is the first-in first-out cost method. Costs include all direct production costs and an appropriate portionof overheads.
The above determined values for breeding stock, live broiler chickens and hatching eggs are assessed against fair valuesless estimated closure point-of-sale costs. Gains and losses arising from changes in the fair values are accounted for innormal income in the period in which they arise. The determination of fair value is based on active markets, whereappropriate, or management’s assessment of fair value based on available data.
Sugarcane, citrus and tea are reported in the balance sheet as non-current assets, while breeding stock, live broiler chickensand hatching eggs are reported as current assets.
(iv) Investment properties Investment properties are held to generate rental income and appreciate capital value. Investment properties are treated aslong-term investments and are carried at cost less accumulated depreciation. Buildings are depreciated on a straight-linebasis over their expected useful lives.
Investment properties are valued by external independent professional valuers every third year. Where assets are identifiedas being impaired the carrying amount is reduced. Such written-off amounts are accounted for in normal income.
�

r e m g r o l i m i t e d58
ACCOUNTING POLICIESFOR THE YEAR ENDED 31 MARCH 2005
(v) Intangible assetsGoodwill – On the acquisition of an investment, fair values at the date of acquisition are attributed to the identifiableassets, liabilities and contingent liabilities acquired.
Goodwill is the difference between the cost of the investments and the fair value of attributable net assets of the subsidiarycompanies, joint ventures and associated companies at the acquisition dates. Goodwill is reported in the balance sheet asnon-current assets. Where, at the date of acquisition, the net assets of subsidiary companies, joint ventures and associatedcompanies exceed the cost of the investments, the difference is immediately accounted for in the income statement.
With effect from 1 April 2004 Remgro adopted AC 140 (IFRS 3): Business Combinations. In terms of the provision ofthis accounting statement goodwill, arising from a business combination for which the agreement date is on or after 31 March 2004, will not be amortised, but carried at cost less accumulated impairment losses.
As from 1 April 2004 all goodwill that already existed on this date is also treated in accordance with AC 140 (IFRS 3), and this goodwill is also no longer being amortised. The exception to this is goodwill that is stillamortised by certain associated companies and such amortisation is accounted for in the annual financial statements. Thisis mainly due to year-ends of companies that differ, resulting in the later implementation of new accounting standards.
Trade marks – The costs of trade marks which are established and developed by the Group itself are expensed asincurred. The value thereof is consequently not reflected in the annual financial statements. The costs of trade marks whichhave been purchased are written off on a straight-line basis over their expected useful lives, not exceeding twenty years.
Research and development costs – Research and development costs are written off against income as incurred.Where the asset recognition criteria have been met, development expenditure is capitalised and written off over theexpected useful life of the product.
(vi) InvestmentsAssociated companies – are stated at cost. In the consolidated annual financial statements the share of post-acquisition reserves and retained income, accounted for according to the equity method, is included in the carrying value.
Other investments – Investments in equity and debt instruments are classified into the following categories, i.e.originated by the Group, held-to-maturity, held-for-trading and available-for-sale.
Investments originated by the Group – These investments, which primarily consist of loans, are originated by theGroup by providing money, goods or services directly to a debtor, are included within non-current assets and are carriedat amortised cost using the effective interest rate method.
Investments held-to-maturity – Investments with fixed maturity that the Group has the intent and ability to hold tomaturity are classified as investments held-to-maturity and are included within non-current assets. These investmentsare carried at amortised cost using the effective interest rate method.
Investments held-for-trading – These investments are carried at fair value. Realised and unrealised gains and lossesarising from changes in the fair value of held-for-trading investments are recognised in the income statement in theperiod in which they arise.
�

r e m g r o l i m i t e d59
ACCOUNTING POLICIES FOR THE YEAR ENDED 31 MARCH 2005
Investments available-for-sale – Other long-term investments are classified as available-for-sale and are includedwithin non-current assets. These investments are carried at fair value. Unrealised gains and losses arising from changesin the fair value of available-for-sale investments are recognised in non-distributable reserves in the period in which theyarise. When available-for-sale investments are either sold or impaired, the accumulated fair value adjustments arerealised and included in income.
All purchases and sales of investments are recognised at the trade date.
(vii) Inventories and contracts in progressInventories are stated at the lower of cost or net realisable value. The basis of determining cost is the first-in first-out costmethod. Where applicable, provision is made for slow-moving and redundant inventories. Work in progress and finishedgoods include direct costs and an appropriate allocation of manufacturing overheads.
(viii) TaxationDeferred taxation is provided for at current rates using the balance sheet liability method. Full provision is made for alltemporary differences between the taxation base of an asset or liability and its balance sheet carrying amount. No deferredtax liability is recognised in those circumstances where the initial recognition of an asset or liability has no impact onaccounting profit or taxable income. Assets are not raised in respect of deferred taxation, unless it is probable that futuretaxable profits will be available against which the deferred taxation asset can be realised in the foreseeable future.
Secondary taxation on companies is provided for in respect of dividend payments, net of dividends received or receivableand is recognised as a taxation charge for the year.
(ix) Foreign currenciesTransactions in foreign currencies are accounted for at the rates of exchange ruling on the dates of the transactions.Foreign currency monetary items at year-end are translated to SA rand at the rates of exchange ruling at that date.Exchange differences that arise as a result thereof, are accounted for in income together with realised exchange differenceson forward exchange contracts.
Assets, liabilities and reserves of foreign entities at year-end are translated to SA rand at the rates of exchange ruling atthat date. Operating results of foreign subsidiaries and income of foreign associated companies are translated to SA randat the average of the exchange rates prevailing during the year for each of the currencies concerned. Differences arising ontranslation are accounted for in reserves as exchange rate adjustments.
(x) Financial instrumentsFinancial instruments carried on the balance sheet include cash and cash equivalents, investments, debtors and short-termloans, trade and other payables and borrowings.
Financial instruments are initially recognised when the Group becomes party to the contractual terms of the instrumentsand are measured at cost, including transaction costs, which is the fair value of the consideration given (financial asset) orreceived (financial liability). Subsequent to initial recognition, these instruments are measured as set out in the applicableaccounting policies.
�

r e m g r o l i m i t e d60
ACCOUNTING POLICIESFOR THE YEAR ENDED 31 MARCH 2005
Financial assets (or a portion thereof ) are de-recognised when the Group realises the rights to the benefits specified inthe contract, the rights expire or the Group surrenders or otherwise loses control of the contractual rights that comprisethe financial asset.
On de-recognition, the difference between the carrying amount of the financial asset and proceeds receivable and any prioradjustments to reflect fair value that had been recognised in equity are included in the income statement.
Financial liabilities (or a portion thereof ) are de-recognised when the obligation specified in the contract is discharged,cancelled or expired. On de-recognition, the difference between the carrying amount of the financial liability, includingrelated unamortised costs and amounts paid for it are included in the income statement.
The fair value of financial instruments traded in an organised financial market is measured at the applicable quoted prices.The fair value of the financial instruments not traded in an organised financial market, is determined using a variety ofmethods and assumptions that are based on market conditions and risk existing at balance sheet date, includingindependent appraisals and discounted cash flow methods. Fair values represent an approximation of possible value, whichmay differ from the value that will finally be realised.
There are Group companies who are also parties to financial instruments that reduce exposure to fluctuations in foreigncurrency exchange rates. These instruments mainly comprise forward exchange contracts. Certain Group companies applyhedge accounting and gains and losses arising from cash flow hedges are recognised directly in equity, while gains andlosses arising from fair value hedges are recognised in the income statement in the period in which they arise. Groupcompanies that do not apply hedge accounting, recognise changes in the fair value of these and other derivativeinstruments in the income statement in the period in which they arise.
The carrying amounts of financial assets and liabilities with maturity of less than one year are assumed to approximatetheir fair value.
Where a legally enforceable right of set-off exists for recognised financial assets and financial liabilities, and there is anintention to settle the liability and realise the asset simultaneously, or to settle on a net basis, all related financial effectsare offset.
(xi) ProvisionsProvisions are recognised when a legal or constructive obligation exists as a result of past events, it is probable that anoutflow of resources embodying economic benefits will be required to settle the obligation, and a reliable estimate of theamount of the obligation can be made.
Employee entitlements to leave are recognised when they accrue to employees involved. A provision is made for theestimated liability for leave as a result of services rendered by employees up to balance sheet date.
(xii) Employee benefitsPension obligations – Companies in the Group provide defined benefit and defined contribution plans for the benefit ofemployees, the assets of which are held in separate trustee-administered funds. These plans are funded by payments fromthe employees and the Group, taking into account recommendations of independent qualified actuaries.
�

r e m g r o l i m i t e d61
ACCOUNTING POLICIES FOR THE YEAR ENDED 31 MARCH 2005
For the defined benefit plans, the pension accounting costs are assessed using the projected unit credit method. Underthis method, the cost of providing pensions is charged to the income statement to spread the regular costs overthe service lives of the employees in accordance with advice of qualified actuaries who carry out a full valuation of the plansevery three years. The pension obligation is measured as the present value of the estimated future cashoutflows using interest rates of government securities that have terms to maturity approximating the terms of the relatedliability.
The net surplus or deficit of the benefit obligation is the difference between the present value of the funded obligationsand the fair value of the plan assets.
All actuarial gains and losses are spread forward over the average remaining service lives of the employees. The Group’scontribution to the defined contribution pension plans is charged to the income statement in the year in which they relate.
Post-retirement medical obligations – The Group provides post-retirement medical benefits to its retirees. Theentitlement to post-retirement medical benefits is based on the employees remaining in service up to retirement age andthe completion of a minimum service period.
The expected costs of these benefits are expensed and the liabilities accumulated over the period of employment, usingaccounting methodology similar to that for defined pension plans. Valuation of these obligations is carried out byindependent qualified actuaries.
(xiii) Cash and cash equivalentsFor the purpose of the cash flow statement, cash and cash equivalents comprise cash on hand, deposits held at call withbanks, and investments in money market instruments, net of bank overdrafts. In the balance sheet, bank overdrafts areincluded in short-term interest-bearing loans.
(xiv) Revenue recognitionThe sale of goods is recognised when the significant risks and rewards of ownership of the goods have been transferred.Revenue arising from services is recognised when the service is rendered. Interest is recognised on a time proportion basis(taking into account the principal outstanding, the effective rate and the period), unless collectability is in doubt.Dividends are recognised when the right to receive payment is established.
(xv) Treasury sharesShares in the Company held by wholly-owned subsidiary companies as well as shares held by The Remgro Share Trustare classified as treasury shares and are held at cost. These shares are treated as a deduction from the issued number ofshares and taken into account in the calculation of the weighted average number of shares. The cost price of the shares isdeducted from the Group’s equity.
(xvi) Remgro Share SchemeThe estimated cost of the scheme is accounted for against income and headline earnings on a straight-line basis over afour-year period with a corresponding credit to equity. Any profits or losses that realise from shares being delivered toparticipants are recognised directly in equity.
�

r e m g r o l i m i t e d62
BALANCE SHEETSAT 31 MARCH 2005
�
Assets Non-current assetsProperty, plant and equipment 1 3 864 3 408 – –Biological agricultural assets 2 94 85 – –Investment properties 3 24 22 – –Goodwill and trade marks 4 386 54 – –Investments – Associated companies 5 28 415 22 737 – –
– Other 6 1 948 1 861 8 000 7 703Loans 7 157 49 – –Deferred taxation 22 173 142 – –
35 061 28 358 8 000 7 703Current assets 4 765 5 372 – 2
Inventories 8 653 628 – –Biological agricultural assets 2 239 217 – –Debtors and short-term loans 1 440 1 043 – –Derivative instruments 32 1 7 – –Taxation 60 31 – 2Cash and cash equivalents 9 2 372 3 446 – –
Total assets 39 826 33 730 8 000 7 705
Equity and liabilitiesCapital and reservesIssued capital 10 8 8 8 8Reserves 11 37 504 30 994 7 986 7 692Treasury shares 10 (2 552) (1 293) – –
Total shareholders’ equity 34 960 29 709 7 994 7 700Minority interest 2 011 1 702Non-current liabilities 883 685 – –
Retirement benefits 12 231 119 – –Long-term loans 13 200 172 – –Deferred taxation 22 452 394 – –
Current liabilities 1 972 1 634 6 5
Trade and other payables 1 552 1 164 6 5Short-term interest-bearing loans 14 155 105 – –Provisions 15 179 176 – –Derivative instruments 32 17 8 – –Taxation 69 181 – –
Total equity and liabilities 39 826 33 730 8 000 7 705
consolidated the companyR million Notes 2005 2004 2005 2004
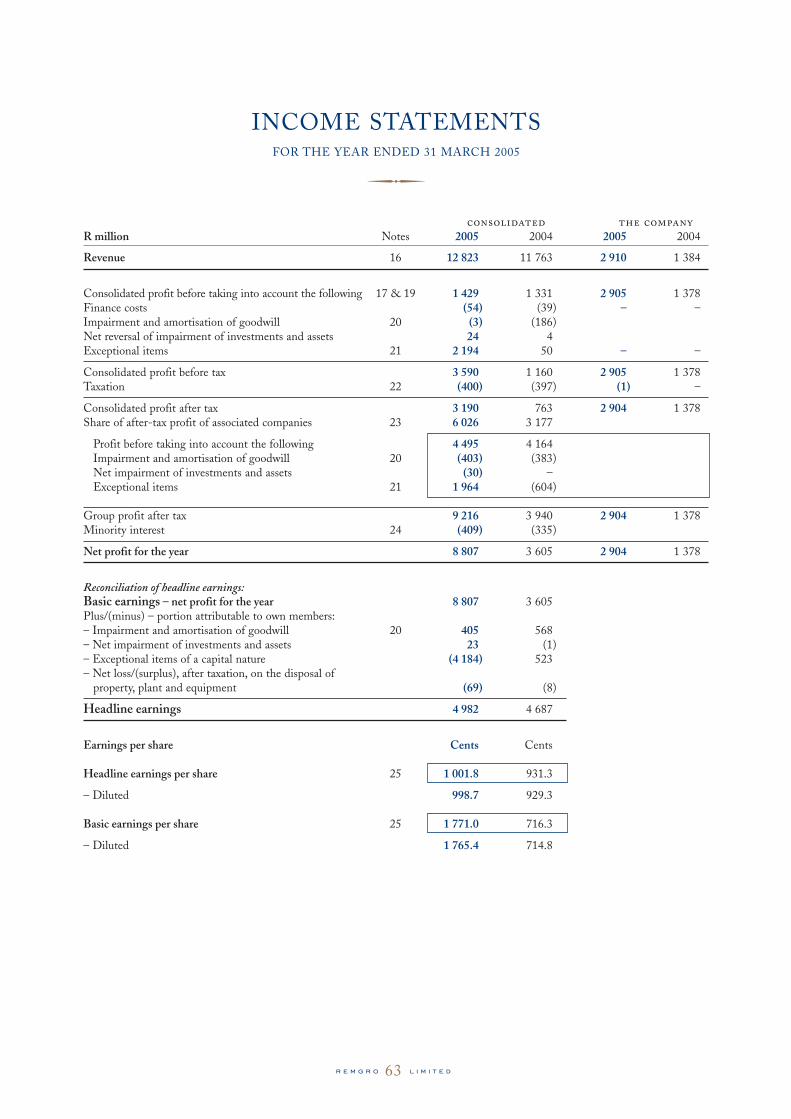
r e m g r o l i m i t e d63
INCOME STATEMENTSFOR THE YEAR ENDED 31 MARCH 2005
�
Revenue 16 12 823 11 763 2 910 1 384
Consolidated profit before taking into account the following 17 & 19 1 429 1 331 2 905 1 378Finance costs (54) (39) – –Impairment and amortisation of goodwill 20 (3) (186)Net reversal of impairment of investments and assets 24 4Exceptional items 21 2 194 50 – –
Consolidated profit before tax 3 590 1 160 2 905 1 378Taxation 22 (400) (397) (1) –
Consolidated profit after tax 3 190 763 2 904 1 378Share of after-tax profit of associated companies 23 6 026 3 177
Profit before taking into account the following 4 495 4 164Impairment and amortisation of goodwill 20 (403) (383)Net impairment of investments and assets (30) –Exceptional items 21 1 964 (604)
Group profit after tax 9 216 3 940 2 904 1 378Minority interest 24 (409) (335)
Net profit for the year 8 807 3 605 2 904 1 378
Reconciliation of headline earnings:Basic earnings – net profit for the year 8 807 3 605Plus/(minus) – portion attributable to own members:– Impairment and amortisation of goodwill 20 405 568– Net impairment of investments and assets 23 (1)– Exceptional items of a capital nature (4 184) 523– Net loss/(surplus), after taxation, on the disposal of
property, plant and equipment (69) (8)
Headline earnings 4 982 4 687
Earnings per share Cents Cents
Headline earnings per share 25 1 001.8 931.3
– Diluted 998.7 929.3
Basic earnings per share 25 1 771.0 716.3
– Diluted 1 765.4 714.8
consolidated the companyR million Notes 2005 2004 2005 2004

r e m g r o l i m i t e d64
STATEMENTS OF CHANGES IN EQUITYFOR THE YEAR ENDED 31 MARCH 2005
�
2005Balances at 1 April – as previously reported 8 13 704 566 1 215 15 566 (1 293) 29 766Prior year adjustments (57) (57)
Adjusted balances at 1 April 8 13 704 566 1 215 15 509 (1 293) 29 709Net fair value adjustments for the year (AC 133) 46 46Net profit for the year 8 807 8 807Dividends paid (2 509) (2 509)Exchange rate adjustments 118 112 9 239Change in reserves of subsidiary companies,
associated companies and joint ventures and other transfers between reserves (73) 428 (428) (73)
Transfer of retained income of associated companies 3 515 (3 515) –Purchase of shares by wholly-owned subsidiary
(treasury shares) (1 235) (1 235)Net shares purchased by The Remgro Share Trust* (24) (24)
Balances at 31 March 8 17 264 1 106 1 261 17 873 (2 552) 34 960
2004Balances at 1 April – as previously reported 8 13 819 559 14 038 (981) 27 443Prior year adjustments (25) (25)
Adjusted balances at 1 April 8 13 819 559 14 013 (981) 27 418Net cumulative opening balance adjustment (AC 133) 1 11 24 36Net fair value adjustments for the year (AC 133) 1 204 1 204Net profit for the year 3 605 3 605Dividends paid (1 316) (1 316)Exchange rate adjustments (671) (4) (19) (694)Change in reserves of subsidiary companies,
associated companies and joint ventures and other transfers between reserves (425) (4) 183 (246)
Transfer of retained income of associated companies 981 (981) – Purchase of shares by wholly-owned subsidiary
(treasury shares) (295) (295)Net shares purchased by The Remgro Share Trust* (17) (17)Long-term share incentive scheme reserve 14 14
Balances at 31 March 8 13 704 566 1 215 15 509 (1 293) 29 709
* Also accounted for as treasury sharesthe company
R million 2005 2004
Balances at 1 April 7 700 7 684
Issued capital 8 8Distributable reserves 7 692 7 676
Net profit for the year 2 904 1 378Dividends paid (2 610) (1 362)
Balances at 31 March 7 994 7 700
consolidatedEquity Other non- Fair Distri-
Issued accounted distributable value butable TreasuryR million capital reserves reserves reserve reserves shares Total
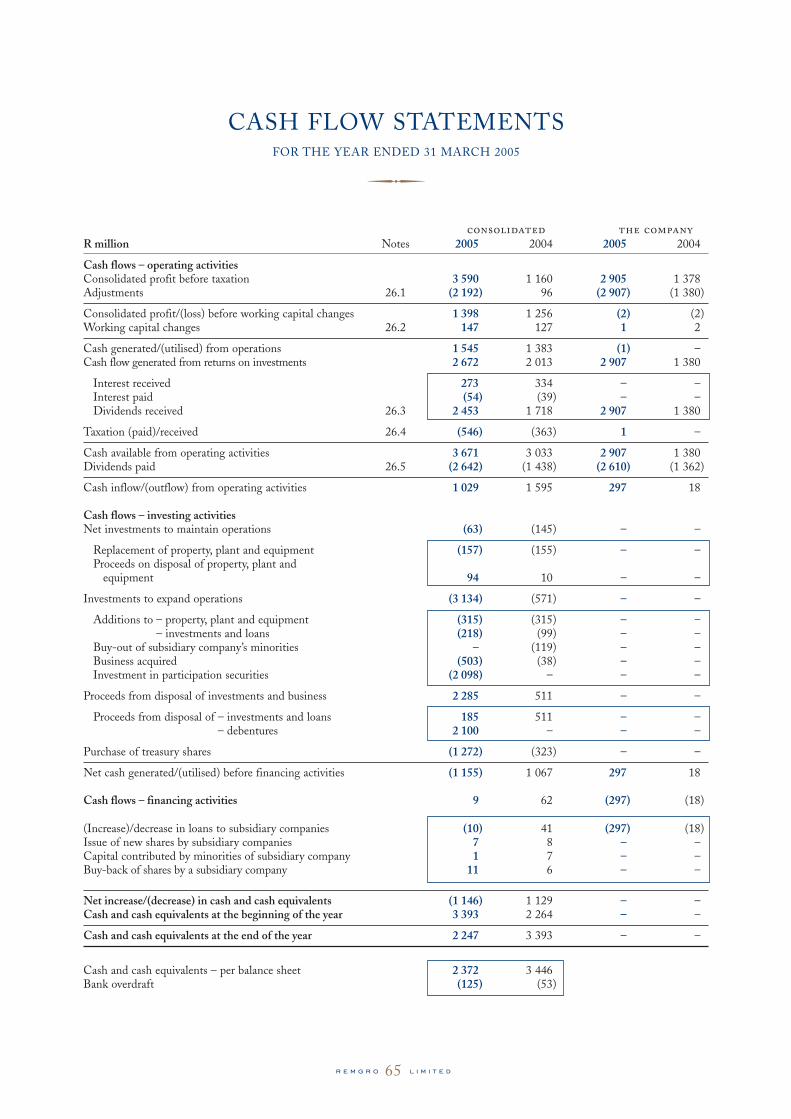
r e m g r o l i m i t e d65
CASH FLOW STATEMENTSFOR THE YEAR ENDED 31 MARCH 2005
�consolidated the company
R million Notes 2005 2004 2005 2004
Cash flows – operating activitiesConsolidated profit before taxation 3 590 1 160 2 905 1 378Adjustments 26.1 (2 192) 96 (2 907) (1 380)
Consolidated profit/(loss) before working capital changes 1 398 1 256 (2) (2)Working capital changes 26.2 147 127 1 2
Cash generated/(utilised) from operations 1 545 1 383 (1) –Cash flow generated from returns on investments 2 672 2 013 2 907 1 380
Interest received 273 334 – –Interest paid (54) (39) – –Dividends received 26.3 2 453 1 718 2 907 1 380
Taxation (paid)/received 26.4 (546) (363) 1 –
Cash available from operating activities 3 671 3 033 2 907 1 380Dividends paid 26.5 (2 642) (1 438) (2 610) (1 362)
Cash inflow/(outflow) from operating activities 1 029 1 595 297 18
Cash flows – investing activitiesNet investments to maintain operations (63) (145) – –
Replacement of property, plant and equipment (157) (155) – –Proceeds on disposal of property, plant and
equipment 94 10 – –
Investments to expand operations (3 134) (571) – –
Additions to – property, plant and equipment (315) (315) – –– investments and loans (218) (99) – –
Buy-out of subsidiary company’s minorities – (119) – –Business acquired (503) (38) – –Investment in participation securities (2 098) – – –
Proceeds from disposal of investments and business 2 285 511 – –
Proceeds from disposal of – investments and loans 185 511 – –– debentures 2 100 – – –
Purchase of treasury shares (1 272) (323) – –
Net cash generated/(utilised) before financing activities (1 155) 1 067 297 18
Cash flows – financing activities 9 62 (297) (18)
(Increase)/decrease in loans to subsidiary companies (10) 41 (297) (18)Issue of new shares by subsidiary companies 7 8 – –Capital contributed by minorities of subsidiary company 1 7 – –Buy-back of shares by a subsidiary company 11 6 – –
Net increase/(decrease) in cash and cash equivalents (1 146) 1 129 – –Cash and cash equivalents at the beginning of the year 3 393 2 264 – –
Cash and cash equivalents at the end of the year 2 247 3 393 – –
Cash and cash equivalents – per balance sheet 2 372 3 446Bank overdraft (125) (53)

r e m g r o l i m i t e d66
NOTES TO THE ANNUAL FINANCIAL STATEMENTSFOR THE YEAR ENDED 31 MARCH 2005
�
1. Property, plant and equipment2005 2004
Accumulated Net Accumulated NetCost depreciation value Cost depreciation value
R million R million R million R million R million R million
Land and buildings 2 233 204 2 029 1 970 182 1 788Capital expansion in progress 274 – 274 269 – 269Machinery and equipment 3 095 1 693 1 402 2 709 1 459 1 250Vehicles 216 135 81 98 66 32Office equipment 226 148 78 187 118 69
6 044 2 180 3 864 5 233 1 825 3 408
2005 2004Depreciation rates are as follows: % %Buildings 2 – 5 2 – 5Machinery and equipment 4 – 100 3 – 100Vehicles 10 – 25 10 – 25Office equipment 10 – 33⅓ 10 – 33⅓
Land and Machinery andReconciliation of carrying value at buildings equipment 2005 2004the beginning and end of the year R million R million R million R million
Balances at 1 April 2 057 1 351 3 408 3 149Additions 156 316 472 470Disposals (24) (18) (42) (14)Depreciation (20) (247) (267) (240)Businesses acquired 185 109 294 36Other (51) 50 (1) 7
Balances at 31 March 2 303 1 561 3 864 3 408
Liabilities resulting from mortgage loans, finance leases and instalment sale agreements are secured by property, plant andequipment with a book value of R227 million (2004: R622 million).
The registers containing details of land and buildings are available for inspection by members or their proxies at the registeredoffices of the companies to which the relevant properties belong.
2. Biological agricultural assetsIncluded in non-current assets:
Sugarcane Sugarcane CitrusReconciliation of carrying value at roots plants and tea 2005 2004the beginning and end of the year R million R million R million R million R million
Balances at 1 April 37 35 13 85 82Fair value adjustment 8 – 1 9 3
Balances at 31 March 45 35 14 94 85
The quantity at 31 March is as follows:Sugarcane roots (ha) 8 705 8 191Sugarcane plants (tons) 37 655 33 371 Citrus (ha) 1 443 1 438 Tea (kg) 160 025 160 025

r e m g r o l i m i t e d67
NOTES TO THE ANNUAL FINANCIAL STATEMENTS FOR THE YEAR ENDED 31 MARCH 2005
�
2. Biological agricultural assets (continued)Included in current assets:
Reconciliation of carrying value at Breeding stock Broiler stock 2005 2004the beginning and end of the year R million R million R million R million
Balances at 1 April 139 78 217 214Additions 385 1 990 2 375 2 296Decrease due to harvest (377) (1 980) (2 357) (2 300)Fair value adjustment 1 3 4 7
Balances at 31 March 148 91 239 217
3. Investment properties2005 2004
Accumulated Net Accumulated NetCost depreciation value Cost depreciation value
R million R million R million R million R million R million
Land 3 – 3 3 – 3Buildings 28 7 21 26 7 19
31 7 24 29 7 22
2005 2004Depreciation rate is as follows: % %Buildings 2 2
Reconciliation of carrying value at Land Buildings 2005 2004the beginning and end of the year R million R million R million R million
Balances at 1 April 3 19 22 22Additions – – – 1Depreciation – – – (1)Businesses acquired – 2 2 –
Balances at 31 March 3 21 24 22
The investment properties were valued during the year by an independent, qualified valuer. The fair value of the investmentproperties, VAT exclusive, is R268 million (2004 valuation: R250 million).
The registers containing details of investment properties are available for inspection by members or their proxies at theregistered offices of the companies to which the relevant properties belong.

r e m g r o l i m i t e d68
NOTES TO THE ANNUAL FINANCIAL STATEMENTSFOR THE YEAR ENDED 31 MARCH 2005
�
4. Goodwill and trade marks2005 2004
Accumulated AccumulatedCost or impairment/ Net Cost or impairment/ Net
valuation amortisation value valuation amortisation valueR million R million R million R million R million R million
Goodwill 382 3 379 53 7 46Trade marks 67 60 7 67 59 8
449 63 386 120 66 54
2005 2004Amortisation rates are as follows: % %Goodwill – 5Trade marks 4 – 6⅔ 5 – 6⅔
TradeReconciliation of carrying value at Goodwill marks 2005 2004the beginning and end of the year R million R million R million R million
Balances at the beginning of the year 46 8 54 40Additions – – – 19Amortisation – (1) (1) (5)Impairment (3) – (3) –Businesses acquired 336 – 336 –
Balances at the end of the year 379 7 386 54
Goodwill is tested annually for any possible impairment and for this reason allocated to the respective cash-generating units asindicated below:
Rainbow Transvaal Medi-ClinicChicken Sugar Corporation
Limited and Limited and Limited and 2005its subsidiaries its subsidiaries its subsidiaries Other Total
Goodwill allocated (R million) 291 42 44 2 379
Basis of valuation of cash- Fair value Directors’ Fair valuegenerating units based on valuation based on
active activemarket market

r e m g r o l i m i t e d69
NOTES TO THE ANNUAL FINANCIAL STATEMENTS FOR THE YEAR ENDED 31 MARCH 2005
�
5. Investments – associated companies(Annexures B & C)
2005 2004Listed Unlisted Total Listed Unlisted Total
R million R million R million R million R million R million
Shares – at cost 4 392 2 779 7 171 4 409 740 5 149Goodwill 2 927 424 3 351 2 910 282 3 192Equity adjustment 4 685 12 619 17 304 3 695 10 049 13 744
Carrying value 12 004 15 822 27 826 11 014 11 071 22 085Long-term loans
Originated loans – 589 589 – 652 652
12 004 16 411 28 415 11 014 11 723 22 737
Market values of listed investments 19 893 19 893 14 413 14 413
Directors’ valuation of unlisted investments 31 301 31 301 27 903 27 903
Market values and directors’ valuation 19 893 31 301 51 194 14 413 27 903 42 316
Excess of market values and directors’ valuation over the carrying value of investments:– attributable to own members 22 760 19 559– attributable to minority 19 20
22 779 19 579
Of the directors’ valuations of unlisted investments stated above, a substantial proportion amounting to R27 707 million (2004: R24 438 million) was based on the stock exchange prices of underlying listed shares held by the unlisted investmentsconcerned.
2005 2004Reconciliation of carrying value at the beginning and end of the year R million R million
Carrying value at the beginning of the year 22 737 23 165Exchange rate differences on translation of carrying value at the beginning of the year
to year-end rate 118 (671)
Income of associated companies retained 3 539 998
Share of net attributable profit of associated companies 6 026 3 177Dividends received from associated companies (2 501) (2 156)Exchange rate differences on translation between average rate to year-end rates 14 (23)
Equity-accounted movements on reserves (71) (237)Loans repaid (84) (193)Disposals (35) (208)Investments 2 098 94Associated investments reclassified as subsidiary companies (7) –Other movements 120 (29)Amortisation of goodwill – (182)
Carrying value at the end of the year 28 415 22 737

r e m g r o l i m i t e d70
NOTES TO THE ANNUAL FINANCIAL STATEMENTSFOR THE YEAR ENDED 31 MARCH 2005
�
6. Investments – subsidiary companies and other(Annexures A & B)
6.1 The CompanyUnlisted subsidiary companies and other:
Advances and loans 8 000 7 703
2005 2004Listed Unlisted Total Listed Unlisted Total
R million R million R million R million R million R million
6.2 Consolidated Investments – other
Shares – available-for-sale 1 866 82 1 948 1 795 66 1 861
Market values of listed investments 1 866 1 866 1 795 1 795Directors’ valuation of unlisted
investments 82 82 66 66
Market values and directors’ valuation 1 866 82 1 948 1 795 66 1 861
Reconciliation of carrying value of investments 2005 2004available-for-sale at the beginning and end of the year R million R million
Balances at the beginning of the year 1 861 109Cumulative opening balance adjustment (AC 133) – 12Fair value adjustments for the year (AC 133) 56 1 303Additions 31 437
Balances at the end of the year 1 948 1 861
7. LoansLoan to a wholly-owned subsidiary of the service company, M&I Management Services
(Proprietary) Limited, to partially finance aircraft for use by Group members 105 –Other 52 49
157 49
8. InventoriesRaw materials 307 336Finished products 296 242Work in progress 2 2Consumable stores 48 48
653 628
Included above is inventory valued at R6 million (2004: R3 million) that has been written down to net realisable value.
9. Cash and cash equivalentsCash at the centre 1 094 2 150Other operating subsidiaries 1 278 1 296
2 372 3 446
2005 2004R million R million

r e m g r o l i m i t e d71
NOTES TO THE ANNUAL FINANCIAL STATEMENTS FOR THE YEAR ENDED 31 MARCH 2005
�
10. Share capitalAuthorised512 493 650 ordinary shares of 1 cent each 5.1 5.1
40 506 352 B ordinary shares of 10 cents each 4.1 4.1
9.2 9.2
Issued486 493 650 (2004: 486 493 650) ordinary shares of 1 cent each 4.9 4.9
35 506 352 (2004: 35 506 352) B ordinary shares of 10 cents each 3.5 3.5
8.4 8.4
Each ordinary share has one vote.Each B ordinary share has ten votes.Number of shares held in treasury by a wholly-owned subsidiary and shares held by The Remgro Share Trust (ordinary sharesof 1 cent each): 34 903 000 (2004: 20 678 689).At a general meeting held on 24 August 2004, the Company placed the entire authorised but unissued share capital of theCompany, comprising 26 000 000 ordinary shares of 1 cent each and 5 000 000 B ordinary shares of 10 cents each which shareswere reserved for allotment and issue in terms of The Remgro Share Trust in terms of an ordinary resolution of shareholdersadopted on 21 September 2000, under the control of the Board of Directors of the Company as a general authority in termsof section 221(2) of the Companies Act, 1973 (Act 61 of 1973), as amended (the Act), subject to the provisions of the Act andthe Rules and Requirements of the JSE until the next annual general meeting of the Company, for allotment and issue inaccordance with the rules of The Remgro Share Trust.Details in respect of the share scheme and the current year’s offers are disclosed in the Report of the Board of Directors.
2005 2004R million R million
11. Reserves11.1 Composition of reserves
The Company:Distributable reserves 7 986 7 692
Subsidiary companies and joint ventures 12 254 9 598
Non-distributable reserves 2 367 1 781Distributable reserves 9 887 7 817
Associated companies:Non-distributable reserves 17 264 13 704
37 504 30 994
Statutory non-distributable reserves included in 380 375
General capital reserves 9 9Equity accounted reserves 371 366
11.2 Included in the respective reserves above are reservesarising on exchange rate translation
General Equity Unappro-capital accounted priated 2005 2004
reserves reserves profit Total TotalR million R million R million R million R million
Balances at 1 April 123 1 633 (1) 1 755 2 449Exchange rate adjustments during the year 112 118 9 239 (694)Transfer of equity adjustment 14 (14) – –
Balances at 31 March 235 1 765 (6) 1 994 1 755
2005 2004R million R million

r e m g r o l i m i t e d72
NOTES TO THE ANNUAL FINANCIAL STATEMENTSFOR THE YEAR ENDED 31 MARCH 2005
�
12. Retirement benefits12.1 Retirement benefits
Some of the Company’s subsidiaries have various defined benefit pension funds, defined contribution pension funds anddefined contribution provident funds which are privately administered independent of the finances of the Group. All thefunds are governed by the Pension Funds Act, 1956 (as amended). All salaried employees are obliged to acceptmembership of one of these funds.
The defined benefit pension funds are actuarially valued every three years and reviewed every year by independentactuaries according to the projected unit credit method. The other funds are financially reviewed every year. The actuarialvaluation of these funds were conducted from 31 March 2002 to 31 December 2004.
2005 2004R million R million
Balance sheetAmounts recognised in the balance sheet are as follows:Present value of funded obligations 650 178Fair value of plan assets (615) (205)
Funded position 35 (27)Unrecognised actuarial losses (5) (12)Pension fund surplus limitation* 41 39
Net liability in balance sheet 71 Nil
Movement for the year:Balances at 1 April – –Pension fund surplus limitation* 1 (1)Total expense 10 13Liabilities acquired in business combinations 75 –Contributions (15) (12)
Balances at 31 March 71 Nil
* The pension fund surplus is not recognised as an asset in the balance sheet as the process ofallocating these surpluses in terms of the Pension Funds Act has not been finalised yet.
Income statementAmounts recognised in the income statement are as follows:Current service costs 17 13Interest on liability 30 18Expected return on plan assets (33) (19)Recognised net actuarial (profits)/losses in the year (4) 1
Total expenses 10 13Pension fund surplus limitation 1 (1)
Totals included in staff costs 11 12
Actual return on plan assets 84 33
Principal actuarial assumptions on balance sheet date % %Discount rate 5.5 – 8.5 11.0 – 15.0Expected rates of return on plan assets 7.5 – 8.5 11.0 – 15.0Future salary increases 2.75 – 5.5 7.5 – 13.5Future pension increases 6.5 6.5 – 10.0Inflation rate 2.75 – 4.0 6.0

r e m g r o l i m i t e d73
NOTES TO THE ANNUAL FINANCIAL STATEMENTS FOR THE YEAR ENDED 31 MARCH 2005
�
12. Retirement benefits (continued)12.2 Post-retirement medical benefits
Balance sheetAmounts recognised in the balance sheet are as follows:Present value of obligations 160 119
Movement for the year:Balances at 1 April 119 103Total expenses recognised in the income statement 24 18Liability acquired in business combination 26 –Contributions (9) (2)
Balances at 31 March 160 119
Income statementAmounts recognised in the income statement are as follows:Current service costs 13 8Interest on liability 12 12Recognised net actuarial (profits)/losses in the year (1) (2)
Totals included in staff costs 24 18
Principal actuarial assumptions on balance sheet date % %Discount rate 8.5 8.0 – 11.0Future salary increases 4.0 – 5.5 6.0Annual increase in healthcare costs 4.0 – 6.5 6.0 – 9.0
2005 2004R million R million
13. Long-term loansInterest-bearing loansSecured long-term loans with effective interest rates of between 9.00% and 13.60%
per annum (2004: 10.25% and 13.68%), repayable over a period of between four to six years 187 191These liabilities are secured by property and plant with a net book value of R225 million (2004: R236 million).
Net liabilities resulting from various capitalised finance leases and instalment sale agreements payable in monthly, quarterly and annual instalments at aneffective interest rate of 16.07% per annum (2004: 16.07% and 18.00%), amount to 3 30These liabilities are secured by plant and equipment with a net book value of R2 million (2004: R386 million).
Unsecured sundry loans with varying interest rates and terms 1 3
191 224Interest-free loan with no fixed repayment conditions 39 –
230 224Instalments payable within one year transferred to short-term interest-bearing loans 30 52
200 172
Payable – two to five years 105 147Payable thereafter 95 25
200 172
2005 2004R million R million

r e m g r o l i m i t e d74
NOTES TO THE ANNUAL FINANCIAL STATEMENTSFOR THE YEAR ENDED 31 MARCH 2005
�
14. Short-term interest-bearing loansPortion of long-term interest-bearing loans payable within one year 30 52Bank overdrafts 125 53
155 105
Bonuses andLegal disputes leave pay Other* 2005 2004
R million R million R million R million R million
15. ProvisionsBalances at 1 April 30 137 9 176 180Businesses acquired – 4 1 5 1Additional provisions – 99 3 102 95Unused amounts – reversed (1) – (3) (4) –
29 240 10 279 276Provisions utilised during the year (14) (83) (3) (100) (100)
Balances at 31 March 15 157 7 179 176
* Various smaller provisions
2005 2004R million R million
16. RevenueRevenue of the Company and its subsidiary companies consists of net sales of products, fees,rentals, as well as dividends and interest. Intergroup transactions are eliminated.
Due to the nature and composition of the Group, financial ratios based on revenue are not considered to be meaningful.
Operating revenue 9 969 9 245Dividends and interest 2 854 2 518
Revenue 12 823 11 763
2005 2004R million R million

r e m g r o l i m i t e d75
NOTES TO THE ANNUAL FINANCIAL STATEMENTS FOR THE YEAR ENDED 31 MARCH 2005
�
17. ProfitProfit is stated after taking the following into account:
IncomeFair value adjustment – biological assets (AC 137) 14 3Foreign exchange profits 26 6Interest received 273 334
Shareholders’ loan to associated company 44 72Other 229 262
Property rental income 9 8Profit/(loss) on sale of property, plant and equipment 35 (5)
ExpensesAmortisation of trade marks 1 1Auditors’ remuneration – audit fees 8 7
– other services 1 1Cost of sales 7 496 7 182Depreciation 267 240
Buildings 20 21Machinery and equipment 208 187Vehicles 14 10Office equipment 25 22
Fair value adjustment – investments (AC 133) 60 (14)Professional fees 13 9Property expenses 2 2Rental 71 56
Land and buildings 41 28Machinery and equipment 20 16Vehicles 6 6Office equipment 4 6
Research and development costs written off 1 2
18. Administration and management feesPaid to M&I Management Services (Proprietary) Limited 91 87Less: Fees received (14) (13)
Intergroup – excluding wholly-owned subsidiaries (7) (6)Other (7) (7)
Net 77 74
2005 2004R million R million

r e m g r o l i m i t e d76
NOTES TO THE ANNUAL FINANCIAL STATEMENTSFOR THE YEAR ENDED 31 MARCH 2005
�
19. Dividend incomeIncluded in profit:
Listed – – 74 19Unlisted – Subsidiary companies 2 907 1 380
– Other – – 7 9
2 907 1 380 81 28
Dividends from associated companies set off against investments 2 501 2 156
2005 2004R million R million
20. Impairment and amortisation of goodwillSubsidiary companies 3 186Associated companies 403 383
406 569
21. Exceptional itemsExceptional items of subsidiary companies:
Capital surplus on redemption of debentures by R&R 2 100 –Net capital surplus on the sale of investments and businesses 45 50Other 49 –
Total before taxation 2 194 50Taxation (8) (3)
Total after taxation 2 186 47
Share of exceptional items of associated companies 1 964 (604)
Grand total 4 150 (557)Attributable to minorities (20) –
Attributable to own members 4 130 (557)
22. Taxation22.1 Taxation in income statement
Current 361 363
– current year – South African normal taxation 330 348– Taxation on capital gain 12 4– Foreign taxation 17 9
359 361– previous year – South African normal taxation 3 2
– Foreign taxation (1) –
Secondary taxation on companies – 10
– current 11 10– deferred (AC 501) (11) –
Deferred – current year 41 24– previous year (2) –
400 397
the company consolidated2005 2004 2005 2004
R million R million R million R million

r e m g r o l i m i t e d77
NOTES TO THE ANNUAL FINANCIAL STATEMENTS FOR THE YEAR ENDED 31 MARCH 2005
�
22. Taxation (continued)22.2 Reconciliation of effective tax rate of the Company and its
subsidiaries with standard rate % %Effective tax rate 26.8 34.2Reduction/(increase) in standard rate as a result of:
Permanent differences 2.8 (3.4)Foreign taxation (0.6) (0.1)Taxation in respect of previous years – (0.2)Taxation losses that can be utilised in future periods 0.2 –Exempt capital gain 0.8 0.3Secondary tax on companies – (0.8)
Standard rate 30.0 30.0
2005 2004R million R million
22.3 Deferred taxationDeferred taxation liability 452 394
Property, plant and equipment 274 227Inventories 76 70Provisions (29) (27)Biological agricultural assets 24 26Other – (2)Investments (AC 133) 107 100
Deferred tax asset (173) (142)
Property, plant and equipment 16 –Inventories (24) (31)Provisions (148) (106)STC credits (AC 501) (15) (4)Other 1 –Tax losses utilised (3) (1)
Net deferred taxation 279 252
The movement between balances of deferred taxation at the beginning and end of the year can be analysed as follows:Beginning of the year
As previously reported 317 141Prior year adjustments (65) (30)
Adjusted balance 252 111Movements during the year attributable to:
Property, plant and equipment 63 7Inventories 12 (16)Provisions (44) (10)Biological agricultural assets (1) 1STC credits (AC 501) (11) –Other 3 (4)Tax losses utilised (2) 63Investments (AC 133) 7 100
279 252
2005 2004

r e m g r o l i m i t e d78
NOTES TO THE ANNUAL FINANCIAL STATEMENTSFOR THE YEAR ENDED 31 MARCH 2005
�
22. Taxation (continued)22.4 Tax losses
Estimated tax losses available for set-off against future taxable income 10 2Utilised to create deferred tax asset (10) (2)
– –
22.5 Secondary taxation on companies (STC)The STC credits on 31 March, which could be set off against future dividend
payments, amount to 4 029 3 813
– The Company 980 684– Subsidiary companies 3 049 3 129
Utilised to create deferred tax asset (AC 501) (117) (32)
Unutilised STC credits 3 912 3 781
Remgro’s history regarding dividends received against ordinary dividends paid suggestsincreasing STC credits in time. It is therefore not likely that Remgro’s STC credits willbe utilised against ordinary dividends paid in the foreseeable future, and consequentlyno deferred tax asset has been created for the Company’s unutilised STC credits.
23. Equity adjustment Share of net profit of associated companies:Profit from operations 6 749 6 292Impairment and amortisation of goodwill (403) (383)Net impairment of investments and assets (30) –Exceptional items 1 749 (696)
Share of net profit of associated companies – before taxation 8 065 5 213Taxation (1 811) (1 780)
Normal operations (2 023) (1 871)Exceptional items 212 91
After taxation 6 254 3 433Share of minority of associated companies (228) (256)
Share of net attributable profit of associated companies – per income statement 6 026 3 177Minority interest (12) (8)Share of net profit retained in distributable reserves (12) (9)Dividends received from associated companies (2 501) (2 156)
Share of net profit retained by associated companies 3 501 1 004Exchange rate differences on translation between average rates and year-end rates 14 (23)
Equity adjustment transferred to non-distributable reserves (Refer to statements of changes in equity) 3 515 981
Portion of the share of net profit/(loss) after exceptional items and amortisation, retained by associated companies, that has been accounted for from unaudited interim reports and management accounts 445 554
24. Minority interestSubsidiaries and joint ventures – per income statement 409 335Share of minority interest of associated companies 228 256
637 591
2005 2004R million R million

r e m g r o l i m i t e d79
NOTES TO THE ANNUAL FINANCIAL STATEMENTS FOR THE YEAR ENDED 31 MARCH 2005
�
25. Earnings per shareEarnings per shareIn determining the headline and basic earnings per share the weighted number of shares in issue, being 497 292 403(2004: 503 280 054), was taken into account after deduction of the treasury shares as well as shares held by The Remgro ShareTrust.
Diluted earnings per shareIn determining the diluted headline and basic earnings per share the weighted number of shares in issue was adjusted for thedeemed dilutive effect of the shares accepted by participants by the Remgro Share Scheme but not yet delivered. No adjustmentwas made to earnings.
Because the scheme shares have to be accounted for as treasury shares, the delivery thereof to participants will be regarded asan issue of shares. As the market value (fair value) of the shares at date of delivery will differ from the offer value, the numberof shares represented by the difference will be regarded as an issue of ordinary shares for no consideration. These imputedshares total 1 561 356 (2004: 1 090 042) and have been added to the weighted number of shares to determine the dilutiveeffect.
consolidated the company2005 2004 2005 2004
R million R million R million R million
26. Cash flow information26.1 Adjustments
Depreciation, amortisation of goodwill and trade marks 271 427 – –Other (24) 9 – –Movement in provisions 13 12 – –Interest received (273) (334) – –Interest paid 54 39 – –Dividends received (81) (28) (2 907) (1 380)Capital loss/(surplus) on the sale of investments (46) (50) – –Net impairment of assets (16) (7) – –Share scheme cost 13 25 – –Loan written off – 2 – –Unrealised agricultural gains – (3) – –Cash flow hedge (3) 4 – –Profit on the disposal of debentures (2 100) – – –
(2 192) 96 (2 907) (1 380)
26.2 Decrease/(increase) in working capitalDecrease/(increase) in inventories and biological agricultural assets 13 (105) – –Decrease/(increase) in trade and other receivables 300 54 – –Increase/(decrease) in trade and other payables (181) 123 1 2Net movement in derivative instruments 15 55 – –
147 127 1 2
26.3 Reconciliation of dividends received Per income statement 81 28 2 907 1 380Dividends from associated companies set off
against investments 2 501 2 156Dividend in specie – (466)Receivable at the end of the year (129) – – –
Cash received 2 453 1 718 2 907 1 380

r e m g r o l i m i t e d80
NOTES TO THE ANNUAL FINANCIAL STATEMENTSFOR THE YEAR ENDED 31 MARCH 2005
�
26. Cash flow information (continued)26.4 Reconciliation of taxation paid with the amount
disclosed in the income statement Paid in advance at the beginning of the year 31 19 2 2Unpaid at the beginning of the year (181) (158) – –Per income statement (372) (373) (1) –
– normal income (352) (361) (1) –– exceptional items (9) (2) – –– STC (11) (10) – –
Business acquired (15) (1) – –Business disposed – – – –Unpaid at the end of the year 60 181 – –Paid in advance at the end of the year (69) (31) – (2)
Cash (paid)/received (546) (363) 1 –
26.5 Reconciliation of dividends paid Per statements of changes in equity (2 509) (1 316) (2 610) (1 362)Paid by subsidiary companies to minority (133) (122)
Cash paid (2 642) (1 438) (2 610) (1 362)
2005 2004R million R million
27. Staff costs– of subsidiary companies
Salaries and wages 2 146 1 816Long-term share incentive scheme cost 13 25Retirement benefits 1 1Pension costs – defined contribution 98 84Pension costs – defined benefit 11 12Other post-retirement benefits 24 18Other 162 90
2 455 2 046
Number Number
Persons employed by subsidiary companies at year-end:South Africa 22 209 20 250Abroad 117 3
22 326 20 253
consolidated the company2005 2004 2005 2004
R million R million R million R million

r e m g r o l i m i t e d81
NOTES TO THE ANNUAL FINANCIAL STATEMENTS FOR THE YEAR ENDED 31 MARCH 2005
�
28. Directors’ emoluments2005 2004
Non- Non-Executive executive Total Executive executive Total
R’000 R’000 R’000 R’000 R’000 R’000
Salaries and fees 9 571.1 820.0 10 391.1 8 297.6 415.0 8 712.6Retirement fund contributions 2 022.7 2 022.7 1 764.4 1 764.4Other benefits 1 236.2 1 236.2 1 231.0 1 231.0
12 830.0 820.0 13 650.0 11 293.0 415.0 11 708.0
2005 2004Salaries Salaries
Fees and other Total Fees and other TotalR’000 R’000 R’000 R’000 R’000 R’000
Paid by:The Company 820.0 820.0 415.0 415.0Management company 500.0 12 330.0 12 830.0 250.0 11 043.0 11 293.0
1 320.0 12 330.0 13 650.0 665.0 11 043.0 11 708.0
2005 2004Salaries Retirement Other Salaries Retirement Other and fees fundbenefits(4) Total and fees fundbenefits(4) Total
R’000 R’000 R’000 R’000 R’000 R’000 R’000 R’000
ExecutiveW E Bührmann 1 201.1 238.1 218.2 1 657.4 1 028.8 204.0 217.2 1 450.0D M Falck 1 591.4 331.2 315.7 2 238.3 1 389.3 296.0 314.7 2 000.0J A Preller 854.6 169.4 218.3 1 242.3 765.9 151.9 217.2 1 135.0M H Visser(1) 4 870.1 1 075.0 265.8 6 210.9 4 168.3 925.0 264.7 5 358.0T van Wyk 1 053.9 209.0 218.2 1 481.1 945.3 187.5 217.2 1 350.0
Subtotal 9 571.1 2 022.7 1 236.2 12 830.0 8 297.6 1 764.4 1 231.0 11 293.0
2005 2004Retirement Retirement
Fees fund Other Total Fees fund Other TotalR’000 R’000 R’000 R’000 R’000 R’000 R’000 R’000
Non-executiveG D de Jager 100.0 100.0 50.0 50.0P K Harris 120.0 120.0 65.0 65.0E Molobi 100.0 100.0 50.0 50.0J F Mouton 150.0 150.0 85.0 85.0F Robertson 150.0 150.0 85.0 85.0P G Steyn(2) 75.0 75.0 80.0 80.0D Prins(3) 125.0 125.0
Subtotal 820.0 820.0 415.0 415.0
Total 10 391.1 2 022.7 1 236.2 13 650.0 8 712.6 1 764.4 1 231.0 11 708.0
(1) Mr M H Visser earns in addition to the above a director’s fee of GBP52 500 (2004: GBP50 000) per annum from British AmericanTobacco Plc, an associated company.
(2) Mr P G Steyn retired as a non-executive director on 25 August 2004.(3) Mr D Prins was appointed as an independent non-executive director on 23 June 2004.(4) Benefits include medical aid contributions and vehicle benefits.

r e m g r o l i m i t e d82
NOTES TO THE ANNUAL FINANCIAL STATEMENTSFOR THE YEAR ENDED 31 MARCH 2005
�
28. Directors’ emoluments (continued)Certain non-executive directors are employees of M&I Management Services (Pty) Limited (M&I), a service company thatrenders management services to this Company (Remgro). Remgro pays a monthly service fee to M&I. The emoluments ofthese non-executive directors paid by M&I were as follows:
2005 2004Retirement Other Retirement Other
Fees Salaries fund benefits Total Fees Salaries fund benefits TotalR’000 R’000 R’000 R’000 R’000 R’000 R’000 R’000 R’000 R’000
Non-executiveP E Beyers 100.0 1 142.7 246.4 99.2 1 588.3 50.0 1 078.1 223.7 98.2 1 450.0J W Dreyer 100.0 1 188.4 255.4 99.2 1 643.0 50.0 1 119.8 232.0 98.2 1 500.0E de la H Hertzog 100.0 809.6 160.7 72.7 1 143.0 50.0 736.9 140.7 72.4 1 000.0J P Rupert 100.0 2 221.4 460.4 218.2 3 000.0 50.0 2 272.2 460.6 217.2 3 000.0
400.0 5 362.1 1 122.9 489.3 7 374.3 200.0 5 207.0 1 057.0 486.0 6 950.0
29. Remgro Share SchemeCurrent status– ordinary shares
Balance of Share Balance ofshares price shares
accepted Shares Number of Date of on date of accepted as at accepted Date of Offer shares payment payment Increase as at
31 March during acceptance price paid and and delivery and delivery in value* 31 MarchParticipant 2004 the year of shares (Rand) delivered of shares (Rand) (R’000) 2005
ExecutiveW E Bührmann 185 229 – 43.60 – 185 229
97 872 30/11/04 87.86 – 97 872D M Falck 458 716 – 43.60 – 458 716
104 917 – 63.00 – 104 91730 050 30/11/04 87.86 – 30 050
J A Preller 73 394 – 43.60 – 73 39434 572 30/11/04 87.86 – 34 572
M H Visser 489 296 – 43.60 – 489 296278 979 – 63.00 – 278 979
342 488 30/11/04 87.86 – 342 488T van Wyk 33 195 – 48.20 – 33 195
73 394 – 43.60 24 466 13/08/04 77.99 841.4– 43.60 24 464 07/01/05 95.01 1 257.7 24 464
42 161 30/11/04 87.86 – 42 161
Subtotal 1 697 120 547 143 48 930 2 099.1 2 195 333
Non-executiveP E Beyers 286 697 – 43.60 19 920 25/08/04 77.50 675.3
– 43.60 75 467 26/08/04 78.50 2 633.8 191 310J W Dreyer 286 697 – 43.60 95 567 05/07/04 76.50 3 144.2 191 130E de la H Hertzog 172 018 – 43.60 114 679 08/02/05 92.50 5 607.8 57 339J P Rupert 414 938 – 48.20 – 414 938
Subtotal 1 160 350 – 305 633 12 061.1 854 717
Total 2 857 470 547 143 354 563 14 160.2 3 050 050
* Refers to the increase in value of the scheme shares of the indicated participants from the offer date to the date of payment and delivery.The scheme is a deferred purchase scheme – refer to the Report of the Board of Directors for more detail.
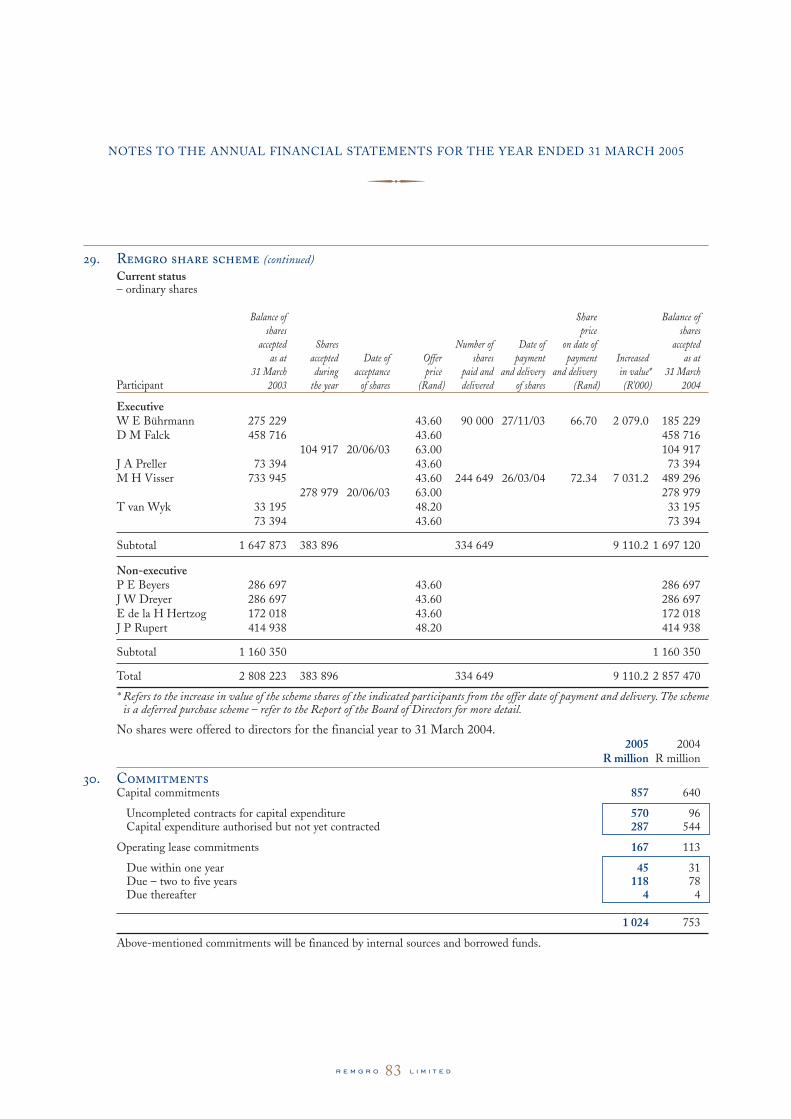
r e m g r o l i m i t e d83
NOTES TO THE ANNUAL FINANCIAL STATEMENTS FOR THE YEAR ENDED 31 MARCH 2005
�
29. Remgro share scheme (continued)Current status– ordinary shares
Balance of Share Balance ofshares price shares
accepted Shares Number of Date of on date of accepted as at accepted Date of Offer shares payment payment Increased as at
31 March during acceptance price paid and and delivery and delivery in value* 31 MarchParticipant 2003 the year of shares (Rand) delivered of shares (Rand) (R’000) 2004
ExecutiveW E Bührmann 275 229 43.60 90 000 27/11/03 66.70 2 079.0 185 229D M Falck 458 716 43.60 458 716
104 917 20/06/03 63.00 104 917J A Preller 73 394 43.60 73 394M H Visser 733 945 43.60 244 649 26/03/04 72.34 7 031.2 489 296
278 979 20/06/03 63.00 278 979T van Wyk 33 195 48.20 33 195
73 394 43.60 73 394
Subtotal 1 647 873 383 896 334 649 9 110.2 1 697 120
Non-executiveP E Beyers 286 697 43.60 286 697J W Dreyer 286 697 43.60 286 697E de la H Hertzog 172 018 43.60 172 018J P Rupert 414 938 48.20 414 938
Subtotal 1 160 350 1 160 350
Total 2 808 223 383 896 334 649 9 110.2 2 857 470
* Refers to the increase in value of the scheme shares of the indicated participants from the offer date of payment and delivery. The schemeis a deferred purchase scheme – refer to the Report of the Board of Directors for more detail.
No shares were offered to directors for the financial year to 31 March 2004.2005 2004
R million R million
30. CommitmentsCapital commitments 857 640
Uncompleted contracts for capital expenditure 570 96Capital expenditure authorised but not yet contracted 287 544
Operating lease commitments 167 113
Due within one year 45 31Due – two to five years 118 78Due thereafter 4 4
1 024 753
Above-mentioned commitments will be financed by internal sources and borrowed funds.

r e m g r o l i m i t e d84
NOTES TO THE ANNUAL FINANCIAL STATEMENTSFOR THE YEAR ENDED 31 MARCH 2005
�
31. Borrowing powersThere are no limitations to the borrowing powers of the Company and its subsidiaries in respect of loans and guaranteed debts.
32. Financial instruments32.1 Credit risk
Financial assets which are subject to credit risk consist mainly of cash and cash equivalents and debtors and short-termloans. Cash and cash equivalents are placed with various financial institutions subject to approved limits. All theseinstitutions are of a high standing. Debtors and short-term loans are disclosed net of a provision for doubtful debt.
32.2 Interest rate riskSubsidiary companies generally adopt a policy of ensuring that their borrowings are at market-related rates to addresstheir interest rate risk. The interest rate profiles of loans are disclosed in note 13 to the annual financial statements.
32.3 Derivative instrumentsForward exchange contracts – Subsidiary companies undertake transactions denominated in foreign currency and thereforeexposures to exchange rate fluctuations arise. If deemed necessary, these exposures are hedged through the use of forwardexchange contracts.
Other derivative instruments – If deemed necessary, subsidiary companies utilise commodity option and futures contractsto hedge their exposure to commodity price risks.
The following material derivative instruments existed at 31 March:
2005 2004Currency Forward Fair value Currency Forward Fair value
value value adjustment value value adjustmentAssets million R million R million million R million R million
Foreign exchange contractsBuy: British pound (GBP) 1.1 12.1 0.4 – – –Sell: USA dollar (USD) 5.1 31.9 0.9 11.2 74.1 7.2
1.3 7.2
Liabilities
Foreign exchange contractsBuy: British pound (GBP) 0.6 7.1 0.1 0.6 7.6 0.3
Other 2.6 0.1 3.1 0.3Sell: USA dollar (USD) – – – 0.4 2.4 0.1
0.2 0.7
Other derivative instrumentsSugar selling contracts 1.2 3.9Maize option contracts 11.4 –Maize purchase contracts 4.6 3.5
17.2 7.4
17.4 8.1
32.4 Fair valueOn 31 March 2005 and 2004 the fair value of financial instruments, excluding investments in associated companies,equals their carrying value.
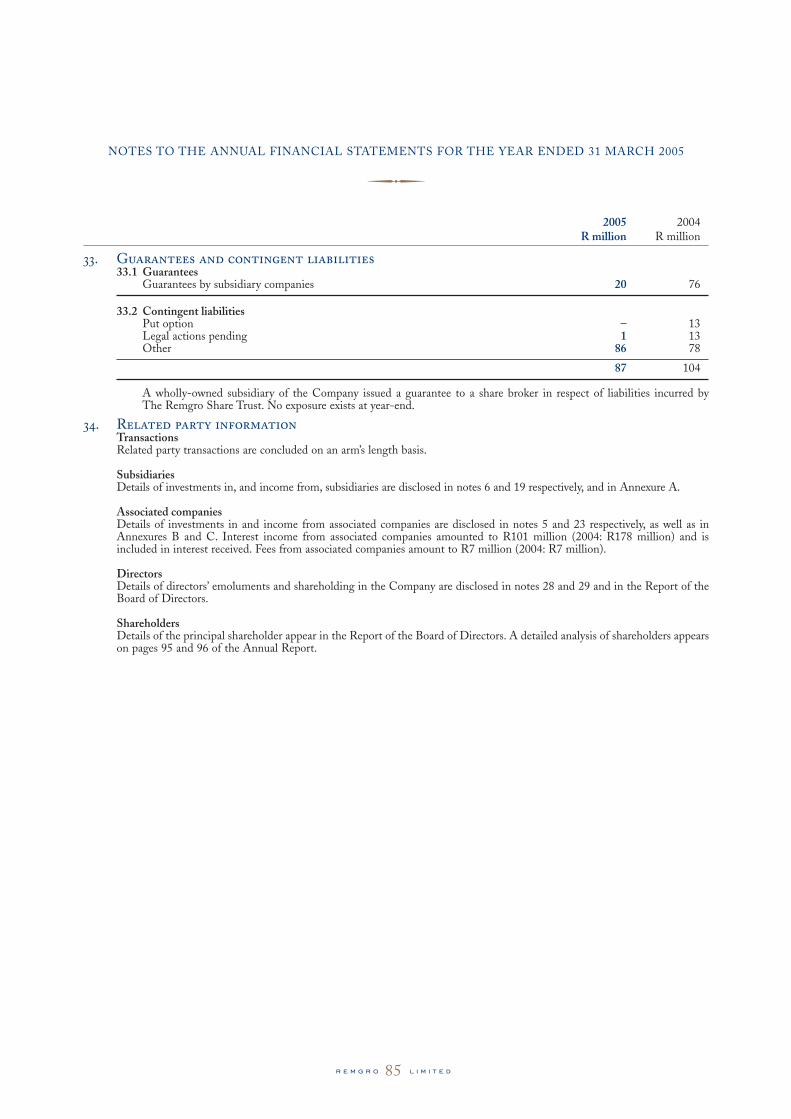
r e m g r o l i m i t e d85
NOTES TO THE ANNUAL FINANCIAL STATEMENTS FOR THE YEAR ENDED 31 MARCH 2005
�
33. Guarantees and contingent liabilities33.1 Guarantees
Guarantees by subsidiary companies 20 76
33.2 Contingent liabilitiesPut option – 13Legal actions pending 1 13Other 86 78
87 104
A wholly-owned subsidiary of the Company issued a guarantee to a share broker in respect of liabilities incurred by The Remgro Share Trust. No exposure exists at year-end.
34. Related party informationTransactionsRelated party transactions are concluded on an arm’s length basis.
SubsidiariesDetails of investments in, and income from, subsidiaries are disclosed in notes 6 and 19 respectively, and in Annexure A.
Associated companiesDetails of investments in and income from associated companies are disclosed in notes 5 and 23 respectively, as well as inAnnexures B and C. Interest income from associated companies amounted to R101 million (2004: R178 million) and isincluded in interest received. Fees from associated companies amount to R7 million (2004: R7 million).
DirectorsDetails of directors’ emoluments and shareholding in the Company are disclosed in notes 28 and 29 and in the Report of theBoard of Directors.
ShareholdersDetails of the principal shareholder appear in the Report of the Board of Directors. A detailed analysis of shareholders appearson pages 95 and 96 of the Annual Report.
2005 2004R million R million

r e m g r o l i m i t e d86
ANNEXURE APRINCIPAL SUBSIDIARY COMPANIES AT 31 MARCH 2005
�
Tobacco interestsRemgro International Holdings (Pty) Limited 2 100.0 100.0 2 2Remgro Investments Limited – Jersey (GBP) 1 201 610 100.0 100.0
Financial servicesFinancial Securities Limited 250 000 100.0 100.0 250 000 250 000
Industrial interestsIndustrial Partnership Investments Limited 125 000 100.0 100.0 125 000 125 000Robertsons Holdings (Pty) Limited 1 000 100.0 100.0Transvaal Sugar Limited 8 100.0 100.0Rainbow Chicken Limited * 1 105 959 000 62.8 64.2Wispeco Holdings Limited 5 000 000 100.0 100.0Medi-Clinic Corporation Limited * 35 007 000 52.0 52.3
Mining interestsPartnership in Mining Limited 100 100.0 100.0 100 100Tegniese Mynbeleggings Limited 2 100.0 100.0
Corporate finance and other interestsEikenlust (Pty) Limited 100 100.0 100.0Entek Investments Limited 810 630 63.5 63.0Historical Homes of South Africa Limited 555 000 51.4 51.4M.F.I. Investments (Pty) Limited 2 100.0 100.0Remgro Finance and Services Limited 100 100.0 100.0Remgro Finance Corporation Limited 300 000 100.0 100.0Remgro Investments (Pty) Limited 4 100.0 100.0Remgro Loan Corporation Limited 700 100.0 100.0 7 088 6 791Remgro South Africa (Pty) Limited 48 614 100.0 100.0 96 506 96 506 912 912Stellenryck Trust Limited 700 100.0 100.0TTR Holdings (Pty) Limited 7 100.0 100.0 7 7
Note 6.1: 8 000 7 703
(GBP) British pound* Listed company
Details of sundry subsidiary companies which are not material to the evaluation of the business of the Group, are not shown.
name of company Issued Effective held by companycapital interest Shares Loan
Incorporated in South Africa R (unless other- 2005 2004 2005 2004 2005 2004unless otherwise stated wise stated) % % R R R million R million

r e m g r o l i m i t e d87
ANNEXURE BPRINCIPAL INVESTMENTS AT 31 MARCH 2005
�
Tobacco interests R&R Holdings SA – Luxembourg (1)– ordinary shares 316 000 33.3 316 000 33.3– debentures 682 291 33.3 870 516 33.3– participating securities 19 281 686 100.0 – –– held by R&R Holdings SA:
– BAT Plc – UK (28%) (1) 10.0 9.8
Financial servicesRMB Holdings Limited (2) 274 109 670 23.1 274 109 670 23.1– held by RMB Holdings Limited:
– FirstRand Limited (34%) 7.9 8.0
FirstRand Limited (2) 520 716 856 10.0 520 716 856 10.1Absa Group Limited (1) 61 387 729 9.4 61 387 729 9.4Sagecor (Pty) Limited (1) 2 992 50.0 2 992 50.0– held by Sagecor (Pty) Limited:
– Sage Group Limited (8%) 3.9 3.9
Sage Group Limited (2) 65 025 446 17.9 65 025 446 17.9
Industrial interestsAir Products South Africa (Pty) Limited (1) 4 500 000 50.0 4 500 000 50.0Dorbyl Limited (1) 14 058 346 42.6 14 058 346 42.6Henkel South Africa (Pty) Limited (2)– ordinary shares – – 4 812 500 50.0– preference ordinary shares – – 12 550 000 50.0Nampak Limited (1) 86 774 104 13.7 86 774 104 13.5Unilever Bestfoods Robertsons
(Holdings) Limited L.L.C. – USA (1) 8 200 41.0 8 200 41.0Total South Africa (Pty) Limited *(2) 12 872 450 33.2 12 872 450 33.2Remgro-KWV Beleggings Limited (2) 50 50.0 50 50.0– held by Remgro-KWV
Beleggings Limited:
– Distell Group Limited (60%) 29.8 29.9
Mining interests Gencor Limited (2) 37 995 039 10.9 37 995 039 10.9Impala Platinum Holdings Limited ** 3 335 911 5.0 3 335 911 5.0Trans Hex Group Limited (1) 30 215 000 33.9 30 215 000 34.2
Other interestsBusiness Partners Limited ** 28 696 220 16.0 28 696 220 16.0
Financial period accounted for:(1) Twelve months to 31 March 2005(2) Twelve months to 31 December 2004
* Effective interest 24.9%, on a fully diluted basis** Not an associated company
UK – United KingdomUSA – United States of America
Details of investments which are not material to the evaluation of the business of the Group, are not shown.
name of company listed unlisted2005 2004 2005 2004
Effective Effective Effective EffectiveIncorporated in South Africa Shares interest Shares interest Shares interest Shares interestunless otherwise stated held % held % held % held %

r e m g r o l i m i t e d88
ANNEXURE CSIGNIFICANT ASSOCIATED COMPANIES – ADDITIONAL INFORMATION
�
Effective interest 23.1% 10.0% 9.4% 33⅓%
R million R million R million R million
Carrying value of investments 3 612 4 235 2 226 13 417
Share of retained equity income – Current year 298 246 401 2 502
Normal income 540 623 516 2 029Dividends (258) (279) (126) (1 379)Impairment and amortisation of goodwill (39) (4) (10) (309)Exceptional items 73 48 14 1 921Other changes in reserves and exchange rates (18) (142) 7 240
– Cumulative 934 1 112 1 986 11 208
Summarised financial information: Per Per Per PerInterim Report Interim Report Annual Report Annual Report
31/12/2004 31/12/2004 31/03/2005 31/03/2005
Note 1Balance sheetAssetsNet insurance-related assets – 340 – –Net advances, loans and bank-related securities 1 079 41 405 (7 155) –Intangible assets 3 466 805 197 83 851Property, plant and equipment and other 105 993 27 497 26 231Investments and loans 8 935 11 336 9 016 25 866Net current assets/(liabilities) – (16 452) – 11 106
13 585 38 427 29 555 147 054
Equity and liabilitiesShareholders’ funds and long-term debt 13 585 38 427 29 555 147 054
12 months 12 months 12 months 12 monthsended ended ended ended
31/12/2004 31/12/2004 31/03/2005 31/03/2005
Note 2Income statementHeadline earnings 2 342 6 315 5 484 6 060Net profit for the year 2 489 6 664 5 511 10 904Dividends paid 921 2 333 1 338 4 137
There are no loans to these associated companies.
Note 1: In the audited balance sheet of R&R, its interest in British American Tobacco Plc (BAT) is only shown as a single itemrepresenting the carrying value thereof as an equity accounted associated company. So as to disclose more meaningfulinformation, BAT’s abridged balance sheet is presented above instead. This balance sheet is at 31 December 2004 as BAT hasnot included a balance sheet in its quarterly report to 31 March 2005.
Note 2: Headline earnings and net profit for the year relates to the income statement of R&R which includes its share of the net profit of BAT.
Note 3: The investments above represent 83% of the total carrying value of associated companies.
RMB Holdings FirstRand Absa R&R(Financial (Financial (Financial (Tobacco
services) services) services) interests)2005 2005 2005 2005

r e m g r o l i m i t e d89
ANNEXURE C: SIGNIFICANT ASSOCIATED COMPANIES – ADDITIONAL INFORMATION
�
Effective interest 23.1% 10.1% 9.4% 33⅓%
R million R million R million R million
Carrying value of investments 3 314 3 988 1 825 8 706
Share of retained equity income – Current year 248 334 235 (637)
Normal income 453 519 414 2 100Dividends (172) (197) (96) (1 014)Impairment and amortisation of goodwill (62) (16) (5) (278)Exceptional items 3 6 15 (606)Other changes in reserves and exchange rates 26 22 (93) (839)
– Cumulative 636 866 1 585 8 706
Summarised financial information: Per Per Per PerInterim Report Interim Report Annual Report Annual Report
31/12/2003 31/12/2003 31/03/2004 31/03/2004
Note 1Balance sheetAssetsNet insurance-related assets – 3 496 – –Net advances, loans and bank-related securities 581 33 638 (15 536) –Intangible assets 3 264 561 134 92 899Property, plant and equipment and other 30 2 319 35 574 29 892Investments and loans 8 215 3 121 6 416 9 798Net current assets/(liabilities) – (10 171) – 10 238
12 090 32 964 26 588 142 827
Equity and liabilitiesShareholders’ funds and long-term debt 12 090 32 964 26 588 142 827
12 months 12 months 12 months 12 monthsended ended ended ended
31/12/2003 31/12/2003 31/03/2004 31/03/2004
Note 2Income statementHeadline earnings 1 964 5 469 4 447 6 300Net profit for the year 1 707 5 315 4 505 3 648Dividends paid 653 1 908 1 023 3 042
There are no loans to these associated companies.
Note 1: In the audited balance sheet of R&R, its interest in British American Tobacco Plc (BAT) is only shown as a single itemrepresenting the carrying value thereof as an equity accounted associated company. So as to disclose more meaningfulinformation, BAT’s abridged balance sheet is presented above instead. This balance sheet is at 31 December 2003 as BAT hasnot included a balance sheet in its quarterly report to 31 March 2004.
Note 2: Headline earnings and net profit for the year relates to the income statement of R&R which includes its share of the net profit of BAT.
Note 3: The investments above represent 78% of the total carrying value of associated companies.
RMB Holdings FirstRand Absa R&R(Financial (Financial (Financial (Tobacco
services) services) services) interests)2004 2004 2004 2004

r e m g r o l i m i t e d90
ANNEXURE DINFORMATION ON BUSINESS AND GEOGRAPHICAL SEGMENTS FOR THE YEAR ENDED 31 MARCH 2005
�
Business segment analysisRevenue 1 446 662 10 424 93 198 12 823
Consolidated profit after finance cost 16 – 1 254 70 35 1 375Impairment and amortisation of goodwill (3)Net impairment of investments and assets 24Exceptional items 2 194
Consolidated profit before tax 3 590Taxation (400)
Consolidated profit after tax 3 190Share of after-tax profit of associated companies 6 026
Profit before taking into account the following 2 029 1 680 755 31 – 4 495Impairment and amortisation of goodwill (403)Net impairment of investments and assets (30)Exceptional items 1 964
Group profit after tax 9 216Minority interest (409)
Net profit for the year 8 807
Headline earnings 2 029 1 695 1 125 101 32 4 982
Other informationSegment assets 314 7 8 025 1 751 1 081 11 178Investments in associated companies 13 417 10 177 4 463 358 – 28 415
39 593Taxation – Deferred 173
– Current 60
Consolidated total assets 39 826
Segment liabilities 1 – 2 222 87 24 2 334Taxation – Deferred 452
– Current 69
Consolidated total liabilities 2 855
Additions to property, plant and equipmentand intangible assets – – 808 – – 808
Depreciation and amortisation 309 43 298 2 – 652
The interests of the Group have been classified into five main operating divisions/business segments – tobacco interests, financial services, industrialinterests, mining interests and corporate finance/other interests. Each segment represents the main business sector of the investments classifiedthereunder. No adjustment has been made where companies are mainly active in one sector but have also interests in other sectors.
Income and expenses, as well as the attributable portion of the income from associated companies, are directly attributable to the segment.
Segment assets mainly include cash and cash equivalents, debtors and short-term loans, inventories, property, plant and equipment, intangible assetsand other investments. Investments in associated companies, accounted for on the equity method, are stated separately.
Segment liabilities include all operating liabilities, except for taxation.
Geographical segmental analysisThe Group’s interests can be divided into two main geographical areas, namely South Africa and abroad. Capital Headline Total
expenditure Revenue earnings assetsR million 2005 2005 2005 2005
South Africa 808 11 439 2 949 25 862Abroad – 1 384 2 033 13 731
808 12 823 4 982 39 593
Total assets include assets and investments in associated companies, but exclude deferred tax assets and taxation paid in advance.
Corporate consoli-finance dated
Tobacco Financial Industrial Mining and other 2005R million interests services interests interests interests Total

r e m g r o l i m i t e d91
ANNEXURE D:
INFORMATION ON BUSINESS AND GEOGRAPHICAL SEGMENTS FOR THE YEAR ENDED 31 MARCH 2004
�
Business segment analysisRevenue 1 062 466 9 484 525 226 11 763
Consolidated profit after finance cost (1) 1 1 222 20 50 1 292Impairment and amortisation of goodwill (186)Net impairment of investments and assets 4Exceptional items 50
Consolidated profit before tax 1 160Taxation (397)
Consolidated profit after tax 763Share of after-tax profit of associated companies 3 177
Profit before taking into account the following 2 100 1 396 520 151 (3) 4 164Impairment and amortisation of goodwill (383)Exceptional items (604)
Group profit after tax 3 940Minority interest (335)
Net profit for the year 3 605
Headline earnings 2 100 1 394 995 172 26 4 687
Other informationSegment assets 4 5 6 479 1 720 2 612 10 820Investments in associated companies 8 706 9 201 4 478 352 – 22 737
33 557Taxation – Deferred 142
– Current 31
Consolidated total assets 33 730
Segment liabilities 1 – 1 727 – 16 1 744Taxation – Deferred 394
– Current 181
Consolidated total liabilities 2 319
Additions to property, plant and equipmentand intangible assets – 53 490 – – 543
Depreciation and amortisation 277 199 307 1 – 784
The interests of the Group have been classified into five main operating divisions/business segments – tobacco interests, financial services, industrialinterests, mining interests and corporate finance/other interests. Each segment represents the main business sector of the investments classifiedthereunder. No adjustment has been made where companies are mainly active in one sector but have also interests in other sectors.
Income and expenses, as well as the attributable portion of the income from associated companies, are directly attributable to the segment.
Segment assets mainly include cash and cash equivalents, debtors and short-term loans, inventories, property, plant and equipment, intangible assetsand other investments. Investments in associated companies, accounted for on the equity method, are stated separately.
Segment liabilities include all operating liabilities, except for taxation.
Geographical segmental analysisThe Group’s interests can be divided into two main geographical areas, namely South Africa and abroad. Capital Headline Total
expenditure Revenue earnings assetsR million 2004 2004 2004 2004
South Africa 543 10 749 2 587 24 847Abroad – 1 014 2 100 8 710
543 11 763 4 687 33 557
Total assets include assets and investments in associated companies, but exclude deferred tax assets and taxation paid in advance.
Corporate consoli-finance dated
Tobacco Financial Industrial Mining and other 2004R million interests services interests interests interests Total

r e m g r o l i m i t e d92
ANNEXURE EBUSINESSES ACQUIRED
�
Property, plant and equipment 203 1 90 294 128 1 82 211Biological agricultural assets 13 13 13 13Investment properties 1 – 1 1 – 1Investments and loans – 20 12 32 20 12 32Deferred tax asset 26 2 28 26 – 2 28Cash resources 61 24 – 85 61 24 – 85Other current assets 490 27 9 526 488 27 10 525Retirement benefits (25) (75) – (100) (25) (75) – (100)Interest-bearing debt (17) (17) (17) (17)Deferred tax liability (22) – (22) –Interest-free debt (553) (14) (3) (570) (551) (14) (4) (569)Taxation payable (11) – (11) (12) (12)
Net assets acquired 169 (16) 106 259 115 (16) 98 197Interest of outside shareholders 1 1 Goodwill 287 39 8 334 Less: Existing investments (6) (6)
Cash paid 456 23 109 588 Cash acquired from business (61) (24) – (85)
Net cash flow on acquisition of businesses 395 (1) 109 503
Vector BookerLogistics(1) Tate(2)
Acquisition date 01/10/04 01/10/04Percentage interest 100% 100%Payment method Cash CashAcquired by Rainbow TSBNet profit since acquisition 21 5Pro forma net profit assuming acquisition
at beginning of the year 41 1Headline earnings since acquisition 21 5Pro forma headline earnings assuming
acquisition at beginning of the year 41 1Pro forma revenue assuming acquisition
at beginning of the year 374 65
(1) Vector Logistics is a specialist logistics service provider for the food and food-related industries within Southern Africa.(2) Booker Tate renders management services to sugar mills and refineries.
Analysis of the fair values and carrying values of net assets of businesses acquired
FAIR VALUES CARRYING VALUES
Vector Booker 2005 Vector Booker 2005R million Logistics(1) Tate(2) Other Total Logistics Tate Other Total

r e m g r o l i m i t e d93
COMPANY INFORMATION
�SecretaryM Lubbe (Mrs)
Business address and registered officeCarpe Diem Office ParkQuantum StreetTechno ParkStellenbosch7600
PO Box 456Stellenbosch7599
Transfer SecretariesComputershare Investor Services 2004 (Proprietary) Limited70 Marshall Street Johannesburg2001
PO Box 61051Marshalltown2107
AuditorsPricewaterhouseCoopers Inc.Stellenbosch
ListingJSE Securities Exchange South AfricaSector: Financial – Investment Companies
American depositary receipt (ADR) programCusip number 75956M107ADR to ordinary share 1:1
Depositary:The Bank of New York101 Barclay StreetNew York NY 10286
SponsorRand Merchant Bank (A division of FirstRand Bank Limited)
Websitewww.remgro.com

r e m g r o l i m i t e d94
SHAREHOLDERS’ INFORMATION
�DATES OF IMPORTANCE TO SHAREHOLDERS
Financial year-end 31 MarchAnnual general meeting Friday, 26 August 2005
Financial reportsAnnouncement of interim results NovemberInterim report DecemberAnnouncement of annual results JuneAnnual financial statements July
DividendsInterim dividend– declared November– paid JanuaryFinal dividend– declared June– paid August
Final dividend number 10Ordinary dividend per share 198 centsLast day to trade in order to participate in the final dividend Friday, 12 August 2005 Trading on or after this date will be ex the final dividend Monday, 15 August 2005 Record date Friday, 19 August 2005 Payment date Monday, 22 August 2005

r e m g r o l i m i t e d95
SHAREHOLDERS’ INFORMATION
�STATISTICS AT 31 MARCH 2005
Major beneficial shareholdersOrdinary sharesPublic Investment Commissioner 12.86 62 542 225 12.97 63 101 913Old Mutual Life Assurance Company SA 8.56 41 645 623 8.78 42 692 650Remgro subsidiaries 6.27 30 521 841 3.38 16 442 602Sanlam 5.21 25 344 255 5.66 27 546 366Other 67.10 326 439 706 69.21 336 710 119
100.00 486 493 650 100.00 486 493 650B ordinary sharesRembrandt Trust (Pty) Limited 100.00 35 506 352 100.00 35 506 352
Total 522 000 002 522 000 002
No other shareholder held a beneficial interest of more than 5% in the ordinary shares in your Company on 31 March.
2005 2004Number of Number of
% shares % shares
2005 2004 2003 2002
Distribution of shareholdersOrdinary sharesPublic shareholders 27 321 25 600 25 657 17 070
Percentage of shareholders 99.91 99.91 99.89 99.80Number of shares 448 808 224 462 478 974 467 859 404 483 412 586Percentage of shares issued 92.25 95.06 96.17 99.37
Non-public shareholdersDirectors and their associates/Share Trust/Treasury shares 24 24 30 27
Percentage of shareholders 0.09 0.09 0.11 0.20Number of shares 37 685 426 24 014 676 18 634 246 3 081 064Percentage of shares issued 7.75 4.94 3.83 0.63
Number of shareholders 27 345 25 624 25 687 17 097

r e m g r o l i m i t e d96
SHAREHOLDERS’ INFORMATION
�2005 2004 2003 2002
additional information (2005)
Private 15%Overseas 10%
Institutional 85% South Africa 90%
Institutional and private shareholding inRemgro Limited ordinary shares
Overseas and local shareholding in Remgro Limited ordinary shares
additional information (2004)
Private 14%Overseas 9%
Institutional 86% South Africa 91%
Institutional and private shareholding inRemgro Limited ordinary shares
Overseas and local shareholding in Remgro Limited ordinary shares
Number of shares in issue– Ordinary shares of 1 cent each 486 493 650 486 493 650 486 493 650 486 493 650– Unlisted B ordinary shares of 10 cents each 35 506 352 35 506 352 35 506 352 35 506 352
Total number of shares in issue 522 000 002 522 000 002 522 000 002 522 000 002Ordinary shares repurchased and held in treasury (30 521 841) (16 442 602) (11 616 128) –Ordinary shares purchased by The Remgro Share Trust
and accounted for as treasury shares (4 381 159) (4 236 087) (3 950 000) –
487 097 002 501 321 313 506 433 874 522 000 002
Weighted number of shares 497 292 403 503 280 054 516 517 429

r e m g r o l i m i t e d97
SHAREHOLDERS’ INFORMATION
�
31 March 2005
P E Beyers 34 024 – 9 000 – 43 024W E Bührmann 38 027 – – – 38 027G D de Jager 28 740 – 108 300 – 137 040D M Falck 200 – 18 133 – 18 333P K Harris – – 57 118 – 57 118E de la H Hertzog 228 245 – 1 614 564 4 484 1 847 293E Molobi 174 – – – 174J F Mouton – – 20 000 – 20 000J A Preller 26 141 – – – 26 141F Robertson – – 1 000 – 1 000J P Rupert – – 270 001 – 270 001T van Wyk 76 926 – – – 76 926M H Visser – – 244 649 – 244 649
432 477 – 2 342 765 4 484 2 779 726
31 March 2004
P E Beyers 34 024 – 7 000 – 41 024W E Bührmann 38 027 – – – 38 027G D de Jager 1 740 – 128 300 – 130 040D M Falck 200 – 18 133 – 18 333P K Harris – – 57 118 – 57 118E de la H Hertzog 228 245 – 1 499 885 4 484 1 732 614E Molobi 174 – – – 174J F Mouton – – 20 000 – 20 000J A Preller 26 141 – – – 26 141F Robertson – – 1 000 – 1 000J P Rupert – – 270 001 – 270 001P G Steyn – – 708 870 – 708 870T van Wyk 47 996 – – – 47 996M H Visser – – 244 649 – 244 649
376 547 – 2 954 956 4 484 3 335 987
B ordinary sharesMr J P Rupert is a director of Rembrandt Trust (Pty) Limited which owns all the issued unlisted B ordinary shares.
Since the end of the financial year to the date of this report the interest of directors remained unchanged.
Interest of the directors in the issued capital of the CompanyOrdinary shares
Direct IndirectNon- Non-
Beneficial beneficial Beneficial beneficial Total

r e m g r o l i m i t e d98
NOTICE TO SHAREHOLDERS
�
The 2005 Annual General Meeting of the Company will be held on Friday, 26 August 2005, at 09:00 in The Ballroom, The LordCharles Hotel, Corner of Faure and Stellenbosch Roads, Somerset West, to, if approved, pass the following resolutions with orwithout modification:
1. Approval of annual financial statementsOrdinary Resolution Number 1Resolved that the audited annual financial statements of the Company and the Group for the year ended 31 March 2005 beaccepted and approved.
2. Approval of directors’ remunerationOrdinary Resolution Number 2Resolved that the joint remuneration of the non-executive directors in the amount of R1 720 000 for the year ended 31 March 2005 be approved.
3. Election of directorOrdinary Resolution Number 3Resolved that Mr W E Bührmann who retires in terms of clause 31.1.1 of the Company’s Articles of Association and who hasoffered himself for re-election, be hereby re-elected as a director of the Company.
4. Election of directorOrdinary Resolution Number 4Resolved that Mr J W Dreyer who retires in terms of clause 31.1.1 of the Company’s Articles of Association and who hasoffered himself for re-election, be hereby re-elected as a director of the Company.
5. Election of directorOrdinary Resolution Number 5Resolved that Dr E de la H Hertzog who retires in terms of clause 31.1.1 of the Company’s Articles of Association and whohas offered himself for re-election, be hereby re-elected as director of the Company.
6. Election of directorOrdinary Resolution Number 6Resolved that Mrs J A Preller who retires in terms of clause 31.1.1 of the Company’s Articles of Association and who hasoffered herself for re-election, be hereby re-elected as a director of the Company.
7. Election of directorOrdinary Resolution Number 7Resolved that Mr T van Wyk who retires in terms of clause 31.1.1 of the Company’s Articles of Association and who hasoffered himself for re-election, be hereby re-elected as a director of the Company.
Biographical details of all directors of the Company are set out on pages 10 and 11.

r e m g r o l i m i t e d99
NOTICE TO SHAREHOLDERS
�
8. Authority to place shares under control of the directorsOrdinary Resolution Number 8Resolved that the entire authorised but unissued share capital of the Company comprising 26 000 000 ordinary shares of onecent each and 5 000 000 B ordinary shares of ten cents each, which shares were reserved for allotment and issue in terms ofThe Remgro Share Trust in terms of an ordinary resolution of shareholders adopted on 21 September 2000, be and are herebyplaced under the control of the Board of Directors of the Company as a general authority in terms of section 221(2) of theCompanies Act (Act 61 of 1973), as amended (“the Companies Act”), for allotment and issue in accordance with the rules ofThe Remgro Share Trust. This authority is subject to the provisions of the Companies Act, the Articles of Association of theCompany and the Listings Requirements of the JSE Securities Exchange South Africa (“the Listings Requirements”) and willbe valid until the next annual general meeting.
9. Amendment of the rules of the Remgro Share SchemeOrdinary Resolution Number 9Resolved that the resolution passed by the directors on 26 November 2004 in terms whereof the rules of the Remgro ShareScheme was amended by replacing the word “tenth” in clause 4.1.2.3 and clause 4.1.3 of the rules with the word “seventh”, behereby confirmed.
10. Authority to repurchase sharesSpecial Resolution Number 1Resolved that the Board of Directors of the Company be hereby authorised, by way of a renewable general authority, to approvethe purchase of its own ordinary shares by the Company or to approve the purchase of ordinary shares in the Company by anysubsidiary of the Company, provided that:
• this general authority shall be valid until the Company’s next annual general meeting or for 15 months from the date of thisresolution, whichever period is shorter;
• the ordinary shares be purchased through the order book of the JSE trading system and done without any priorunderstanding or arrangement between the Company and/or the relevant subsidiary and the counterparty;
• an announcement complying with 11.27 of the Listings Requirements be published by the Company (i) when the Companyand/or its subsidiaries have cumulatively repurchased 3% of the ordinary shares in issue as at the time the general authoritywas given (“the initial number”); and (ii) for each 3% in aggregate of the initial number of ordinary shares acquired thereafterby the Company and/or its subsidiaries;
• the general repurchase by the Company of its own ordinary shares shall not in the aggregate in any one financial year exceed20% of the Company’s issued share capital of that class, provided that the acquisition of ordinary shares as treasury stock bya subsidiary of the Company shall not exceed 10% in the aggregate of the number of issued shares of the Company;
• repurchases must not be made at a price more than 10% above the weighted average of the market value of the ordinaryshares for the five business days immediately preceding the date on which the transaction is effected;
• at any point in time the Company may only appoint one agent to effect any repurchase on the Company’s behalf or on behalfof any subsidiary of the Company;
• the Company will after a repurchase still comply with the provisions of the Listings Requirements regarding shareholderspread;
• the Company and the subsidiary will not repurchase ordinary shares during a prohibited period (as defined in the ListingsRequirements); and
• such repurchase shall be subject to the Companies Act, the Company’s Articles of Association and the Listings Requirements.

r e m g r o l i m i t e d100
NOTICE TO SHAREHOLDERS
�
It is the intention of the Board of Directors that they may use such general authority should prevailing circumstances (including thetax dispensation and market conditions), in their opinion, warrant it.
The Company’s directors undertake that they will not implement any such repurchases while this general authority is valid, unless:
• the Company and its group subsidiary companies will be able, in the ordinary course of business, to pay its debts for a period of12 months after the date of the notice of the annual general meeting at which this resolution is proposed (“the annual generalmeeting”);
• the assets of the Company and its group subsidiary companies will exceed the liabilities of the Company and its subsidiarycompanies for a period of 12 months after the date of the notice of the annual general meeting. For this purpose, the assets andliabilities will be recognised and measured in accordance with the accounting policies used in the Company’s latest audited annualgroup financial statements;
• the Company and its group subsidiary companies will have adequate share capital and reserves for ordinary business purposes fora period of 12 months after the date of the notice of the annual general meeting;
• the working capital of the Company and its group subsidiaries will be adequate for ordinary business purposes for a period of 12 months after the date of the notice of the annual general meeting; and
• upon entering the market to proceed with the repurchase, the Company’s sponsor has confirmed the adequacy of the Company’sworking capital for the purposes of undertaking a repurchase of shares in writing to the JSE.
Reason for and effect of Special Resolution Number 1The reason for and the effect of the special resolution is to grant the Company’s directors a general authority to approve the Company’srepurchase of its own shares and to permit a subsidiary of the Company to purchase shares in the Company.
For the purposes of considering special resolution number 1 and in compliance with 11.26 of the Listings Requirements, theinformation listed below has been included in the Annual Report, in which this notice of annual general meeting is included, at theplaces indicated:
• Directors and management (pages 10 and 11);• Major shareholders (page 95);• No material changes to report on;• Directors’ interests in securities (page 97);• Share capital of the Company (pages 71 and 96);• The directors, whose names are set out on pages 10 and 11 of this report, collectively and individually accept full responsibility for
the accuracy of the information contained in this Special Resolution Number 1 and certify that, to the best of their knowledgeand belief, that there are no other facts, the omission of which would make any statement false or misleading and that they havemade all reasonable queries in this regard and that this resolution contains all information required by law and the ListingsRequirements;
• There are no legal or arbitration proceedings (including any such proceedings that are pending or threatened of which theCompany is aware), which may have or have had a material effect on Remgro’s financial position over the last 12 months.

r e m g r o l i m i t e d101
NOTICE TO SHAREHOLDERS
�
And to transact any other business that may be transacted at an annual general meeting.
Members who have not dematerialised their shares or who have dematerialised their shares with “own name” registration are entitledto attend and vote at the meeting and are entitled to appoint a proxy or proxies to attend, speak and vote in their stead. The personso appointed need not be a member of the Company. Proxy forms must be lodged with the transfer secretaries of the Company,Computershare Investor Services 2004 (Pty) Limited at 70 Marshall Street, Johannesburg, 2001, South Africa, or posted to thetransfer secretaries at PO Box 61051, Marshalltown, 2107, South Africa, to be received by them not later than Wednesday,24 August 2005, at 09:00 (South African time).
Proxy forms should only be completed by members who have not dematerialised their shares or who have dematerialised their shareswith “own name” registration.
On a show of hands, every member of the Company present in person or represented by proxy shall have one vote only. On a poll,every member of the Company shall have one vote for every share held in the Company by such member.
Members who have dematerialised their shares, other than those members who have dematerialised their shares with “own name”registration, should contact their Central Securities Depository Participant (CSDP) or broker in the manner and time stipulated intheir agreement:
• to furnish them with their voting instructions; and• in the event that they wish to attend the meeting, to obtain the necessary authority to do so.
By order of the Board of Directors.
M Lubbe Secretary
Stellenbosch21 June 2005

r e m g r o l i m i t e d102
EXPLANATORY NOTES TO THE NOTICE TOSHAREHOLDERS
�
ORDINARY RESOLUTIONS
Ordinary Resolution Number 1Approval of annual financial statementsIn terms of the Companies Act (Act 61 of 1973), as amended (“the Act”), the directors are obliged to present the annual financialstatements and Group annual financial statements to the members at the annual general meeting for consideration.
Ordinary Resolution Number 2Approval of directors’ remunerationIn terms of the Company’s Articles of Association the remuneration payable to non-executive directors must be determined at theCompany’s annual general meeting.
Ordinary Resolution Numbers 3 – 7Election of directorsIn terms of the Company’s Articles of Association, one-third of the directors or if their number is not a multiple of three, then thenumber nearest to but not less than one-third are required to retire at each annual general meeting. Directors may offer themselvesfor re-election. Biographical details of all directors of the Company are set out on pages 10 and 11.
Ordinary Resolution Number 8Authority to place shares under control of the directorsIn terms of the Act, the directors shall not have the power to allot or issue shares of the Company without approval of the membersof the Company. The current authority to place the unissued shares under the control of the directors is due to expire at theforthcoming annual general meeting, unless renewed. Shareholders are reminded that the unissued shares are reserved solely for theRemgro Share Scheme, in terms of a shareholders’ resolution passed on 21 September 2000.
Ordinary Resolution Number 9Amendment of the rules of the Remgro Share SchemeIn terms of the current rules of the Remgro Share Scheme, participants have ten years to pay for the shares which they have purchasedin terms of the Remgro Share Scheme. The Board of Directors is of the opinion that this period is too long and the purpose of theamendment was thus to shorten this period to seven years. This amendment will not affect the rights of participants who acceptedoffers before 26 November 2004.
SPECIAL RESOLUTION
Special Resolution Number 1Authority to repurchase sharesThe annual renewal of this authority is required in terms of the Act and the Listings Requirements. The existing authority to thedirectors is due to expire at the forthcoming annual general meeting, unless renewed.

THIS FORM OF PROXY IS ONLY FOR USE BY:1. REGISTERED MEMBERS WHO HAVE NOT YET DEMATERIALISED THEIR REMGRO LIMITED ORDINARY SHARES; AND2. REGISTERED MEMBERS WHO HAVE ALREADY DEMATERIALISED THEIR REMGRO LIMITED ORDINARY SHARES AND
ARE REGISTERED IN THEIR OWN NAMES IN THE COMPANY’S SUBREGISTER. *
* See explanatory note 3 overleaf
For completion by the aforesaid registered members who hold ordinary shares of the Company (“member”) and who are unable to attend the 2005 AnnualGeneral Meeting of the Company to be held on Friday, 26 August 2005, at 09:00 in The Ballroom, The Lord Charles Hotel, Corner Faure and StellenboschRoads, Somerset West (“the annual general meeting”).
I/We __________________________________________________________________________________________________________________
being the holder/s of ________________________________________ ordinary shares in the Company, hereby appoint (see instruction 1 overleaf )
1. ______________________________________________________________________________________________________ or, failing him/her,
2. ______________________________________________________________________________________________________ or, failing him/her,3. the chairman of the annual general meeting, as my/our proxy to attend, speak and vote for me/us and on my/our behalf or to abstain from voting at
the annual general meeting of the Company and at any adjournment thereof, as follows (see note 2 and instruction 2 overleaf ):
Insert an “X” or the number of votes exercisable (one vote per ordinary share)
Ordinary resolutions In favour of Against Abstain
1. Approval of annual financial statements
2. Approval of directors’ remuneration
3. Election of director – Mr W E Bührmann
4. Election of director – Mr J W Dreyer
5. Election of director – Dr E de la H Hertzog
6. Election of director – Mrs J A Preller
7. Election of director – Mr T van Wyk
8. Authority to place shares under control of the directors
9. Amendment of the rules of the Remgro Share Scheme
Special resolution
10. Authority to repurchase shares
Signed at ____________________________________________________ on __________________________________________________ 2005
Signature/s ______________________________________________________________________________________________________________
Assisted by ______________________________________________________________________________________________________________(where applicable)
Please read the notes and instructions overleaf.
(Incorporated in the Republic of South Africa)(Registration number 1968/006415/06)
(Share code: REM ISIN: ZAE000026480)(“the Company”)
FORM OF PROXY

�
NOTES1. A member entitled to attend and vote at the annual general meeting is entitled to appoint one or more proxies to attend, speak and
vote in his/her stead. A proxy need not be a registered member of the Company.2. Every member present in person or by proxy and entitled to vote at the annual general meeting of the Company shall, on a show
of hands, have one vote only, irrespective of the number of shares such member holds. In the event of a poll, every member shall beentitled to that proportion of the total votes in the Company which the aggregate amount of the nominal value of the shares heldby such member bears to the aggregate amount of the nominal value of all the shares issued by the Company.
3. Members registered in their own name are members who elected not to participate in the Issuer-Sponsored Nominee Programmeand who appointed Computershare Limited as their Central Securities Depository Participant (CSDP) with the express instructionthat their uncertificated shares are to be registered in the electronic subregister of members in their own names.
INSTRUCTIONS ON SIGNING AND LODGING THE FORM OF PROXY1. A member may insert the name of a proxy or the names of two alternative proxies of the member’s choice in the space/s provided
overleaf, with or without deleting “the chairman of the annual general meeting”, but any such deletion must be initialled by themember. Should this space be left blank, the proxy will be exercised by the chairman of the annual general meeting. The personwhose name appears first on the form of proxy and who is present at the annual general meeting will be entitled to act as proxy tothe exclusion of those whose names follow.
2. A member’s voting instructions to the proxy must be indicated by the insertion of an “X”, or the number of votes exercisable by thatmember, in the appropriate spaces provided overleaf. Failure to do so will be deemed to authorise the proxy to vote or to abstainfrom voting at the annual general meeting, as he/she thinks fit in respect of all the member’s exercisable votes. A member or his/herproxy is not obliged to use all the votes exercisable by him/her or by his/her proxy, but the total number of votes cast, or those inrespect of which abstention is recorded, may not exceed the total number of votes exercisable by the member or by his/her proxy.
3. A minor must be assisted by his/her parent or guardian unless the relevant documents establishing his/her legal capacity areproduced or have been registered by the transfer secretaries.
4. To be valid, the completed forms of proxy must be lodged with the transfer secretaries of the Company, Computershare InvestorServices 2004 (Pty) Limited at 70 Marshall Street, Johannesburg, 2001, South Africa, or posted to the transfer secretaries at PO Box 61051, Marshalltown, 2107, South Africa, to be received by them not later than Wednesday, 24 August 2005, at 09:00(South African time).
5. Documentary evidence establishing the authority of a person signing this form of proxy in a representative capacity must beattached to this form of proxy unless previously recorded by the transfer secretaries or waived by the chairman of the annual generalmeeting.
6. The completion and lodging of this form of proxy will not preclude the relevant member from attending the annual general meetingand speaking and voting in person thereat to the exclusion of any proxy appointed in terms hereof, should such member wish to doso.
7. The completion of any blank spaces overleaf need not be initialled. Any alterations or corrections to this form of proxy must beinitialled by the signatory/ies.
8. The chairman of the annual general meeting may accept any form of proxy which is completed other than in accordance with theseinstructions provided that he is satisfied as to the manner in which a member wishes to vote.