remote display protocol performance, thin client computing, and ipq: test report
TRANSCRIPT

Remote Display Protocol Performance, Thin Client Computing, and IPQ: Test Report
Tests conducted and report prepared by
1 February 2011

Remote Display Protocol Performance, Thin Client Computing, and IPQ:
Test Report
Contents
Report Prepared by
Page 2 of 9
Executive Summary
Test Setup
Test Description
Test Data Collection and Evaluation Considerations
Packet Loss
TCP Retransmissions
Quality of Experience MOS (Mean Opinion Score)
Test Results
Packet Loss
TCP Retransmissions
Quality of Experience MOS (Mean Opinion Score)

Remote Display Protocol Performance, Thin Client Computing and IPQ:
Test Report
Executive Summary
Report Prepared by
Page 3 of 9
Executive Summary A leading vendor of thin client computing devices engaged IPeak Networks to test the performance of one of their devices running each of three standard and widely remote display protocols over a lossy WAN protected by IPeak Networks’ patented QoS software called IPQ. The test results show that IPQ improved the performance of those protocols in several important ways. IPQ consistently achieved better than 90% reduction in network packet loss and a substantial mitigation of the damaging effects of packet loss on the performance of PCoIP, ICA and RDP. On average, IPQ reduced 1% packet loss to less than 0.08%, 3% packet loss was reduced to less than 0.16%, and 5% was reduced to less than 0.25%. IPQ also enabled an average reduction in the numbers of TCP retransmissions (where applicable) of better than 87% across all test scenarios. The reduction in TCP retransmissions supported welcome relief from the user experience of performance lag and delays in application responsiveness. The improvements in the quality of experience were impressive. Remote sessions suffering 3% and 5% packet loss were essentially unusable without IPQ protection but achieved high Mean Opinion Scores for quality of experience when IPQ was enabled.

Remote Display Protocol Performance, Thin Client Computing and IPQ:
Test Report
Details and Interpretation
Report Prepared by
Page 4 of 9
Test Setup A leading vendor of thin client computing devices engaged IPeak Networks to test the performance of one of their devices running each of three standard and widely remote display protocols over a lossy WAN protected by IPeak Networks’ patented QoS software called IPQ. The physical test system and network setup consisted of an off-the-shelf thin client computing device running Windows XP Embedded and connected through a Layer 2 switch to a VMWare ESX server located in the IPeak Networks data center. IPQ protection was added to this system and network setup. At the user end, IPQ protection was enabled by installing the IPQ 32 bit Windows client on the thin client computing device. In the data center, an IPQ Virtual Appliance was deployed on the ESX server. In addition, a virtual switch was configured on the ESX server to ensure that all traffic from the thin client computing device to the Windows XP virtual machine (VM) was bridged through the IPQ Virtual Appliance, all as shown in the diagram below.
This test network was a high-quality LAN supporting 100 Mbps links and less than 1ms of latency. To simulate a typically lossy WAN, IPeak Networks took the following steps: bandwidth between the IPQ Virtual Appliance and the Windows XP Desktop was limited to 5 Mbps, 30ms of latency was added in each direction, and varying amounts of packet loss were introduced.

Remote Display Protocol Performance, Thin Client Computing, and IPQ:
Test Report
Details and Interpretation
Report Prepared by
Page 5 of 9
Test Description Script-based application testing was used to test PCoIP, ICA and RDP. The script ran through a suite of four user activities that characterize a common virtual desktop computing use-case:
entering data and graphing the results in an MS Excel spreadsheet, viewing a MS PowerPoint presentation, playing a short video on YouTube, and scrolling through a PDF file in Adobe Reader.
Tests were run with each of the three remote display protocols—first without and then with IPQ protection enabled—while packet loss was introduced at 0%, 1%, 3% and 5% levels. The generally available Linux TC network simulation tools were used to introduce the packet loss on the link from the IPQ Virtual Appliance to the thin client computing device, the direction in which the bulk of data flows in a virtual desktop deployment.
Test Data Collection and Evaluation Considerations
Packet Loss Packet loss degrades network performance which in turn degrades application performance and the user quality of experience. Packet loss data—total average network loss with and without IPQ enabled—was collected using the logging facilities built in to the IPQ client installed on the thin client computing device.
TCP Retransmissions TCP retransmissions increase dramatically in the presence of network packet loss. TCP retransmissions manifest as delays and input/response lag which degrade the user’s quality of experience of real time network applications. Where applicable, TCP retransmission data was also captured by running Wireshark at the Windows XP Virtual Desktop.
Mean Opinion Score (MOS) Quality of Experience was evaluated was and a Mean Opinion Score (MOS) assigned based on the test operators’ observations with each combination of protocol, loss rate, user activity, and IPQ status (on or off). A total of ninety-six scores were recorded. The IPeak Networks MOS scheme and evaluation criteria are as shown in the table below. MOS Quality Impairment
5 Excellent Imperceptible
4 Good Perceptible but not annoying
3 Fair Very apparent and annoying
2 Poor Very Annoying
1 Bad Unusable
Remote Display Protocol Performance, Thin Client Computing, and IPQ:
Test Report
Details and Interpretation
Report Prepared by
Page 6 of 9
Results
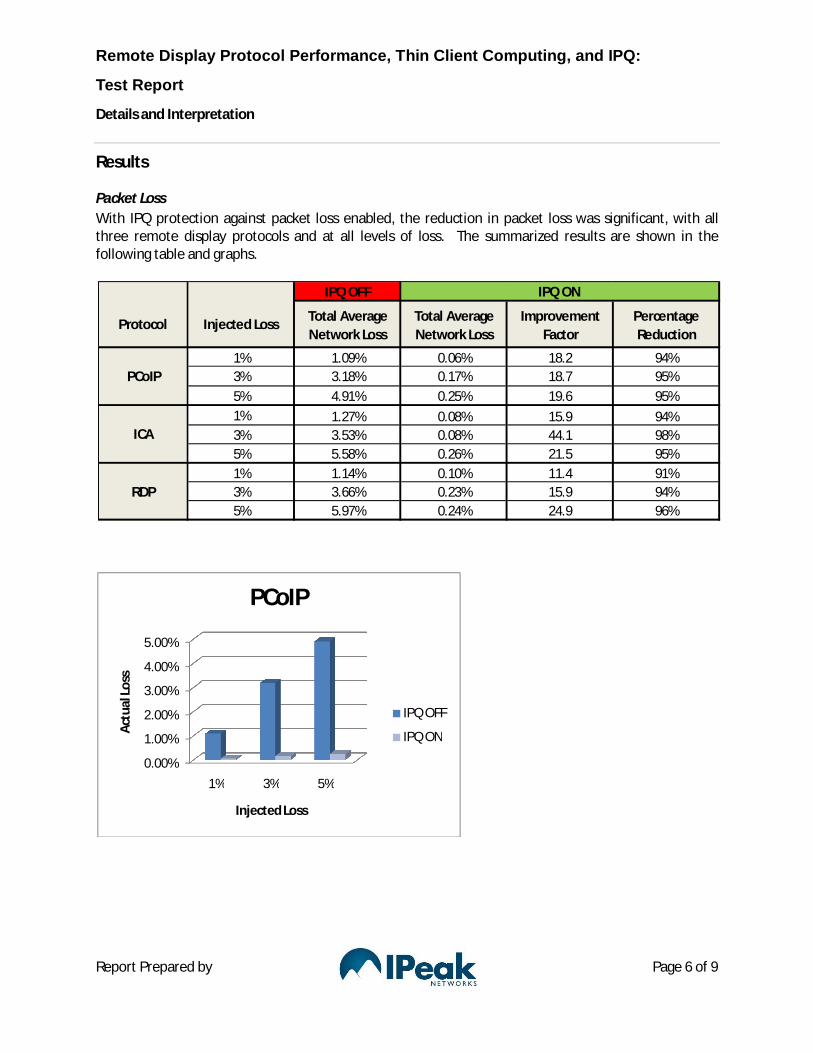
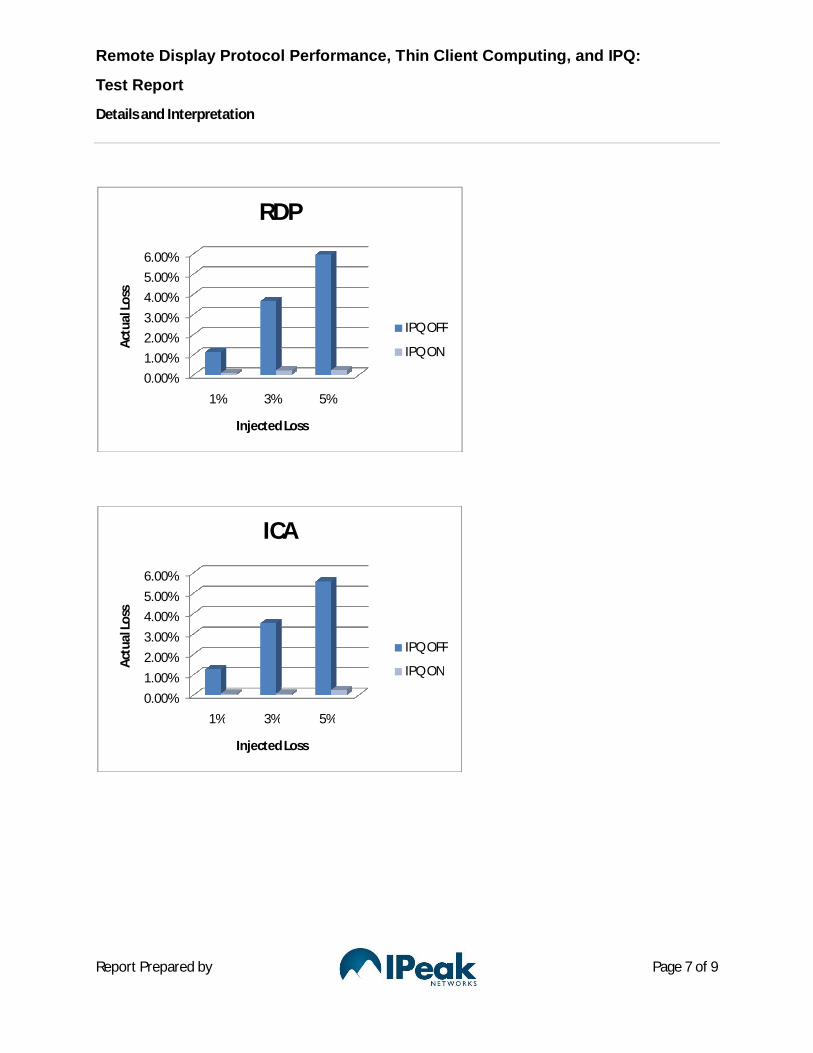
Packet Loss With IPQ protection against packet loss enabled, the reduction in packet loss was significant, with all three remote display protocols and at all levels of loss. The summarized results are shown in the following table and graphs.
IPQ OFF
Total Average Network Loss
Total Average Network Loss
Improvement Factor
Percentage Reduction
1% 1.09% 0.06% 18.2 94%3% 3.18% 0.17% 18.7 95%5% 4.91% 0.25% 19.6 95%1% 1.27% 0.08% 15.9 94%3% 3.53% 0.08% 44.1 98%5% 5.58% 0.26% 21.5 95%1% 1.14% 0.10% 11.4 91%3% 3.66% 0.23% 15.9 94%5% 5.97% 0.24% 24.9 96%
IPQ ON
Protocol
Injected Loss
PCoIP
ICA
RDP
0.00%
1.00%
2.00%
3.00%
4.00%
5.00%
1% 3% 5%
Act
ual L
oss
Injected Loss
PCoIP
IPQ OFF
IPQ ON
Remote Display Protocol Performance, Thin Client Computing, and IPQ:
Test Report
Details and Interpretation
Report Prepared by
Page 7 of 9
0.00%
1.00%
2.00%
3.00%
4.00%
5.00%
6.00%
1% 3% 5%
Act
ual L
oss
Injected Loss
RDP
IPQ OFF
IPQ ON
0.00%
1.00%
2.00%
3.00%
4.00%
5.00%
6.00%
1% 3% 5%
Act
ual L
oss
Injected Loss
ICA
IPQ OFF
IPQ ON
Remote Display Protocol Performance, Thin Client Computing, and IPQ:
Test Report
Details and Interpretation
Report Prepared by
Page 8 of 9
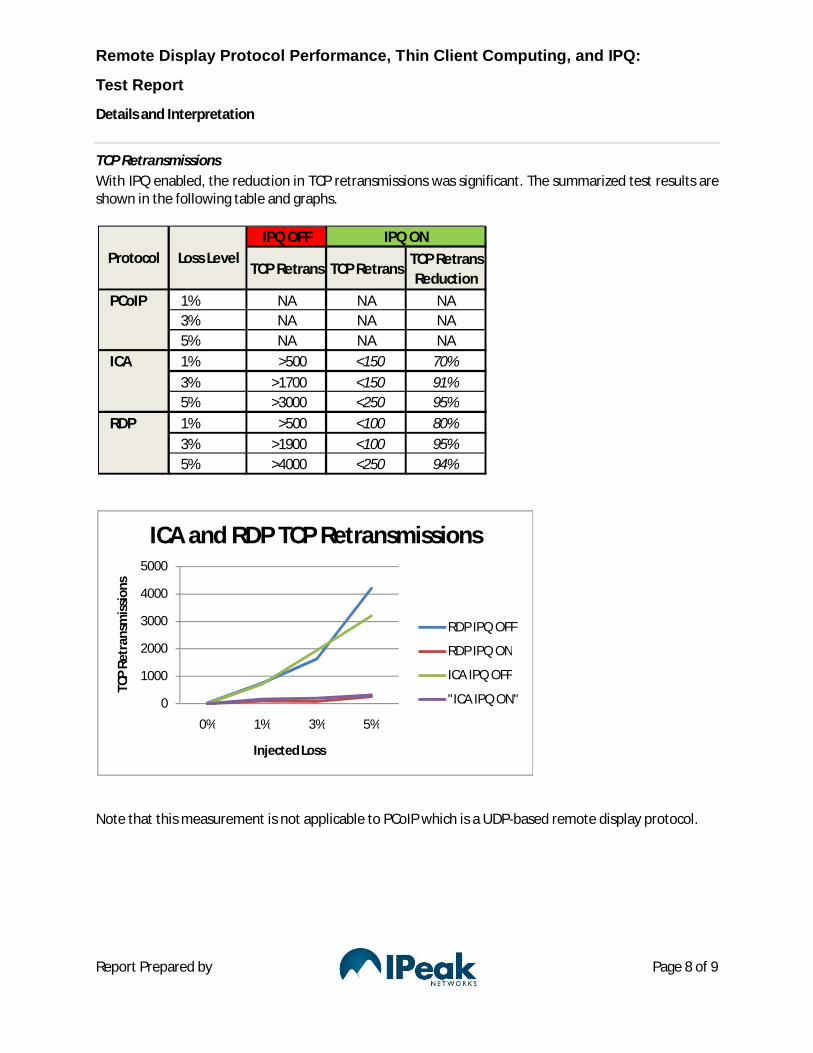
TCP Retransmissions With IPQ enabled, the reduction in TCP retransmissions was significant. The summarized test results are shown in the following table and graphs.
Note that this measurement is not applicable to PCoIP which is a UDP-based remote display protocol.
IPQ OFF
TCP Retrans TCP RetransTCP Retrans Reduction
PCoIP 1% NA NA NA3% NA NA NA5% NA NA NA
ICA 1% >500 <150 70%3% >1700 <150 91%5% >3000 <250 95%
RDP 1% >500 <100 80%3% >1900 <100 95%5% >4000 <250 94%
Protocol Loss LevelIPQ ON
0
1000
2000
3000
4000
5000
0% 1% 3% 5%
TCP
Retr
ansm
issi
ons
Injected Loss
ICA and RDP TCP Retransmissions
RDP IPQ OFF
RDP IPQ ON
ICA IPQ OFF
"ICA IPQ ON"

Remote Display Protocol Performance, Thin Client Computing, and IPQ:
Test Report
Details and Interpretation
Report Prepared by
Page 9 of 9
Mean Opinion Score (MOS) The IPeak Networks MOS scheme and evaluation criteria are as shown in the table below. MOS Quality Impairment
5 Excellent Imperceptible
4 Good Perceptible but not annoying
3 Fair Very apparent and annoying
2 Poor Very Annoying
1 Bad Unusable
When network packet loss was present, the quality of experience was degraded very rapidly, regardless of protocol. However, when IPQ was enabled, the quality of experience remained very consistent, even when there was up to 5% loss on the network.
MOS Quality MOS Quality
PCoIP 1% 3.5 Good 4.75 Excellent3% 2.5 Fair 4.5 Excellent5% 2 Fair 4 Good
ICA 1% 3.5 Good 5 Excellent3% 2.5 Fair 4.75 Excellent5% 1.5 Poor 4.25 Good
RDP 1% 1.75 Poor 2.5 Fair3% 1 Poor 2 Fair5% 1 Poor 2 Fair
Protocol
Loss Level
IPQ ONIPQ Off