remote humidity and temperature real time …
TRANSCRIPT

REMOTE HUMIDITY AND TEMPERATURE REAL TIME
MONITORING SYSTEM FOR STUDYING SEED BIOLOGY
by
Thiruparan Balachandran
A Thesis presented to the
Graduate Faculty of Middle Tennessee State University
in partial fulfillment
of the requirements for the degree of
Master of Science in Engineering Technology
Murfreesboro, TN
December 2013
Thesis Committee:
Dr. Saleh M. Sbenaty, Chair
Dr. Jeffrey Walck
Dr. Chong Chen

i
DECLARATION
I certify that this thesis does not incorporate without acknowledgement any material
previously submitted for a Degree or Diploma in any university, and to the best of my
knowledge and belief, it does not contain any material previously published, written or
orally communicated by any other person except where due reference is made in the text.
..............................................
Thiruparan Balachandran

ii
ACKNOWLEDGEMENT
First and foremost, I am very deeply indebted to my thesis advisor, Dr. Saleh
Sbenaty, Professor, Dept. of Engineering Technology, whose encouragement and
guidance - from the initial idea to project completion - enabled me to achieve success in
my research.
I am heartily thankful to Dr. Jeffrey Walck, Professor, Department of Biology,
Middle Tennessee State University, for his collaboration with us on this project as the co-
supervisor, giving valuable ideas, and needed facilities to carry out biological studies.
I extend my sincere thanks to Dr. Chong Chen for serving on my thesis committee
and reviewing my thesis.
I also wish to express my thanks to all of the colleagues who have helped me in
many ways. Finally, I thank my family for motivating me throughout my entire graduate
studies.

iii
ABSTRACT
REMOTE HUMIDITY AND TEMPERATURE REAL TIME MONITORING
SYSTEM FOR STUDYING SEED BIOLOGY
This thesis discusses the design, prototyping, and testing of a remote monitoring system
that is used to study the biology of seeds under various controlled conditions. Seed
scientists use air-tight boxes to maintain relative humidity, which influences seed
longevity and seed dormancy break. The common practice is the use of super-saturated
solutions either with different chemicals or different concentrations of LiCl to create
various relative humidity. Theretofore, no known system has been developed to remotely
monitor the environmental conditions inside these boxes in real time. This thesis
discusses the development of a remote monitoring system that can be used to accurately
monitor and measure the relative humidity and temperature inside sealed boxes for the
study of seed biology. The system allows the remote and real-time monitoring of these
two parameters in five boxes with different conditions. It functions as a client that is
connected to the internet using Wireless Fidelity (Wi-Fi) technology while Google
spreadsheet is used as the server for uploading and plotting the data. This system directly
gets connected to the Google sever through Wi-Fi and uploads the sensors’ values in a
Google spread sheet. Application-specific software is created and the user can monitor
the data in real time and/or download the data into Excel for further analyses. Using
Google drive app the data can be viewed using a smart phone or a tablet. Furthermore, an
electronic mail (e-mail) alert is also integrated into the system. Whenever measured
values go beyond the threshold values, the user will receive an e-mail alert.

iv
TABLE OF CONTENTS
LIST OF FIGURES vi
LIST OF TABLES viii
1. Introduction 1
1.1. Communication Protocol 2
1.2. Seed Biology 3
1.3. Problem Statement 6
2. Literature Review 8
3. System Design and Methodology 15
3.1. Processing Board 16
3.2. The Wi-Fi Module 18
3.3. Humidity and Temperature Sensors 19
3.4. Creating Google Spread Sheet and Form to Log the Data 25
3.5. Firmware for the Processing Board 31
3.6. Software for Real Time Plotting 33
3.7. E-mail Alert of the System 34
3.8. The Complete System 36
4. Results 41
4.1. Relative Humidity Controlling Property of Different Concentration LiCl
At 20 °C 42

v
4.2. Effect of the Photoperiod and Dark Period 46
4.2.1. Maintaining 50% Relative Humidity 47
4.2.2. Maintaining 70% Relative Humidity 50
4.2.3. Maintaining 35% Relative Humidity 53
4.3. Maintaining 100 % Relative Humidity 56
4.4. Behavior of the Control Seed Box 58
4.5. Behavior of the Relative Humidity at a Constant Concentration of LiCl
at Different Temperatures 59
5. Summary and Conclusions 62
References 64
Appendix A 67

vi
LIST OF FIGURES
Figure 1. Sealed Polycarbonate Electrical Enclosure Box used to Store Seeds 5
Figure 2. Storage of Box Inside an Incubator 6
Figure 3. Wireless Sensor Network Using Zigbee Protocol
(Taken from reference 12) 9
Figure 4. Cellular Temperature Monitoring System 9
Figure 5. Temperature Relative Humidity Transmitter 11
Figure 6. Egg Temperature Relative Humidity Data Logger 12
Figure 7. Temperature Relative Humidity Controlled Incubator 13
Figure 8. Overall Structure of the System 16
Figure 9. Main Processing Board 17
Figure 10. Wi-Fi Shield 18
Figure 11. Connection Between Wi-Fi Shield and Main Processing Board 19
Figure 12. SHT75 Interfacing Diagram 20
Figure 13. Maximal Accuracy Limit for Relative Humidity at 20 °C 21
Figure 14. Maximal Accuracy Limit for Temperature 22
Figure 15. Measuring Sequence 23
Figure 16. Circuit that Shows Connection Between Sensor and Processing Board 23
Figure 17. Sensors Connected Using a USB Air-Proof Coupler 24
Figure 18. Setting up the Box for the Experiment 25
Figure 19. Google Form Used to Enter Data 26
Figure 20. Tabs Associated with Creating Google Spreadsheet 27
Figure 21. Tabs Associated with Creating Google Form 28
Figure 22. Google Spreadsheet of the System 29
Figure 23. Part of the HTML Code of Spreadsheet 29
Figure 24. Flow Chart of the Firmware 32
Figure 25. HTML Page to View the Data as Graph 33
Figure 26. E-mail Alert Configuration Page 35
Figure 27. A Sample E-mail Received Through this System 35
Figure 28. Complete Circuit of the System 36
Figure 29. Inside the Case 37
Figure 30. Setup of the Complete System 38
Figure 31. LCD Display Showing States of the System 39
Figure 32. Relative Humidity and Temperature Measurements in Box 1 Using
26g LiCl +200ml Water Solution 43
Figure 33. Relative Humidity Measurement of the Box 2 Using 50 g
LiCl + 200 ml Water Solution 43
Figure 34. Temperature Measurement of the Box 3 Using 74 g LiCl + 200 ml
Water Solution 44
Figure 35. Temperature and Relative Humidity Measurement of the Box 4 Using
104 g LiCl + 200 ml Water Solution 44
vii
Figure 36.Relative Humidity Measurement of the Box 5 Using 147 g LiCl + 200 ml
Water Solution 45
Figure 37.Relative Humidity and Temperature Measurement of the Box Using
75 g LiCl + 200 ml Water Solution 47
Figure 38. Relative Humidity Measurement of the Box Using 75 g LiCl + 200 ml
Water Solution 48
Figure 39. Temperature Measurement of the Box Using 75 g LiCl +200 ml
Water Solution 49
Figure 40. Temperature and Relative Humidity Measurements of the Box Using
50 g LiCl +200 ml Water Solution 51
Figure 41. Relative Humidity Measurement of the Box with 50g LiCl + 200 ml
Water solution 52
Figure 42. Temperature Measurement of the Box with 50 g LiCl + 200 ml
Water Solution 52
Figure 43. Temperature and Relative Humidity Measurements of the Box Using
100 g LiCl +200 ml Water Solution 53
Figure 44. Relative Humidity Measurement of the Box Using 100 g LiCl + 200 ml
Water Solution 54
Figure 45. Temperature Measurement of the Box Using 100 g LiCl +200 ml
Water Solution 55
Figure 46. Relative Humidity and Temperature Measurement in the Box Which
Had 200 ml Distilled Water Only 56
Figure 47. Relative Humidity Measurement in the Box Which Had 200 ml
Distilled Water Only 57
Figure 48. Temperature Measurement in the Box Which Had 200 ml Distilled
Water Only 57
Figure 49. Relative Humidity and Temperature Measurements in Control Box 58
Figure 50. Behavior of the Relative Humidity While Changing the Temperature 60

viii
LIST OF TABLES
Table 1. Technical Comparison of the Communication Protocols 2
Table 2. Troubleshooting Information 39
Table 3. Different Concentration of LiCl and the Resulted Relative Humidity 46
Table 4. Temperature and Resulted Relative Humidity 60

1
CHAPTER 1
INTRODUCTION
The need of measuring physical parameters plays an important role in science and
technology. In modern days, sensors are used not only for this purpose but also in every
day of our lives. A sensor is an electronic component that translates the physical
parameters into electrical signals [1]. In early days, these sensors were usually coupled
with complex electronic systems or with large computers in order to monitor and control
various parameters. Those systems were complex, expensive, and large in size.
Advancement in technology grew rapidly with the introduction of microcontrollers. The
advancement of these chips has made it possible to replace the above-mentioned complex
electronic systems and resulted in designing simple and cost effective platforms to
interface these sensors in an efficient manner. A microcontroller is a device that has a
Central Processing Unit (CPU), Random Access Memory (RAM), Read Only Memory
(ROM), timers, counters, Analog to Digital (A/D) converters, Input/Output (I/O) ports,
and/or other peripherals on a single chip [2]. Applications of microcontrollers are
numerous and they range from simple applications such as toys to complex applications
such as fly-by-wire, medical applications, robotics, etc. The improvement in fabrication
technology has led to manufacturing microcontroller internal components at the scale of
nanometers, which not only provides small footprint but also provides efficiency in
power consumptions, higher speeds, and lower costs [3].

2
1.1 Communication Protocol
Development in communication modules and protocols immensely support the
implementation of remote and real time monitoring systems based on microcontrollers.
The light-weighted nature of these protocols allows an easy implementation using a
microcontroller. These communication modules include Wireless Fidelity (Wi-Fi),
Bluetooth, ZigBee, and Global System for Mobile Communication (GSM) [4, 5]. These
modules have their own advantages and drawbacks. Table 1 below gives a technical
comparison of these protocols.
Table 1. Technical Comparison of the Communication Protocols
Protocol ZigBee Wi-Fi Bluetooth GSM
Data Rate 20, 40 and 250
Kbits/s
11 and 54 Mbits/s
N can go much
higher than that
1 Mbits/s 9 Kbits/s
Range 10 – 50 m 50 - 100 m 10 m
Operating
Frequency 868 MHz 2.5 and 5 GHz 2.4 GHz
1.9 GHz and
850MHz
Direct Access to
Internet No Yes No Yes
Out of these modules, Bluetooth, RF, and ZigBee can transfer the data only between
same modules or to a computer. To implement a remote monitoring system, these
communication modules cannot be used, because they have range limitation.
3
By using the Internet, data can be sent to any part of the world. Therefore, using the
internet is the best option to implement a remote monitoring system. However, a Zigbee,
Bluetooth, or GSM does not have the capability to send data directly to an internet sever.
In order to send data to the internet server, a computer needs to be used along with these
communication modules. But by using Wi-Fi and GSM modules, the data can be
transferred directly to an internet server from which it can be viewed from any part of the
world. A GSM module needs a dedicated line to transfer the data while a Wi-Fi module
can be used with an existing network or a common Wi-Fi environment. Because of the
high data transfer in Wi-Fi, streaming the data is very easy. This allows an easy
implementation of a real-time monitoring. These days almost all places are equipped
with Wi-Fi. Therefore, using a Wi-Fi module to transfer data to an internet server is the
most cost effective, efficient, and applicable method in real-time and remote monitoring
system [6].
1.2 Seed Biology
Seeds play an important role in nature and in human nutrition. Seeds contain an
embryo (or embryos) that is often surrounded by endosperm, and protected by a seed coat
[7]. The embryo develops inside the seeds, resulting in root emergence, called
germination, and shoot emergence. During germination the seed acts as a reproductive
unit and ensures the survival of the plant. Seeds of many species are prevented from
germinating due to some type of dormancy [8]. Several factors can break dormancy, but
the most important ones are high or low temperatures interacting with water contents of

4
the seed. Once dormancy is overcome, germination can occur and a new plant forms [9].
Temperature and moisture also affect seed viability and their longevity.
Relative humidity influences the moisture content of seeds and their
biology. High relative humidity (> 75%) promotes hydrolytic reaction and respiration,
which increase the amount of loosely bound water molecules. The increased mobility of
water molecules could lead to seed deterioration, which could reduce the seed viability
[10, 12]. A low relative humidity (18- 25%) leads to a reduced mobility of water
molecules, which slows down the diffusion driven reactions and lengthens seed
longevity. Furthermore, for maximum longevity, seeds should be maintained at relative
humidity between 3 and 8% [10]. Thus, the relative humidity needs to be controlled
during seed storage.
Relative humidity also plays a key role during the dormancy break of seeds that
require warm temperatures [13, 14, 15]. Seed after-ripening is a dormancy break
treatment that occurs at warm temperatures in which seeds are stored for a prolonged
period of time [16]. Whereas seeds of some species break dormancy during warm-moist
conditions, those of other species need warm-dry conditions. Thus, there is a gradient of
relative humidity over which after-ripening occurs.
To control relative humidity for examining the effects on seed longevity and on
seed dormancy break, the common practice is to use closed containers with saturated
solutions of chemicals that create different relative humidity. However, these super-
saturated solutions cannot be accepted as accurate without being checked. Checking is

5
usually done every once in a while by opening the containers and using a relative
humidity probe [17]. As shown in Figures 1 and 2, seeds are placed into sealed
containers or seed boxes (polycarbonate enclosed electrical boxes) and then the
containers are inside incubators at desired test temperatures. Super saturated solutions are
poured into the bottom of each box to create a relative humidity at a specific level. One
such method uses LiCl. By varying the amount of this chemical dissolved in distilled
water, various relative humidities can be produced [18]. Alternatively, incubators that can
control both humidity and temperature might be used. However, several incubators would
be needed simultaneously to carry out this intended research resulting in increase of cost
and required space.
Figure 1. Sealed Polycarbonate Electrical Enclosure or Box Used to Store Seeds
(Photo from Dr. J. Walck, Dept. of Biology, MTSU)

6
Figure 2. Storage of Box Inside an Incubator
(Photo from Dr. J. Walck, Dept. of Biology, MTSU)
1.3 Problem Statement
Real-time monitoring systems have applications in many critical fields, such as plant
sciences. In seed biology, for example, real-time remote systems are needed for accurate
monitoring of temperature and relative humidity conditions when examining dormancy
break and longevity of seeds. Failure to monitor the critical parameters could lead to
errors when interpreting the dormancy and longevity data. A component with a

7
combination of real-time monitoring and an alert system is needed for seed biologists to
monitor the conditions at any given time and from any part of the world. This helps to
reduce the man power needed for a manual monitoring in addition to reducing the risks
possibility of repeating an experiment, which is usually time consuming.
Sealed electrical boxes containing super saturated solutions to control the relative
humidity are currently being used to study after-ripening and longevity of seeds. A
system that can measure and monitor the relative humidity and temperature inside five
boxes (each with a different LiCl solution) with remote and real-time monitoring
capabilities will be designed, built, and tested. The results will be analyzed and compared
to expected values using various concentrations of LiCl in distilled water. Furthermore an
email alert functionality also will be integrated into the system.

8
CHAPTER 2
LITERATURE REVIEW
For many years, researchers and engineers have been working on real time and remote
monitoring systems to serve their various needs. For example, a “Low-power hybrid
wireless network for monitoring infant incubator” was published by Shin et al. (2004).
They have designed a wireless network for monitoring infant incubators using Infra-Red
(IR) and RF modules [19]. This system monitors the temperature and humidity of infant
incubators and sends the data to a host computer when the host computer requests for the
data through IR communication. It sends the ID of the slave device and when an ID is
received and if it matches with a slave device, the slave will send the data to the host
computer through RF module. In this study, two-way communication platform was used;
one is to send request to slave devices (IR) and another is to send data to the host (RF).
National Instrument LabView software was used to plot the data using a computer. Some
of the drawbacks of this system are: To implement this system, a host computer and a
LabView software are needed, which increased the cost, limited the range, and provided
no alert method to notify the user. Limit in range is due to using RF.
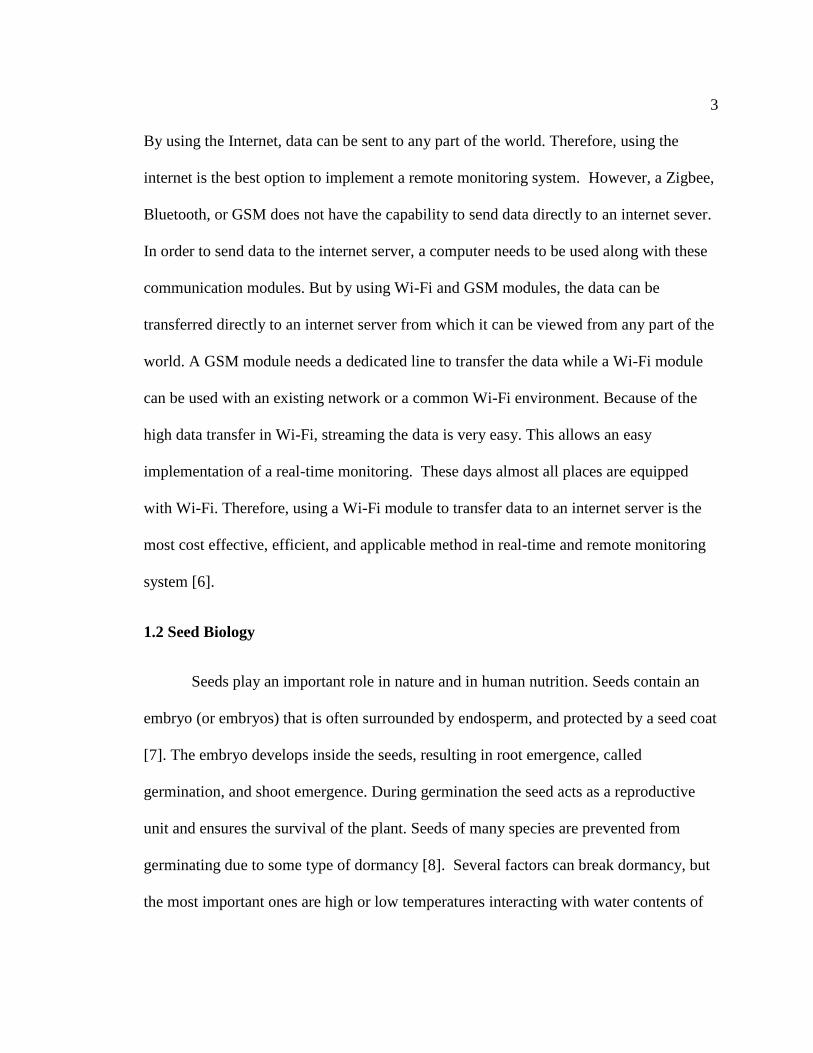
Another system has been designed by Wen-Tsai Sung and Ming-Han Tsai outlined in
their publication titled: “Multi-Sensor Wireless Signal Aggregation for Environmental
Monitoring System via Multi-bit Data Fusion” using ZigBee, a protocol based on the
Institute of Electrical and Electronics Engineers 802.15.4 (IEEE 802.15.4). As shown in
Figure 3, sensor nodes send the data to a ZigBee motherboard that collects the data from
9
all nodes and sends them to the user computer through a Universal Serial Bus (USB).
This system uses low power, has a low cost, and is small in size. The disadvantages of
this system are low data transfer rate, short distance data transmission, and remote
monitoring is not implemented [20].
Figure 3. Wireless Sensor Network Using ZigBee Protocol ( taken from reference 20)
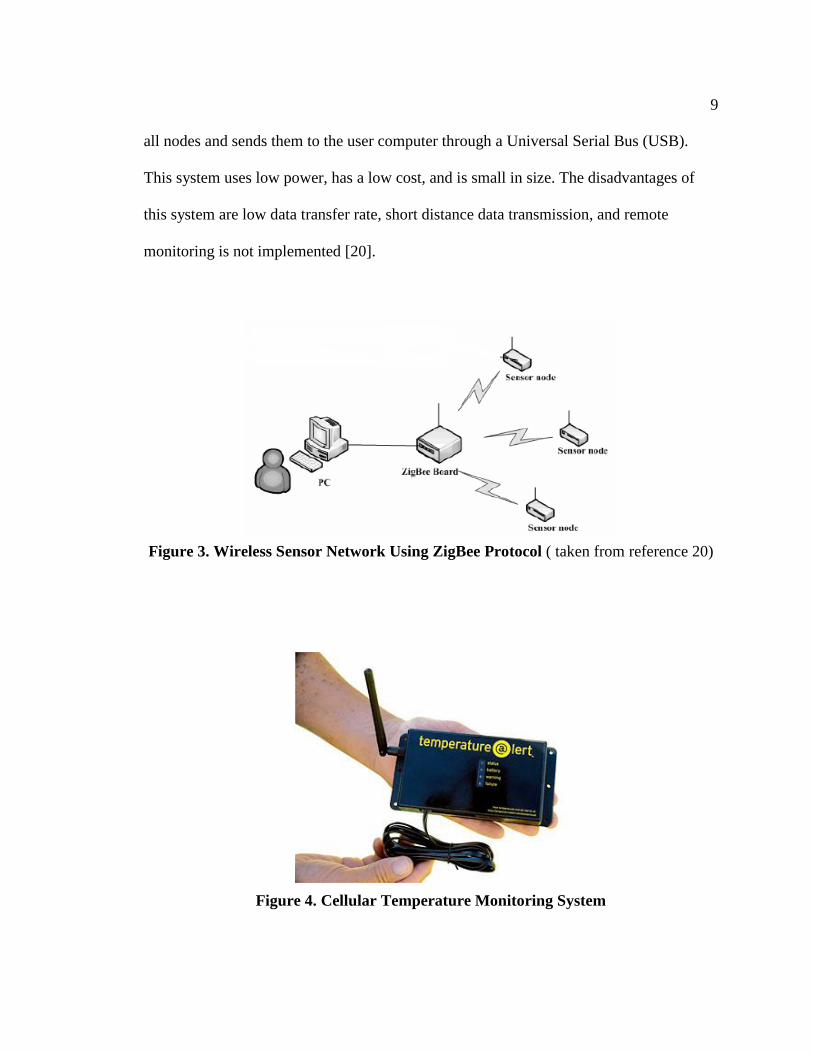
Figure 4. Cellular Temperature Monitoring System

10
Figure 4 shows a cellular temperature monitoring system available on the market. It is
manufactured by a company called “Temperature@lert ” [21]. This system is capable of
measuring temperature and if the temperature goes out of range, it alerts the user through
e-mail. This system allows the use of up to four wired temperature sensors. Maximum
Sampling rate of this system is 12 samples per minute. This system costs $450 and each
sensor costs $35. The system with four sensors costs around $600. Since this system uses
cellular network, the company provides a monthly plan that costs around $31/ month.
This system has several drawbacks and is not suitable for our purpose. By using this
system only the temperature can be measured and it also cannot be monitored on real
time. It is very challenging to use this inside the building, because in some labs cellular
network coverage is not available. The system does not only have a onetime cost,
however, every month the user has to keep paying for the monthly cellular plan as well.
Moreover, the cellular plan and the data server are maintained by the company. This
makes the user rely on the company forever.

11
Figure 5. Temperature Relative Humidity Transmitter [22]
Another temperature and humidity transmitter is a product available from Cooper
Atkins[22]. As shown in Figure 5, it is a 3.5 by 1.5 by 1 inch small device embedded with
temperature and relative humidity sensors. This device transmits the data using 900 MHz
RF signal to the host computer. It has a transmitting range of up to 2500 ft. This device
can be powered by 2/3 A size LiMnO2 battery and the battery life is 2-5 years. The
company provides the application software that collects the data and plots them in real
time. Drawbacks of the systems are: since the sensors are built within the device, it is not
possible to use the device in the current experiment setup. The containers are going to be
placed in the incubator. The shielding property of the incubator will not allow the RF

12
signal to be transmitted. Remote monitoring is limited to 2500 ft and no alert feature is
implemented.
Figure 6. Egg Temperature Relative Humidity Data Logger [23]
There are several temperature and relative humidity data loggers that are available on the
market [23]. These data loggers save the temperature and relative humidity data over long
periods. The data can be retrieved later using a personal computer or using specific
hardware. The company “OMEGA” has produced egg temperature humidity data
loggers. As shown in figure 6 this data logger has the size of an egg and it responds to the
environment in the same way as a real egg does. Record start time and sampling rate can
be programmed using a computer. Once it is configured, it can be placed in the
experiment environment. This device comes with user replaceable battery and a non

13
volatile memory. This memory can hold 32,767 readings and retains the data even after
battery is discharged. Average battery life is one year. This device is not suitable for our
experimental setup. If we use this device inside the box, the box has to be opened each
time a reading is needed. Each time the box is opened, the relative humidity and
temperature of the seed boxes will be disturbed. In addition, No alert feature or real time
monitoring is implemented.
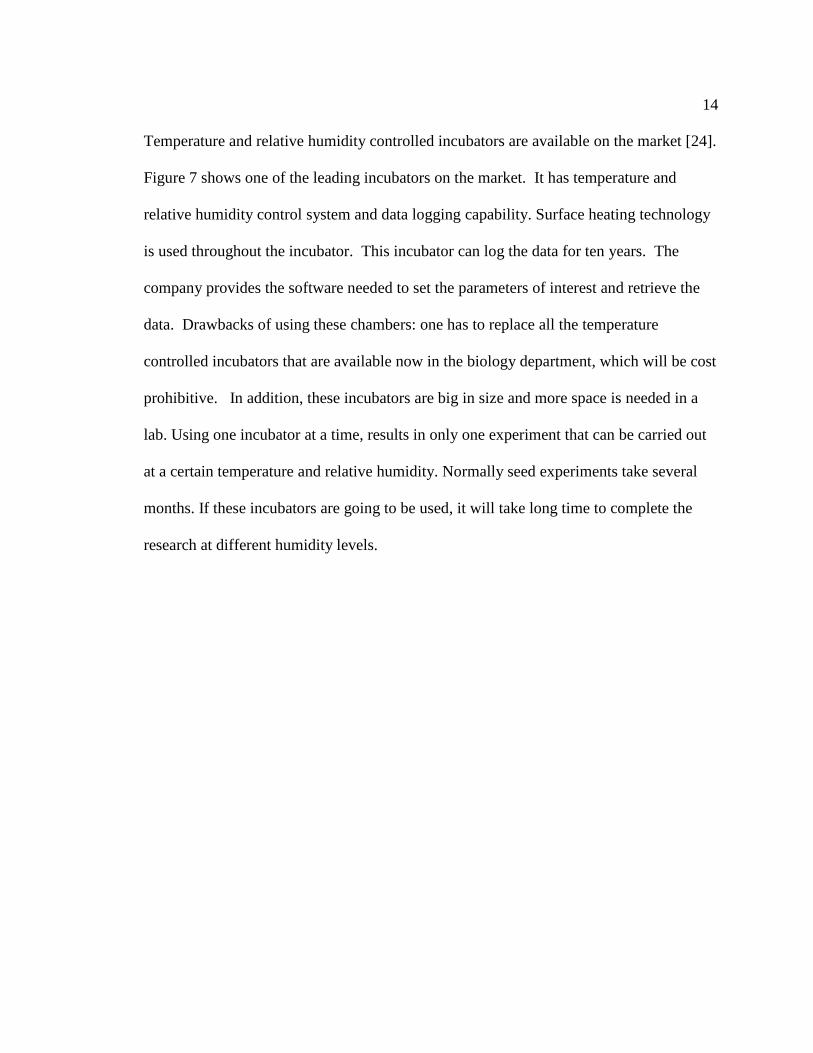
Figure 7. Temperature Relative Humidity Controlled Incubator [24]
14
Temperature and relative humidity controlled incubators are available on the market [24].
Figure 7 shows one of the leading incubators on the market. It has temperature and
relative humidity control system and data logging capability. Surface heating technology
is used throughout the incubator. This incubator can log the data for ten years. The
company provides the software needed to set the parameters of interest and retrieve the
data. Drawbacks of using these chambers: one has to replace all the temperature
controlled incubators that are available now in the biology department, which will be cost
prohibitive. In addition, these incubators are big in size and more space is needed in a
lab. Using one incubator at a time, results in only one experiment that can be carried out
at a certain temperature and relative humidity. Normally seed experiments take several
months. If these incubators are going to be used, it will take long time to complete the
research at different humidity levels.

15
CHAPTER 3
SYSTEM DESIGN AND METHODOLOGY
In this section, details about the processing board, steps for designing the firmware for
the microcontroller, uploading the program, sensor interfacing, and the data acquisition
methods are discussed. Furthermore, testing the system and designing the case for the
final product is also discussed. Figure 8 below shows a block diagram of the system
architecture and interconnection between modules. The monitoring system consists of
Processing board, LCD display and a Wi-Fi module. The sensors are connected to the
monitoring system via a 2-wire interface. The Wi-Fi module is authenticated to the Wi-Fi
access point with a Wi-Fi Protected Access Pre-Shared (WPA-PSK) authentication
mechanism. So the data collected from sensors are processed in the system and then
passed to the wireless router and from there get routed to the Google docs via a Wide
Area Network (WAN). If the user has an internet connection, he or she can view the data
in real time from any part of the world by connecting to Google sever. This can be done
by logging into the Google account. Google spreadsheet is being used as the server.
Software is created to view the data as a graph online in real time. An E-mail alert feature
also implemented.

16
Figure 8. Overall Structure of the System
3.1 Processing Board
Ardunio UNO3 is used as the main processing device. The functionality of this
processing board is reading the sensor values and transferring them to the Wi-Fi module
and LCD. Ardunio UNO3 has an ATmega microcontroller, which is a 8-bit Alf Vegard
Risc processor (AVR) and has 23 programmable input/output pins. Through the firmware
of the microcontroller these pins can be set as either inputs or outputs of the
microcontroller. The board also contains 5 V and 3.3 V voltage regulators,
16 MHz quartz oscillator, a Universal Serial Bus (USB) to serial converting chip and

17
other electronic components such as resisters, capacitors and light emitting diodes
(LEDs).
Figure 9. Main Processing Board[25]
As shown in Figure 9, these components are mounted on a single board and the
inputs/outputs are wired to standard connectors. This standard implementation allows
adding interchangeable modules to this microcontroller board easy without any soldering.
The microcontroller is factory programmed with boot loader. Once the microcontroller is
powered, this boot loader will start executing. This boot loader will then run the actual
firmware from the flash memory. Firmware is downloaded to the flash memory through
computer using USB cable. Other devices, such as the Wi-Fi shield, sensors, and the
LCD, get their power from this main processing board.

18
3.2 The Wi-Fi Module
A Wi-Fi shield from Ardunio is used in this project to connect the device to the internet
through Wi-Fi. This Wi-Fi shield is featured with HD104 chip. This chip handles
Wireless LAN 802.11b/g protocol communication with low power consumption.
Network stack software libraries are available for free. These libraries support Wired
Equivalent Privacy (WEP), Wi-Fi Protected Access, Pre-Shared Key (WPA-PSK) and
WPA-2-PSK security. The communication between the main processing board and the
Wi-Fi shield is done through Serial Peripheral Interface Bus (SPI) protocol.
Figure 10. Wi-Fi Shield [26]
Figure 11 shows the circuit connection between main processor and the Wi-Fi shield. Pin
numbers 11, 12 and 13 are SPI data in, SPI data out, and SPI clock of the main processor

19
board, respectively and they are connected to pin number 50, 51 and 52 of the Wi-Fi
shield, respectively. Pin number 10 and 7 of the main processor board are connected to
pin number 10 (chip select) and 8 (hand shake) of the Wi-Fi shield.
Figure 11. Connection Between Wi-Fi Shield and Main Processing Board
3.3 Humidity and Temperature Sensors
There are several types of sensors available in the market. Relative humidity strongly
depends on the temperature of the surrounding air. Therefore it is required to keep
humidity sensor and the temperature sensor very close as much possible. It is very ideal if
both sensors are in the same chip as a one single sensor that measure both relative
humidity and temperature. There are industry calibrated sensors as well as non-calibrated
sensors available on the market. Calibrating the temperature sensor is quite easy but
calibrating the relative humidity senor requires more effort and instruments. Therefore,
choosing an industry calibrated sensor is the preferred to reduce errors and save time.
Ardunio main Processing Board
Ardunio Wi-Fishield
11
12
13
10
7
51
50
8
52
select
SPI in
SPI in
SPI out
SPI out
SPI clk SPI clk
select
handshake

20
Reliability, long term stability, fast response, number of pins needed to interface and
needed processing power are some other factors considered to select the suitable sensor.
Buy considering these factors the SHT75 from Sensirion is chosen in this system.
Figure 12. SHT75 Interfacing Diagram [27]
This digital sensor contains a capacitive sensor to measure relative humidity, a band gap
sensor to measure the temperature, 14 bit A/D converter and serial interface circuit. All of
these components are packed onto a single chip. Figure 12 shows the interfacing diagram
with the main controller board. Pin 1 and 4 for clock and data transfer, respectively. The
21
data pin is bidirectional in which request and response are sent and received. Pin 2 is for
connecting a positive power supply and pin 3 is for connecting ground.
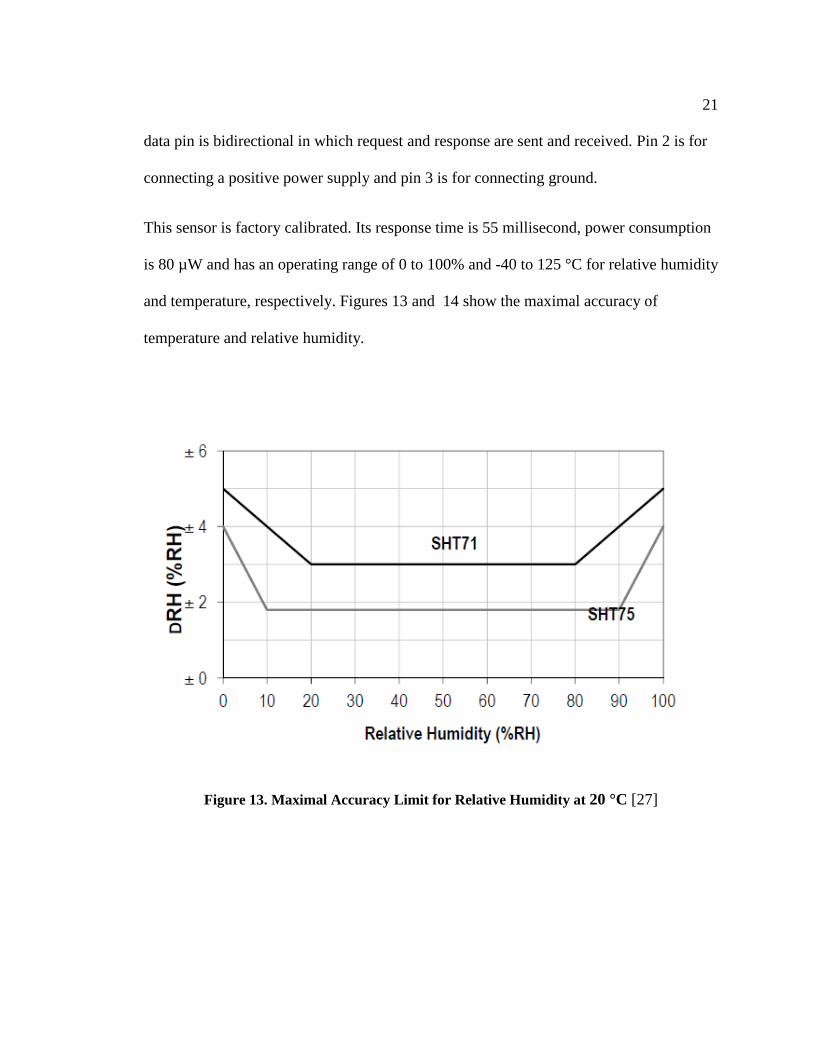
This sensor is factory calibrated. Its response time is 55 millisecond, power consumption
is 80 µW and has an operating range of 0 to 100% and -40 to 125 °C for relative humidity
and temperature, respectively. Figures 13 and 14 show the maximal accuracy of
temperature and relative humidity.
Figure 13. Maximal Accuracy Limit for Relative Humidity at 20 °C [27]

22
Figure 14. Maximal Accuracy Limit for Temperature [27]
For the relative humidity the error is ±2 in the range of 10% to 90% and for the
temperature the error is less than ±1 °C in the range of -20 to70 °C. The sensor and the
microcontroller communicate through a 2-wire serial interface. This interface is not
compatible with Inter- Integrated Circuit (I2C) communication. Because sensor SHT 75
does not support the addressing option; therefore, in this design a common clock line is
used but a separate data line is used for each sensor (see Figure 16 below).
Serial Clock Input (SCK) is used to synchronize the communication between the
microcontroller and the sensor. Data lines are pulled high by default by using pull-up
resistors and the microcontroller or the senor should pull down to change the level to low.

23
A logic level should be changed after a falling edge in SCK and it is valid after a rising
edge of the SCK. This is how command is passed to the sensor by the microcontroller
and data is passed to the microcontroller by the sensor. Figure 15 bellow show the overall
view of the measuring sequence. Initially the command is send first and then the system
waits for the data. Once the data is ready, the sensor pulls down the data line. After that,
12 bits of data can be read. Command bit patterns “00011” and “00101” are send to
measure temperature and relative humidity, respectively.
Figure 15. Measuring Sequence [27]
Figure 16. Circuit that Shows Connection Between Sensor and Processing Board
Ardunio main Processing Board
R110kΩ
R210kΩ
SHT 75
VDD
6
GND
1 2 3 4
SHT 75
1 2 3 4
SHT 75
1 2 3 4
SHT 75
1 2 3 4
SHT 75
1 2 3 4
5
3
4
1
CLK
R310kΩ
R410kΩ
R510kΩ
6

24
Sensor
USB
Coupler
Figure 16 shows how all the sensors are connected to the main processor board. Pin 1 is
the clock input of the sensor. All sensors clock inputs are connected together and this
common clock input receives the clock signal from the main processor board. This clock
signal is created by a program running in the processor. Each sensor output is pulled up
using a 10 K ohm resister. This pull-up resistor is required as the data line should be high
by default and the microcontroller or senor needs to pull down in order to change data.
As shown in Figure 17, one of the sensors is placed in the sealed container in which the
experiment is being carried out. A special USB airproof coupler is used to make a
connection to the outside. As shown in Figure 18 humidity maintaining solution is
poured onto the bottom of the box and then a solid plastic egg crate lighting panel (3/8"
thick, 1/2" x 1/2" grid) is placed on top of it. On top of this plastic crate nylon mesh bags
containing seeds are placed and the box is closed. Plastic screws on the box ensure an air-
tight enclosure.
Figure 17. Sensors Connected Using a USB Air-Proof Coupler

25
Figure 18. Setting up the Box for the Experiment
3.4 Creating Google Spread Sheet and form to log the Data
The system developed in this research is capable of both storing the data and plotting
them in real time. To store the data Google drive is used. The developed system sends the
data to the Google drive by submitting them in the Google form. Figure 19 shows the
Google form created for the system.
Solution
Seed Bags
Plastic Net

26
Figure 19. Google Form Used to Enter Data
In order to create this form, a Google account is needed and then a person can login to the
account. After the login, there will be a menu at the top of the screen named “Drive”.
Select that option and then click “Create”. Then in the drop down menu select
“spreadsheet”. Figure 20 below shows the locations of the above tabs, they are circled.
Once the spreadsheet is clicked, a new window will open in a new tab. This new window
will display the spreadsheet. As shown Figure 21, click “Tool” and then select “Create
Form,” which allows the creation of the form as needed.

27
Figure 20. Tabs Associated with Creating Google Spreadsheet

28
Figure 21. Tabs Associated with Creating Google Form
There are millions of Google spreadsheet created by users in the Google server. Each
spreadsheet has unique key and it is identified by using this key. Figure 22 shows the
spreadsheet created for the system and the URL of the spreadsheet. In the URL, the key
can be found, which in this case is “0Alb3
eKuypMddGlNaGRzdS0zUHNhaG8xdC0weGV6Umc.”

29
Figure 22. Google Spreadsheet of the System
Figure 23. Part of the HTML Code of Spreadsheet
Each text box that is created, a special name called entry name is given. The entry name
of the text boxes can be found by looking at the HTML code of the spreadsheet. The
entry name of the box normally looks like “entry.0.single” for the first text box and
“entry.1.single” for the second text box and so on, but this should be confirmed by looking
at the HTML code. Figure 23 shows the part of the HTML code of the form –
i.e.,“Box_1_Temp” that is named “entry.0.single”. By examining the code, each entry
name is identified.

30
The main processor board sends data to the Google form, using a specific standard syntax
URL. This URL contains the key of the form, entry name of the text box and the data.
This URL is passed to the wireless router through Wi-Fi shield and from there get routed
to the Google form via campus WAN. The standard URL should be
https://spreadsheets.google.com/formResponse?formkey=KEY &ifq& ENTRY NAME OF
TEXT BOX =THE VALUE TO STORE &submit=Submit. For this system, the developed
key is “0Alb3-eKuypMddGlNaGRzdS0zUHNhaG8xdC0weGV6Umc” and the entry
name of the text box “Box_1_Temp” is “entry.0.single”. For example, to enter data 20 to
text box “Box_1_Temp” the syntax will be:
“https://spreadsheets.google.com/formResponse?formkey=0Alb3-
eKuypMddGlNaGRzdS0zUHNhaG8xdC0weGV6Umc &ifq& entry.0.single =20&submit=Submit” .
The main processor will automatically grant the above URL string for each box.

31
3.5 Firmware for the Processing Board
Arduino Integrated Development Environment (IDE) is used for code editing, compiling
and uploading programs. Firmware is written using Ardunio programming language. This
is the language created by Ardunio open source community. It’s a high level language
similar to C++. One of the advantages of Ardunio is that it is an open source platform.
As shown in the flowchart (Figure 24), once started, the system initializes all the
variables and attempts to make connection with the Wi-Fi router. If connected, it will
move to the next step and if it is not connected, it waits for 10 seconds and attempts to
reconnect again. This is repeated until a connection to the Wi-Fi router is made. The
name of the Wi-Fi network and password are hard coded into the system. After a
successful connection to Wi-Fi connection is established, the main processor scans each
sensor and records relative humidity and temperature values on the board. The main
processor then creates the URL syntax using the box entry name and the data, and the
system connects to the Google server. If it is not connected to the server, the processor
waits for 10 seconds and tries to connect again. It keeps trying to connect until a
connection is made to the Google server. Once it is connected to the Google server, it
enters these values in the Google form using the syntax URL and then it disconnects from
the server. Then, main processor waits for 15 seconds and measures the values again and
transfers these values to the Google form. By default this Google form is connected to a
Google spreadsheet, which contains a time stamp associated with each data point and the
spreadsheet can be download into Microsoft Excel.

32
No
No
No
Yes
If connected
to sever
Yes
If
experiment
is finished
Start
Initialize the variables
Connect to the Wi-Fi
If connected
to the Wi-Fi
Measure the Temperature &
Humidity
Create the URL syntax with
data and entry name and
Connect to Google server
Wait 10 seconds
Wait 10 seconds
Submit the data to the
Google form
Disconnect from
Google sever
Wait 15
seconds
Stop
Yes
Figure 24. Flow Chart of the Firmware

33
3.6 Software for Real Time Plotting
Google Chart Tools are used to draw the graph. This is an open JavaScript library where
we can define our own data sets and populate the graph. Since Google spreadsheet is used
to store the data, Google query method is used to retrieve the datasets, and the arguments
for that method are the URL of the spreadsheet and the range of the column to be
populated as data.
To plot a graph using Google Application Programming interface (API), first the
horizontal and vertical axes had to be created and then the method AreaChart was used to
define the HTML division names for the graph. The draw method plots the graph by
taking the real time data and the options as argument. Since this is a real time system,
data in the Google spread sheet is keep updated every 3 seconds with new sensor values.
To reflect this new data in the graph “TheSet interval” function is called with the update
interval 3 seconds. This ensures the real time monitoring.
Figure 25. HTML Page to View the Data as a Graph
34
Figure 25 shows the HTML page created to view the data in real time as a graph by
clicking the appropriate link. This enables a user to view data from any part of the world
if an internet connection is available.
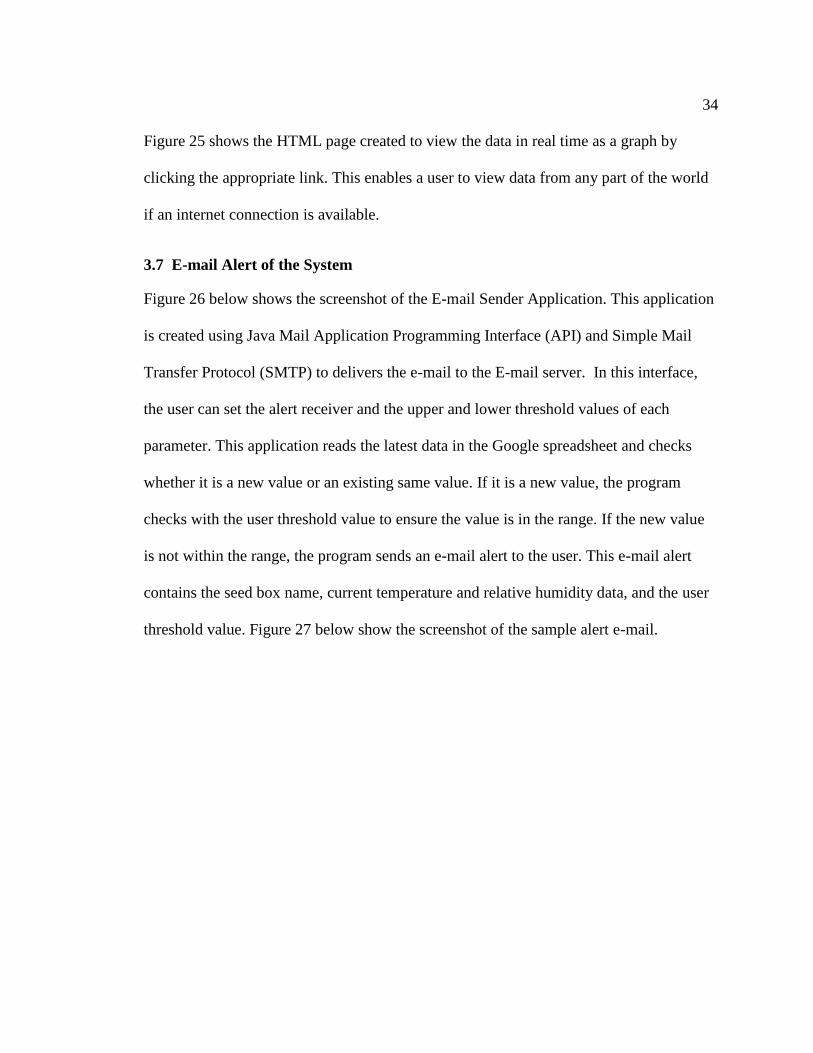
3.7 E-mail Alert of the System
Figure 26 below shows the screenshot of the E-mail Sender Application. This application
is created using Java Mail Application Programming Interface (API) and Simple Mail
Transfer Protocol (SMTP) to delivers the e-mail to the E-mail server. In this interface,
the user can set the alert receiver and the upper and lower threshold values of each
parameter. This application reads the latest data in the Google spreadsheet and checks
whether it is a new value or an existing same value. If it is a new value, the program
checks with the user threshold value to ensure the value is in the range. If the new value
is not within the range, the program sends an e-mail alert to the user. This e-mail alert
contains the seed box name, current temperature and relative humidity data, and the user
threshold value. Figure 27 below show the screenshot of the sample alert e-mail.

35
Figure 26. E-mail Alert Configuration Page
Figure 27. A Sample E-mail Received Through this System

36
3.8 The Complete System
Figure 28. Complete Circuit of the System

37
Figure 29. Inside the Case
Figure 28 shows the complete circuit of the system. Resisters R1 – R5 are 10K. Figure
29 shows how it is placed into the system enclosure. The main processor is placed in the
bottom and the Wi-Fi shield is placed on top of it. The board containing pull up resisters
for the sensors is placed on the side, the LCD is placed on the top side, and air holes for
ventilation are made on each side in the bottom.
Power Plug
LCD
Pull up resisters board
Wi-Fi shield and main processor board

38
Figure 30. Setup of the Complete System
Figure 30 shows the setup of the complete system. To make user friendly connections
between the sensors and the device USB ports are used. An LCD is added to the system
to display the device states, which are shown in Figure 31. Once the system is turned on,
the device initializes all variables and functions and attempt to connect to the Wi-Fi and
display whether the connection is made. After the device connects to the Wi-Fi, it
measures each box’s relative humidity and temperature and sends the data to Google
spreadsheet. There are 7 USB ports available; in the current design only five ports are
used to connect five separate seed boxes. Switches are not used in the system, which
automatically detects which USB ports are connected to the seed boxes and measures the
temperature and relative humidity of each of the boxes.
Power Cable
USB Ports
LCD

39
Figure 31. LCD Display Showing States of the System
Troubleshooting information
Table 2. Troubleshooting Information
Issue Fixes
No Display in LCD Check the Power supply
Display in LCD is “Wi-Fi not Connected”
1. Check Wi-Fi router
2. Unplug the power adapter of the
Wi-Fi router and plug it after 30
seconds
3. Unplug the systems power supply
and plug it after 30 seconds
Negative values for relative humidity Check connection between the system and
the seed box

40
Above Table 2 gives the details of the common issues and fixing steps. If the device is
getting power there will be at least some display. In case of no display, then it might be a
problem in the power supply. In this case check power supply and connections. If the
display is “Wi-Fi not connected” it should to be some issues with Wi-Fi router. To fix
this problem, follow the steps as described in the table. If the connection between sensor
and the device is not good, device will display negative value for relative humidity. In
this cause check the connecting USB cable. If the cable is damaged, replace with new
cable. When cleaning the container, take care that sensor not to get wet.
Device specification
Main device dimension: 8 x 6 x 3 inches, Seed box dimension: 11 x 11 x 5 inches
Power: 9 - 12 V, Current: ~ 250 mA while sending data, 50 mA while in idle state

41
CHAPTER 4
RESULTS
The sensor system was tested in closed polyethylene electrical boxes with various relative
humidity values. The box contained seeds to simulate an after-ripening or longevity
experiment. Three different set of experiments were carried out.
The first set of experiments was conducted to study the controlling property of relative
humidity of different concentrations of LiCl at 20 °C. A gradient in relative humidity
was created across five containers. The containers were placed in a temperature and light
controlled incubator set at constant 20 °C with a 14 hr photoperiod. Nine green gram
(Vigna radiata)seeds, which are used in a variety of food dishes in many countries, were
placed in each box.
The second set of experiments was carried out to study the effect of the photoperiod. In
the incubator, fluorescent light was used simulate the photoperiod. Three different
concentrations of LiCl were used and nine green gram seeds were placed in each box.
Temperature was maintained constant at 20 °C. Photoperiod is being toggled to 14 hours
of light and 10 hours of darkness continuously for two days.
In the third set of experiments, a constant amount of LiCl was used while the
temperature was increased from 10 °C to 50 °C at 10 °C intervals. Each temperature was
maintained for 24 hours. In this setup 14 hours of light and 10 hours of darkness is used.

42
During these experiments, it was observed that the system successfully updated the
relative humidity and temperature of the boxes in the Google spreadsheet and the
software plotted the graph in real time. Moreover the e-mail alert functionality of the
system was also tested.
4.1 Relative Humidity Controlling Property of Different Concentrations of LiCl at
20 °C
To study the effect of LiCl on relative humidity, five different concentrations of LiCl
were used. Five separate seed boxes were used for this purpose. These solutions were
poured onto the bottom of each box. Nine grams of green seeds (Vigna radiata) were
also placed in each box. Figure 32 shows the different amounts of LiCl and the expected
relative humidity at 20 °C. These boxes were placed in the incubator for 24 hours. The
photoperiod was also set to 24 hours. Figures 32-35 below shows the real-time graphs of
relative humidity and temperature of each boxes. These graphs are obtained using the
software developed in this research.

43
Figure 32. Relative Humidity and Temperature Measurements in Box 1 Using 26 g
LiCl +200 ml Water Solution
Figure 33. Relative Humidity and Temperature Measurements in Box 2 Using 50 g
LiCl +200 ml Water Solution

44
Figure 34 . Relative Humidity and Temperature Measurements in Box 3 Using 74 g
LiCl + 200 ml Water Solution
Figure 35 . Relative Humidity and Temperature Measurements in Box 4 Using 104 g
LiCl +200 ml Water Solution

45
Figure 36. Relative Humidity and Temperature Measurements in Box 1 Using 147 g
LiCl +200 ml Water Solution
Table 3 below shows the expected and experimental results. The experimental results
were approximately the same as the expected results. Average deviation of the relative
humidity is between 2.23 to 2.70%. This accuracy is recommended for seed experiments.
As the concentration of LiCl increased, the relative humidity of the boxes varied with
minimum temperature change of 0.50 °C. The temperature change of 0.50 °C may be
attributed to the placement of seeds boxes in different rows in addition to the use of
heating and cooling fans on the roofs of the incubator.

46
Table 3: Different Concentration of LiCl and the Resulted Relative Humidity
Box
Number
Amount of
LiCl in 200 ml
of distilled
water (g)
Average
temperature
inside the box
(°C)
Expected
Relative
Humidity
(%)
Achieved
average
relative
humidity (%)
Deviation
1 26 20.10 85 87.16 +2.16
2 50 20.54 70 72.23 +2.23
3 74 20.34 50 52.70 +2.70
4 104 20.08 30 32.27 +2.27
5 147 20.16 15 17.50 +2.50
4.2 Effect of the Photoperiod and Dark Period
Three different concentrations of LiCl and nine grams of green seeds were placed in
each box. A constant temperature was maintained at 20 °C. The photoperiod was toggled
between 14 hours of photoperiod and 10 hours of dark period continuously for two days.
Different relative humidity levels of 50, 70, and 35 % were maintained in three separate
seed boxes.
47
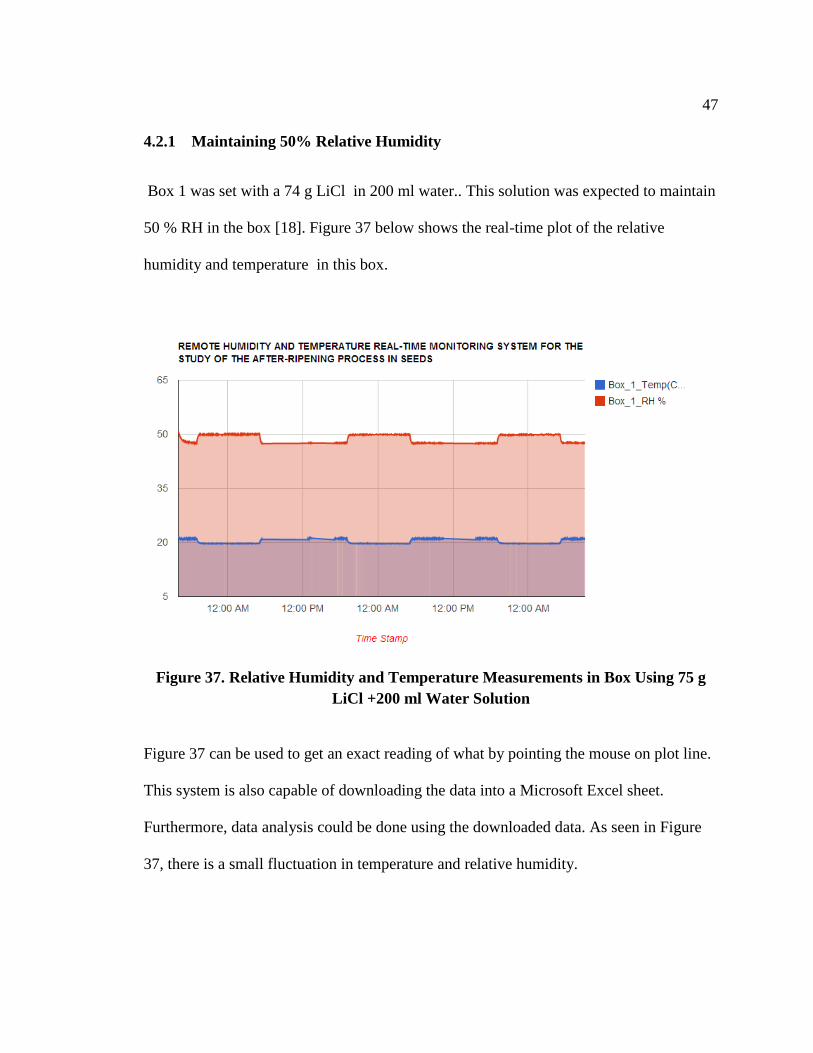
4.2.1 Maintaining 50% Relative Humidity
Box 1 was set with a 74 g LiCl in 200 ml water.. This solution was expected to maintain
50 % RH in the box [18]. Figure 37 below shows the real-time plot of the relative
humidity and temperature in this box.
Figure 37. Relative Humidity and Temperature Measurements in Box Using 75 g
LiCl +200 ml Water Solution
Figure 37 can be used to get an exact reading of what by pointing the mouse on plot line.
This system is also capable of downloading the data into a Microsoft Excel sheet.
Furthermore, data analysis could be done using the downloaded data. As seen in Figure
37, there is a small fluctuation in temperature and relative humidity.

48
Figure 38. Relative Humidity Measurement of the Box Using 75 g LiCl + 200 ml
Water Solution
Figure 38 shows the pattern fluctuation in the relative humidity. Once the LiCl solution
reached equilibrium, the major change in relative humidity occurred during the transition
from dark-period to photoperiod. The average relative humidity during the dark-period
and photoperiod were 47.42% and 50.02%, respectively.
47
47.5
48
48.5
49
49.5
50
50.5
51
3/1
/20
13
0:0
0:0
0
3/1
/20
13
12
:00
:00
3/2
/20
13
0:0
0:0
0
3/2
/20
13
12
:00
:00
3/3
/20
13
0:0
0:0
0
3/3
/20
13
12
:00
:00
3/4
/20
13
0:0
0:0
0
3/4
/20
13
12
:00
:00
3/5
/20
13
0:0
0:0
0
3/5
/20
13
12
:00
:00
RH %
Time Stamp

49
Figure 39. Temperature Measurement of the Box Using 75 g LiCl + 200 ml Water
Solution
Figure 39 shows the fluctuation in temperature with time. The major temperature change
occurred during the transition from dark-period to photoperiod resembling the change
that occurred with relative humidity. The average temperatures during dark-period and
photoperiod were 19.72 °C and 21.23 °C, respectively, with an increase of 1.39
°
C during
the transition.
The major point that can be derived from this is that the sensor placed inside the box is
not affected by light. Fluorescent lights are used in the incubator to implement the
photoperiod. Thermal radiation from fluorescent lights is the main cause for the major
19.25
19.75
20.25
20.75
21.25
21.75
3/1
/20
13
0:0
0:0
0
3/1
/20
13
12
:00
:00
3/2
/20
13
0:0
0:0
0
3/2
/20
13
12
:00
:00
3/3
/20
13
0:0
0:0
0
3/3
/20
13
12
:00
:00
3/4
/20
13
0:0
0:0
0
3/4
/20
13
12
:00
:00
3/5
/20
13
0:0
0:0
0
3/5
/20
13
12
:00
:00
Time stamp
Temperature (°C)

50
fluctuation in the temperature of the seed box. The temperature controlling feedback
system of the incubator is not detecting these changes and adjusting it accordingly. This
same temperature fluctuation is observed not only inside the seed box but also inside the
incubator. Therefore, there is no apparent relationship between the temperature
fluctuation and chemical (LiCl). Since relative humidity is also dependent on the
temperature, the relative humidity fluctuation is attributed to temperature fluctuation.
In this seed box, the temperature is maintained at approximately 19.70 °C and the
relative humidity is maintained at 49.92%. Relative humidity is expected to be at 50%.
Fluctuations are less than 0.5 % and 1.19 °C for relative humidity and temperature,
respectively. These small fluctuations do not have an impact on seed experiment.
4.2.2 Maintaining 70% Relative Humidity
In the second box, a solution of 50 grams of LiCl in 200 ml water was used. This
solution was expected to maintain the relative humidity at 70% for a temperature of 20
°C [12]. Figure 40 shows the real-time plot of the software for temperature and relative
humidity.

51
Figure 40. Temperature and Relative Humidity Measurement of the Box
Using 50 g LiCl + 200 ml Water Solution
By using the downloaded data, further analysis was done. Figure 41 shows the fluctuation
pattern with relative humidity.
In this seed box also, a major change in relative humidity happened during the transition
from the dark-period to the photoperiod. Average relative humidity during dark-period
and photoperiod were 72.64% and 72.21%, respectively.
.

52
Figure 41. Relative Humidity Measurement of the Box with 50 g LiCl + 200 ml
Water Solution
Figure 42. Temperature Measurement of the Box with 50 g LiCl + 200 ml Water
Solution
19.75
19.8
19.85
19.9
19.95
20
20.05
20.1
5/1
0/2
01
3 1
2:0
0:0
0
5/1
1/2
01
3 0
:00
:00
5/1
1/2
01
3 1
2:0
0:0
0
5/1
2/2
01
3 0
:00
:00
5/1
2/2
01
3 1
2:0
0:0
0
5/1
3/2
01
3 0
:00
:00
Temperature (°C )
T
ime
stam
p
71
72
73
74
75
76
77
78
79
80
81
1/0
/19
00
0:0
0:0
0
9/2
6/1
90
2 0
:00
:00
6/2
2/1
90
5 0
:00
:00
3/1
8/1
90
8 0
:00
:00
12
/13
/19
10
0:0
0:0
0
9/8
/19
13
0:0
0:0
0
6/4
/19
16
0:0
0:0
0
RH %
Time stamp

53
Figure 42 above shows the temperature in this box. We can see same fluctuation pattern
in this seed box as in the seed box 1. Average temperature during dark-period and
photoperiod were 19.84 °C and 20.00 °C, respectively. There was an increase of 0.16 °C
during the transition. Overall, the average temperature and the relative humidity in the
box were 19.93 °C and 72.55 %, respectively. However, the average relative humidity
was expected to be 70 % in this box.
4.2.3 Maintaining 35 % Relative Humidity
This box was set with a 100 g LiCl in 200 ml water. This solution was expected to
maintain 35 % RH in the box at 20 °C [12].
Figure 43. Temperature and Relative Humidity Measurement of the Box Using 100
g LiCl + 200 ml Water Solution

54
Figure 43 above shows the real-time plot provided by the system. Figures 44 and 45 show
the relative humidity and temperature pattern in separate graphs.
Figure 44. Relative Humidity Measurement of the Box Using 100 g LiCl + 200 ml
Water Solution
Once the equilibrium was reached the relative humidity in this box was 36.09 %.
However, the relative humidity was expected to be 35 %. Furthermore, in this seed box
also major change in relative humidity occurred during the transition from dark to
photoperiod.
34
35
36
37
38
39
40
5/1
2/2
01
3 2
1:3
6:0
0
5/1
3/2
01
3 0
:00
:00
5/1
3/2
01
3 2
:24
:00
5/1
3/2
01
3 4
:48
:00
5/1
3/2
01
3 7
:12
:00
5/1
3/2
01
3 9
:36
:00
5/1
3/2
01
3 1
2:0
0:0
0
5/1
3/2
01
3 1
4:2
4:0
0
RH %
T
ime
stam
p

55
Figure 45. Temperature of the Box Using 100 g LiCl + 200 ml Water Solution
Figure 45 shows the temperature of the box. After equilibrium average temperature
reached 19.91°C. Similar fluctuations were observed in this box as compared to the
previous boxes.
19
20
21
22
23
24
25
26
27
5/1
2/2
01
3 2
1:3
6:0
0
5/1
3/2
01
3 0
:00
:00
5/1
3/2
01
3 2
:24
:00
5/1
3/2
01
3 4
:48
:00
5/1
3/2
01
3 7
:12
:00
5/1
3/2
01
3 9
:36
:00
5/1
3/2
01
3 1
2:0
0:0
0
5/1
3/2
01
3 1
4:2
4:0
0
Temperature (°C)
T
ime
stam
p

56
4.3 Maintaining 100 % relative humidity
If a closed environment is in contact with pure water, it is expected to maintain 100%
RH. This case was examined in this research by using 200 ml of pure distilled water.
Figure 46. Relative Humidity and Temperature Measurements in the Box Which
Had Distilled Water Only.
Figure 46 shows the graph provided by the system developed in this research. Fluctuation
pattern of relative humidity and temperature are plotted in separate graphs (Figures 47
and 48). These graphs are plotted based on the downloaded data from the system.

57
Figure 47. Relative Temperature of the Box with 200 ml Distilled Water Only
Figure 48. Temperature Measurement of the Box with 200 ml Distilled Water Only
86
88
90
92
94
96
98
100
3/1
/20
13
12
:00
:00
3/2
/20
13
0:0
0:0
0
3/2
/20
13
12
:00
:00
3/3
/20
13
0:0
0:0
0
3/3
/20
13
12
:00
:00
3/4
/20
13
0:0
0:0
0
3/4
/20
13
12
:00
:00
3/5
/20
13
0:0
0:0
0
3/5
/20
13
12
:00
:00
RH %
T
ime
sta
mp
19
19.5
20
20.5
21
21.5
22
22.5
3/1
/20
13
9:3
6:0
0
3/1
/20
13
21
:36
:00
3/2
/20
13
9:3
6:0
0
3/2
/20
13
21
:36
:00
3/3
/20
13
9:3
6:0
0
3/3
/20
13
21
:36
:00
3/4
/20
13
9:3
6:0
0
3/4
/20
13
21
:36
:00
3/5
/20
13
9:3
6:0
0
Temperatue (oC)
T
ime
stam
p
58
After equilibrium, the average humidity reached 97.80 %. The time taken to achieve
equilibrium was higher in this box compared to the other seed boxes. The average
temperature in this box was 20.19 °C. However, the fluctuation pattern was same as in
the other boxes.
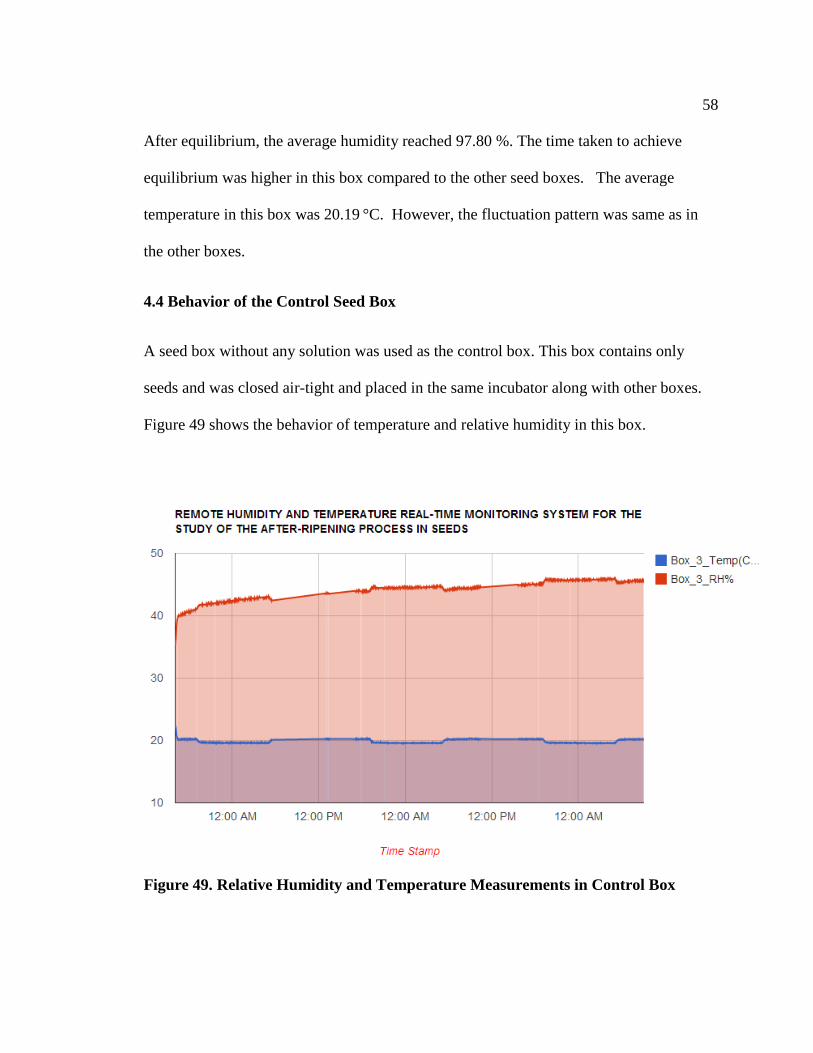
4.4 Behavior of the Control Seed Box
A seed box without any solution was used as the control box. This box contains only
seeds and was closed air-tight and placed in the same incubator along with other boxes.
Figure 49 shows the behavior of temperature and relative humidity in this box.
Figure 49. Relative Humidity and Temperature Measurements in Control Box

59
In this control box also, a major fluctuation was observed during the transition from the
dark period to photoperiod. Arguably, this observation suggests that the major fluctuation
is not due to the presence of any solutions. Average temperature was 21.90 °C. It was
observed that the relative humidity kept on increasing from 34.30% to 47.11 %. This can
be attributed to the evaporation in seeds. However, the fluctuation of less than 1 °C in
seed boxes could be accounted for the orientation of the seeds boxes in the incubator. In
all boxes, major fluctuations occurred during the transition from dark period to photo
period. The observations clearly show that the LiCl controlled the relative humidity as
expected.
4.5 Behavior of the Relative Humidity at a Constant Concentration of LiCl at
Different Temperatures
To study the effect of the temperature on the relative humidity, a constant LiCl
concentration was maintained with 147 g LiCl in 200 mL distilled water with nine grams
of green seeds. Temperature was increased from 10 °C to 50 °C with a 10
°C interval.
Each temperature was maintained for 24 hours.
Figure 50 below shows the real-time plot of this seed box.
60
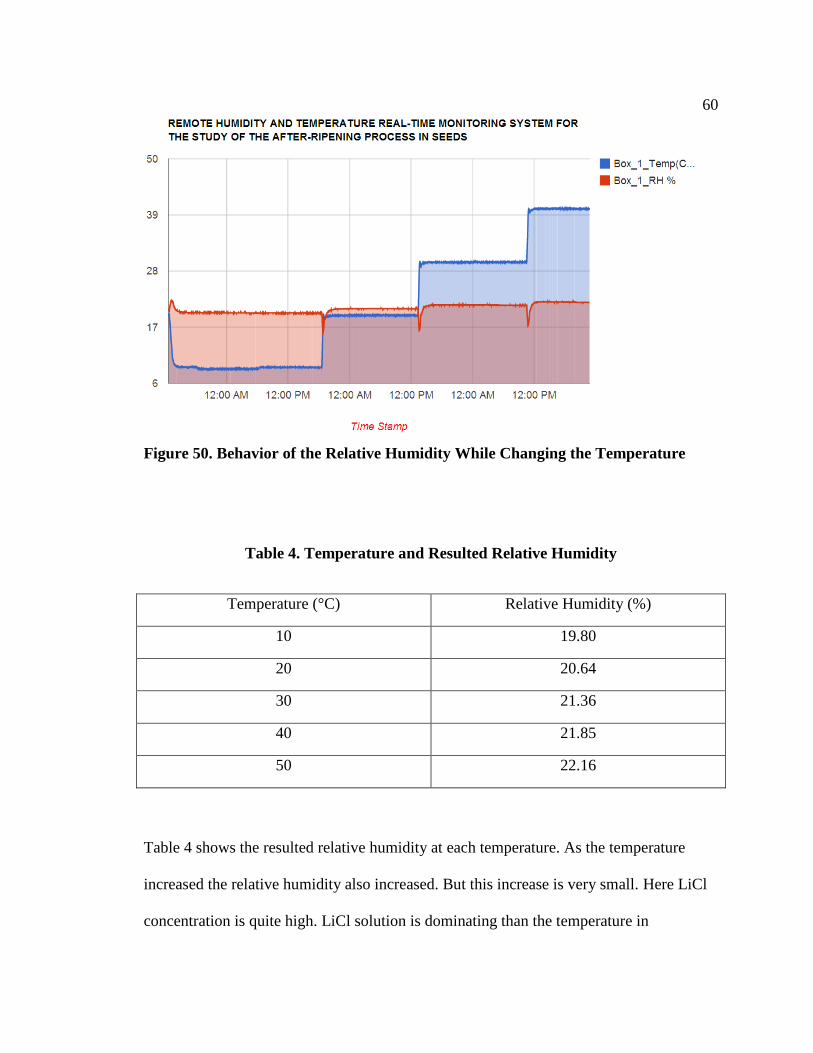
Figure 50. Behavior of the Relative Humidity While Changing the Temperature
Table 4. Temperature and Resulted Relative Humidity
Temperature (°C) Relative Humidity (%)
10 19.80
20 20.64
30 21.36
40 21.85
50 22.16
Table 4 shows the resulted relative humidity at each temperature. As the temperature
increased the relative humidity also increased. But this increase is very small. Here LiCl
concentration is quite high. LiCl solution is dominating than the temperature in

61
maintaining the Relative humidity. During this experiment, an E-mail alert function of
the system was also tested. It was observed that the system sends an e-mail alert
whenever values go beyond the threshold values. For the testing purpose temperature
threshold values 10, 20, 30 and 40 °C are used. For relative humidity 15,30,50 and 70%
is used.

62
CHAPTER 5
SUMMARY AND CONCLUSIONS
It was demonstrated that a relatively inexpensive system can be designed and built for the
purpose of seed research (See the Appendix A for the cost details). This system is very
useful for the real-time measurement and monitoring of the relative humidity and
temperature in a closed environment. It can be used to compare the capabilities of
different chemical solutions, provides an easy and reliable method for monitoring the
study of after-ripening and longevity, and is user-friendly and is easy to setup without
much effort. The user can set up different experiments and check the relative humidity
and temperature of each box remotely in real time, and data can be downloaded into
Microsoft Excel for further data analysis. Since this system uses Google spreadsheet, the
user does not need to buy a server space for implementation.
During the evaluation period, the system adequately monitored the relative humidity and
temperature of the five containers. Moreover, the relative humidity and temperature in the
containers were maintained (with little variations) over the test period. The variation
observed in these two parameters was due to the slight heating/cooling of the incubator to
maintain the desired temperature. Changes in light also cause small fluctuation in
temperature. This is due to thermal radiation from the lighting source (fluorescent light).
This fluctuation in the temperature leads the relative humidity to fluctuate. Thus, this
system also could detect very fine variations in these parameters, which could lead to

63
better understanding of the environments inside containers and incubators and their role
in seed dormancy break and longevity.
64
References:
1. Wilson, J. S. (editor), Sensor Technology Handbook, pp 1, Elsevier (UK). 2005.
2. Dhananjay, G. V., Programming and Customizing AVR Microcontroller, pp 22,
McGraw-Hill (USA). 2001.
3. Kwong, J., Ramadass,Y. K., Verma, N., Chandrakasan, A. P., "A 65 nm sub-Vt
Microcontroller with Integrated SRAM and Switched Capacitor DC-DC Converter,"
IEEE Journal of solid-state circuits, 2009, 44, 115-126.
4. Brennan, T. M., Ernst, J. M., Day, C. M., Bullock, D. M., Krogmeier, J.V.,
Martchouk, M., "Influence of Vertical Sensor Placement on Data Collection
Efficiency from Bluetooth MAC Address Collection," ASCE Journal of
Transportation Engineering, 2009, 136, 1104-1109.
5. Jasemian, Y., Nielsen, L. A., "Design and Implementation of a Telemedicine System
Using Bluetooth Protocol and GSM/GPRS Network, for Real Time Remote Patient
Monitoring," Technology and Health Care, 2005, 13, 199–219.
6. Forlano, L., "WiFi Geographies: When Code Meets Place," The Information Society,
2009, 25, 344–352.
7. Bryant, J. A , Seed Physiology , pp 3-5, 44-45, The Institute of Biology’s Studies in
Biology, 165, 1985.
8. Bewley, J. D., Black, M., Physiology and Biochemistry of Seeds, Springer- Verlag,
Berlin Heidelberg New York press, pages 60-65
9. Taylorson, R.B., Recent Advances in the Development and Germination of Seeds,
United States Department of Agriculture, Beltsville, Plenum press, New York, 1989.
10. Poinapen. D, Brown. D, Beeharry. D., "Seed Orientation and Magnetic Field Strength
have More Influence on Tomato Seed Performance than Relative Humidity and
duration of Exposure to Non-uniform Static Magnetic Field," Journal of Plant
physiology, 170, 2013.
11. Raymond. A., Young, J.," Germination and Establishment of Salsola in Relation to
Seedbed Environment. II. Seed Distribution, Germination, and Seedling Growth of
Salsola and Micro-environmental Monitoring of the Seedbed," USDA, 1971
12. Bhattacharjee. S., "Heat and Chilling Induced Disruption of Redox Homeostasis and
its Regulation by Hydrogen Peroxide in Germinating Rice Seeds (Oryza sativa L.,

65
Cultivar Ratna). Physiology and Molecular Biology of Plants," 19, 2013, 199-207.
13. Turner, S. R., Merritt, D. J., Renton, M. S., Dixon, K. W., "Seed Moisture Content
affects After-Ripening and Smoke Responsiveness in Three Sympatric Australian
native species rom fire-prone environments," Austral Ecology , 2009, 23, 866-877.
14. Tuckett, R. E., Merritt, D.J., Hay, F. R., Hopper, S.D., Dixon, K.W., "Comparative
Longevity and Low-Temperature Storage of Seeds of Hydatellaceae and Temporary
Pool Species of South-West Australia," Australian Journal of Botany, 2010, 58, 327-
334.
15. Baskin, C. C., Baskin, J. M., Seeds: Ecology, Biogeography, and Evolution of
Dormancy and Germination. Academic Press (USA), 1998..
16. Bazin, J., Langlade, N., Vincourt, P., Arribat, S., Balzergue, S., El-Maarouf-Bouteau,
H., Bailly, C., "Targeted mRNA Oxidation Regulate Sunflower Seed Dormancy
Alleviation During Dry After Ripening," The Plant Cell, 2011, 23, 2196-2208.
17. Sweetman, H. L., "Studies of Chemical Control of Relative Humidity in Closed
Spaces," Ecology, 1933, 14, 40-45.
18. Gold, K., Hay, F., Equilibrating Seeds to Specific Moisture Levels. Technical
Information Sheet 9, Millennium Seed Bank Project, Kew, UK.
19. Shin, D. I., Shin, K. H., Kim, I. K., Park, K. S., Lee, T. S., Kim, S. I., Lim, K. S.,
Huh, S. J., "Low-Power Hybrid Wireless Network for Monitoring Infant Incubators,"
Medical Engineering & Physics, 2005, 27, 713-716.
20. Sung, W. T., Tsai, M. H., "Multi-Sensor Wireless Signal Aggregation for
Environmental Monitoring System via Multi-Bit Data Fusion," Applied Mathematics
& Information Sciences, 2011, 5, 589–603.
21. Temperature@lert, " Cellular Edition - Cellular Temperature Monitoring Systems,"
(2011) Retrieved from: http://www.temperaturealert.com/Wireless-Temperature-
Store/ZPointCellular.aspx
22. TempTrak, " 900 MHz Temperature / Humidity Transmitter," (2013) Retrieved from:
http://www.cooper- atkins.com/Products/TempTrak/900_MHz_Temperature
_Humidity_Transmitter_10071/
23. OMEGA, " Egg Temperature and Humidity Data Loggers," (2013) Retrieved from:
http://www.omega.com/pptst/OM-CP-EGGTEMP.html

66
24. SO-LOW, "Laboratory Incubators," (2011) Retrieved from: http://www.so-
low.com/lab-incubator?gclid=CLyGnKay0bkCFXRp7AodIgIAlw
25. Arduino , " Arduino Uno," (2013) Retrieved from: http://arduino.cc/en/Main/
Arduino BoardUno
26. Arduino, " Arduino WiFi Shield," (2013) Retrieved from:
http://arduino.cc/en/Main/Arduino WiFiShield
27. Sensirion, "Humidity and Temperature Sensor IC," (2011) Retrieved from:
http://www.sensirion.com/fileadmin/user_upload/customers/sensirion/
Dokumente/Humidity/Sensirion_Humidity_SHT7x_Datasheet_V5.pdf
28. Wikipedia , "Mung Bean," (2013) Retrieved from:
http://en.wikipedia.org/wiki/Mung_bean

67
Appendix A: Materials used
Components Numbers
of pieces
Price of
each($) Total($) Source
Seed box
Product code:
PC 2828 13 T
5 92.50 462.50 http://www.fibox.com/
USB coupler 5 5.00 25.00 http://www.usbfirewire.com/
USB cable male to
male 5 4.00 20.00 http://www.usbfirewire.com/
Sensor (SHT 75) 5 41.00 41.00 http://www.sensirion.com
Ardunio UNO 1 16.50 16.50 http://www.arduino.cc/
Wi-Fi Shield 1 85.00 85.00 http://www.arduino.cc/
Resistors, wires, etc 20.00 20.00 http://www.radioshack.com
Total cost 670.00